Abstract
By integrating energy-efficient AIoT-based biosensor networks, healthcare systems can now predict COVID-19 outbreaks with unprecedented accuracy and speed, revolutionizing early detection and intervention strategies. Therefore, this paper explores the rapid growth of electronic technology in today’s environment, driven by the proliferation of advanced devices capable of monitoring and controlling various healthcare systems. However, these devices’ limited resources necessitate optimizing their utilization. To tackle this concern, we propose an enhanced Artificial Intelligence of Things (AIoT) system that utilizes the networking capabilities of IoT biosensors to forecast potential COVID-19 outbreaks. The system aims to efficiently collect data from deployed sensor nodes, enabling accurate predictions of possible disease outbreaks. By collecting and pre-processing diverse parameters from IoT nodes, such as body temperature (measured non-invasively using the open-source thermal camera TermoDeep), population density, age (captured via smartwatches), and blood glucose (collected via the CGM system), we enable the AI system to make accurate predictions. The model’s efficacy was evaluated through performance metrics like the confusion matrix, F1 score, precision, and recall, demonstrating the optimal potential of the IoT-based wireless sensor network for predicting COVID-19 outbreaks in healthcare systems.
1. Introduction
The rapid advancement of electronic devices has catalyzed a technological revolution, profoundly impacting sectors such as healthcare. This revolution, driven by innovative solutions, enables real-time monitoring and efficient patient management, leading to a paradigm shift in healthcare delivery [1]. AIoT-based systems, incorporating everything from web portals to predictive analytics, are set to transform the healthcare infrastructure by enhancing diagnosis, data analysis, treatment processes, patient monitoring, and customer service. As a result, digital healthcare is emerging as the linchpin for future medical advancements, offering unprecedented improvements in patient care and setting new standards for healthcare efficiency and effectiveness [2].
The remarkable progress in microelectromechanical systems (MEMSs) and wireless communication technologies has propelled the rapid expansion of IoT-enabled wireless sensor networks, making them one of the most swiftly growing sectors globally. These networks comprise numerous small battery-powered sensor devices that possess the capability to communicate with each other seamlessly. They have three primary functions: (1) sensing data from the external environment, (2) processing the sensed data, and (3) transmitting data through radio frequency (RF). The IoT-enabled wireless sensor networks have sensors that can provide expert solutions in situations where human involvement is complex, such as military surveillance, structure health monitoring, natural disaster prediction, and traffic management. The sensor devices gather data from their environments, process it computationally, and then transmit it to the base station (BS) for additional processing after being embedded in IoT-enabled wireless sensor networks [3]. Because of their small size, sensor devices have limited power backup, storage capacities, and computing capabilities. Once deployed in the network field, these sensor devices are left unattended, leading to the main challenge of ensuring that each sensor device’s energy is used as efficiently as possible.
Hence, the advancement of energy-efficient protocols may facilitate optimal energy utilization in each sensor node, assuring the network’s sustained viability in the long run. Organizing various sensing devices into compact clusters is essential in developing efficient protocols, and clustering plays a pivotal part in this process. Clustered networks divide WSNs into smaller groups, with a designated CH at the center of each. Within each group, there are a set number of sensor devices that provide data to the CH, which, in turn, sends them to the BS. Creating clustering-based energy-efficient protocols involves many essential issues, including effective CH selection, determining the ideal number of clusters, cluster management, and data routing to the BS [4]. However, effectively addressing these clustering issues is just a fraction of the overall challenge. It is essential to proficiently manage quality of service (QoS) and strike a harmonious equilibrium between competing demands, such as longevity, coverage, and throughput. There has recently been a significant surge in interest in bioinspired or metaheuristic techniques and expert systems due to their capacity to effectively address the issues as mentioned above [5,6].
2. Research Significance
In recent years, researchers have devised a range of energy-efficient protocols tailored to homogeneous or heterogeneous networks, depending on the specific application. According to prevailing wisdom, homogeneous networks consist of sensor devices with equivalent energy resources at the network’s inception. Conversely, heterogeneous networks are characterized by the presence of sensor devices that possess varying levels of energy resources. The homogeneous model is a distinct category within the wireless sensor network (WSN) realm. Every sensor device initially has identical energy resources, but over time, as the network functions, it gradually transforms into a heterogeneous model. Each SN cannot use the same energy supply due to variations in its radio communication characteristics. The observed variations might be attributed to stochastic occurrences or the geometric aspects of the network environment. Importantly, creating an energy-efficient protocol that can work in homogeneous and heterogeneous networks is a significant issue [7,8,9]. This study proposes a method that considers both homogeneous and heterogeneous network models.
3. Literature Review
This section reviews the various existing methods. The clustering method has been proven to be a significant factor in designing energy-efficient protocols in IoT-enabled wireless sensor networks (WSNs). Many clustering-based protocols have been developed in the last two decades, such as LEACH [10], LEACH-C [11], LEACH-M [12], HEED [13], and others. LEACH is recognized as a significant and prevalent self-organizing clustering method, widely employed as a standard and influential precursor for numerous protocols within wireless sensor networks. However, LEACH-C, a centralized variant, confronts obstacles associated with scalability due to its centralized approach [14].
On the other hand, the original LEACH algorithm is outperformed by LEACH-M, a variation that uses multiple hops. Furthermore, HEED, a well-known hybrid, distributed, and iteration-based clustering protocol, leverages a combination of residual energy and intracluster communication cost to select cluster heads (CHs). Nevertheless, HEED faces challenges in creating many clusters and variance in the number of CHs during each round, stemming from random selection [13,15].
Innovative approaches are being explored to enhance clustering protocols in sensor networks. Huang and Wu address the challenge of sensor devices being overlooked by cluster heads in the HEED algorithm by proposing a re-election process. This strategy targets uncovered devices, reducing the occurrence of excessive cluster heads and thereby improving overall efficiency. Additionally, MiCRA introduces a two-level hierarchy for selecting cluster head candidates. Candidates elected at the first level are considered for the second level, promoting a more balanced distribution of energy among sensor devices. This hierarchical approach optimizes cluster formation, leading to enhanced network performance [16]. Other research contributions, such as the distributed clustering strategy proposed by Sabet and Naji, employ multi-hop routing algorithms to reduce the energy consumption caused by control packets while maintaining high performance levels. Du et al. present the EESSC protocol, leveraging the residual energy parameter for clustering methods and updating sensor devices’ residual energy during data transmission, further enhancing energy awareness [17]. Furthermore, Gupta and Sharma suggest the ICHB method for the CH selection procedure, utilizing the Bacterial Foraging Optimization Algorithm to identify nodes with more incredible residual energy in the network. Remarkably, ICHB-HEED, combining the ICHB algorithm with the HEED platform, surpasses the HEED protocol by selecting CHs with higher residual energy, achieving an optimal and stable CH count per round, and extending the network lifetime [18].
Researchers have investigated the possibility of employing fuzzy logic systems (FLSs) to provide effective results in cases when there is a lack of data. FLS, a rule-based expert system, excels in generating advanced results even with limited information, making it particularly adept at real-time decision-making [19].The text reviews different clustering techniques for wireless sensor networks that use fuzzy logic systems (FLSs) to deal with various factors, such as battery level, node concentration, distance, and energy level. Some examples are [20] the method that uses FLSs based on three factors, [21] the method that reduces the overhead of CH selection in LEACH using FLS based on two factors, [22] the method that uses FLSs and an improved ant colony optimization (ACO) for uneven clustering and intercluster routing, [23] the method that uses type-2 FLSs and better ACO for the same purpose, and [24] the one that uses FLSs for creating unequal-sized clusters to balance the load. Many researchers discussed [4,25,26,27,28,29] the CH election process based on residual energy, distance, and node density and how it affects cluster formation and load balancing. One is EE-LEACH [9,30,31], which uses rank-based FLSs for CH election and cluster formation but does not consider other parameters such as average energy and the number of neighbors. Several scholarly papers [26,28,32] have focused on the Internet of Things (IoT) environment to prolong the longevity of heterogeneous networks, with a particular emphasis on the healthcare domain. Alshamrani’s seminal work [6] deserves mention for its comprehensive classification of various components within the Internet of Medical Things (IoMT) systems, specifically tailored to the healthcare context. Moreover, Saba et al.’s research presents a notable contribution, introducing a secure and energy-efficient framework for IoMT-based e-healthcare systems. Similarly, Xu’s work demonstrates a favorable trend using silicon electro-optic micro-modulators manufactured in typical CMOS technology [33]. There is a major downside to this architecture, though, and that is the considerable network overhead. All of these scholarly efforts add up to better healthcare service delivery, optimized network performance, and advanced Internet of Things (IoT) applications.
Despite considerable progress in clustering for IoT-enabled wireless sensor networks (WSNs), several limitations persist. Notably, the LEACH-C algorithm encounters scalability issues due to its centralized approach. To accommodate AIoT networks’ increasing size and complexity, it is imperative to delve into research that explores and proposes solutions to mitigate these scalability concerns.
The HEED algorithm, while effective in many scenarios, grapples with challenges stemming from its reliance on random selection, which leads to inconsistencies in the number and stability of clusters and cluster heads (CHs) across different rounds. A promising avenue for enhancing the robustness and balance of clustering in IoT-enabled wireless sensor networks (WSNs) lies in multi-objective optimization [34]. This approach considers multiple, often conflicting objectives, such as maximizing energy efficiency while ensuring comprehensive network coverage. By integrating multi-objective optimization techniques, researchers can develop more sophisticated clustering methods that deliver improved performance in terms of both energy consumption and network reliability. Consequently, this could lead to more consistent and sustainable clustering outcomes, addressing the current limitations of algorithms like HEED.
In the realm of clustering techniques for IoT environments, there exists a notable gap between theoretical proposals and real-world applications. Practical validation within authentic AIoT settings would offer crucial insights into the feasibility and efficacy of these methods, considering the array of constraints and challenges they encounter. As energy harvesting technologies advance, there emerges an opportunity to integrate energy-aware clustering algorithms, capable of adjusting their behavior in response to available energy sources. This integration stands to significantly enhance network energy efficiency and extend the lifespan of IoT-enabled wireless sensor networks (WSNs). Additionally, addressing the dynamic and unpredictable nature of heterogeneous environments necessitates research into clustering techniques that can adapt to fluctuating factors like node density, temperature, and terrain. Such endeavors aim to design more resilient and efficient IoT-enabled WSNs, capable of thriving in challenging scenarios. The current study addresses these challenges by introducing an optimized artificial intelligence (AI) system that leverages IoT biosensor networking to enable efficient data collection from deployed sensor nodes, facilitating the prediction of potential COVID-19 outbreaks. Furthermore, the proposed system holds the potential for broader applicability in similar prediction scenarios through appropriate parameter adjustments.
4. Methodology
Developing scalable neural network architectures capable of processing the diverse, noisy, and dynamic data inherent in AIoT systems is imperative. A promising approach involves using artificial neural networks with multiple hidden layers for function approximation and pattern recognition. TermoDeep, an open-source thermal camera, exemplifies such an application by providing real-time body temperature measurement and access control for various facilities. It accurately measures temperatures ranging from 30 °C to 45 °C without contact, ensuring reliable monitoring, especially crucial during the COVID-19 pandemic. Similarly, Continuous Glucose Monitoring (CGM) systems, which track blood glucose levels using a sensor placed under the skin, highlight the importance of adherence to medical standards like [34] for device quality and safety. These systems transmit data to monitors or smartphones, providing real-time glucose readings essential for managing diabetes. Both TermoDeep and CGM systems underscore the vital role of advanced neural networks in enhancing the accuracy and reliability of health-monitoring technologies.
Real-time location and population density tracking through smartwatches is a concept that involves using wearable devices that can measure and transmit the geographic coordinates and movements of the users, as well as other data such as heart rate, temperature, or activity level. By aggregating and analyzing the data from multiple smartwatch users, it is possible to estimate the population density and distribution in a given area and time and monitor the population’s health and behavior. Smartwatches’ recording of locations in real time require that user privacy and data security be protected by complying with data protection laws such as GDPR and HIPAA. By aggregating and analyzing this data on a large scale, researchers can detect patterns suggestive of outbreaks, allowing for timely interventions. Furthermore, the spatial and temporal data from smartwatches can provide valuable insights into disease transmission dynamics, aiding in the development of targeted containment strategies. Integrating smartwatch data with other sources, such as social media or healthcare records, enhances the accuracy of predictive models, enabling proactive measures to mitigate outbreaks before they escalate. Overall, utilizing smartwatch data for outbreak prediction holds immense potential in revolutionizing public health surveillance and response efforts.
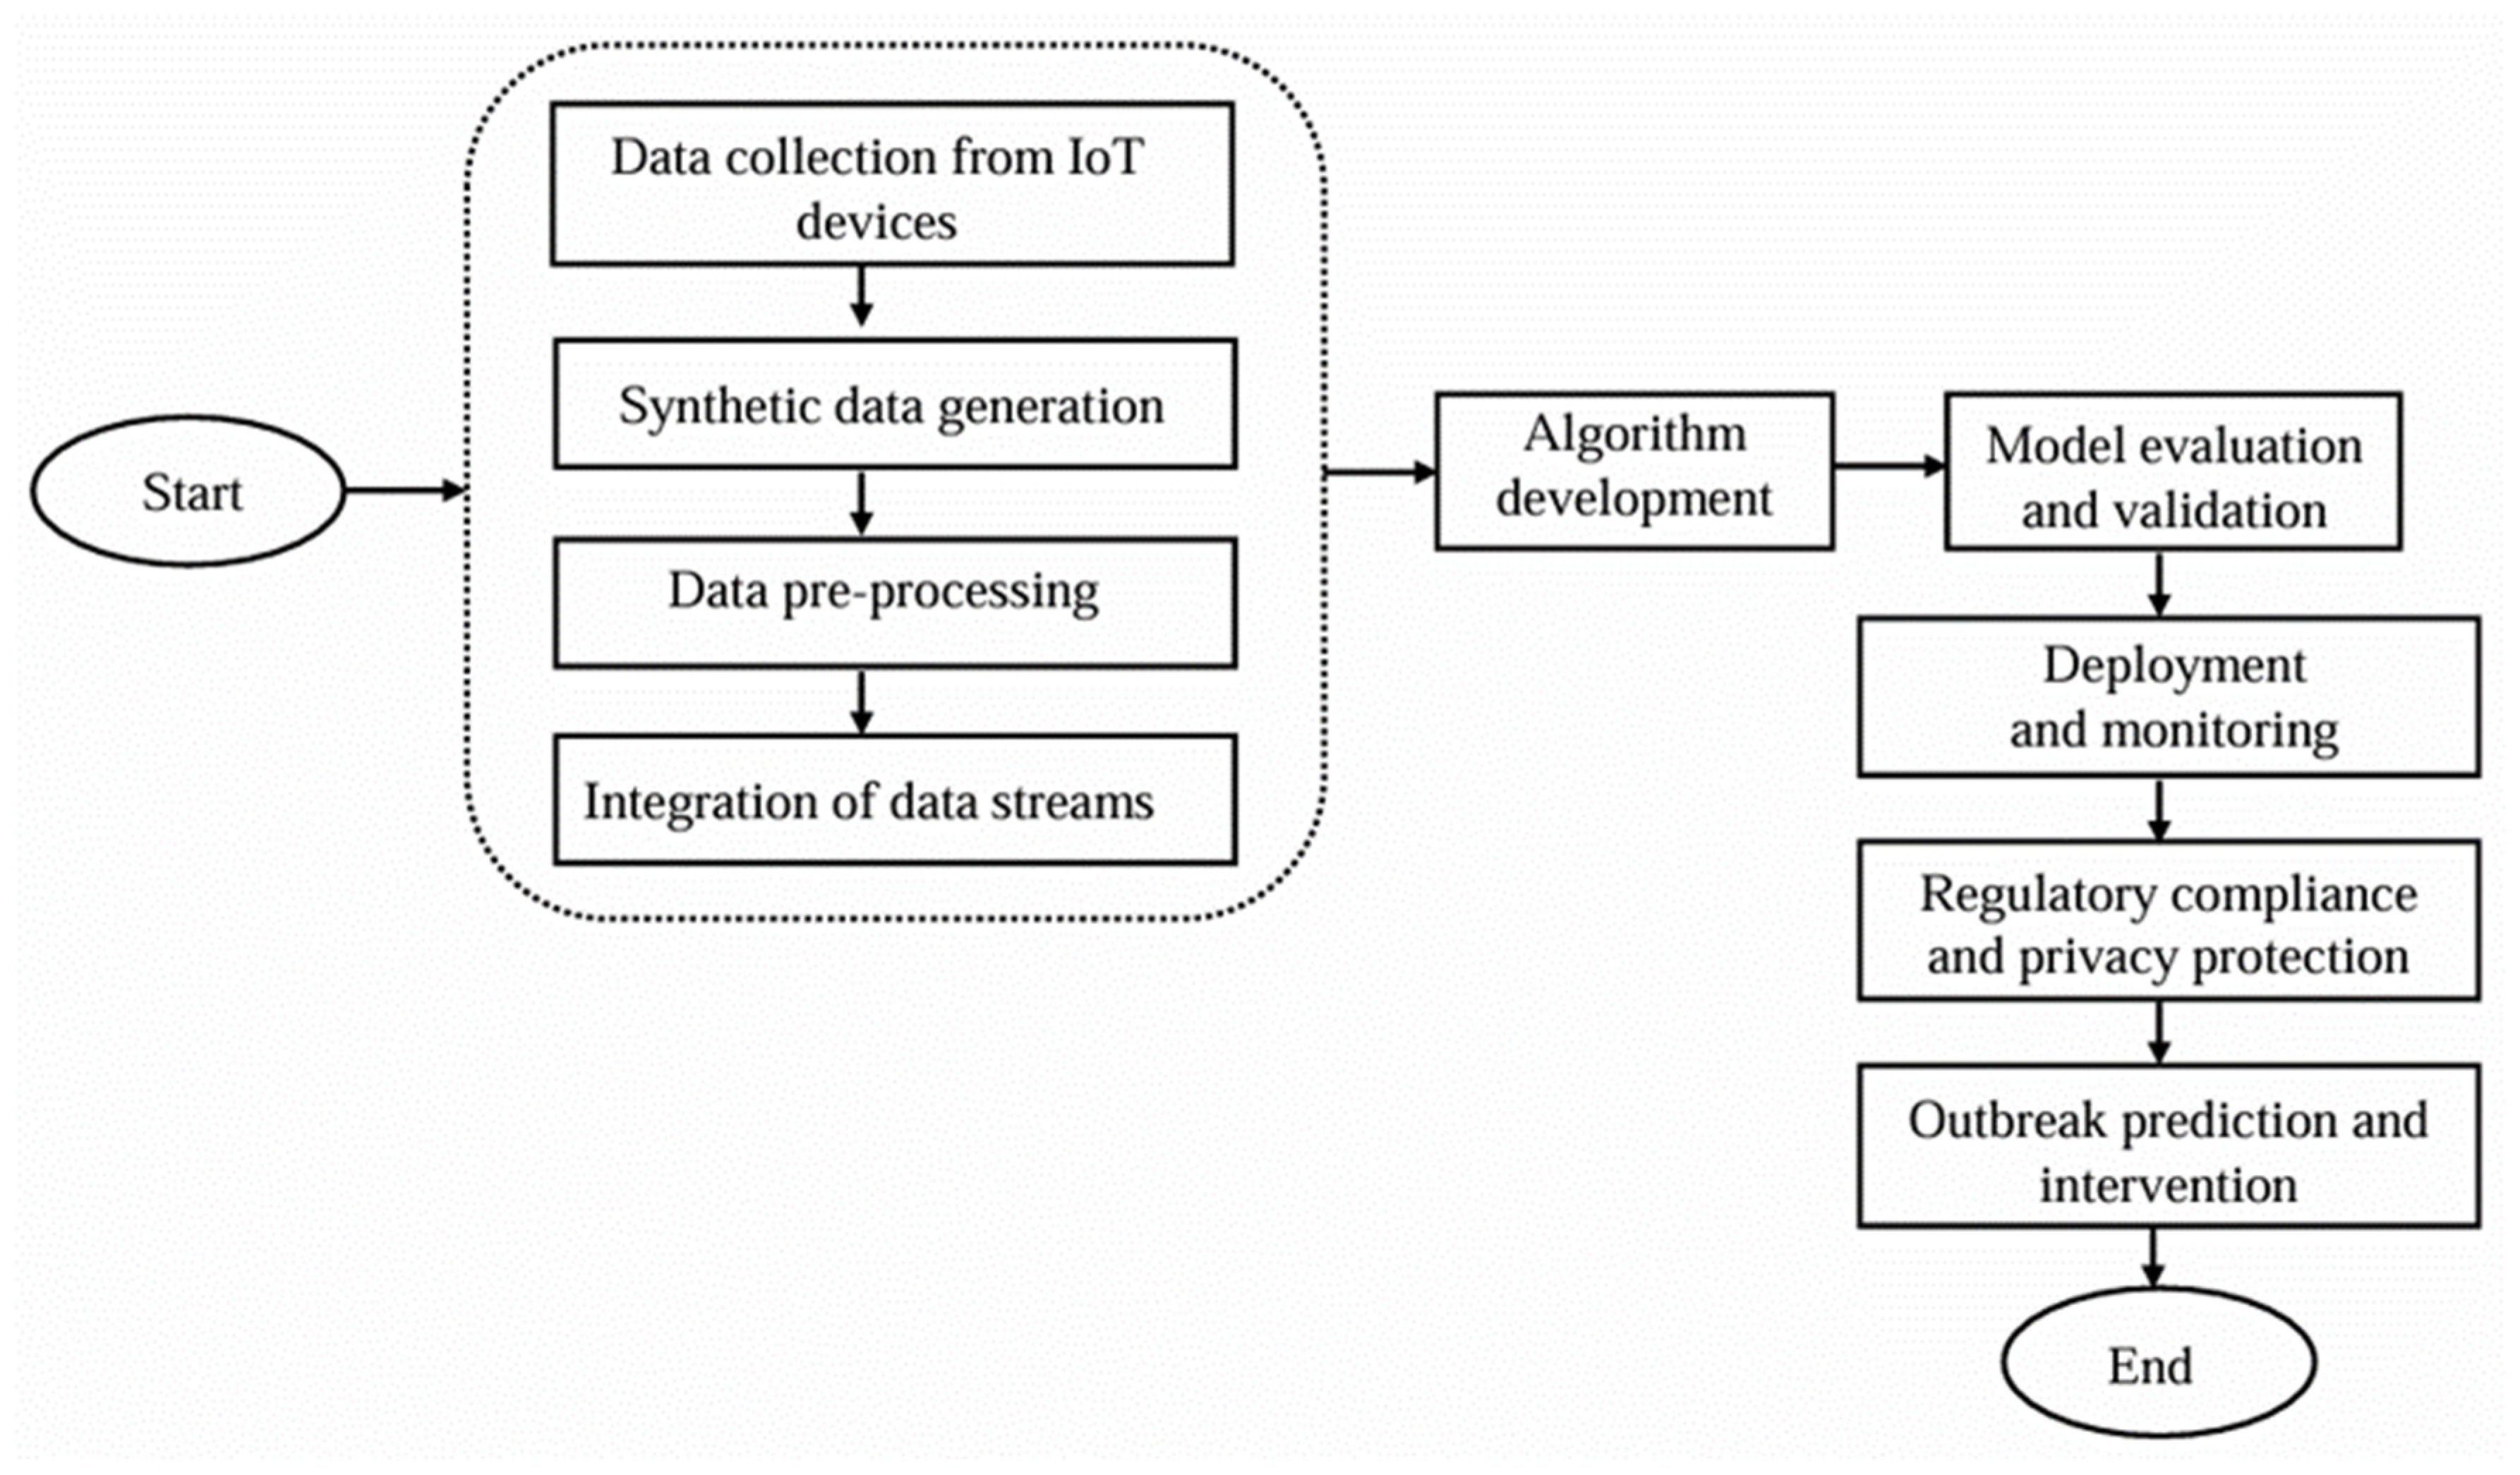
In aligning with medical and scientific standards to ensure the accuracy and reliability of COVID-19 detection, our approach leverages the integration of IoT (Internet of Things) data sources. IoT devices, which have become critical in healthcare for real-time data collection, provide extensive and diverse data pertinent to disease detection. Our study employed synthetic data to train and refine detection algorithms, ensuring they can effectively mimic real-world scenarios and account for various conditions. After collecting data from multiple IoT devices, this information was fed into our proposed system for COVID-19 detection. This system’s design and functionality are further elaborated in the following sections, with an overview provided in Figure 1. By incorporating synthetic data and real-time IoT inputs, we aimed to enhance the precision and responsiveness of COVID-19 detection algorithms, thereby contributing to more effective disease monitoring and control efforts.

Figure 1.
Operational procedures of the suggested method.
4.1. Data Cleaning
Incorrect, corrupted, badly formatted, duplicate, or incomplete data inside a dataset were fixed or removed by data cleaning. Mainly, there are four steps.
4.1.1. Remove Duplicate or Irrelevant Observations
The paramount undertaking involves the discerning curation of our dataset, encompassing the expeditious eradication of redundant observations and extraneous data points. The propensity for duplicate observations predominantly materializes during the intricate data collection phase. When amalgamating disparate datasets from diverse sources, conducting web scraping operations, or acquiring data from clients and multifarious departments, inadvertent duplicity may arise, engendering the potential for excessive data replication. The concept of de-duplication is of notable significance, as it assumes a preeminent position among the key areas that warrant profound deliberation throughout the entire data processing endeavor. Ascertaining the meticulous removal of duplicate observations constitutes an indispensable facet in ensuring data integrity, mitigating the harmful impact of duplicate instances, and upholding the integrity of subsequent analyses and interpretations. Hence, due consideration of de-duplication procedures holds salience as a fundamental tenet in optimizing the dataset’s quality and fortifying the overall data analysis process.
4.1.2. Fix Structural Errors
Structural errors encompass instances where data measurement or transfer is accompanied by the identification of peculiar naming conventions, typographical errors, or erroneous capitalization. These inconsistencies may precipitate mislabeling of data categories or classes, thus jeopardizing the integrity and coherence of the dataset. A pertinent illustration pertains to the coexistence of both "N/A" and "Not Applicable" entries, which, despite being distinct expressions, should be regarded as the same definite entity in the course of analysis. Detecting and rectifying structural errors are crucial in pursuing data accuracy and mitigating potential misinterpretations during subsequent analytical procedures. Figure 2 shows the process of fixing structural errors.

Figure 2.
Comprehensive guide to identifying, analyzing, and correcting structural errors.
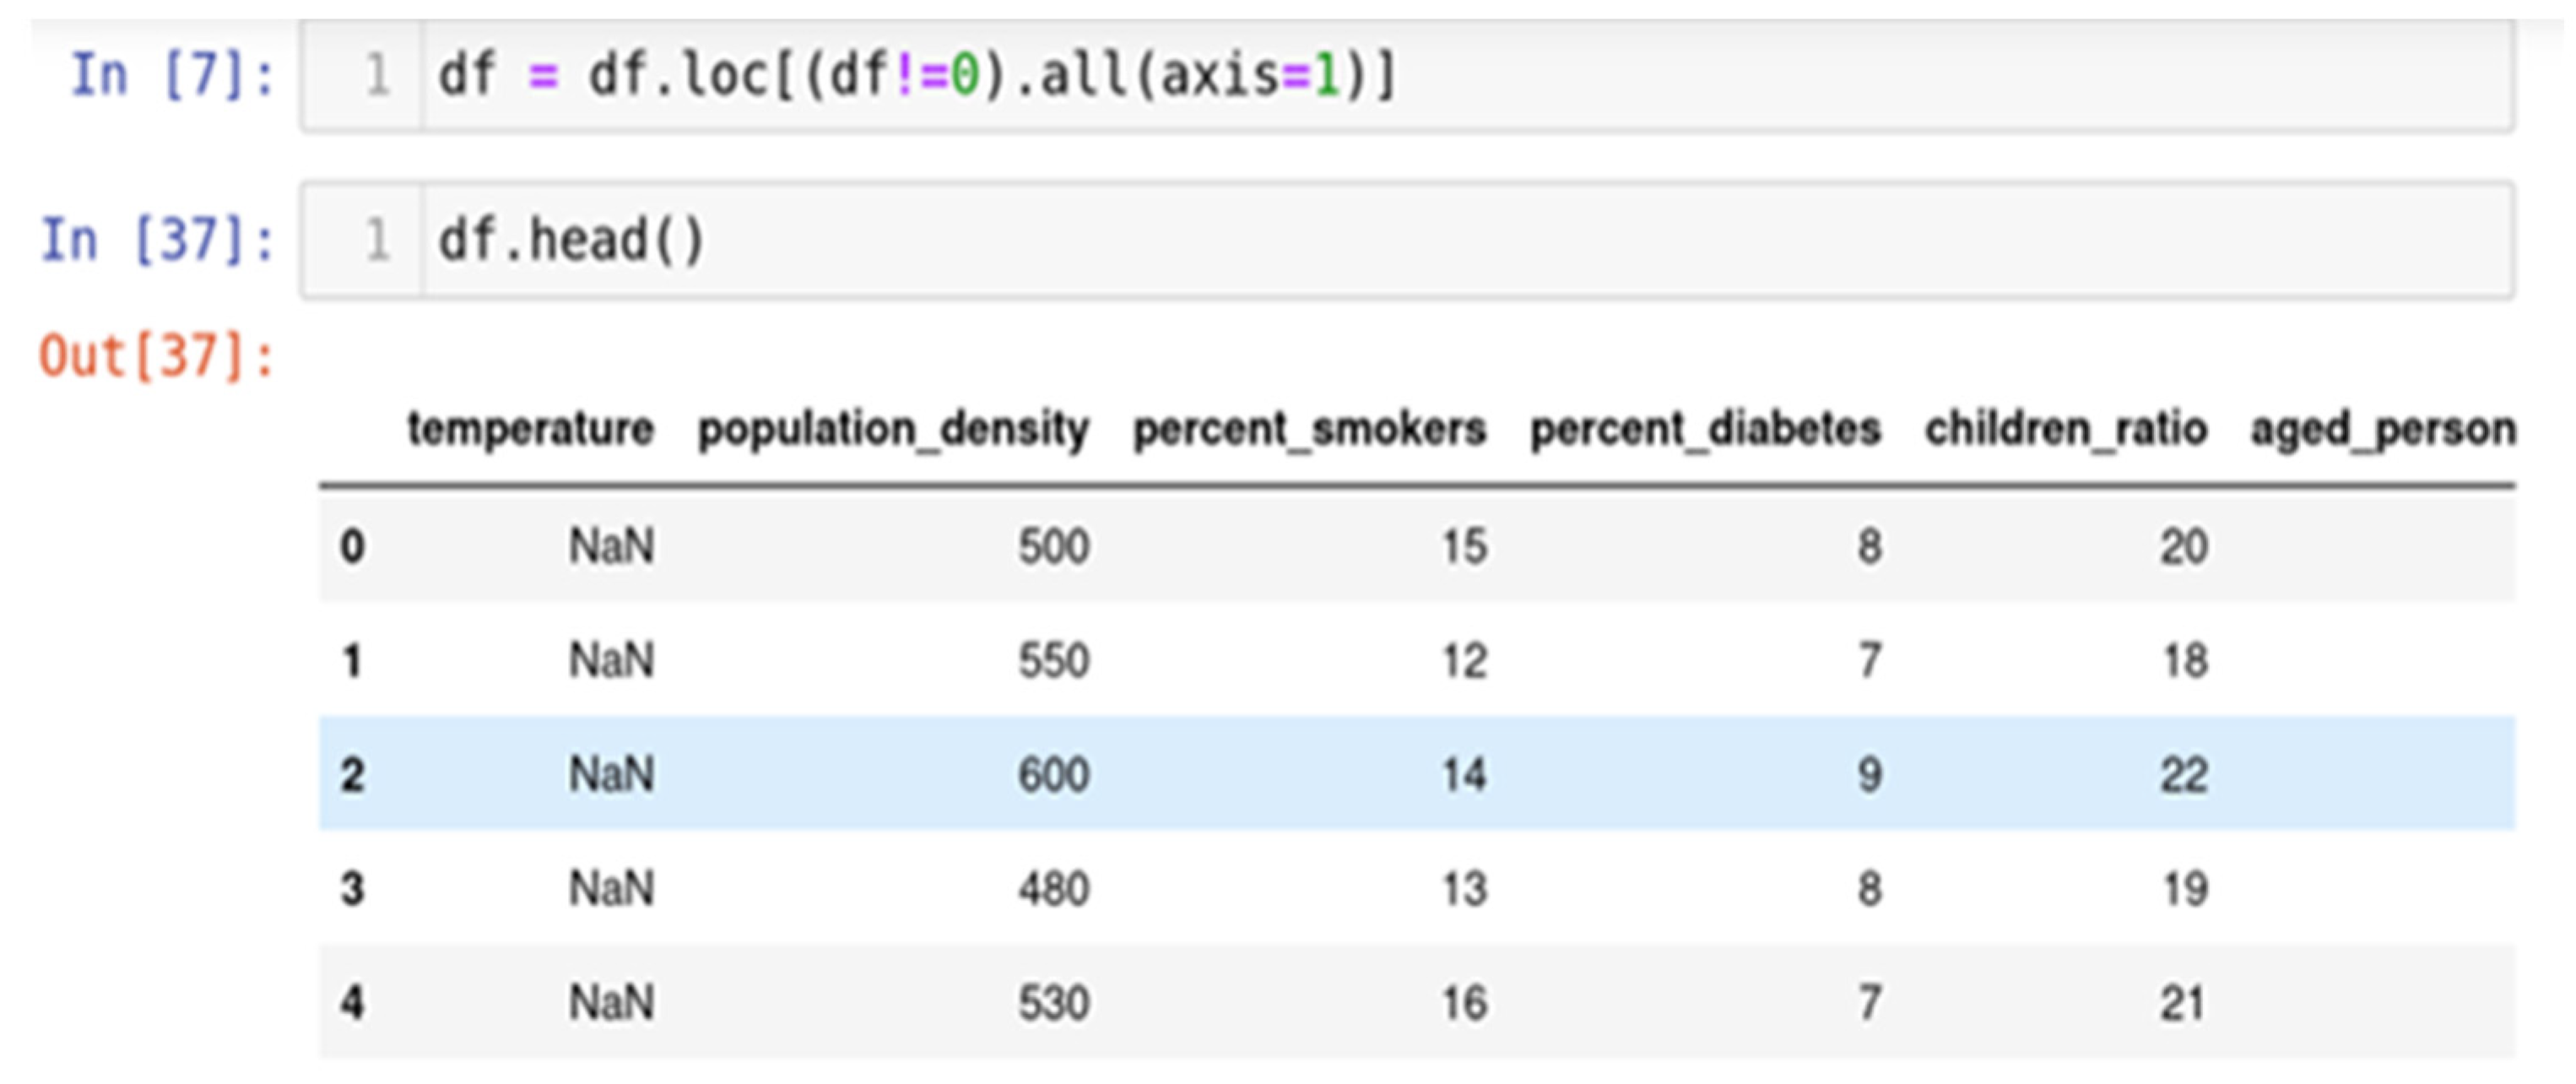
4.1.3. Handle Missing Data
The approach frequently employed to address the issue of null values involves a method known for its efficacy, as shown in Figure 3. It is prudent to exercise this method solely when the dataset comprises adequate samples. Removing data bearing null values may result in the unfortunate loss of vital information, thereby compromising the anticipated accuracy of output predictions. The "df.dropna()" function is employed to execute this method, allowing for the expeditious elimination of entire rows or columns containing null values, as per the data analyst’s discretion.
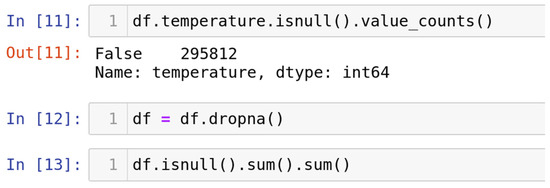
Figure 3.
Step-by-step process for removing null values from datasets.
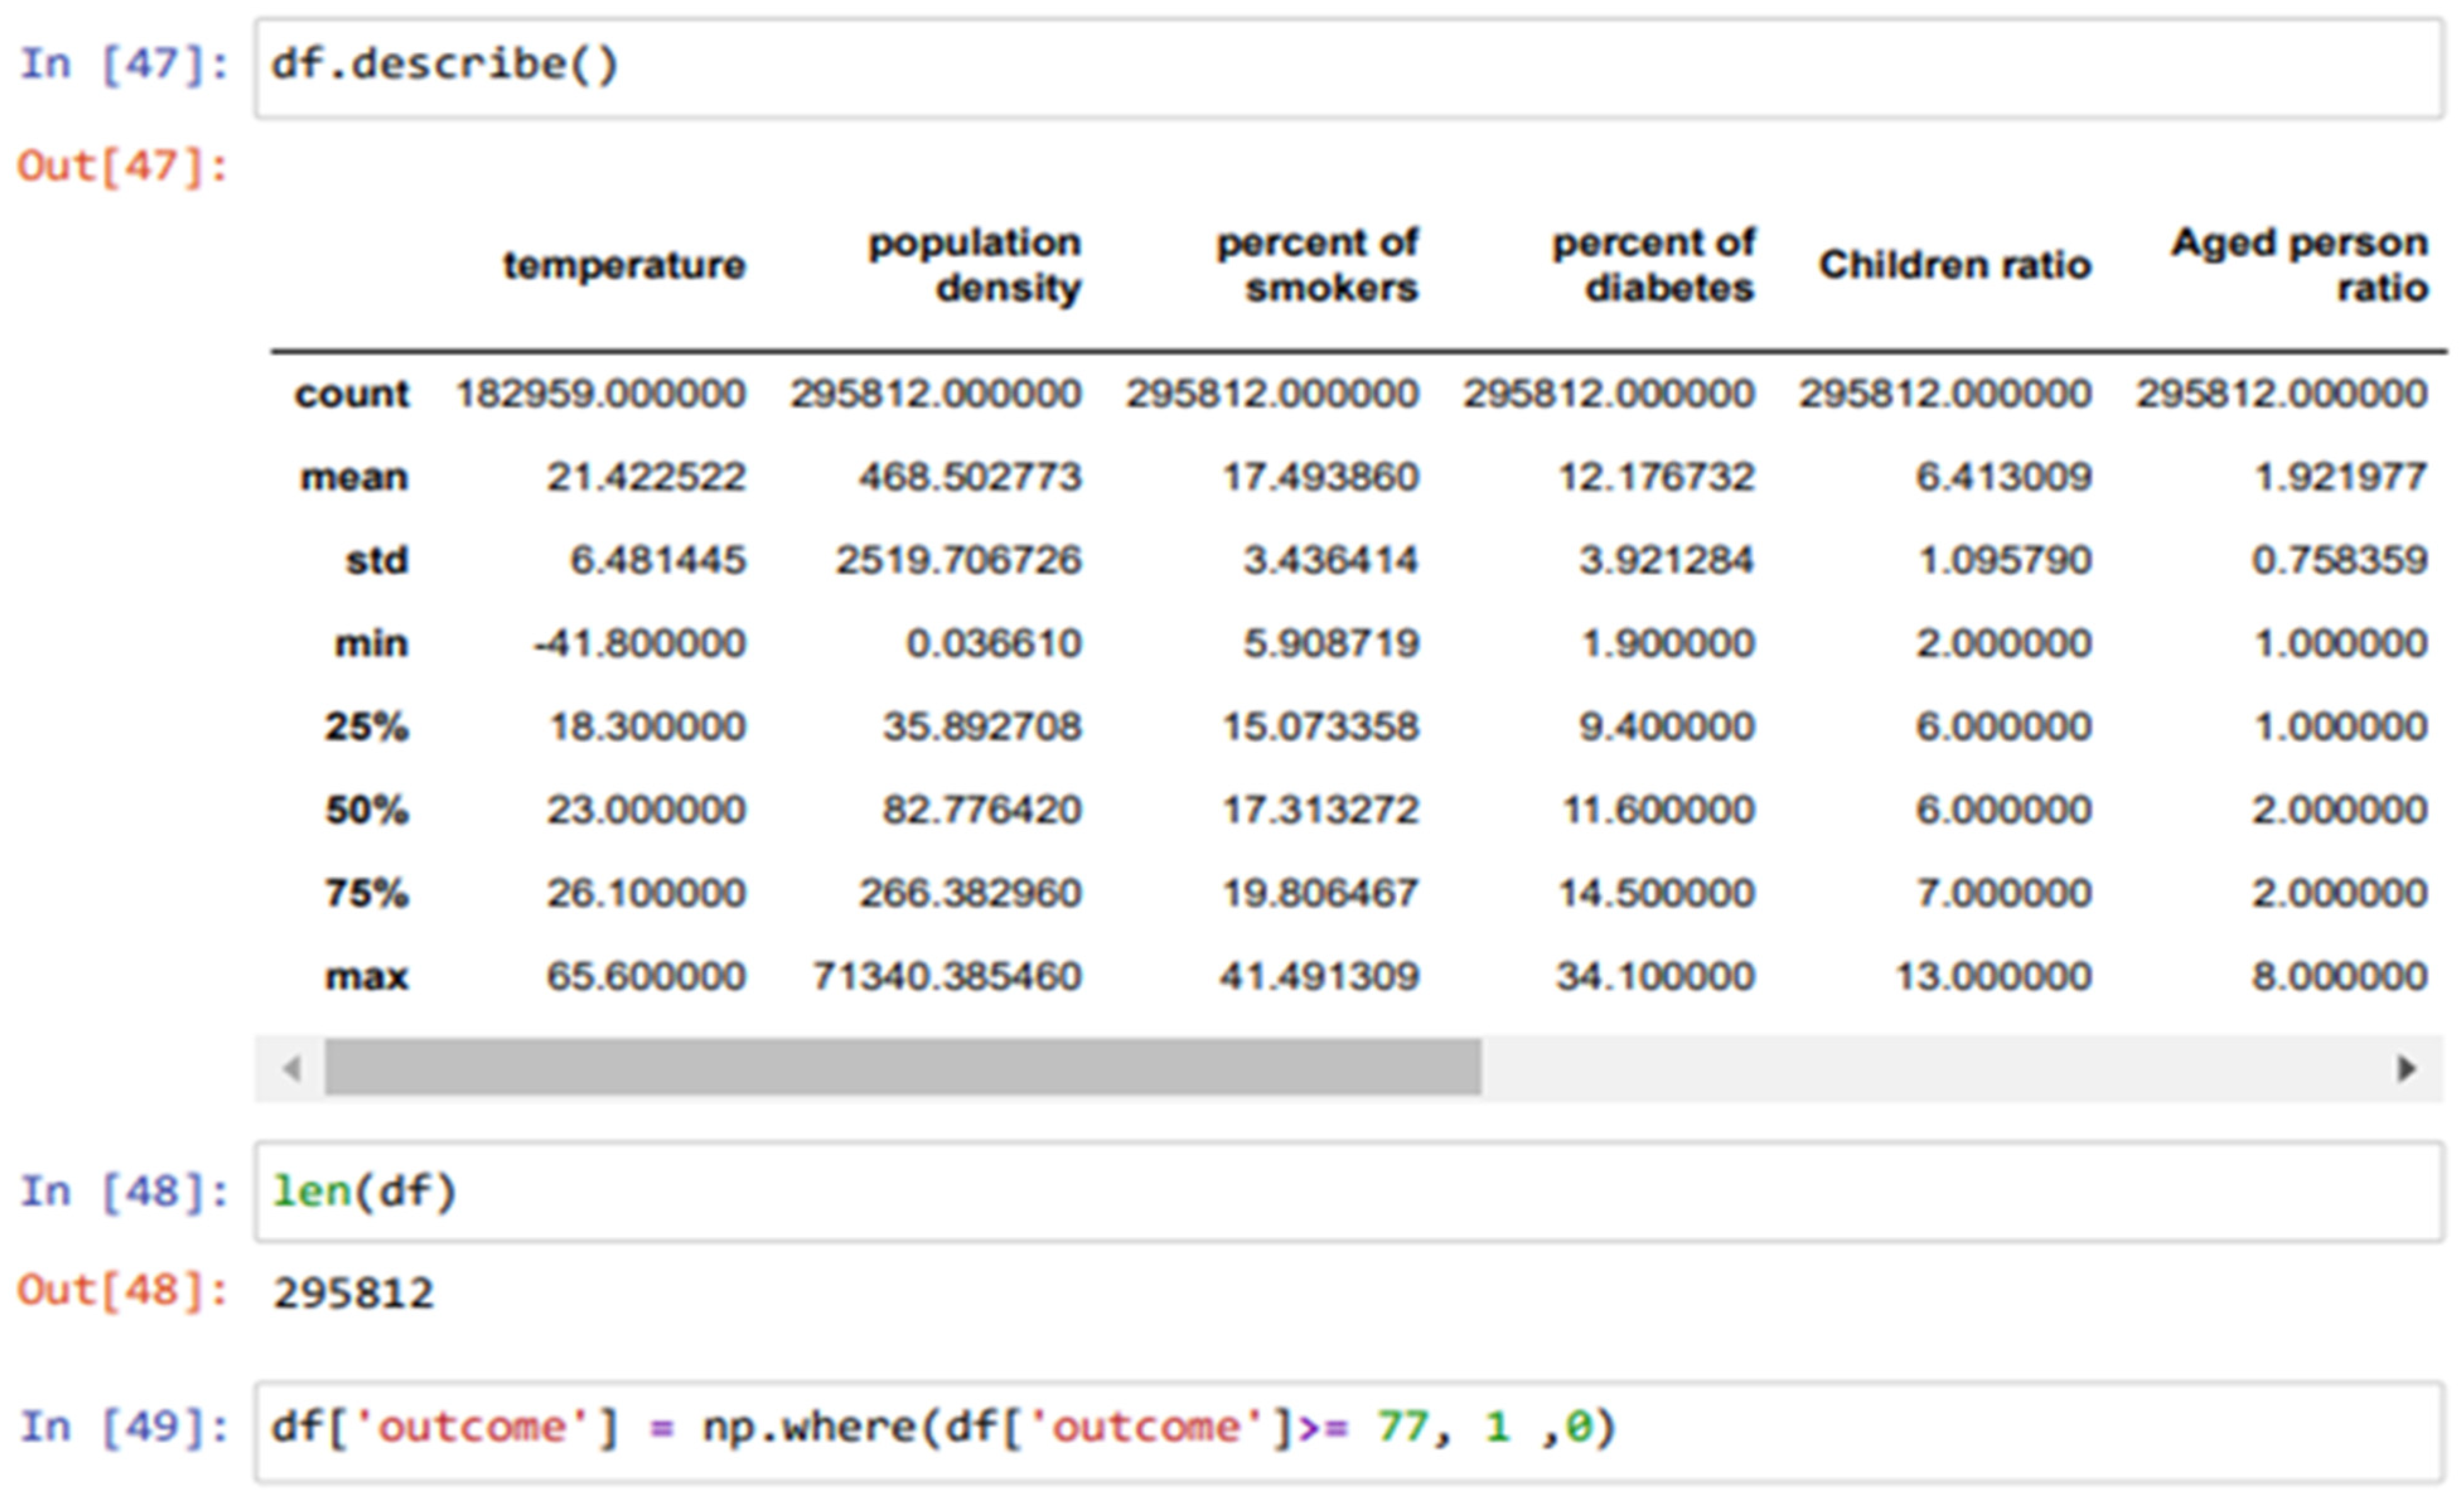
4.1.4. Replacing with Mean/Median/Mode
The presented strategy is particularly suitable for handling features with numeric data, such as the age of individuals. By adopting this approach, the missing values in the feature can be replaced with the mean, median, or mode of the available data. Although introducing some variance to the dataset, this approximation technique effectively mitigates the loss of information that would have otherwise ensued from removing rows or columns, as shown in Figure 4. Replacing missing values with these central tendency measures ensures that the integrity of the dataset is preserved, thus enhancing the robustness and accuracy of subsequent analyses and predictions. Moreover, this method provides superior outcomes compared to data removal, as it allows for the retention of crucial information while imputing the missing values, yielding more meaningful and comprehensive results.
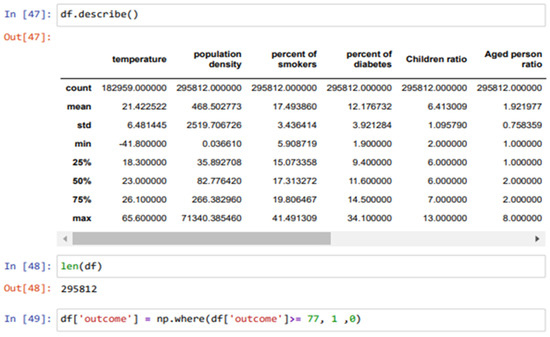
Figure 4.
A comparative analysis of mean, median, and mode imputation techniques for null value replacement.
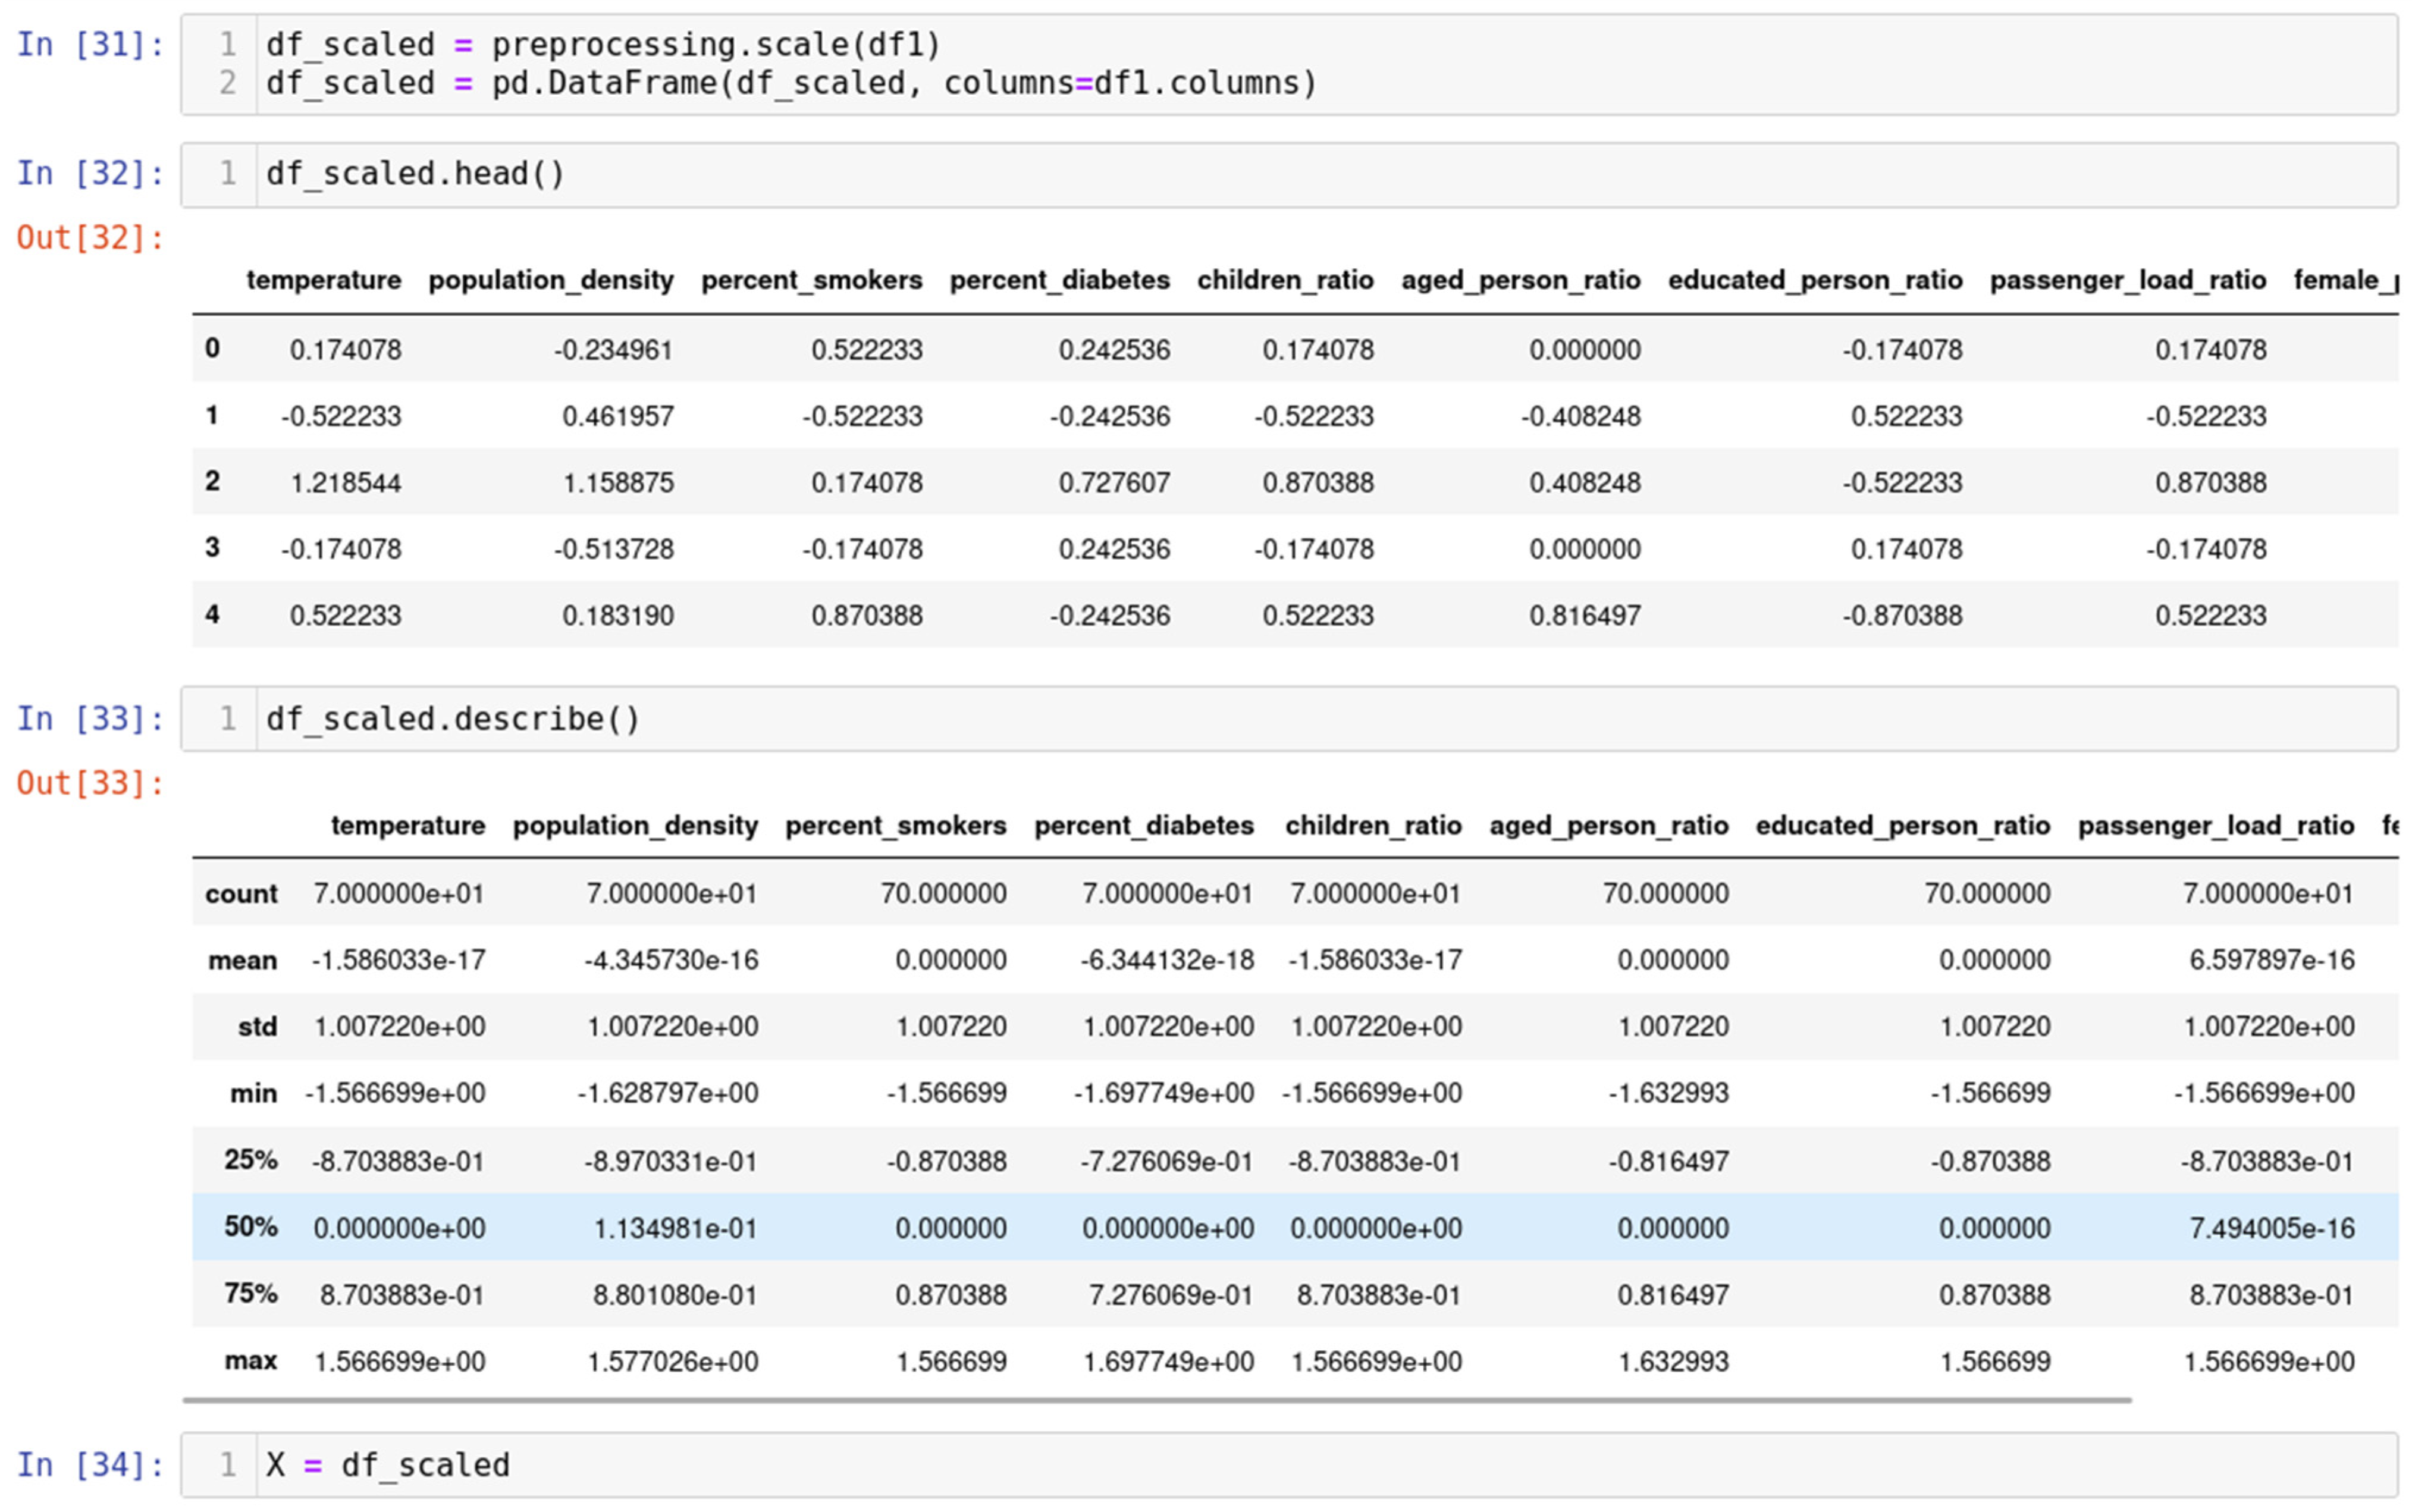
4.2. Data Scaling and Normalization
Within data scaling, two prominent methodologies warrant consideration: normalization and standardization. Both techniques can be readily implemented utilizing the sci-kit-learn library, a powerful tool widely adopted in the data science community. Normalization is rescaling the data from the original range so that all values are within the range of 0 and 1. Normalization necessitates knowledge of, or the ability to estimate accurately, the dataset’s minimum and maximum observable values. In practical scenarios, these extreme values can often be calculated from the available data. Effective normalization of the data is made possible by approximating the minimum and maximum values using the information already present in the dataset.
This estimation process is commonly accomplished by computing the minimum and maximum values directly from the dataset. Once these values are ascertained, the normalization procedure can be conducted by scaling each data point proportionally within the desired range (typically 0 to 1), as shown in Figure 5. Thus, through judicious utilization of the available data, normalization facilitates the transformation of features into a unified scale, enhancing the interpretability and convergence of machine learning algorithms for practical data analysis and predictive modeling. A value is normalized as shown in Equation (1):
where the minimum and maximum values pertain to the value x being normalized.
y = (x − min)/(max − min)
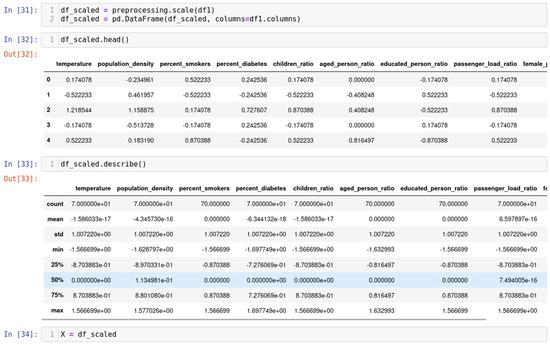
Figure 5.
A comprehensive guide to standardizing data for enhanced analysis and efficiency.
5. Result and Discussion
Performance Evaluation
The model in question underwent training employing a simple neural network architecture. The dataset utilized for this purpose was segregated into 70% for training and 30% for testing, adhering to a rigorous experimental design. The attained training accuracy demonstrated a commendable 97%, while the validation accuracy achieved an impressive 96%, affirming the model’s adeptness in generalization. Using a variety of performance measures, including F1 score, precision, accuracy, and recall as obtained from the confusion matrix analysis, a thorough evaluation was carried out to fully assess the performance of our proposed model. Figure 6 visually represents the confusion matrix elucidating the outcomes for the test data, thus providing invaluable insights into the model’s predictive capabilities. In fact, in outbreak detection, the size of the confusion matrix plays a pivotal role in assessing the performance of the detection system. A larger matrix offers a more detailed evaluation, enabling fine-grained analysis across various outbreak categories, severity levels, or geographical regions. This granularity empowers decision-makers to prioritize interventions effectively and fine-tune detection models for improved accuracy. However, the complexity of interpretation and increased computational demands associated with larger matrices should be considered, highlighting the importance of striking a balance between detailed analysis and practical implementation based on specific operational needs and resource constraints. This rigorous assessment encapsulates the efficacy of our devised model, affirming its viability and potential utility in real-world applications. However, optimizing the confusion matrix involves adjusting detection thresholds to balance false positives and false negatives based on system priorities. Techniques include fine-tuning thresholds, employing advanced machine learning methods like feature engineering and anomaly detection, and continuously updating algorithms based on real-world feedback and new data to enhance outbreak detection accuracy.
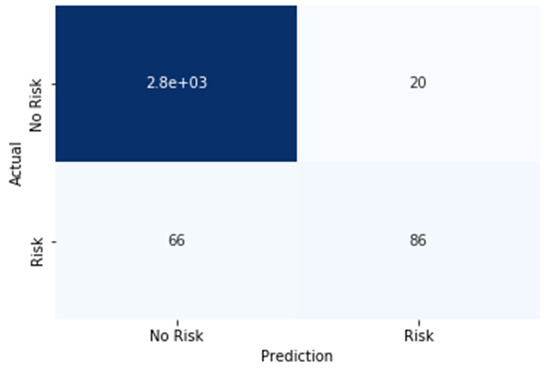
Figure 6.
Outbreak detection method using confusion matrix.
The matrix shown in Figure 6 is an essential tool for evaluating the performance of classification models, offering a detailed breakdown of the model’s predictions across different classes. By meticulously examining the confusion matrix, one can derive key metrics that provide a deeper insight into the model’s predictive capabilities. These metrics include accuracy, which measures the overall correctness of the model; precision, indicating the proportion of true positive predictions out of all positive predictions made; recall, reflecting the proportion of actual positives correctly identified by the model; and the F1 score, which harmonizes precision and recall into a single metric. This thorough analysis not only highlights the strengths and weaknesses of the proposed model but also guides further refinements to enhance its predictive accuracy and reliability:
- True Positive (TP): The model correctly identifies 86 instances of positive cases of COVID-19.
- False Positive (FP): The model erroneously predicts 20 instances as positive cases of COVID-19, which is harmful.
- True Negative (TN): Demonstrating exceptional accuracy, the model correctly identifies 2.8 and 103 instances of negative cases of COVID-19 observed.
- False Negative (FN): The model mistakenly classifies 66 instances as negative cases of COVID-19, when they are, in fact, positive.
Employing these four crucial metrics, the model’s performance was assessed by calculating essential performance indicators:
- Accuracy: Defined as the proportion of correct predictions out of the total predictions made by the model. The accuracy of the proposed model is computed as (TP + TN)/(TP + FP + TN + FN), yielding an impressive value of 0.96 or 96%.
- Precision: An indicator of the model’s capability to accurately identify positive samples among all samples predicted as positive. The precision of the proposed model is calculated as TP/(TP + FP), presenting a noteworthy value of 0.97 or 97%.
- Recall: Also referred to as sensitivity or actual positive rate, this metric signifies the proportion of actual positive samples the model correctly identifies. The recall of the proposed model is computed as TP/(TP + FN), amounting to 0.81 or 81%.
- F1 Score: Representing a harmonious amalgamation of precision and recall, the F1 score provides a balanced assessment of the model’s performance. It is calculated as 2 × (Precision × Recall)/(Precision + Recall), resulting in a significant value of 0.88 or 88%.
These computed performance metrics, as summarized in Table 1, furnish invaluable insights into the effectiveness and reliability of the proposed energy-optimized AIoT-based biosensor networking model for predicting COVID-19 outbreaks in healthcare systems. Such meticulous evaluation aids in substantiating the model’s potential applicability and fortifying its efficacy as a valuable tool in the fight against the pandemic.

Table 1.
Evaluating the performance and practicality of an outbreak prediction model.
In artificial neural networks (ANNs), the influence of various crucial parameters on model accuracy assumes paramount significance. Specifically, the learning rate, total number of neurons, total number of features, total amount of data, and total number of layers are essential factors that demand comprehensive examination to elucidate their impact on the predictive performance of ANNs. In order to improve the accuracy and efficiency of the ANN model, it is essential to know the settings that are ideal for these parameters. These fundamental parameters are discussed in the ensuing discussion, commencing with the learning rate. Figure 7 vividly portrays the dynamic relationship between accuracy and the number of iterations within the context of our experimental analysis. The X-axis, denoted by "Iteration,” signifies the frequency of the model’s learning updates during training. Meanwhile, the Y-axis, characterized as "accuracy," represents the testing accuracy, which indicates the model’s proficiency in making predictions on unseen data. At the outset, it is essential to recognize that iteration is synonymous with the learning rate, delineating the frequency at which the model undergoes weight adjustments during training. Selecting an optimal learning rate is a formidable challenge, as it critically impacts the model’s convergence and ultimate performance.
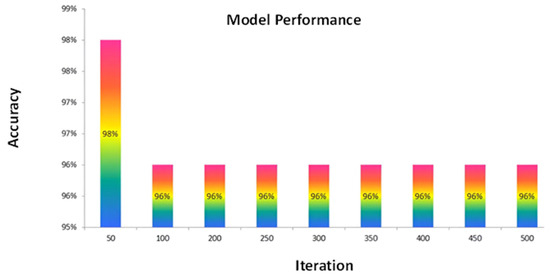
Figure 7.
Graphical representation of the relationship between iteration and accuracy.
Upon scrutinizing the graph, it is evident that augmenting the number of iterations initially leads to an ascending trend in accuracy. The prediction skills of the model increase with increasing learning opportunities, which is consistent with the noted rise in accuracy. However, the graph also reveals a noteworthy turning point. Beyond a specific iteration count, the accuracy reaches a pinnacle and then gradually descends. This trend signifies that the model’s performance eventually plateaus, wherein additional iterations may lead to overfitting or erroneous generalization. Upon thoroughly examining the graph, it can be discerned that the highest accuracy, standing at an impressive 97%, is attained when the number of iterations reaches 50. Consequently, the model reaches its optimal predictive capacity after undergoing 50 iterations during the training process. This information is invaluable for determining the ideal learning rate and ensuring the model’s efficacy in predicting COVID-19 outbreaks in healthcare systems with enhanced accuracy and reliability.
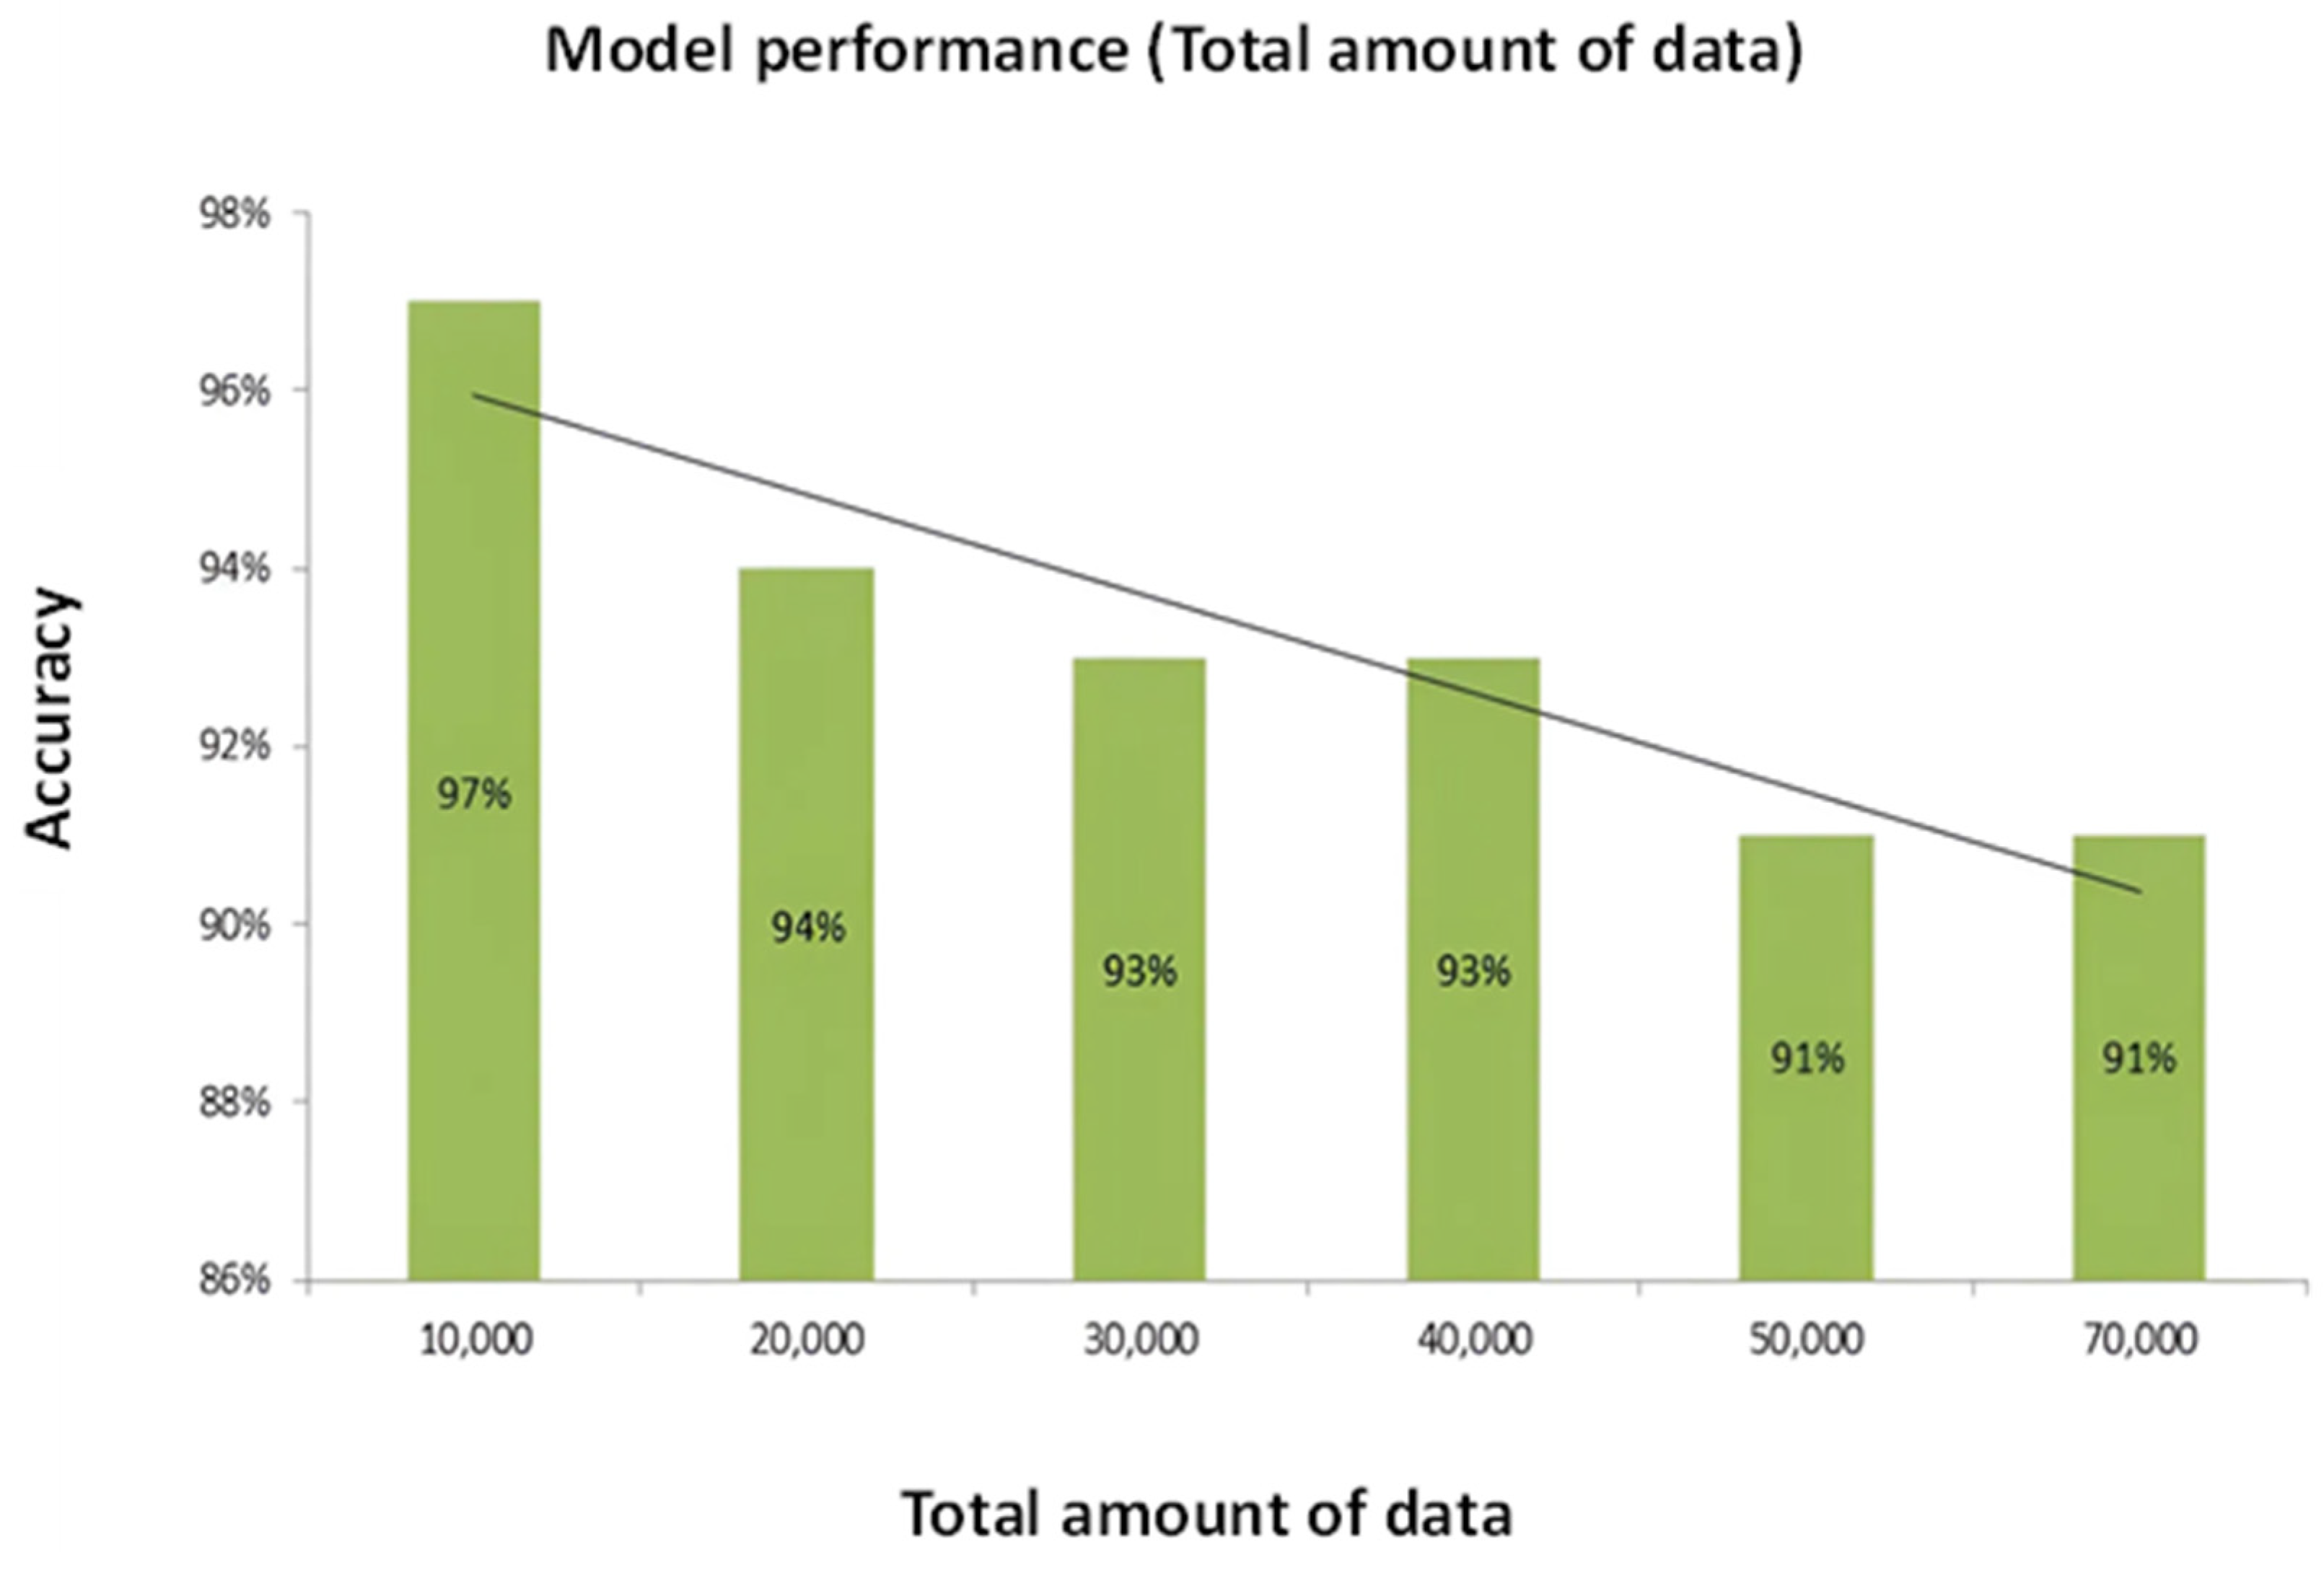
Figure 8 constitutes an illuminating graphical representation that delineates the correlation between accuracy and the dataset’s total number of data instances. The X-axis, aptly labeled as "total data number," signifies the size of the dataset in terms of the number of data instances it encompasses. Concurrently, the Y-axis, denoted as "accuracy," elegantly portrays the testing accuracy of the model. The observation that the total number of data instances present in the dataset profoundly influences the model’s accuracy is of paramount significance. The size of the dataset is an instrumental factor in determining the model’s predictive performance. It is worth noting that an exceedingly small dataset might impede the model’s ability to capture underlying patterns, thus leading to effective suboptimal accuracy. Conversely, as the number of data instances in the dataset expands, the model’s accuracy typically experiences an upward trajectory. This trend aligns with the general expectation that increased data availability facilitates a more comprehensive learning process for the model, consequently enhancing its predictive capability. However, intriguingly, the outcomes of this specific analysis reveal an exciting divergence from the expected trend. In this case, increasing the total number of data instances reduces accuracy. Notably, the model attains its peak accuracy of 97% when trained on a dataset containing precisely 10,000 data instances. This observation suggests an optimal balance between dataset size and the model’s capacity to generalize patterns. Interestingly, deviations from this optimal dataset size, either with more or fewer instances, result in diminished accuracy. As the number of instances in the dataset increases beyond 10,000, the accuracy decreases, which may be an indication of overfitting or noise amplification. Conversely, with fewer than 10,000 instances, the model may struggle to discern underlying patterns effectively, leading to decreased predictive performance. This analysis underscores the critical role of dataset size optimization in achieving maximal model accuracy, emphasizing the intricate interplay between data volume and predictive capability.

Figure 8.
Correlation between the total amount of data and accuracy graph.
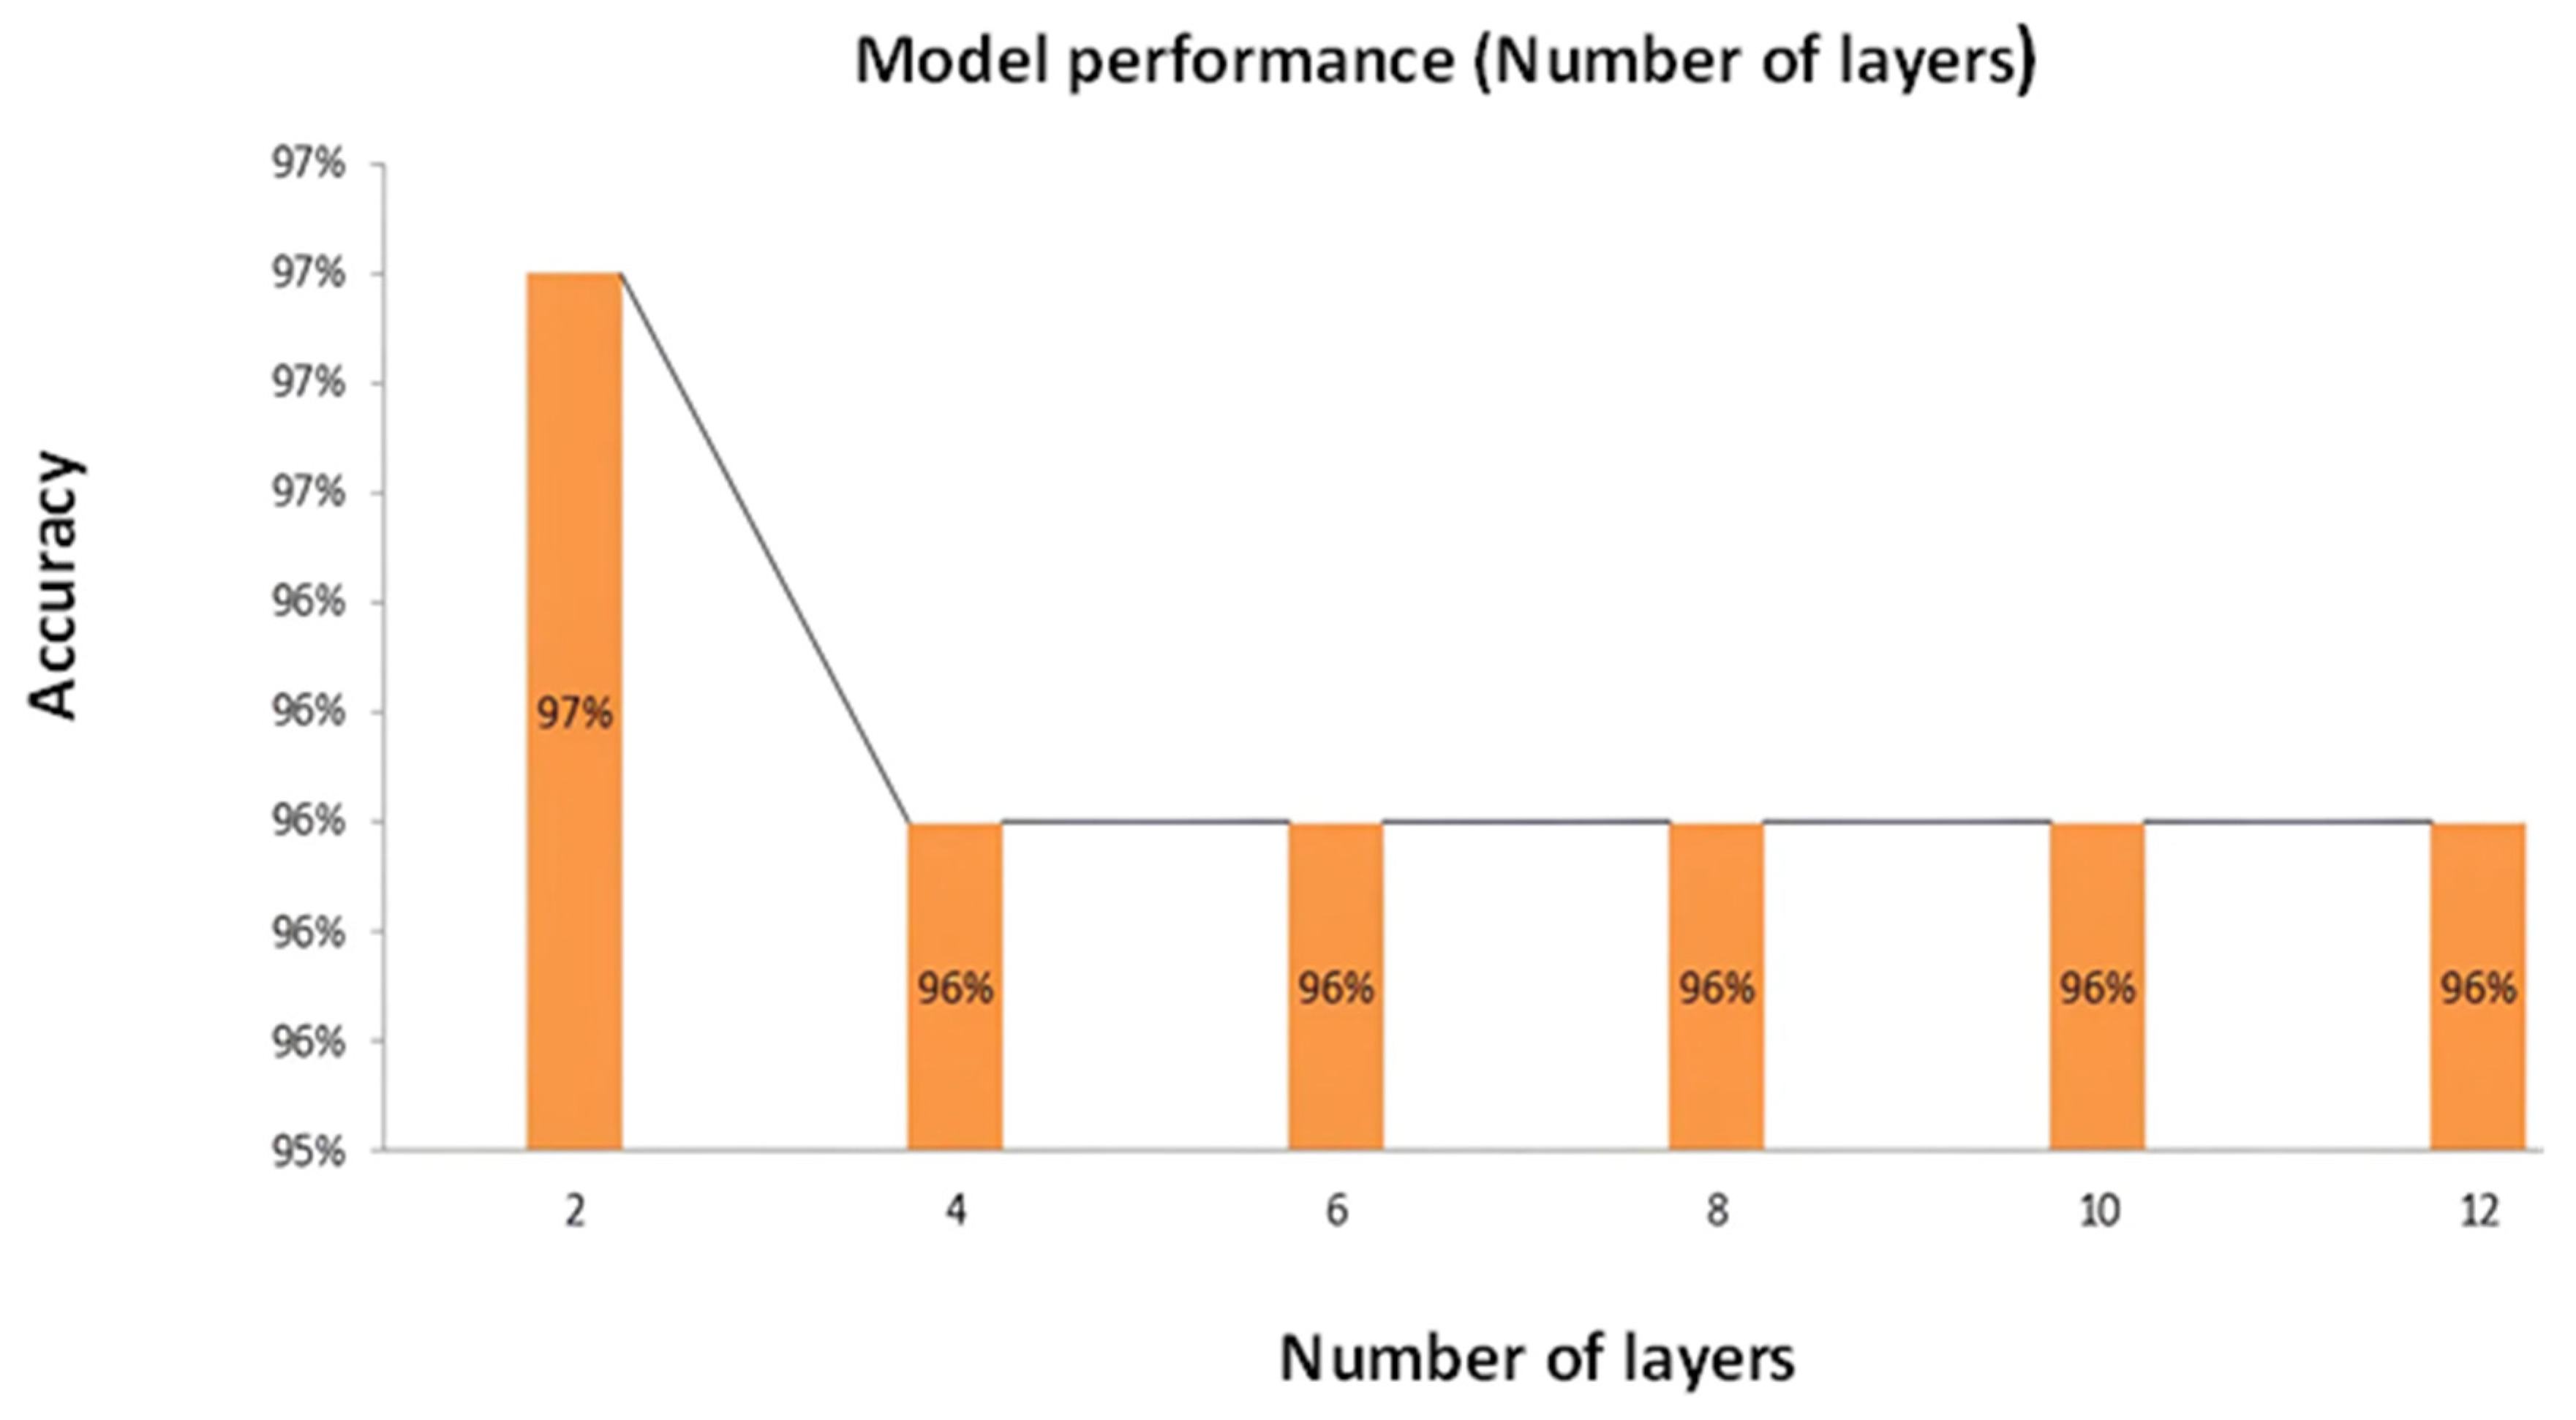
Figure 9 offers a comprehensive graphical portrayal of the attained accuracy concerning the variation in the number of layers implemented within our model. The X-axis adeptly designates the number of layers integrated into the model architecture, while the Y-axis indicates the corresponding testing accuracy. According to the initial setup, our model consisted of two layers, which were adequate to meet the needs of the work. However, a noteworthy observation emerged upon exploring the impact of increasing the number of layers beyond the optimal level. Elevating the number of layers beyond the model’s actual necessity resulted in a decline in validation accuracy. This empirical finding underscores the critical significance of striking an appropriate balance in the complexity of the model’s architecture. In spite of the fact that a certain amount of architectural depth is advantageous for the purpose of collecting intricate patterns within the data, excessive layering can give rise to harmful impacts on the performance of the model, which ultimately results in a reduction in accuracy. A prominent highlight of the graph is the realization that the model reaches its peak accuracy of 97% when the number of layers is at its minimum, specifically at two layers. This observation reinforces that judiciously selecting the correct number of layers is pivotal in optimizing the model’s predictive capability and avoiding unnecessary computational complexity.

Figure 9.
Correlation between the number of layers and accuracy graph.
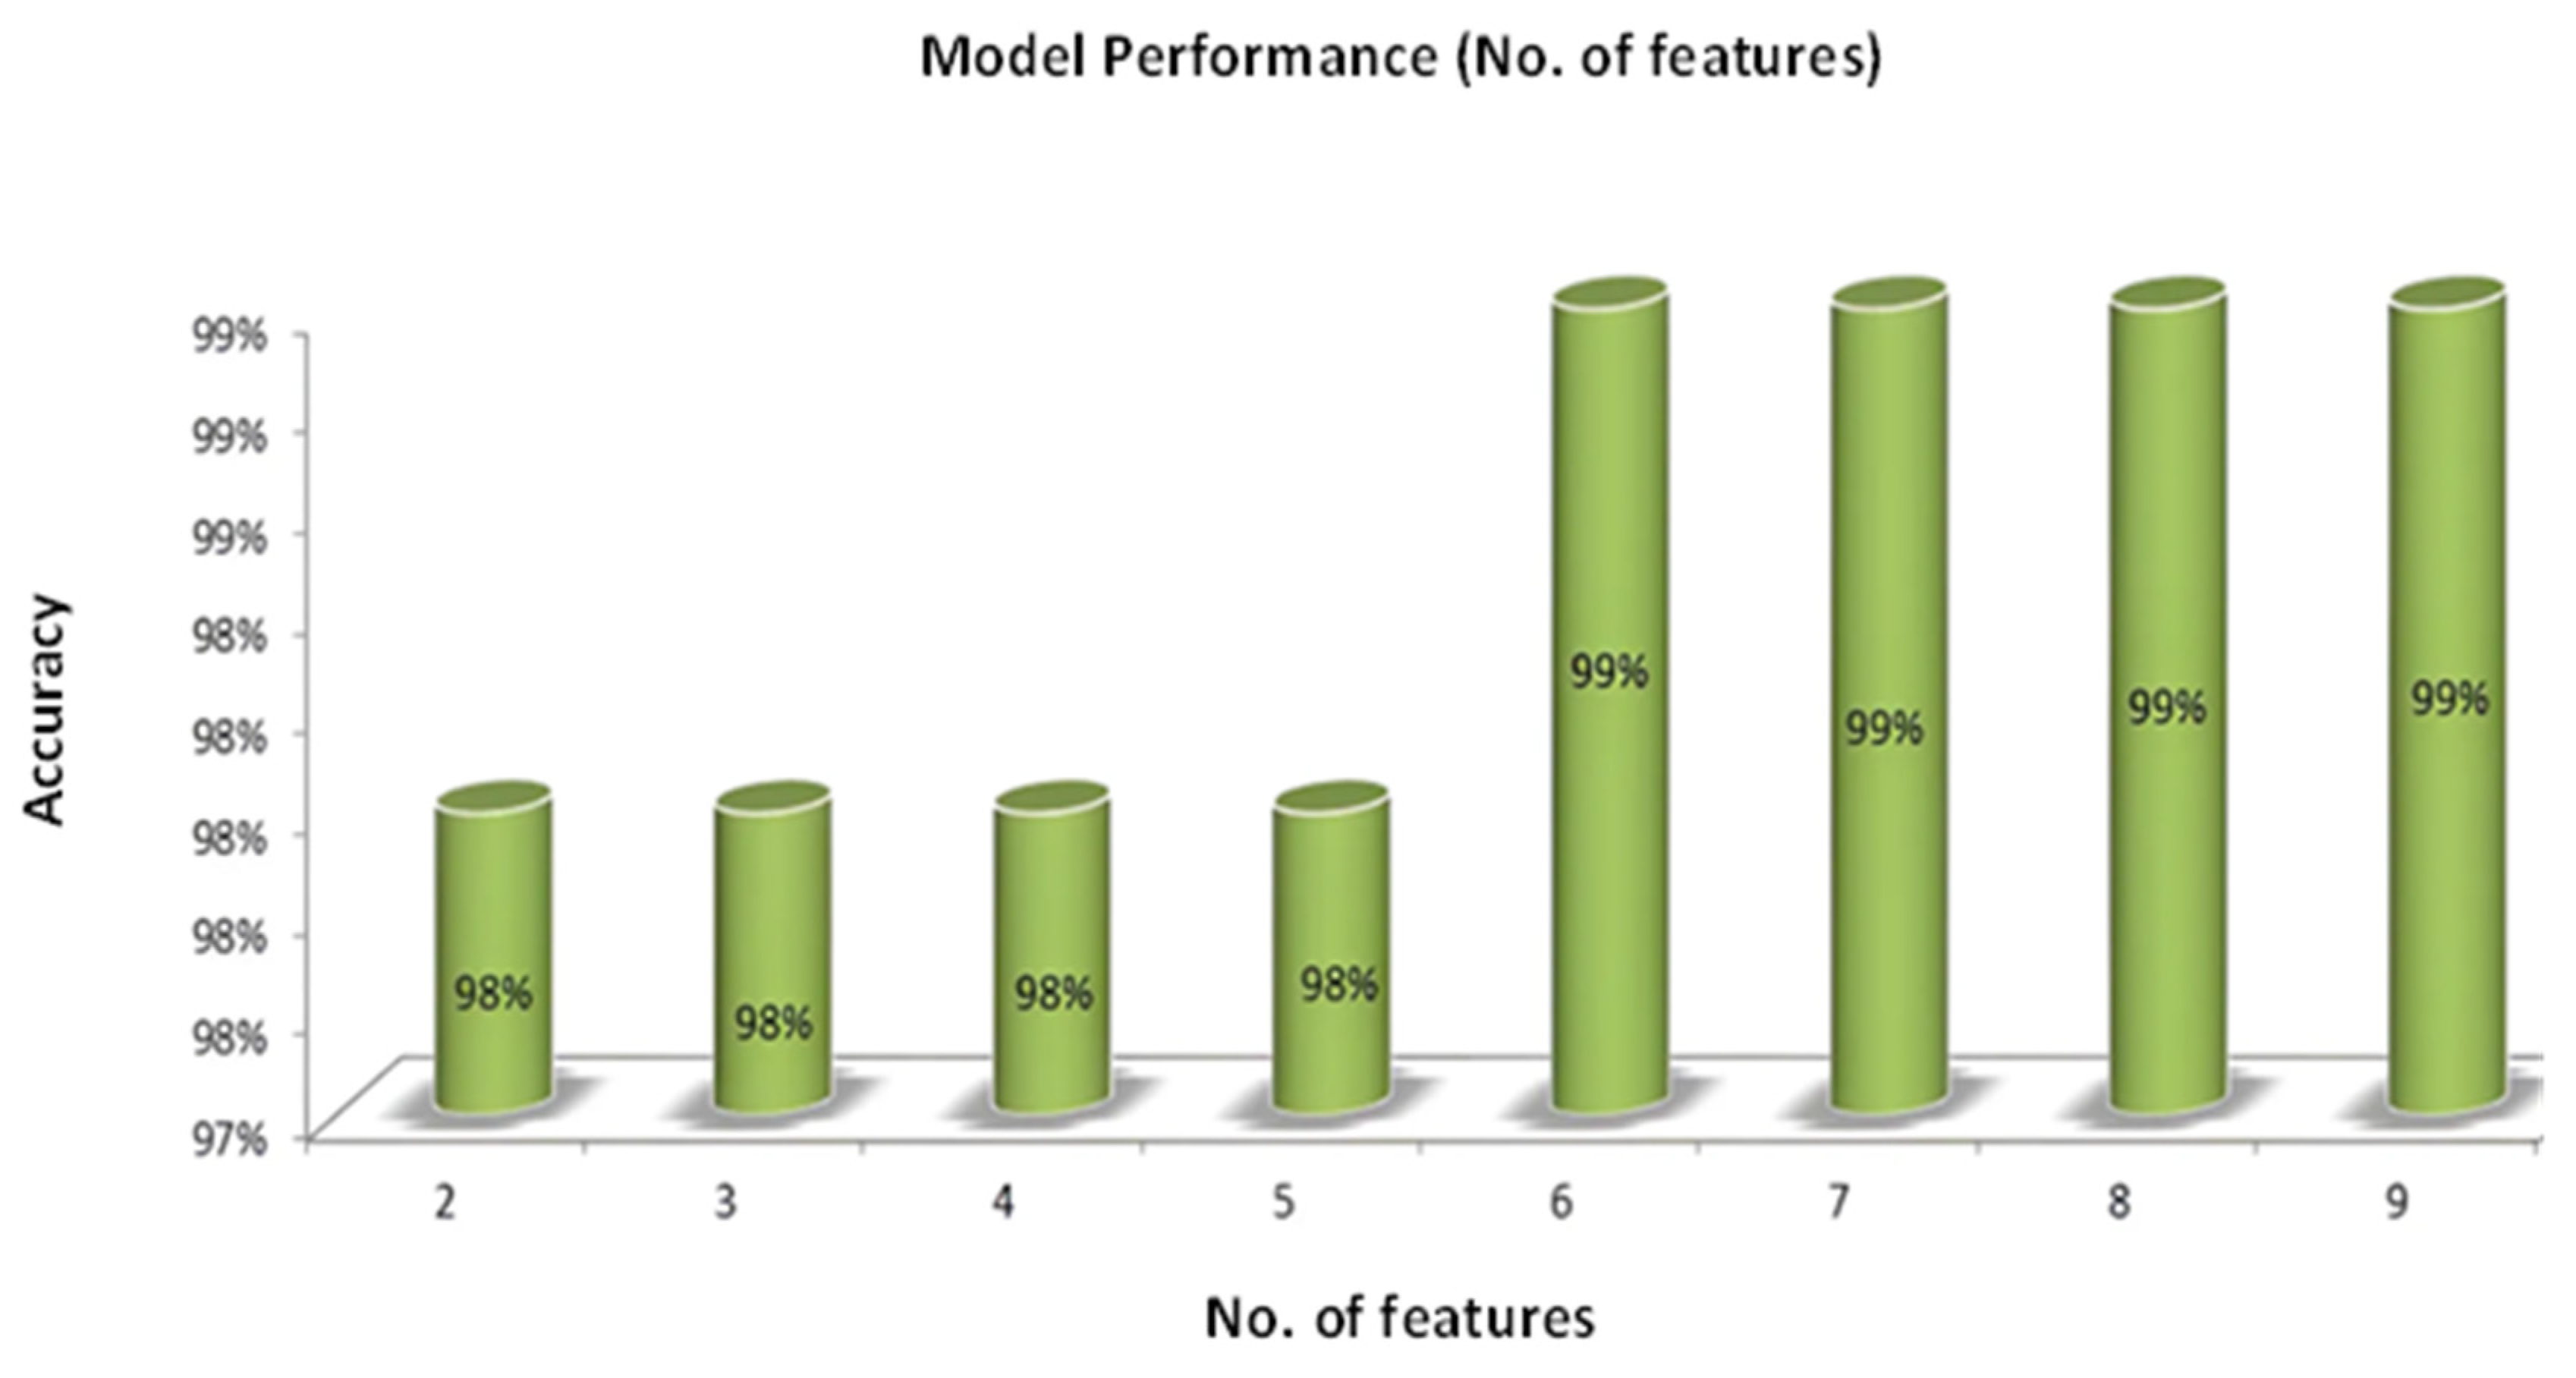
Figure 10 embodies a highly informative graph that elucidates the dynamic relationship between accuracy and the number of features incorporated in constructing our model. The X-axis aptly denotes the number of features employed as inputs in the model, while the Y-axis elegantly represents the model’s accuracy, explicitly reflecting the testing accuracy. In this context, accuracy pertains to the model’s proficiency in making precise predictions during testing. Conversely, features represent the columns that are inputs, providing the model with particular data that is necessary to provide correct results. Looking at the graph, something interesting shows up. Increasing the total number of input features augments the amount of information available to the model about the output. Consequently, with more comprehensive input data, the model is better equipped to discern intricate patterns and relationships within the dataset, improving predictive accuracy. The graph depicts a gradual ascent in accuracy with an increase in the number of features.

Figure 10.
Correlation between the total numbers of features and accuracy graph.
This upward trend exemplifies the beneficial effect of enriched input data on the model’s performance. In an outstanding turn of events, the maximal accuracy, which reaches an astounding 93%, is recorded when the number of characteristics hits its highest point, which is ‘9’. This outcome signifies the optimal balance between information richness and model complexity. Beyond this point, a further increase in the number of features may result in diminishing returns or even overfitting, potentially hampering the model’s ability to generalize to new data. The observations in Figure 11 resonate with the notion that enhancing model efficiency can be achieved by strategically increasing the number of inputs. This strategic augmentation ensures that the model effectively captures pertinent patterns and relevant insights from the data, ultimately bolstering its accuracy and reliability.
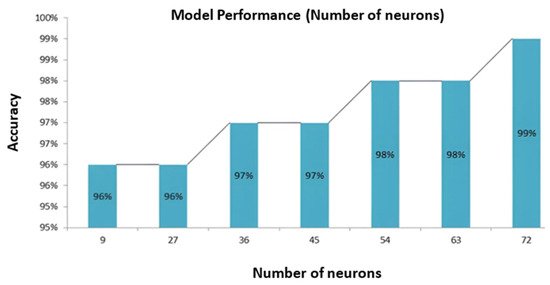
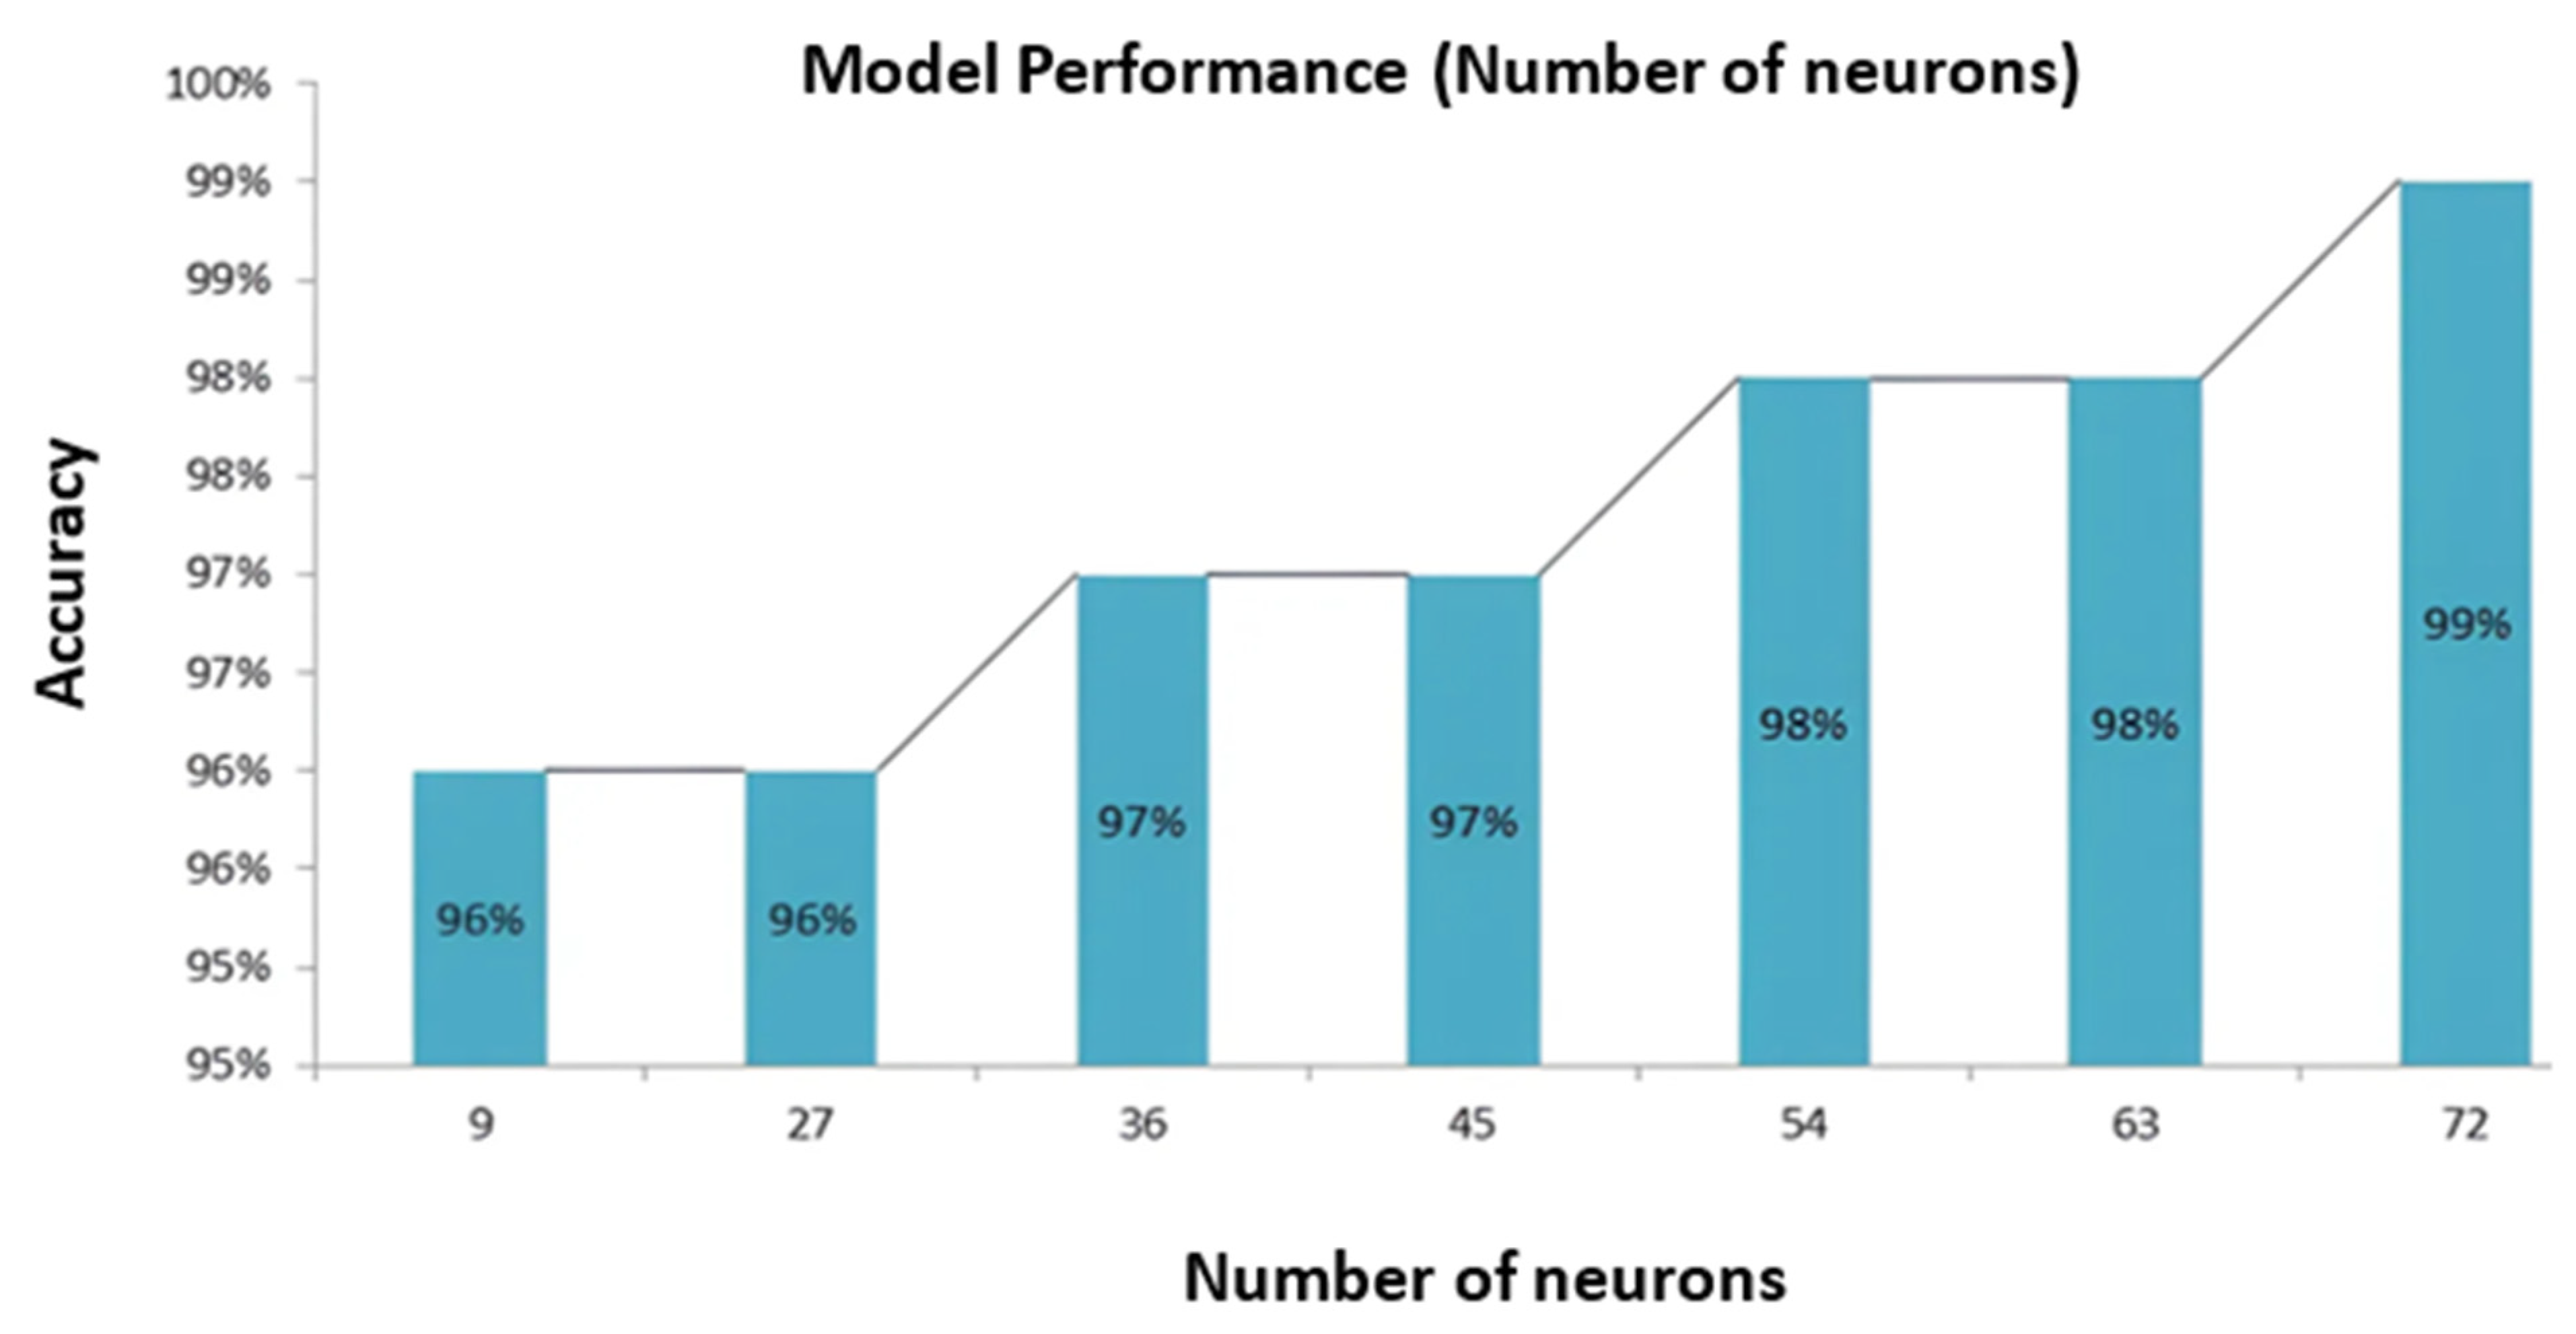
Figure 11.
Correlation between the total numbers of neurons and accuracy graph.
Figure 11 comprehensively illustrates the impact of varying the total number of neurons on the model’s accuracy. Carefully matched to the overall number of neurons in the model, the X-axis enables a detailed examination of its impact. At the same time, the Y-axis represents the accuracy achieved by our proposed model, explicitly reflecting the testing accuracy.
Remarkably, a neuron in this context represents a single computational unit involved in information processing and feature extraction within the model’s hidden layers. A compelling pattern emerges as we delve into the observations made in Figure 11. The graph unequivocally demonstrates that augmenting the total number of neurons within the model yields a pronounced impact on accuracy. As the model’s neural complexity increases, so does its capacity to discern intricate patterns and relationships within the data. This augmentation in neural capacity contributes to heightened model efficiency, culminating in improved accuracy. The graph reveals a remarkable outcome when the X-label value peaks at 72 neurons. Correspondingly, the Y label value concurrently reaches its highest position at an astounding 99%. This notable finding underscores the significant influence of neuron count on the model’s predictive prowess, wherein increasing the total number of neurons corresponds to a noteworthy boost in accuracy. However, it is imperative to exercise prudence in determining the number of neurons, as excessively high values may result in overfitting and hindered generalization to unseen data. Optimal neuron selection is pivotal to strike a delicate balance between model complexity and performance.
Now, we look forward to summarizing the accuracy change with the change of different parameters. Table 2 shows the parameters of our model that we needed to update to fine-tune our model.
Table 2.
Different parameters of our model.
Table 2 presents the parameters adjusted to fine-tune our model, highlighting the impact of each on accuracy. Notably, the parameter corresponding to the total number of neurons achieved the highest accuracy, reaching 99%. In contrast, other parameters, including the learning rate, the total number of features, the total number of data points, and the total number of layers, all resulted in an accuracy of 97%. This indicates that while multiple parameters contribute significantly to the model’s performance, optimizing the total number of neurons has the most substantial effect on enhancing accuracy.
In order to enhance the robustness and credibility of the proposed model, a meticulous and systematic analysis was undertaken, involving a comparative assessment between historical empirical data and the prognosticated outcomes. This evaluative endeavor specifically concentrated on the cumulative incidences of global COVID-19 cases, thereby serving as a crucial litmus test to ascertain the accuracy and efficacy of the predictive framework.
The outlined process involves importing essential Python libraries, gathering COVID-19 data, pre-processing it into fixed time-step sequences, establishing LSTM models for prediction, compiling and training the models, employing a custom callback for optimal LSTM state reset, predicting future cases, reverting predictions through inverse scaling, and ultimately visualizing the predictions using Plotly. This comprehensive approach encompasses data preparation, pre-processing, model architecture, compilation, training, prediction, and visualization stages, facilitating a holistic framework for accurately forecasting COVID-19 cases.
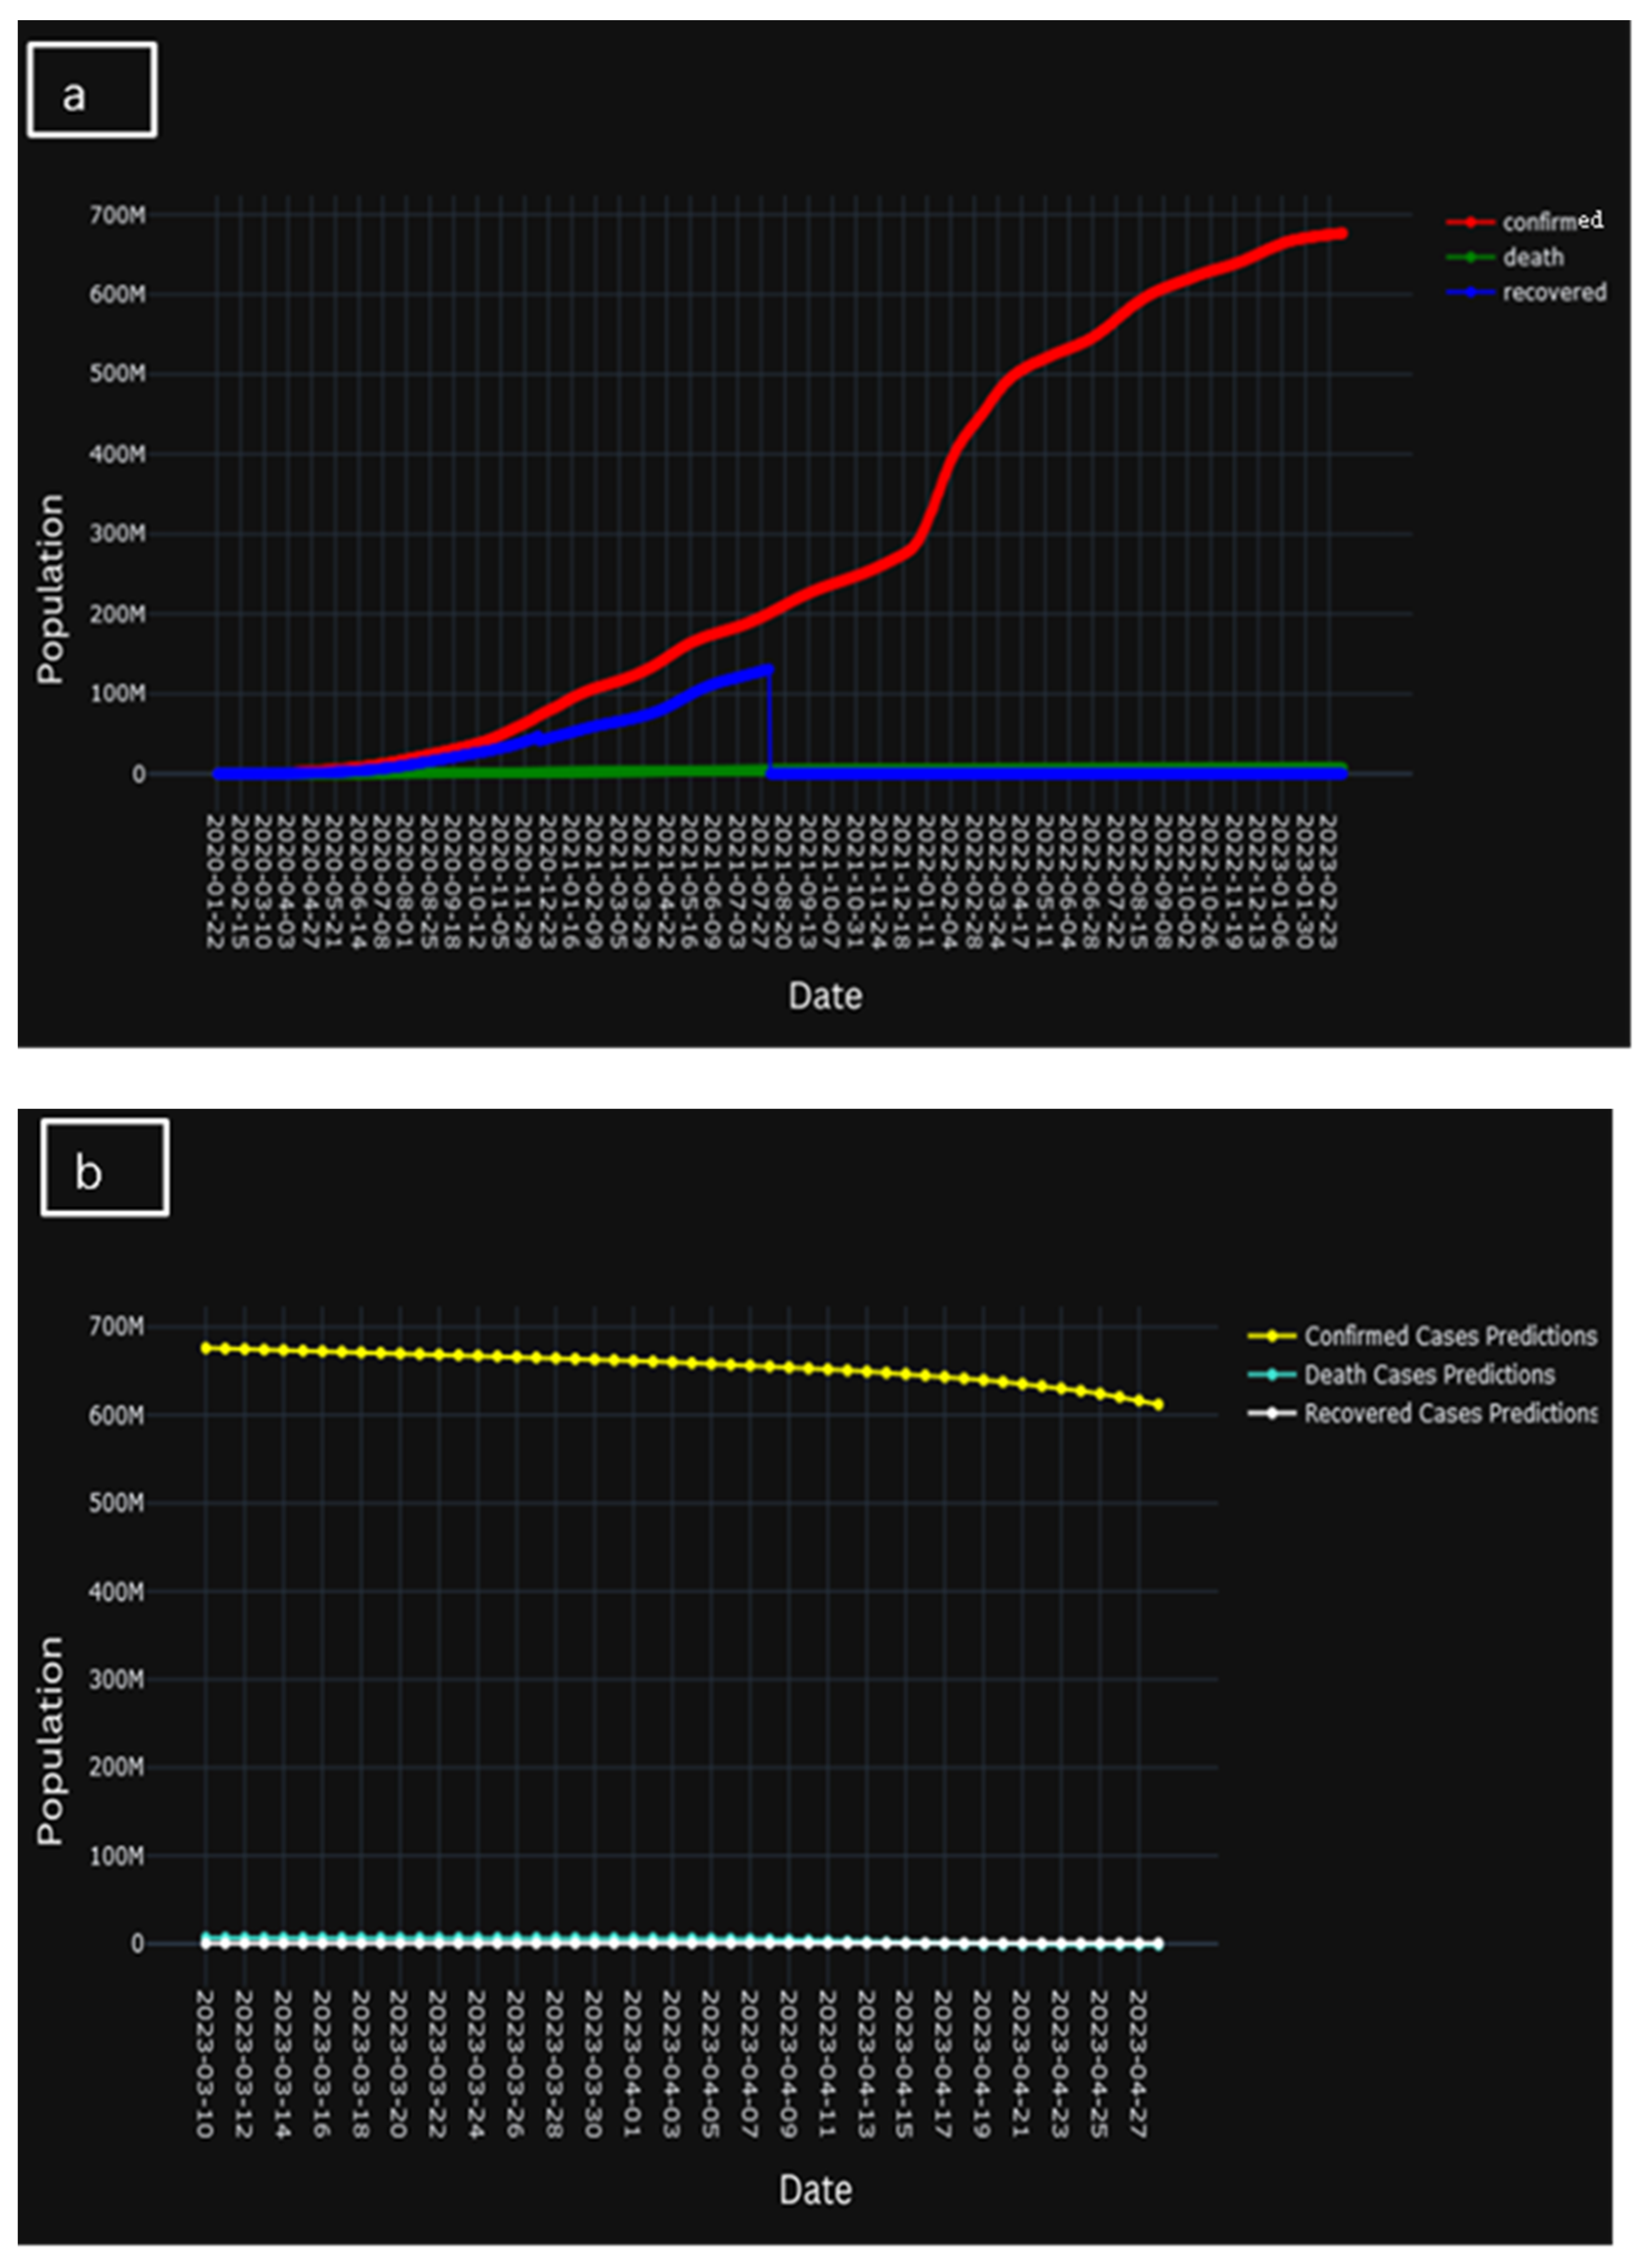
A clear and concise explanation of the temporal progression of the learning trajectory of the model is provided in Figure 12. Here, Figure 12a presents the actual population of confirmed cases, cases of death, and recovered cases, whereas Figure 12b represents the predicted population of confirmed cases, cased of death, and recovered cases. However, Figure 12c presents the comparison of the two historic and predicted scenarios. A brief decline in Figure 12c could indicate that, when the underlying system evolves over time, a model’s parameters may stray from its ideal values. Unexpected differences between expected and actual results may arise if these changes are not taken into consideration by the model. Evidently, during the initial training phases, discernible temporal patterns emerge wherein the model gradually acquaints itself with the intricate nuances inherent in the dataset. This early stage is marked by a considerable gestation period during which the model tries to understand the underlying complexity buried in the data.
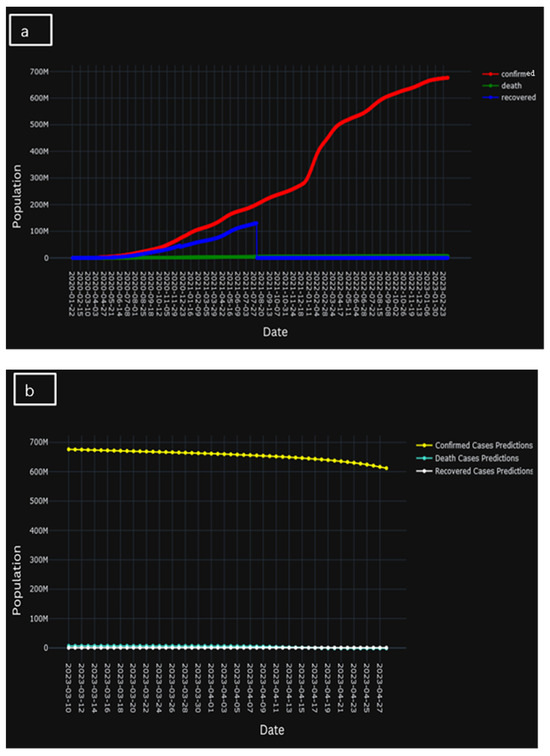
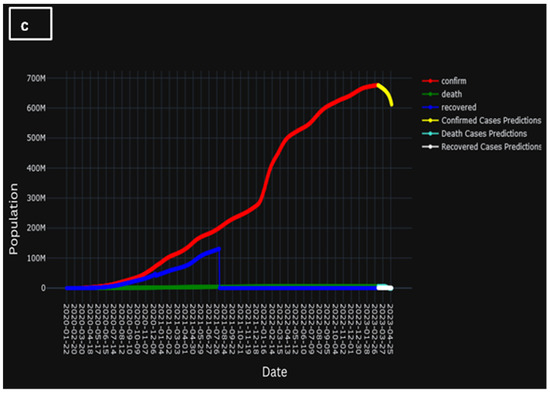
Figure 12.
(a) Population of actual confirmed, death, and recovered cases, (b) population of predicted confirmed, death, and recovered cases, and (c) comparison of the two historic and predicted scenarios.
However, as the training process unfolds, a transformation is discernible. The model goes beyond its early phases and increasingly improves its ability to forecast, leading to a better knowledge. This culmination is marked by a salient and demonstrable improvement in predictive accuracy, as the model attains a noteworthy capacity to forecast outcomes with a heightened degree of precision and alignment with observed empirical phenomena.
6. Conclusions
The development of an energy-optimized AIoT-based wireless sensor network for the healthcare system marks a significant milestone in the evolution of healthcare technology. The potential of AIoT is tapped by this creative system to completely transform patient care, monitoring, and data collecting procedures. The primary objective of this energy-optimized AIoT-based wireless sensor network is to enhance the efficiency, accuracy, and reliability of healthcare systems while ensuring minimal energy consumption.
The present investigation explored the impact of distinct parameters, encompassing learning rate, the total number of neurons, the total number of features, the total number of data, and the total number of layers, on the accuracy of the proposed model. Firstly, the experimental outcomes revealed the role of learning rate and iteration in determining the model’s accuracy. The accuracy increased when the number of iterations increased initially, but after a certain point, the accuracy decreased. Incredibly, the model reached its maximum accuracy of 97% after about 50 iterations, which emphasizes the need of carefully choosing the number of iterations to maximize performance. Secondly, the total number of data or rows in the dataset is a vital factor influencing accuracy. While a larger dataset generally results in improved accuracy, intriguingly, the proposed model exhibited a declining trend in accuracy as the total number of rows increased. The acme of accuracy, standing at 97%, materialized with a dataset comprising 10,000 data points. Furthermore, the number of layers incorporated within the ANN architecture significantly affects model accuracy. Surpassing the optimal number of layers leads to a decline in validation accuracy. For the proposed model, the highest accuracy of 97% was attained when there were precisely two layers. Moreover, the number of features or columns taken as input profoundly influences the model’s predictive efficacy. Augmenting the number of features augments the information provided to the model, thus contributing to enhanced accuracy. Notably, the model achieved its pinnacle accuracy of 93% when incorporating nine features. Lastly, the total number of neurons within the model plays a pivotal role in determining accuracy. An increase in the total number of neurons results in heightened complexity in the hidden layers, thereby enhancing efficiency. Significantly, the model achieved its peak accuracy of 99% when employing 72 neurons.
In conclusion, the study underscores the critical importance of parameter tuning in enhancing the performance of the ANN-based predictive model. By carefully adjusting parameters such as learning rate, iteration count, number of layers, features, and neurons, the proposed energy-optimized IoT-based biosensor network model demonstrates substantial potential in accurately predicting COVID-19 outbreaks within healthcare systems. This energy-efficient IoT-based wireless sensor network represents a significant advancement in healthcare technology, promising to transform patient care, improve healthcare outcomes, and propel the healthcare industry forward. With continued innovation and collaboration between technology experts and healthcare professionals, the future of healthcare looks more connected, efficient, and patient-centric, paving the way for a more responsive and effective healthcare landscape.
Author Contributions
Conceptualization: M.P. and D.K.; methodology: M.P. and D.K.; software: M.P. and D.K.; validation: M.P. and D.K.; formal analysis: M.P.; investigation: M.P. and D.K.; resources: M.P. and D.K.; data curation: M.P. and D.K.; writing—original draft preparation: M.P. and D.K.; writing—review and editing: M.P. and D.K.; visualization: M.P. and D.K.; supervision: D.K. project administration: M.P. and D.K.; funding acquisition: M.P. All authors have read and agreed to the published version of the manuscript.
Funding
This research received no external funding.
Data Availability Statement
Data will be available on suitable demand.
Acknowledgments
I would like to express my profound and heartfelt gratitude to my research supervisor Dinesh Kumar for his support, understanding, and personal guidance. I thank him for his intense endurance and outstanding technical guidance in writing and presenting research. I would like to give my special thanks to our organization’s Computer Science and Engineering Department for their support and continuous guidance.
Conflicts of Interest
The authors declare no conflicts of interest.
References
- Kumar, S.; Tiwari, P.; Zymbler, M. Internet of Things is a revolutionary approach for future technology enhancement: A review. J. Big Data 2019, 6, 111. [Google Scholar] [CrossRef]
- Saleem, T.J.; Chishti, M.A. Data analytics in the internet of things: A survey. Scalable Comput. Pract. Exp. 2019, 20, 607–629. [Google Scholar] [CrossRef]
- Noura, M.; Atiquzzaman, M.; Gaedke, M. Interoperability in Internet of Things: Taxonomies and Open Challenges. Mob. Netw. Appl. 2019, 24, 796–809. [Google Scholar] [CrossRef]
- Adnan, A.; Razzaque, M.A.; Ahmed, I.; Isnin, I.F. Bio-Mimic Optimization Strategies in Wireless Sensor Networks: A Survey. Sensors 2013, 14, 299–345. [Google Scholar] [CrossRef] [PubMed]
- Singh, S.; Malik, A.; Kumar, R. Energy efficient heterogeneous DEEC protocol for enhancing lifetime in WSNs. Eng. Sci. Technol. Int. J. 2017, 20, 345–353. [Google Scholar] [CrossRef]
- Singh, S. A sustainable data gathering technique based on nature inspired optimization in WSNs. Sustain. Comput. Inform. Syst. 2019, 24, 100354. [Google Scholar] [CrossRef]
- Ramteke, R.; Singh, S.; Malik, A. Optimized routing technique for IoT enabled software-defined heterogeneous WSNs using genetic mutation based PSO. Comput. Stand. Interfaces 2022, 79, 103548. [Google Scholar] [CrossRef]
- Qing, L.; Zhu, Q.; Wang, M. Design of a distributed energy-efficient clustering algorithm for heterogeneous wireless sensor networks. Comput. Commun. 2006, 29, 2230–2237. [Google Scholar] [CrossRef]
- Singh, S. An energy aware clustering and data gathering technique based on nature inspired optimization in WSNs. Peer Netw. Appl. 2020, 13, 1357–1374. [Google Scholar] [CrossRef]
- Heinzelman, W.; Chandrakasan, A.; Balakrishnan, H. Energy-efficient communication protocol for wireless microsensor networks. In Proceedings of the Hawaii International Conference on System Sciences, Maui, HI, USA, 7 January 2002; p. 8020. [Google Scholar]
- Heinzelman, W.; Chandrakasan, A.; Balakrishnan, H. An application-specific protocol architecture for wireless microsensor networks. IEEE Trans. Wirel. Commun. 2002, 1, 660–670. [Google Scholar] [CrossRef]
- Mhatre, V.; Rosenberg, C. Design guidelines for wireless sensor networks: Communication, clustering and aggregation. Ad Hoc Netw. 2004, 2, 45–63. [Google Scholar] [CrossRef]
- Younis, O.; Fahmy, S. HEED: A hybrid, energy-efficient, distributed clustering approach for ad hoc sensor networks. IEEE Trans. Mob. Comput. 2004, 3, 366–379. [Google Scholar] [CrossRef]
- Khan, M.K.; Shiraz, M.; Shaheen, Q.; Butt, S.A.; Akhtar, R.; Khan, M.A.; Changda, W. Hierarchical routing protocols for wireless sensor networks: Functional and performance analysis. J. Sens. 2021, 2021, 7459368. [Google Scholar] [CrossRef]
- Jin, R.; Fan, X.; Sun, T. Centralized Multi-Hop Routing Based on Multi-Start Minimum Spanning Forest Algorithm in the Wireless Sensor Networks. Sensors 2021, 21, 1775. [Google Scholar] [CrossRef] [PubMed]
- Lin, D.; Wang, Q.; Lin, D.; Deng, Y. An Energy-Efficient Clustering Routing Protocol Based on Evolutionary Game Theory in Wireless Sensor Networks. Int. J. Distrib. Sens. Netw. 2015, 11, 409503. [Google Scholar] [CrossRef]
- Nguyen, N.-T.; Le, T.T.; Nguyen, H.-H.; Voznak, M. Energy-Efficient Clustering Multi-Hop Routing Protocol in a UWSN. Sensors 2021, 21, 627. [Google Scholar] [CrossRef] [PubMed]
- Lalwani, P.; Das, S. Bacterial Foraging Optimization Algorithm for CH selection and routing in wireless sensor networks. In Proceedings of the 2016 3rd International Conference on Recent Advances in Information Technology (RAIT), Dhanbad, India, 3–5 March 2016; pp. 95–100. [Google Scholar]
- Rajabi, M.; Hossani, S.; Dehghani, F. A literature review on current approaches and applications of fuzzy expert systems. arXiv 2019, arXiv:1909.08794. [Google Scholar]
- Gupta, I.; Riordan, D.; Sampalli, S. Cluster-Head Election Using Fuzzy Logic for Wireless Sensor Networks. In Proceedings of the 3rd Annual Communication Networks and Services Research Conference (CNSR’05), Halifax, NS, Canada, 16–18 May 2005; pp. 255–260. [Google Scholar]
- Kim, J.-M.; Park, S.-H.; Han, Y.-J.; Chung, T.-M. CHEF: Cluster Head Election mechanism using Fuzzy logic in Wireless Sensor Networks. In Proceedings of the 2008 10th International Conference on Advanced Communication Technology, Phoenix Park, Republic of Korea, 17–20 February 2008; Volume 1, pp. 654–659. [Google Scholar] [CrossRef]
- Mao, S.; Zhao, C.-L. Unequal clustering algorithm for WSN based on fuzzy logic and improved ACO. J. China Univ. Posts Telecommun. 2011, 18, 89–97. [Google Scholar] [CrossRef]
- Xie, W.-X.; Zhang, Q.-Y.; Sun, Z.-M.; Zhang, F. A Clustering Routing Protocol for WSN Based on Type-2 Fuzzy Logic and Ant Colony Optimization. Wirel. Pers. Commun. 2015, 84, 1165–1196. [Google Scholar] [CrossRef]
- Baranidharan, B.; Santhi, B. DUCF: Distributed load balancing Unequal Clustering in wireless sensor networks using Fuzzy approach. Appl. Soft Comput. 2016, 40, 495–506. [Google Scholar] [CrossRef]
- Singh, D.; Kumar, B.; Singh, S.; Chand, S. A secure IoT-based mutual authentication for healthcare applications in wireless sensor networks using ECC. Int. J. Healthc. Inf. Syst. Inform. 2021, 16, 21–48. [Google Scholar] [CrossRef]
- Gupta, P.; Tripathi, S.; Singh, S. Energy efficient rendezvous points based routing technique using multiple mobile sink in heterogeneous wireless sensor networks. Wirel. Netw. 2021, 27, 3733–3746. [Google Scholar] [CrossRef]
- Singh, S.; Nandan, A.S.; Malik, A.; Kumar, N.; Barnawi, A. An Energy-Efficient Modified Metaheuristic Inspired Algorithm for Disaster Management System Using WSNs. IEEE Sens. J. 2021, 21, 15398–15408. [Google Scholar] [CrossRef]
- Nandan, A.S.; Singh, S.; Awasthi, L.K. An efficient cluster head election based on optimized genetic algorithm for movable sinks in IoT enabled HWSNs. Appl. Soft Comput. 2021, 107, 107318. [Google Scholar] [CrossRef]
- Chand, S.; Singh, S.; Kumar, B. Heterogeneous HEED Protocol for Wireless Sensor Networks. Wirel. Pers. Commun. 2014, 77, 2117–2139. [Google Scholar] [CrossRef]
- Dwivedi, A.K.; Sharma, A.K. EE-LEACH: Energy Enhancement in LEACH using Fuzzy Logic for Homogeneous WSN. Wirel. Pers. Commun. 2021, 120, 3035–3055. [Google Scholar] [CrossRef]
- Vijayashree, R.; Dhas, C.S.G. Energy efficient data collection with multiple mobile sink using artificial bee colony algorithm in large-scale WSN. Automatika 2019, 60, 555–563. [Google Scholar] [CrossRef]
- Manju; Singh, S.; Kumar, S.; Nayyar, A.; Al-Turjman, F.; Mostarda, L. Proficient QoS-Based Target Coverage Problem in Wireless Sensor Networks. IEEE Access 2020, 8, 74315–74325. [Google Scholar] [CrossRef]
- Xu, K. Silicon electro-optic micro-modulator fabricated in standard CMOS technology as components for all silicon monolithic integrated optoelectronic systems. J. Micromechanics Microengineering 2021, 31, 054001. [Google Scholar] [CrossRef]
- Bos, G. ISO 13485:2003/2016—Medical Devices—Quality Management Systems—Requirements for Regulatory Purposes. In Handbook of Medical Device Regulatory Affairs in Asia; CRC Press: Boca Raton, FL, USA, 2018; pp. 153–174. [Google Scholar]


Disclaimer/Publisher’s Note: The statements, opinions and data contained in all publications are solely those of the individual author(s) and contributor(s) and not of MDPI and/or the editor(s). MDPI and/or the editor(s) disclaim responsibility for any injury to people or property resulting from any ideas, methods, instructions or products referred to in the content. |
© 2024 by the authors. Licensee MDPI, Basel, Switzerland. This article is an open access article distributed under the terms and conditions of the Creative Commons Attribution (CC BY) license (https://creativecommons.org/licenses/by/4.0/).