Article

Correlation between Biomarkers and Severity of Clinical Categories in COVID-19 Patients: A Hospital-Based Study in Arunachal Pradesh, India

1
Department of Pathology, Tomo Riba Institute of Health and Medical Sciences, Naharlagun 791110, Arunachal Pradesh, India
2
Department of Respiratory Medicine, Tomo Riba Institute of Health and Medical Sciences, Naharlagun 791110, Arunachal Pradesh, India
3
Department of Pediatrics, Tomo Riba Institute of Health and Medical Sciences, Naharlagun 791110, Arunachal Pradesh, India
4
Department of Community Medicine, Tomo Riba Institute of Health and Medical Sciences, Naharlagun 791110, Arunachal Pradesh, India
5
Department of Multidisciplinary Research Unit (MRU), Tomo Riba Institute of Health and Medical Sciences, Naharlagun 791110, Arunachal Pradesh, India
*
Authors to whom correspondence should be addressed.
COVID 2024, 4(8), 1157-1171; https://doi.org/10.3390/covid4080081
Submission received: 5 May 2024 / Revised: 8 July 2024 / Accepted: 22 July 2024 / Published: 30 July 2024

Abstract

:
Background: The COVID-19 pandemic has brought about widespread effects on communities on a global scale, with impacts varying among different demographics. This study focuses on a unique cohort of COVID-19-positive patients from Arunachal Pradesh, a region in northeast India with a substantial indigenous population. This study aims to delve into the features and consequences of COVID-19 in this indigenous population within this distinct demographic region, with a special focus on assessing the effects on tribal communities. Out of a total of 1627 COVID-19 positive cases, 1392 belonged to various tribes of Arunachal Pradesh, categorized as the indigenous population of the region. Our research primarily focuses on examining the biochemical and inflammatory indicators that forecast the clinical results of COVID-19 patients, specifically within both indigenous and non-indigenous groups. Methods: Biochemical markers, including hematological parameters, liver and kidney function biomarkers, D-DIMER, and inflammatory markers, were assessed along with immune-inflammatory ratios: neutrophil-to-lymphocyte ratio (NLR) and lymphocyte-to-monocyte ratio (LMR). Differences in biomarker levels and ratios across disease severities were analyzed, and significant data were observed using descriptive statistics. Results: Elevated levels of Ferritin (CRP, IL-6, D-DIMER, Creatinine, Urea, AST/SGOT, and ALT/SGPT) were associated with increasing disease severity in COVID-19 cases, reflecting increased inflammation, multi-organ dysfunction, and coagulopathy in the severe COVID-19 category amongst the indigenous population. The data showed an aligned report with the non-indigenous population of India when compared with various other studies (using a Spearman rank correlation test). Similarly, an increase in the neutrophil-to-lymphocyte ratio (NLR) and a declining shift in the lymphocyte-to-monocyte ratio (LMR) indicated deregulated immune responses and systemic inflammation in the severe category of COVID-19. Conclusion: This population-based study from northeast India offers important perspectives into the pathophysiology of COVID-19 and its link with disease severity among indigenous and non-indigenous populations.

1. Introduction

The SARS-CoV-2 virus that causes COVID-19 disease has brought a lot of health crises and challenged the healthcare system throughout the world. The virus SARS-CoV-2 infected many individuals from diverse demographics [1]. Different research suggested that different ethnic and indigenous populations faced distinct challenges due to this virus [2,3,4]. People belonging to ethnic and indigenous populations have varied healthcare access, cultural practices, and socioeconomic status; this variation has impacted the susceptibility and outcomes of infectious diseases in these groups [5,6]. Studies on the relationship between biochemical markers, immune-inflammatory responses, and the severity of COVID-19 within ethnic and indigenous populations have highlighted several important findings across the globe [7]. These biochemical markers, including IL-6, Ferritin, CRP, D-DIMER, Creatinine, Urea, AST, ALT, and NLR, serve as molecular indicators and play a crucial role in the development and etiology of COVID-19 [8]. Of all the different biochemical markers involved in COVID-19 pathophysiology, IL-6 emerged as the primary causative agent of the cytokine storm syndrome, responsible for its severe clinical symptoms [9]. Increased levels of IL-6 in the serum have been detected in all the COVID-19 patients, with variations correlating directly with the severity of the disease and directly with respiratory diseases. Genetic polymorphisms and environmental factors can modulate IL-6 expression and signaling pathways in ethnic and indigenous populations [10]. This increases the variability of susceptibility to cytokine dysregulation and the progression of the disease among individuals [8]. Ferritin, a crucial component of iron metabolism and an acute-phase reactant, is a crucial biomarker for measuring the severity and anticipating the consequences of COVID-19 [11]. Elevated serum Ferritin levels have been linked with hyper-inflammatory states, coagulopathies, and an increased death rate in COVID-19 patients [12]. C-reactive protein (CRP) is another biomarker that is often synthesized in response to inflammatory stimuli. This biomarker offers valuable information on systematic inflammation and COVID-19 disease progression [13]. The elevated level of this biomarker is mainly associated with severe respiratory diseases, thrombotic complications, and a higher risk of fatality in COVID-19 patients. CRP serve as a predictive marker for predicting disease severity and the response to treatment [14]. D-DIMER, a fibrin breakdown product, is recognized as a vital biomarker for assessing vascular dysfunction and thrombotic risk in COVID-19 patients. Escalated D-DIMER levels are typically found in severe COVID-19 cases. It is mainly linked with thrombotic risk, organ dysfunction, and mortality [15]. Creatinine and Urea biomarkers provide valuable information about renal function and metabolic homeostasis in COVID-19 patients. This disease severely affects the kidneys and causes acute kidney injury, which is associated with elevated levels of serum Creatinine and Urea; thus, these biomarkers are used to predict disease severity and mortality [16]. AST (aspartate transaminase) and ALT (alanine transaminase) are biochemical markers used for the prediction of liver dysfunction and hepatocellular injuries. The neutrophil-to-lymphocyte ratio (NLR) and lymphocyte-to-monocyte ratio (LMR) are additional biochemical markers, and their ratios are utilized to predict systemic inflammation and immune response in COVID-19 patients. Higher NLR and lower LMR levels are linked to increased disease severity and immune dysfunction in COVID-19 patients [17]. This study focuses on evaluating the predictive effectiveness of various biochemical and inflammatory markers, which include IL-6, Ferritin, CRP, D-DIMER, Creatinine, Urea, AST, ALT, neutrophil-to-lymphocyte ratio (NLR), and lymphocyte-to-monocyte ratio (LMR), in a group of indigenous COVID-19 patients hospitalized at DCH (Dedicated COVID-19 Hospital) in the state of Arunachal Pradesh, India. This state, located in the northeast region of India, comprises a Mongoloid race of tribal ethnicity population, which is different from the rest of the states in India. Hence, this study will help in revealing the relationships between these biomarkers, which will help in different strategies like risk management, therapeutic interventions, and resource allocation in the healthcare system across different communities.

Regional Significance of the Study

According to the Indian Census, a significant proportion of the population in Arunachal Pradesh is composed of Scheduled Tribes (STs). Even anthropological and ethnographic studies have documented the existence of various tribal groups in Arunachal Pradesh for centuries. Genetic research has shown that the tribal populations of Arunachal Pradesh have distinct genetic markers that differentiate them from other populations in India, supporting their indigenous status. The tribal populations of Arunachal Pradesh are considered indigenous to the region. They have inhabited the area for centuries and have developed unique cultural and social systems that are deeply connected to their ancestral lands.
Mongolians are not typically considered a major non-autochthonous population in Arunachal Pradesh. The region’s demographic composition is primarily made up of various indigenous tribal groups, as mentioned earlier. As per the poor study group description that has been mentioned, the indigenous tribal population of Arunachal Pradesh has a variety of last name patterns that reflect their unique cultural and ethnic identities. These surnames often denote the individual’s tribal affiliation, clan, or lineage.
As far as the heterogeneity of the population is concerned, there are some non-indigenous (non-autochthonous) populations in Arunachal Pradesh, which have been acknowledged in the manuscript; they usually consist of people from other parts of India who migrated to the state for various other purposes (business, education, government service, refugees). We have not included them in the study, categorizing them as an indigenous population. However, as our study is a randomized and retrospective study on the non-homogenous population of Arunachal Pradesh, in Figure 1, we have distributed the admitted COVID-19-positive population as per the disease severity under two categories (the natives of Arunachal Pradesh as the “Indigenous population” and the immigrants as the “non-indigenous population”).

2. Methodology

2.1. Study Design and Population

This retrospective observational research involves analyzing clinical data from patients diagnosed with COVID-19 who were treated at the Dedicated COVID-19 Hospital (DCH) situated in Chimpu, part of the Tomo Riba Institute of Health and Medical Sciences (TRIHMS) in the state of Arunachal Pradesh, India.

2.2. Inclusion Criteria

The study includes 1627 patients with positive COVID-19 cases admitted during the period of August 2020 and January 2022. Out of this, 1392 patients diagnosed positive for COVID-19 were found to be of tribal ethnicity from the state of Arunachal Pradesh, which is a tribal region in India. In this study, the autochthonous population was categorized as the Indigenous population group, and the population from outside the state of Arunachal Pradesh has been categorized as the Non-Indigenous population (total of 235 patients).

2.3. Exclusion Criteria

Any cases left against medical advice from the COVID-19 Dedicated Hospital.

2.4. Ethical Considerations

The study was conducted following ethical guidelines, ensuring patient confidentiality, and obtaining necessary approvals from relevant institutional review boards. Informed consent was not incumbent, as this is a retrospective study. The data of the included patients were anonymized. The approval from Institutional Ethics Committee (IEC) of TRIHMS, Arunachal Pradesh, India, has been obtained for this study under IEC Code-TRIHMS/ETHICS/01/2019-20/8, dated 29 October 2021. The diagnosis of COVID-19 was confirmed according to the protocols established by the Ministry of Health and Family Welfare, Government of India.
The test carried out to confirm the diagnosis was RTPCR (qPCR) on nasopharyngeal and oropharyngeal samples. The participants included in the study were of any age group. In this analysis, the patients were categorized into three categories:
(a)
Mild category consisting of non-severe patients with symptoms of sore throat, fever, and cough.
(b)
Moderate category consisting of patients with symptoms of mild category along with the symptom of breathlessness with oxygen saturation (SPO2) of 90% to <93%.
(c)
Severe category, which included patients with symptoms of septic shock, breathlessness, SPO2 < 90%, respiratory failure, and/or multiple organ dysfunction.

2.5. Data Extraction and Quality Assessment

2.5.1. Biochemical Analysis

Clinical data included current symptoms/complaints, demographic information such as age, gender, and laboratory tests, which include hematological parameters (Hb%, WBC count, RBC count and indices, platelet count, and ESR), inflammatory markers (Ferritin, IL-6, CRP), D-DIMER, serological liver function test parameters (bilirubin-total, direct and indirect, total protein and globulin, AST/SGOT, and ALT/SGPT), and serological kidney function test parameters (Creatinine, Urea), which were routinely done for the admitted COVID-19 patients. The hematological and inflammatory markers with D-DIMER level tests were measured quantitatively using the Mindray 5 Part hematology analyzer (as per the manufacturer’s protocol using the same manufacturer’s reagents) and the Maglumi 800 from the company SNIBE (as per the manufacturer’s protocol using the recommended reagents from the same manufacturer), respectively. Hence, we collected the results of these tests (done during the acute phase of infection and on the first day of hospitalization) for the mild, moderate, and severe categories. Both serological liver and kidney function test parameters were estimated using a Rayto Semi-Auto chemistry analyzer (as per the manufacturer’s protocol and reagents from DIATEK). Electrolytes (sodium, potassium, and chloride) were analyzed using a Diestro Electrolyte Analyzer from the company JS Medicina Electronica (as per the manufacturer’s protocol using their recommended reagents from the same manufacturer). Thereafter, the neutrophil-to-lymphocyte ratio (NLR) and lymphocyte-to-monocyte ratio (LMR) were derived from quantitative values estimated using the Mindray 5-part hematological analyzer (as per the manufacturer’s protocol using their recommended reagents from the same manufacturer). Following a thorough review of the laboratory data, patients’ biochemical test results were included in this study to analyze significant differences in biomarker levels.

2.5.2. Statistical Analysis

To summarize the data, descriptive statistics were applied using SPSS 22.0. The data gathered underwent a normality test, after which quantitative values were presented as either mean ± SD (standard deviation) or median. Patient severity was assessed based on the management guidelines established at the time by the Government of India. Also, a series of non-parametric tests (such as a Spearman rank correlation test, Mann–Whitney U test, and Kruskal–Wallis test) were conducted to investigate if there was any difference/correlation between inflammatory markers (Ferritin, Il-6, and CRP), D-DIMER, and the ratios of NLR and LMR with the severity of COVID-19 clinical categories (mild, moderate, and severe).

3. Results

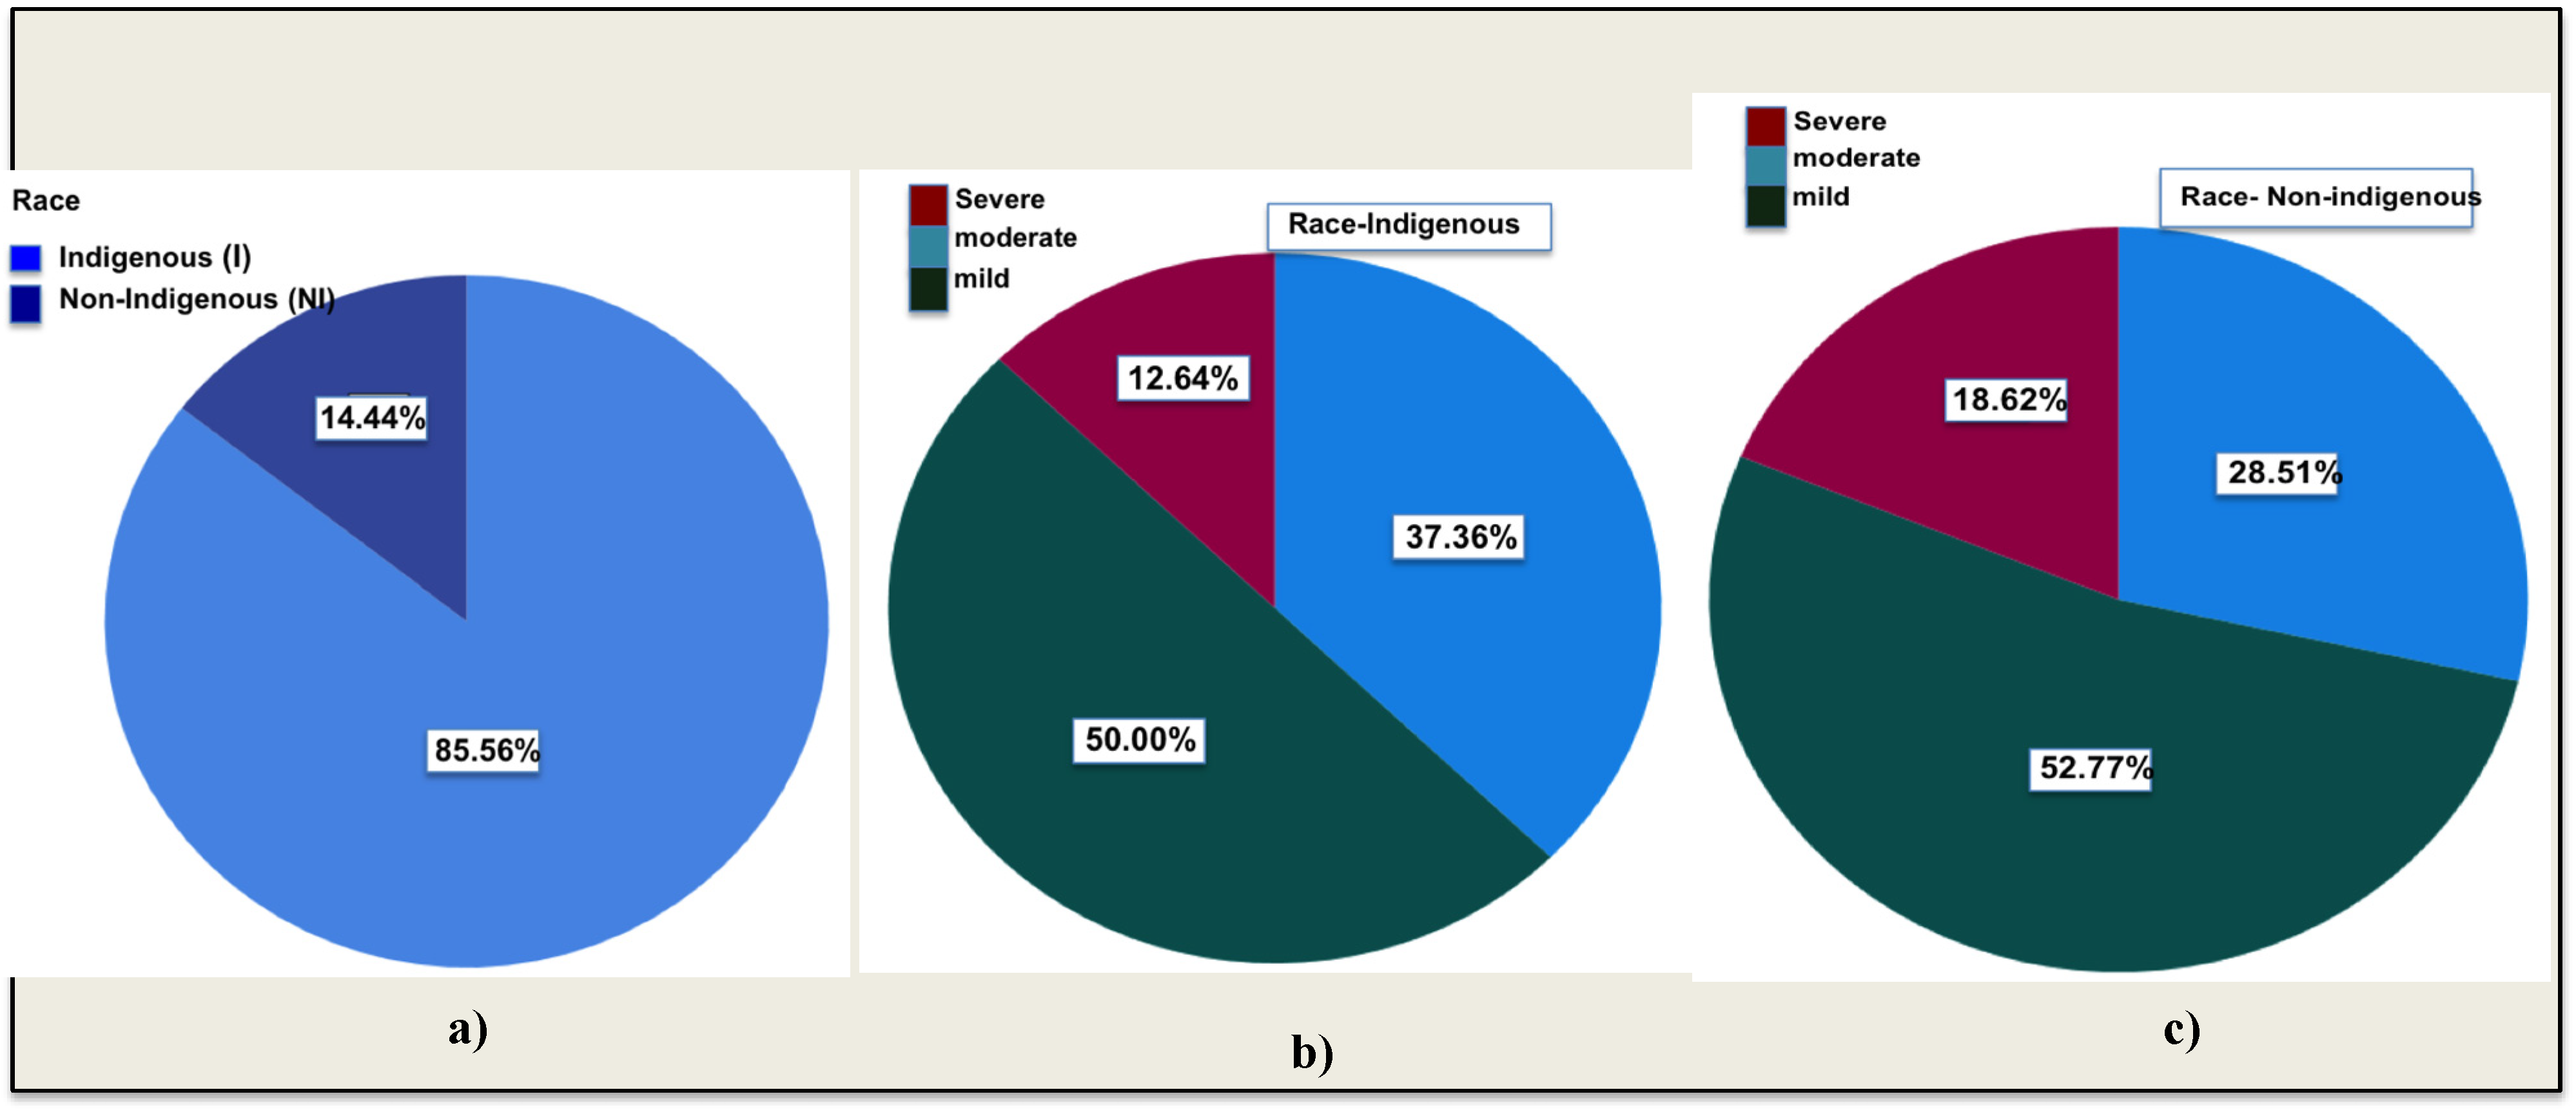
3.1. Study Population

In the course of this retrospective assessment, we have reviewed the data collected for (n) = 1627 (mixed race of indigenous and ethnic race and non-indigenous population) COVID-19 positive patients’ biochemical test data. Out of the total mixed-race population, the study target population was found to be 1392 (85.56%) patients consisting of indigenous population and 235 (14.44%) patients of non-indigenous population, as seen in Figure 1a.

3.2. Disease Severity

The severity of the disease in both races was assessed, i.e., indigenous and non-indigenous. The selected individuals were categorized into three categories: mild, moderate, and severe. Among the indigenous population, around 37.36% of individuals had mild symptoms of the disease, while 50.00% showed moderate symptoms and 12.64% had severe symptoms of the disease. In the non-indigenous population, 28.51% of individuals were found to have mild symptoms, with 52.77% falling into the moderate category and 18.72 patients turning out to have severe symptoms (Figure 1b,c).
A Kolmogorov-Smirnov test was carried out in the entire study population, and the conclusive data suggested the parameters did not follow a normal distribution; hence, the entire tests conducted during the study were non-parametric tests. As a means of non-parametric testing, the Mann–Whitney U test was performed in the mixed-race population to see any difference in the cumulative parameters (Table 1).
Age (p < 0.05) was seen to be significantly different between the study population of indigenous and non-indigenous races in the region. Ferritin and IL-6 (inflammatory markers) were found to be at lower levels (non-significant) in the indigenous population when compared with the markers in the non-indigenous population. However, one of the inflammatory markers, C-reactive protein (CRP), was seen to be enhanced in the indigenous race population compared with the non-indigenous race population.
Table 2 reports the Spearman rank correlation test (non-parametric), showing the comparison in the levels of biochemical parameters in the COVID-19 patients from the target indigenous population of Arunachal Pradesh (northeast India) alongside the biochemical parameters from the reference study group of eastern India (non-indigenous population) carried out by Suchitra Kumari et al. [18]. When compared for the correlation of the tests performed, the correlation p value was less than 0.0001 (significant in nature).

3.3. Analyzing Biomarkers: Assessing COVID-19 Severity across Indigenous Population

A number of Kruskal–Wallis tests that are non-parametric t tests were performed. The test is to investigate the differences in various parameters with a non-uniform distribution between three clinical categories in the target study group of COVID-19-diagnosed patients from the indigenous population.

3.3.1. Inflammatory Marker Levels (Figure 2a–c)

When the inflammatory marker IL-6 was assessed using a Kruskal–Wallis test, it indicated a statistically significant difference in IL6 for all the included clinical categories (mild, moderate, and severe), as the p-value is less than 0.05. Post hoc comparison with Bonferroni adjustment demonstrated no significant distinction between mild and moderate categories. However, the severe category is significantly different from the mild and moderate categories. The median IL6 value for the severe category is 48.08, which is higher than both the mild and moderate categories, with median scores of 23.52 and 15.23, respectively, as seen in Figure 2a.
Figure 2. Levels of different inflammatory biomarkers in the target study population. (ac) indicates the levels of Il-6, Ferritin, and CRP biomarkers; (d,e) the levels of NLR and LMR ratios in the COVID-19 patients from the target indigenous population.
Covid 04 00081 g002
For one of the inflammatory markers, Ferritin, the test indicated a statistically significant difference for the three clinical categories (mild, moderate, and severe), as the p-value is less than 0.05. Post hoc comparison with Bonferroni adjustment showed no significant difference between the moderate and severe categories. However, the mild category is significantly different from the moderate and severe categories. The median Ferritin value for the mild category was 194.70, which is significantly lower than compared with the moderate and severe categories, with median values of 516.65 and 559.60, respectively (Figure 2b).
The CRP (c-reactive protein) in the mild category shows 36,492.84 as the median value and 52,968.87 in the moderate category, while the severe category shows 62,329.33 as the median value. Significant variations in CRP levels were observed across the three clinical categories. A post-hoc comparison with the Bonferroni adjustment suggested that the only notable difference was between the mild and severe categories. No significant difference was seen between the other categories (Figure 2c). However, the test has shown that there is a significant difference in CRP for the three clinical categories (mild, moderate, and severe). Post hoc comparison with Bonferroni adjustment reported that the difference between the mild and severe categories was a very significant difference, whereas the variations among the other categories did not reach any statistical relevance.

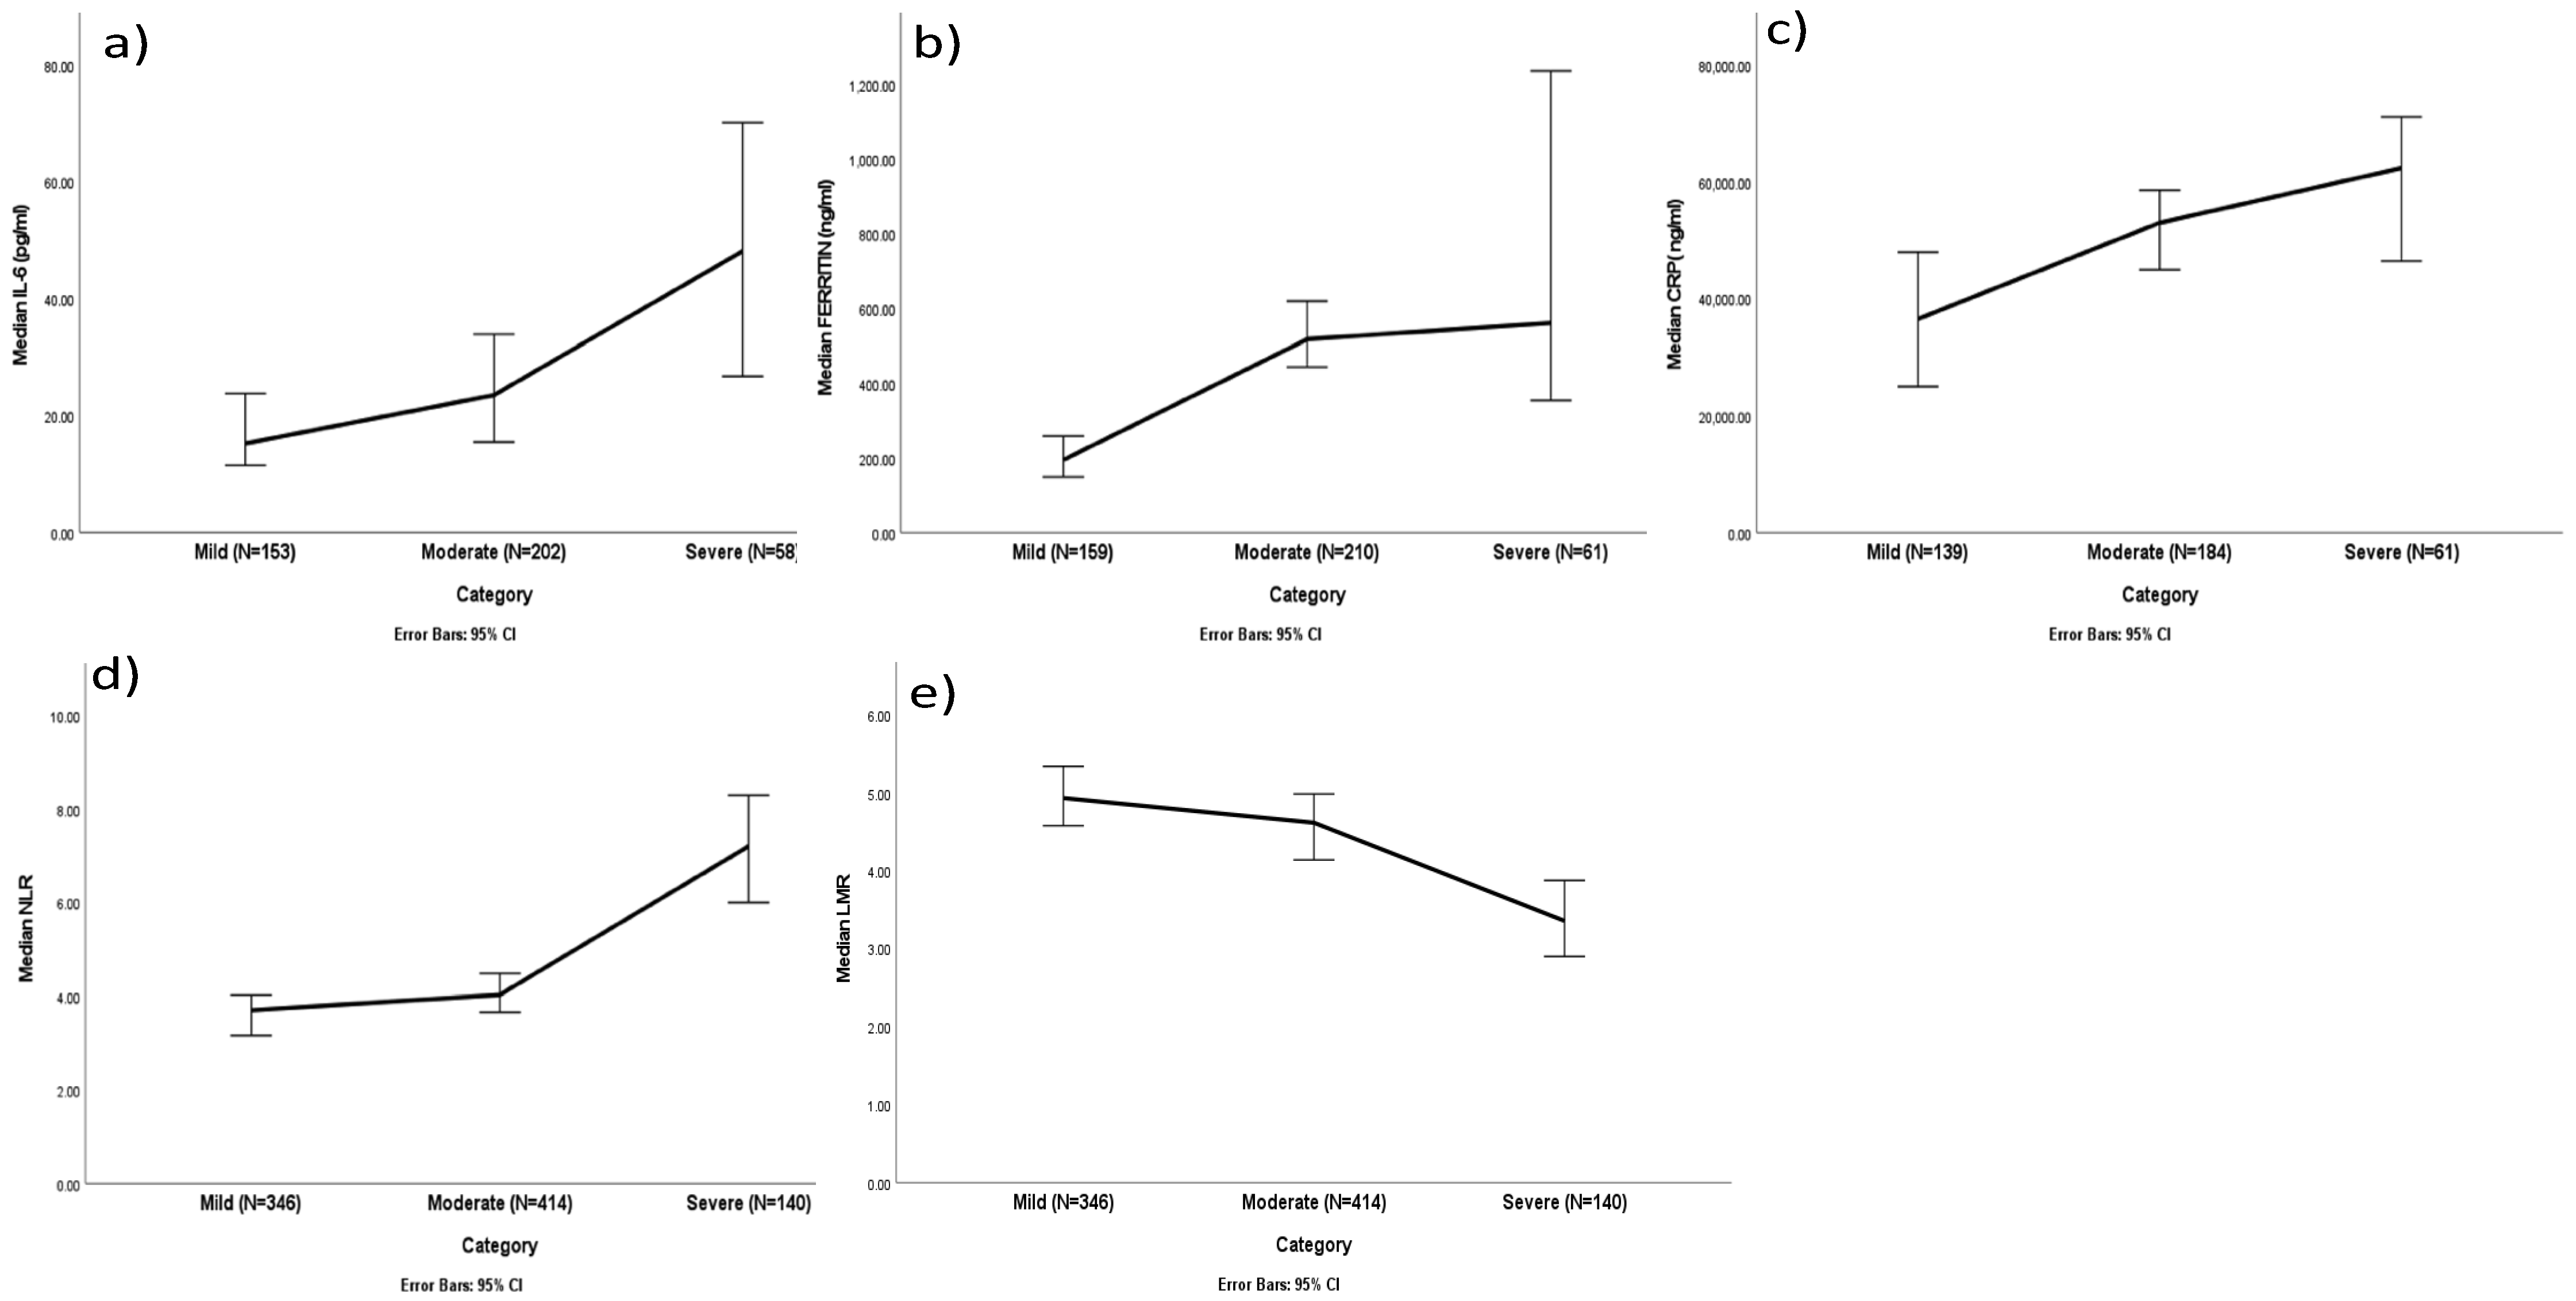
3.3.2. Neutrophil-to-Lymphocyte Ratio (NLR) and Lymphocyte-to-Monocyte Ratio (LMR) (Figure 2d,e)

Neutrophil-to-lymphocyte ratio (NLR) showed a median value of 3.70 in the mild category and 4.02 in the moderate category, whereas the median value for the severe category was seen to be 7.20, which was significantly higher in level compared with the mild and moderate categories. With a p-value less than 0.001, it is concluded that there is a significant elevation of NLR in the three clinical categories. The increasing trend of the median NLR from mild to severe suggests that as the clinical condition worsens, the NLR increases, which could be indicative of a higher inflammatory response or physiological stress. The analysis of lymphocyte-to-monocyte ratio (LMR) has shown a declining shift in median values of 4.93, 4.61, and 3.35 in the mild, moderate, and severe categories, respectively, with each showing a p-value below 0.001, hence concluding that there is a notable difference holding statistical significance in LMR across the categories of clinical severity, with LMR decreasing as the clinical category worsens from mild to severe.

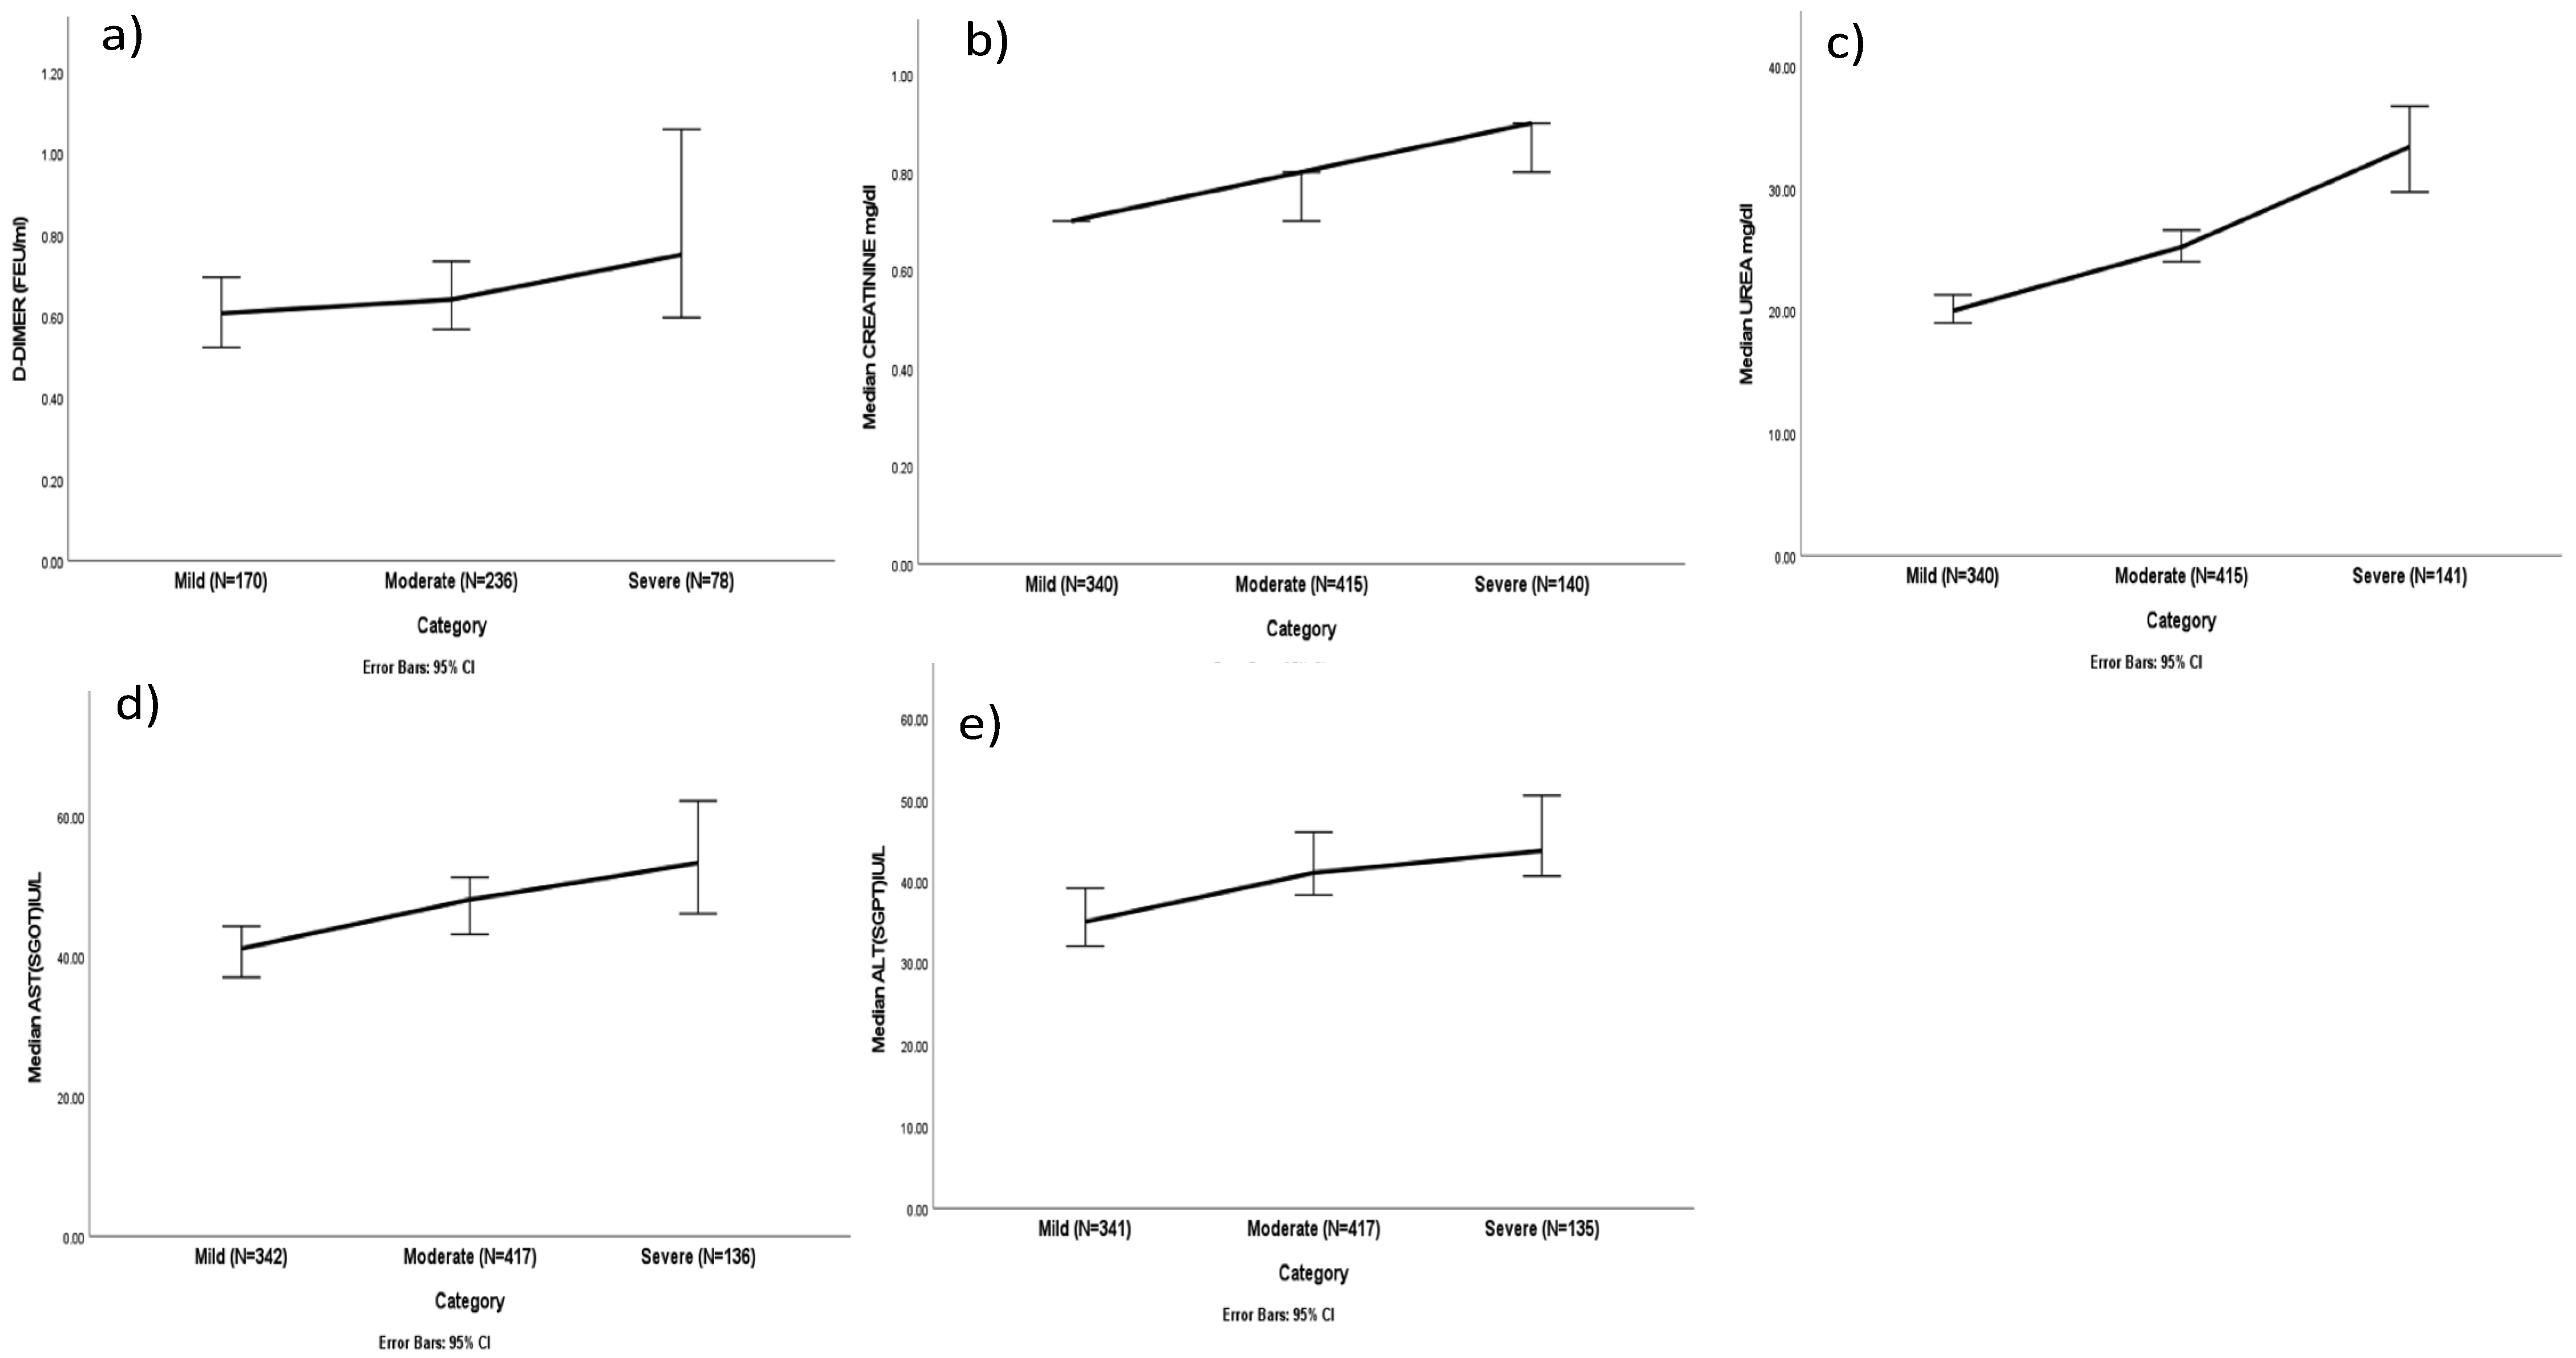
3.3.3. D-DIMER Level

The median D-DIMER level/valves of the mild, moderate, and severe categories were 0.61, 0.64, and 0.75, respectively, with a p-value of 0.037. No notable difference was seen among categories other than the mild and severe categories, as seen in Figure 3a.

3.3.4. Renal and Hepatic Function Biomarker Levels

Creatinine level was then assessed, with the mild category showing 0.70 as the median mean value, 0.80 as the moderate category, and 0.90 as the severe category, with a p-value of <0.001 indicating that there is a significant difference in Creatinine for the three clinical categories. A post-hoc comparison with a Bonferroni adjustment suggested that the difference between each pair of mild, moderate, and severe categories was statistically significant. The Urea level also gives significant information about the disease severity; for this purpose, the Urea level was also evaluated in the target study group across different clinical categories. The result indicated a median value of 20.00 in the mild category of patients, 25.20 as the median value within the moderate category, and 33.40 as the median value in the severe category. The test indicated a significant difference in the renal marker, Urea, in each of the three clinical categories with a p-value of <0.001 (Figure 3b,c).

3.3.5. Hepatic Markers

AST/SGOT and ALT/SGPT levels were evaluated to understand their role in COVID-19-diagnosed patients from the indigenous population across different categories (mild, moderate, and severe) during the infection. It was seen that the median values of AST/SGOT were 41.00, 48.00, and 53.25 in the mild, moderate, and severe categories, respectively, and 35.00, 41.00, and 43.70, respectively, for ALT/SGPT. The median of both biomarkers with p-values (<0.001) has been found to be elevated in a linear progression with respect to all three different clinical categories (mild, moderate, and severe). A significant difference was seen between the mild and moderate categories in both markers (Figure 3d,e).

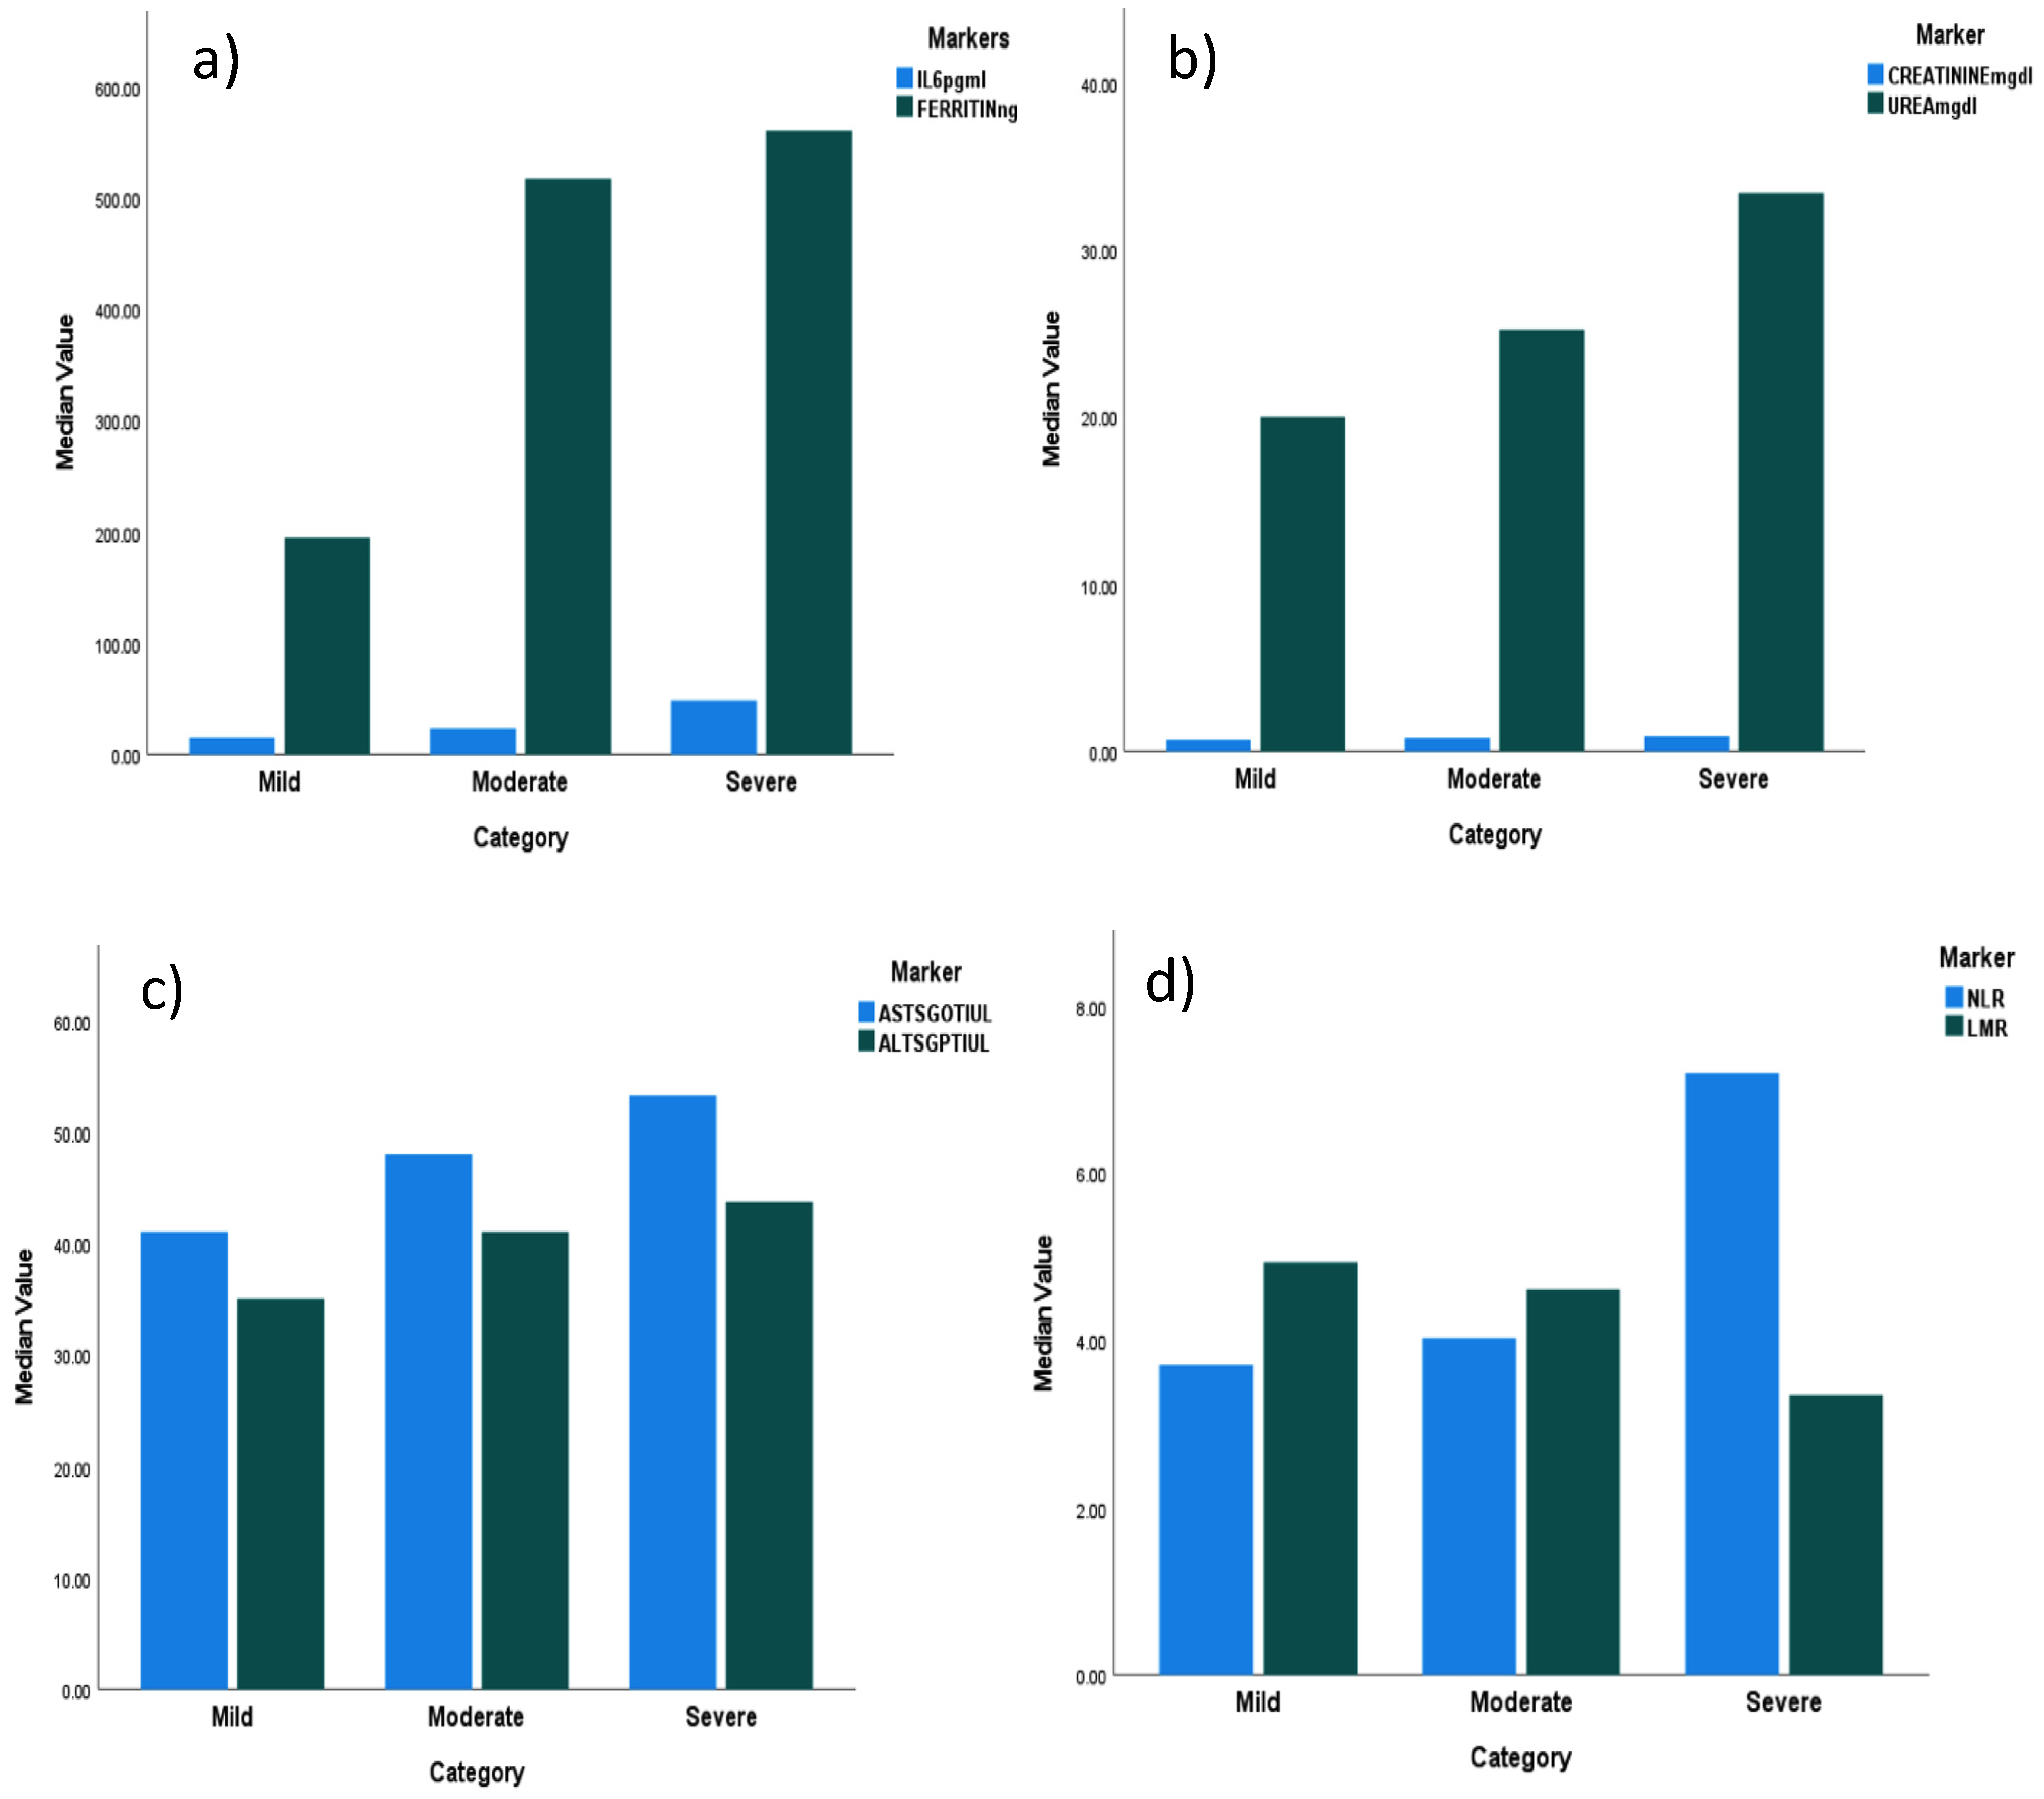
3.4. Comparative Analysis of Different Biomarker Levels across COVID-19 Clinical Outcomes

The biochemical and inflammatory marker levels of COVID-19 patients from the target group of indigenous populations were overlaid for a direct comparison of their patterns across the different clinical severity levels.
IL-6 vs. Ferritin and Creatinine vs. Urea have shown a similar pattern of linear progression, moving from mild to severe category patients, which underscores a consistent inflammatory response correlating with the worsening of the disease. Hence, these markers have played a significant role in understanding their correlation with disease severity (Figure 4a,b).
Comparing the trends of AST/SGOT vs. ALT/SGPT and NLR vs. LMR directly offered insights into the overall involvement of liver function, immune status, and inflammatory response of patients across different severity levels during infection with any disease. When compared, with a p-value less than 0.001, it was seen that there is an incremental increase of AST/SGOT and ALT/SGPT levels from mild to severe categories, hence suggesting both as crucial indicators used for evaluating the disease severity in COVID-19 cases from the indigenous population. In accordance with the other markers and with a p-value less than 0.001, it can be seen that there is a simultaneous increase in NLR, but LMR has shown a declining shift throughout the mild to moderate (non-severe) and severe clinical categories, typically underscoring a shift towards a pro-inflammatory and immunosuppressive state (Figure 4c,d).

4. Discussion

Several studies have identified biomarkers (hematological parameters, inflammatory, and biochemical markers) linked with COVID-19 infection and its severity, yet few have compared COVID-19 patient cohorts based on racial and ethnic differences in northeast India. This retrospective study analyzes significant differences in biomarker levels and ratios across mild, moderate, and severe categories. Such analysis, as the first of its kind in the said population, sheds light on the underlying pathophysiological mechanisms driving different clinical outcomes in COVID-19 patients from the indigenous population of Arunachal Pradesh (northeast India).
We first compared the correlation of different biochemical and demographic parameters using a Spearman rank correlation test (non-parametric) between the indigenous population (n = 592) of northeast India (Arunachal Pradesh) and the non-indigenous population (n = 7395) of eastern India, according to a study by Suchitra Kumari et al. [18]. The data from the correlation test suggested a strong correspondence exists between both the target and control study populations, with a significant value of p below 0.0001 and an r-value equivalent to 0.9876 (Table 1). Hence, this study suggested that the predicting parameters, biochemical (Creatinine, Urea, AST/SGOT, ALT/SGPT, bilirubin), and inflammatory (CRP, Ferritin, IL-6) during COVID-19 infection behave very similarly in both the indigenous and non-indigenous populations of India. Despite the potential cultural, environmental, or genetic differences, the underlying biological processes or health outcomes represented by these parameters imply similarity across these two populations.
CRP has been studied as a useful marker to predict the chances of exacerbation in non-severe adult COVID-19 patients with a threshold value of 26.9 mg/L [19]. CRP as an inflammatory marker has been studied as one of the excellent indicators of inflammation during the acute phase of infection, is produced in the liver, and has been found to be the best surrogate for IL-6 [20,21]. Zeng F. et al. [22] reported that Ferritin levels greater than 621.4 ng/mL act as a predictive marker with respect to disease severity during COVID-19, but with a somewhat lower sensitivity and specificity when compared with CRP. This may be explained by Ferritin’s propensity to rise in liver illness, cancer, and inflammatory conditions. The outcome aligns with the meta-analysis reported, demonstrating Ferritin to be a potent discriminator for severe illness [20].
Sarraf et al. [23], a study based on the non-indigenous population from Central India, showed mean values of CRP (mg/dL) in the mild, moderate, and severe categories as 43.29, 320.5, and 1865.13, respectively. Also, it showed mean values of S. Ferritin (Serum Ferritin quoted as per the authors) of 206.82, 456.9, and 612.80 in three different categories. Hence, it showed a significantly higher mean of CRP with a p value less than 0.05 in the severe category compared with the mild and moderate cases and reported the level of S. Ferritin (Serum Ferritin quoted as per the authors) being significantly higher among severe cases as compared with non-severe cases (mild and moderate) with a p < 0.05 [23]. However, in the current non-parametric study, the median CRP (mg/dL) value across mild, moderate, and severe categories has been found to be 36,492.84, 529,68.87, and 62,329.33, respectively (Figure 2c), and the median values for Ferritin have been reported to be 194.70, 516.56, and 559.60 for the mild, moderate, and severe categories, respectively (Figure 2b). The median CRP (p < 0.05) showed a significantly elevated level among the mild and moderate categories as compared with the moderate and severe cases. A similar pattern could be seen in the case of Ferritin.
When compared for a correlation with the non-indigenous population study by Sarraf et al. [23], the indigenous population showed significantly higher median values in all categories as compared with the significant mean difference in the severe category of the non-indigenous population. The statistical significance in both tables showed that CRP levels effectively differentiate between clinical severities in both populations.
Aggravated levels of inflammatory markers like IL-6 serve as an indication of an intensified inflammatory reaction, frequently seen in the severe category of COVID-19 [24]. The escalating levels of these inflammatory markers as the disease progresses underscore the significance of systemic inflammation in shaping the clinical course of COVID-19 [25]. IL-6 has been reported to be a pivotal pro-inflammatory cytokine. IL-6 plays a significant role in the cytokine storm syndrome linked to severe disease presentations, while Ferritin indicates immune dysregulation and hyper-inflammation. The observed elevation in IL-6 and Ferritin levels with disease severity suggests an inconsistent increase in inflammatory cytokine levels, reflecting an elevated inflammatory state in more severe cases [26]. Bhandari et al. and Gill G et al. have also based their study on the non-indigenous population of India and have suggested that the increased IL-6 levels were linked with the severe COVID-19 cases [27,28]. The present study is in concurrence with showing a significant difference in IL-6 across these different categories (p-value < 0.001), indicating that IL-6 levels escalate with increasing disease severity (Figure 2a).
Within this retrospective investigation, median values of D-DIMER have been shown as 0.61, 0.64, and 0.75 in the mild, moderate, and severe categories, respectively. This present study suggests a significant difference with a p-value and test statistic (0.037 and 6.585), respectively, albeit the changes in median levels across categories are relatively small (Figure 3a). When compared with the study based on non-indigenous populations by Sarraf et al. [23], the mean value of D-DIMER with a p-value of 0.04 in the non-indigenous population showed much higher levels and greater variability, especially in the moderate and severe categories.
Biochemical markers, including Creatinine, Urea, AST/SGOT, and ALT/SGPT, demonstrate notable alterations across different disease severities. The observed increase in Creatinine and Urea levels with disease severity suggests impaired renal function and dehydration, which are common complications in severe COVID-19 cases. Similarly, alterations in AST and ALT levels indicate potential liver involvement and hepatocellular injury, reflecting the multi-organ dysfunction observed in the severe COVID-19 case [29]. In our retrospective evaluation/investigation, the median values of these biochemical parameters, with a p-value of 0.001, gave an insight suggesting that their elevation is directly proportional to the severity and advancement of the disease in the indigenous population (Figure 3d,e).
In this current non-parametric study, the median values of NLR/LMR in the mild, moderate, and severe categories have been calculated as 3.70, 4.02, and 7.20, respectively. The median NLR ratio with a p-value below 0.001 showed a substantial escalation, notably with the disease severity as compared with the mild and moderate categories. NLR and LMR ratios serve as markers of systemic inflammatory response and immune dysregulation [30]. The observed increase in NLR and the significant decrease in LMR with disease severity suggest a dysregulated immune response characterized by neutrophil activation, lymphocyte depletion, and monocyte recruitment, contributing to the cytokine cascade and tissue damage observed in the severe category of COVID-19 cases [31]. NLR is a better biomarker for the systemic inflammatory response and severity of COVID-19 compared with a single neutrophil or lymphocyte count [32]. Singh et al. (2023), in their study based on Northern India with a non-indigenous group as their study population, have suggested a stark contrast between non-severe and severe cases, which is further underscored by a significant negative test statistic (−17.723) and a very low p-value (<0.0000), confirming a strong association of higher NLR with severe disease states [31]. Hence, aligning with the current study stating that, in both the indigenous and non-indigenous populations, the severe category demonstrates a significant elevation in NLR, aligning with the increased physiological demand and stress associated with more severe disease.
This present study has shown the median values of LMR (lymphocyte-to-monocyte ratio) as 4.93, 4.61, and 3.35 in the mild, moderate, and severe categories, respectively. LMR shows a significant decline in its median value (p < 0.001), clearly indicating that the decline in LMR aligns with the increasing intensity of the disease severity condition (Figure 2d,e).
Singh et al. (2023) suggested a mean value of LMR of 4.69 (low), indicating statistically substantial differences (p < 0.05) among non-severe and severe cases. Hence, the decrease in LMR in the severe category between both populations (indigenous and non-indigenous) suggests a compromised immune response or an escalation in inflammation, which is typical in the more severe disease of COVID-19 infection [31].
The findings of our study align with the various studies based on the non-indigenous population of other parts of India, conducted by Gupta D et al. and Sakthivadivel V et al. [33,34]. Hence, these studies have several implications for clinical practice and patient management. The findings of this study collectively emphasize the utility of these biochemical, immune-inflammatory biomarkers and cytokines in understanding the underlying pathophysiological differences between populations of indigenous and non-indigenous regions. This can aid in assessing disease severity and guiding treatment strategies, while also highlighting the need to consider population-specific differences when interpreting these biomarkers. Early recognition of high-risk individuals through biomarker profiles could facilitate timely intervention and allocation of resources, enhancing both patient outcomes and healthcare resource management [35].

5. Conclusions

The analysis of biomarkers across different clinical severities in indigenous and non-indigenous populations provides several key insights into disease progression and immune responses:
CRP levels: Both populations show increased CRP levels with greater disease severity, indicating a robust inflammatory response. Non-indigenous populations exhibited significantly higher variability and overall levels in severe cases, suggesting differences in clinical manifestations or responses to treatment between the groups.
Ferritin: Ferritin levels also rose with increasing severity in both groups, with indigenous populations showing slightly lower levels in severe conditions. This underscores Ferritin’s role as a marker of immune system activation and inflammation.
IL-6: This cytokine, crucial in the body’s inflammatory response, showed elevated levels correlating with the disease severity in the indigenous population. The non-indigenous data indicated an unexpected pattern with a decrease in severe cases, which may suggest different immune regulatory mechanisms or treatment efficiencies.
NLR: A clear increase in NLR with disease severity was observed in both groups, with severe cases in non-indigenous populations showing an especially pronounced increase, which might be indicative of severe infection or systemic inflammation.
LMR: there was a general decline in LMR with increasing disease severity, pointing to a potential suppression of the lymphocyte-mediated immune response or enhanced monocyte-driven inflammation in more severe cases.
The marked differences or correlation between the indigenous and non-indigenous populations also suggest that ethnic and demographic factors should be considered in the clinical interpretation of these biomarkers to optimize care and outcomes. This underscores the complexity of the immune response and the impact of genetic and environmental factors on the progression of disease and the response to treatment.

Author Contributions

Conceptualization: H.N., T.P. and N.J.S.; Methodology: H.N., T.P. and N.J.S.; Software: R.N.; Validation: H.N.; Formal Data Analysis: R.N.; Investigation: H.N., R.A., H.Y. and N.T.; Resources: H.N., T.P., N.J.S., N.T., R.A., H.Y. and R.N.; Data Curation: R.N.; Writing—Original Draft Preparation: R.N.; Visualization: R.N., H.N., R.A., H.Y. and N.T.; Writing—Review and Editing: H.N., R.A. and H.Y.; Supervision: H.N.; Project Administration: H.N., T.P. and N.J.S.; Funding Acquisition: H.N., T.P. and N.J.S. All authors have read and agreed to the published version of the manuscript.

Funding

This research received no external funding.

Institutional Review Board Statement

The study was conducted according to the guidelines of the Government of India and approved by the Institutional Ethics Committee (IEC) of Tomo Riba Institute of Health and Medical Sciences (TRIHMS), Naharlagun, Arunachal Pradesh, India (IEC Code-TRIHMS/ETHICS/01/2019-20/8, dated 29 October 2021).

Informed Consent Statement

Patient consent was waived due to the nature of the study, which was a retrospective observational study.

Data Availability Statement

Data are contained within the article.

Acknowledgments

We would like to thank the authorities, laboratory, and other staff of TRIHMS for their help and support.

Conflicts of Interest

The authors declare no conflicts of interest. The sponsors had no role in the design, execution, interpretation, or writing of the study.

References

  1. Acter, T.; Uddin, N.; Das, J.; Akhter, A.; Choudhury, T.R.; Kim, S. Evolution of severe acute respiratory syndrome coronavirus 2 (SARS-CoV-2) as coronavirus disease 2019 (COVID-19) pandemic: A global health emergency. Sci. Total Environ. 2020, 730, 138996. [Google Scholar] [CrossRef] [PubMed] [PubMed Central]
  2. Jaljaa, A.; Caminada, S.; Tosti, M.E.; D’Angelo, F.; Angelozzi, A.; Isonne, C.; Marchetti, G.; Mazzalai, E.; Giannini, D.; Turatto, F.; et al. Risk of SARS-CoV-2 infection in migrants and ethnic minorities compared with the general population in the European WHO region during the first year of the pandemic: A systematic review. BMC Public Health 2022, 22, 143. [Google Scholar] [CrossRef] [PubMed] [PubMed Central]
  3. Pan, D.; Sze, S.; Martin, C.A.; Nazareth, J.; Woolf, K.; Baggaley, R.F.; Hollingsworth, T.D.; Khunti, K.; Nellums, L.B.; Pareek, M. COVID-19 and ethnicity: We must seek to understand the drivers of higher transmission. BMJ 2021, 375, n2709. [Google Scholar] [CrossRef] [PubMed]
  4. Sze, S.; Pan, D.; Nevill, C.R.; Gray, L.J.; Martin, C.A.; Nazareth, J.; Minhas, J.S.; Divall, P.; Khunti, K.; Abrams, K.R.; et al. Ethnicity and clinical outcomes in COVID-19: A systematic review and meta-analysis. eClinicalMedicine 2020, 29, 100630. [Google Scholar] [CrossRef] [PubMed] [PubMed Central]
  5. Browne, A.J.; Varcoe, C.; Lavoie, J.; Smye, V.; Wong, S.T.; Krause, M.; Tu, D.; Godwin, O.; Khan, K.; Fridkin, A. Enhancing health care equity with Indigenous populations: Evidence-based strategies from an ethnographic study. BMC Health Serv. Res. 2016, 16, 544. [Google Scholar] [CrossRef] [PubMed] [PubMed Central]
  6. Khanijahani, A.; Iezadi, S.; Gholipour, K.; Azami-Aghdash, S.; Naghibi, D. A systematic review of racial/ethnic and socioeconomic disparities in COVID-19. Int. J. Equity Health 2021, 20, 248. [Google Scholar] [CrossRef] [PubMed] [PubMed Central]
  7. Tjendra, Y.; Al Mana, A.F.; Espejo, A.P.; Akgun, Y.; Millan, N.C.; Gomez-Fernandez, C.; Cray, C. Predicting disease severity and outcome in COVID-19 patients: A review of multiple biomarkers. Arch. Pathol. Lab. Med. 2020, 144, 1465–1474. [Google Scholar] [CrossRef] [PubMed]
  8. Ghazanfari, T.; Salehi, M.R.; Namaki, S.; Arabkheradmand, J.; Rostamian, A.; Chenary, M.R.; Ghaffarpour, S.; Ardestani, S.K.; Edalatifard, M.; Naghizadeh, M.M.; et al. Interpretation of hematological, biochemical, and immunological findings of COVID-19 disease: Biomarkers associated with severity and mortality. Iran. J. Allergy Asthma Immunol. 2021, 20, 46–66. [Google Scholar] [CrossRef] [PubMed]
  9. Copaescu, A.; Smibert, O.; Gibson, A.; Phillips, E.J.; Trubiano, J.A. The role of IL-6 and other mediators in the cytokine storm associated with SARS-CoV-2 infection. J. Allergy Clin. Immunol. 2020, 146, 518–534. [Google Scholar] [CrossRef] [PubMed]
  10. Shekhawat, J.; Gauba, K.; Gupta, S.; Purohit, P.; Mitra, P.; Garg, M.; Misra, S.; Sharma, P.; Banerjee, M. Interleukin-6 perpetrator of the COVID-19 cytokine storm. Indian J. Clin. Biochem. 2021, 36, 440–450. [Google Scholar] [CrossRef] [PubMed]
  11. Yadav, D.; PVSN, K.K.; Tomo, S.; Sankanagoudar, S.; Charan, J.; Purohit, A.; Nag, V.; Bhatia, P.; Singh, K.; Dutt, N.; et al. Association of iron-related biomarkers with severity and mortality in COVID-19 patients. J. Trace Elem. Med. Biol. 2022, 74, 127075. [Google Scholar] [CrossRef] [PubMed]
  12. Kappert, K.; Jahić, A.; Tauber, R. Assessment of serum ferritin as a biomarker in COVID-19: Bystander or participant? Insights by comparison with other infectious and non-infectious diseases. Biomarkers 2020, 25, 616–625. [Google Scholar] [CrossRef] [PubMed]
  13. Celaya-Padilla, J.M.; Villagrana-Bañuelos, K.E.; Oropeza-Valdez, J.J.; Monárrez-Espino, J.; Castañeda-Delgado, J.E.; Oostdam, A.S.H.-V.; Fernández-Ruiz, J.C.; Ochoa-González, F.; Borrego, J.C.; Enciso-Moreno, J.A.; et al. Kynurenine and hemoglobin as sex-specific variables in COVID-19 patients: A machine learning and genetic algorithms approach. Diagnostics 2021, 11, 2197. [Google Scholar] [CrossRef] [PubMed]
  14. Stringer, D.; Braude, P.; Myint, P.K.; Evans, L.; Collins, J.T.; Verduri, A.; Quinn, T.J.; Vilches-Moraga, A.; Stechman, M.J.; Pearce, L.; et al. The role of C-reactive protein as a prognostic marker in COVID-19. Int. J. Epidemiol. 2021, 50, 420–429. [Google Scholar] [CrossRef]
  15. Yao, Y.; Cao, J.; Wang, Q.; Shi, Q.; Liu, K.; Luo, Z.; Chen, X.; Chen, S.; Yu, K.; Huang, Z.; et al. D-dimer as a biomarker for disease severity and mortality in COVID-19 patients: A case control study. J. Intensive Care 2020, 8, 49. [Google Scholar] [CrossRef] [PubMed]
  16. Battaglini, D.; Lopes-Pacheco, M.; Castro-Faria-Neto, H.C.; Pelosi, P.; Rocco, P.R. Laboratory biomarkers for diagnosis and prognosis in COVID-19. Front. Immunol. 2022, 13, 857573. [Google Scholar] [CrossRef]
  17. Qin, C.; Wei, Y.; Lyu, X.; Zhao, B.; Feng, Y.; Li, T.; Cao, H.; Yang, X.; Zhou, X.; Wang, W.; et al. High aspartate aminotransferase to alanine aminotransferase ratio on admission as risk factor for poor prognosis in COVID-19 patients. Sci. Rep. 2020, 10, 16496. [Google Scholar] [CrossRef] [PubMed]
  18. Kumari, S.; Nayak, S.; Tripathy, S.; Bhuniya, S.; Mangaraj, M.; Ramadass, B.; Sahu, S.; Bandyopadhyay, D.; Dash, P.; Saharia, G.K. Analysis of Biochemical and Inflammatory Markers for Predicting COVID-19 Severity: Insights from a Tertiary Healthcare Institution of Eastern India. Cureus 2023, 15, e33893. [Google Scholar] [CrossRef] [PubMed] [PubMed Central]
  19. Wang, D.; Hu, B.; Hu, C.; Zhu, F.; Liu, X.; Zhang, J.; Wang, B.; Xiang, H.; Cheng, Z.; Xiong, Y.; et al. Clinical Characteristics of 138 Hospitalized Patients with 2019 Novel Coronavirus-Infected Pneumonia in Wuhan, China. JAMA 2020, 323, 1061–1069, Erratum in JAMA 2021, 325, 1113. [Google Scholar] [CrossRef] [PubMed] [PubMed Central]
  20. Henry, B.M.; de Oliveira, M.H.S.; Benoit, S.; Plebani, M.; Lippi, G. Hematologic, biochemical and immune biomarker abnormalities associated with severe illness and mortality in coronavirus disease 2019 (COVID-19): A meta-analysis. Clin. Chem. Lab. Med. 2020, 58, 1021–1028. [Google Scholar] [CrossRef] [PubMed]
  21. Herold, T.; Jurinovic, V.; Arnreich, C.; Lipworth, B.J.; Hellmuth, J.C.; von Bergwelt-Baildon, M.; Klein, M.; Weinberger, T. Elevated levels of IL-6 and CRP predict the need for mechanical ventilation in COVID-19. J. Allergy Clin. Immunol. 2020, 146, 128–136. [Google Scholar] [CrossRef] [PubMed] [PubMed Central]
  22. Zeng, F.; Huang, Y.; Guo, Y.; Yin, M.; Chen, X.; Xiao, L.; Deng, G. Association of inflammatory markers with the severity of COVID-19: A meta-analysis. Int. J. Infect. Dis. 2020, 96, 467–474. [Google Scholar] [CrossRef] [PubMed] [PubMed Central]
  23. Sarraf, S.; Singapurwala, M.; Jain, H.; Singh, R.; Julka, A. Role of Inflammatory Markers in Predicting Severity in COVID-19 Patients at Tertiary Care Hospital, Ujjain (M.P.). J. Pulmonol. Respir. Res. 2023, 7, 4–9. [Google Scholar]
  24. Pujani, M.; Raychaudhuri, S.; Singh, M.; Kaur, H.; Agarwal, S.; Jain, M.; Chandoke, R.K.; Singh, K.; Sidam, D.; Chauhan, V. An analysis of hematological, coagulation and biochemical markers in COVID-19 disease and their association with clinical severity and mortality: An Indian outlook. Am. J. Blood Res. 2021, 11, 580. [Google Scholar] [PubMed]
  25. Sen, A.; Nigam, A.; Vachher, M. Role of polypeptide inflammatory biomarkers in the diagnosis and monitoring of COVID-19. Int. J. Pept. Res. Ther. 2022, 28, 59. [Google Scholar] [CrossRef] [PubMed]
  26. Rowaiye, A.B.; Okpalefe, O.A.; Onuh Adejoke, O.; Ogidigo, J.O.; Oladipo, O.H.; Ogu, A.C.; Oli, A.N.; Olofinase, S.; Onyekwere, O.; Abubakar, A.R.; et al. Attenuating the effects of novel COVID-19 (SARS-CoV-2) infection-induced cytokine storm and the implications. J. Inflamm. Res. 2021, 14, 1487–1510. [Google Scholar] [CrossRef] [PubMed]
  27. Bhandari, S.; Rankawat, G.; Singh, A.; Wadhwani, D.; Patel, B. Evaluation of interleukin-6 and its association with the severity of disease in COVID-19 patients. Indian J. Med. Spec. 2020, 11, 132. [Google Scholar]
  28. Gill, G.; Devra, A.G. Role of interleukin-6 levels in predicting COVID severity: A single-center experience. Indian J. Med. Spec. 2023, 14, 178–179. [Google Scholar]
  29. Tsegay, Y.G.; Bitew, M.; Workneh, T.; Atlaw, A.; Aragaw, M.; Gemechu, M.; Brhane, N. The level of liver and renal function biomarker abnormalities among hospitalized COVID-19 patients in Ethiopia. medRxiv 2022, 22271010. [Google Scholar] [CrossRef]
  30. Singh, A.; Bhadani, P.P.; Surabhi Sinha, R.; Bharti, S.; Kumar, T.; Nigam, J.S. Significance of immune-inflammatory markers in predicting clinical outcome of COVID-19 patients. Indian J. Pathol. Microbiol. 2023, 66, 111–117. [Google Scholar] [CrossRef] [PubMed]
  31. Karimi, A.; Shobeiri, P.; Kulasinghe, A.; Rezaei, N. Novel Systemic Inflammation Markers to Predict COVID-19 Prognosis. Front. Immunol. 2021, 12, 741061. [Google Scholar] [CrossRef] [PubMed] [PubMed Central]
  32. Cao, X. COVID-19: Immunopathology and its implications for therapy. Nat. Rev. Immunol. 2020, 20, 269–270. [Google Scholar] [CrossRef] [PubMed] [PubMed Central]
  33. Gupta, D.; Jain, A.; Chauhan, M.; Dewan, S. Inflammatory Markers as Early Predictors of Disease Severity in COVID-19 Patients Admitted to Intensive Care Units: A Retrospective Observational Analysis. Indian J. Crit. Care Med. 2022, 26, 482–486. [Google Scholar] [CrossRef] [PubMed] [PubMed Central]
  34. Sakthivadivel, V.; Bohra, G.K.; Maithilikarpagaselvi, N.; Khichar, S.; Meena, M.; Palanisamy, N.; Gaur, A.; Garg, M.K. Association of Inflammatory Markers with COVID-19 Outcome among Hospitalized Patients: Experience from a Tertiary Healthcare Center in Western India. Maedica 2021, 16, 620–627. [Google Scholar] [CrossRef] [PubMed] [PubMed Central]
  35. Côté, A.; Ternacle, J.; Pibarot, P. Early prediction of the risk of severe coronavirus disease 2019: A key step in therapeutic decision making. eBioMedicine 2020, 59, 102948. [Google Scholar] [CrossRef] [PubMed]
Figure 1. (a) Cumulative count of two races included in the study; (b) Categorization of the severity levels in COVID-19 cases from indigenous population; (c) Grouping of COVID-19 severities in patients from non-indigenous population.
Covid 04 00081 g001
Figure 3. Levels of different inflammatory biomarkers in the target study population. (ac) indicates the levels of D-DIMER, Creatinine, and Urea (d,e), showing the levels Hepatic function biomarkers, AST/SGOT and ALT/SGPT in the COVID-19 patients from the target study indigenous population. (Since this is a non-parametric study, we have derived the median of the population).
Covid 04 00081 g003
Figure 4. Direct comparison in patterns of (a) inflammatory markers (IL-6 and Ferritin), (b) renal biomarkers (Creatinine and Urea), (c) hepatic biomarkers (AST/SGOT and ALT/SGPT), and (d) NLR to LMR ratio with respect to the severity of the COVID-19 patients in the indigenous population of Arunachal Pradesh.
Covid 04 00081 g004
Table 1. Comparison of parameters between two populations (indigenous and non-indigenous) using Mann–Whitney U test.
ParametersIndigenousNon-Indigenousp-Value
NMedianNMedian
Age (years)9874012750<0.001
Urea (mg/dL)89624.28026.450.225
Creatinine (mg/dL)8950.7790.80.052
Sodium (mEq/L)823137.475136.50.036
Pottasium (mEq/L)8233.975 <0.001
Chloride (mEq/L)821100.27599.20.007
Total bilirubin (mg/dL)8980.7800.80.057
Direct bilirubin (mg/dL)8960.4800.40.329
AST/SGOT (U/L)895468042.550.714
ALT/SGPT (U/L)89339.880400.724
TP Total Protein (g/dL)8946.2806.30.475
Albumin (g/dL)8973.7803.80.264
Globulin (g/dL)8922.5802.50.594
CRP (ng/mL)38449,580.582742,708.60.254
Ferritin (ng/mL)430363.8530555.450.542
IL6 (pg/mL)41322.682827.6650.359
NLR9004.18834.670.456
LMR9004.59824.870.962
PLR8890.09810.080.61
Note: p < 0.05 indicates a statistically significant difference between indigenous and non-indigenous populations. (Conclusion: Not many of the parameters have shown significant differences between indigenous and non-indigenous populations as per this comparison with the non-parametric size of the population). mg/dL—milligram per deciliter, n—group size, ALT/SGPT—alanine aminotransferase/serum glutamic pyruvic transaminase, mEq/L—milli equivalent per deciliter AST/SGOT—aspartate aminotransferase/serum glutamic oxaloacetic transaminase; g/dL—grams per deciliter; U/L—international units per liter.
Table 2. Demographic and biochemistry data of the indigenous population of Arunachal Pradesh (northeast India) in accordance with the data based on the population of eastern India (non-indigenous) by Suchitra Kumari et al. [18].
Study Target Group (Indigenous Population from Arunachal Pradesh, India)Study Group (Non-Indigenous Population from Eastern India) by Suchitra Kumari et al. [18].p-Value for Spearman Rank Correlation Testr-Value
Parameters
(n-592)
Median (IQR)Parameters
(n-7395)
Median (IQR)
SexMale348 (58.78%)SexMale4656 (62.96%)<0.00010.9876
Female Female2739 (37.04%)
Age (years) 41 (31–54)Age 48 (32–60)
Urea (mg/dL) 23.00
(17.10–32.70)
Urea (mg/dL) 25 (18–40)
Creatinine (mg/dL) 0.8 (0.7–1.0)Creatinine (mg/dL) 0.9 (0.7–1.2)
Sodium (mEq/L) 137.2 (135.2–139.0)Sodium (mEq/L) 135 (132–137)
Pottasium (mEq/L) 3.9 (3.6–4.3)Pottasium (mEq/L) 4.23 (3.89–4.61)
Chloride (mEq/L) 100.4 (98.2–102.0)Chloride (mEq/L) 100 (96–103)
Total bilirubin (mg/dL) 0.7 (0.6–0.9)Total bilirubin (mg/dL) 0.5 (0.3–0.7)
Direct bilirubin (mg/dL) 0.4 (0.3–0.6)Direct bilirubin (mg/dL) 0.17 (0.1–0.3)
AST/SGOT (U/L) 46.25 (43–49.8)AST/SGOT (U/L) 36 (24–64)
ALT/SGPT (U/L) 40 (38–44)ALT/SGPT (U/L) 32 (19–57)
TP Total Protein (g/dL) 6.4 (6.3–6.5)TP Total Protein (g/dL) 7 (6.4–7.6)
Albumin (g/dL) 3.8 (3.4–4.0)Albumin (g/dL) 3.6 (3.1–4.1)
Globulin (g/dL) 2.3 (1.9–2.7)Globulin (g/dL) 3.4 (3–3.8)
CRP (ng/mL) 44.95 (39.2–50.8)CRP (ng/mL) 55.15 (14–138.9)
Ferritin (ng/mL) 366.0 (306.7–447.5)Ferritin (ng/mL) 371 (128.7–955.6)
IL6 (pg/mL) 20.65 (16.36–24.7)IL6 (pg/mL) 19.8 (5.9–60)
IQR—interquartile range, mg/dL—milligram per deciliter, n—group size, ALT/SGPT—alanine aminotransferase/serum glutamic pyruvic transaminase, mEq/L—milli equivalent per deciliter AST/SGOT—aspartate aminotransferase/serum glutamic oxaloacetic transaminase; g/dL—grams per deciliter; U/L—international units per liter.
Disclaimer/Publisher’s Note: The statements, opinions and data contained in all publications are solely those of the individual author(s) and contributor(s) and not of MDPI and/or the editor(s). MDPI and/or the editor(s) disclaim responsibility for any injury to people or property resulting from any ideas, methods, instructions or products referred to in the content.

