Article

Comparison of Dimensional Accuracy between a Laser Scanner and a Laser Tracker with Handheld Scan in a Laboratory Setting

by
Alex Krummenauer
*,
Douglas Bergamo
,
Roberto Serpa Soares
,
Victor Emmanuel de Oliveira Gomes
and
Vitor Camargo Nardelli
SENAI Innovation Institute for Sensor Systems (ISI-SIM), São Leopoldo 93025-753, Brazil
*
Author to whom correspondence should be addressed.
Metrology 2024, 4(2), 205-226; https://doi.org/10.3390/metrology4020013
Submission received: 28 December 2023 / Revised: 30 March 2024 / Accepted: 8 April 2024 / Published: 12 April 2024
(This article belongs to the Special Issue Advances in Laser Interferometry for Precision Engineering)

Abstract

:
The dimensional accuracy of a laser scanner has been extensively evaluated using various measurement methods and diverse reference standards. This study specifically focuses on two key considerations. Firstly, it assesses the dimensional accuracy of the laser scanner by employing another laser scanner, a handheld scanner, as the reference measurement method. Secondly, the study involves the use of three spheres fixed on each wall in both coplanar and non-coplanar positions within a laboratory room at SENAI ISI-SIM. The primary objective is to determine the dimensional accuracy between the centers of the coplanar and non-coplanar spheres up to 10 m. The comparison includes measurement uncertainties, as per ISO GUM standards, obtained using the laser scanner in a laboratory setting with controlled temperature and humidity. Analyzing non-coplanar dimensional accuracy enhances our understanding of the metrological performance of the laser scanner, particularly when assessing the dimensions of objects positioned randomly within a scanning scene.

1. Introduction

In today’s globalized world, the interchangeability of components, where parts manufactured in Europe might be used in vehicles or aircraft produced in Brazil, underscores the fundamental importance of precision and accuracy in global metrology. In this context, scientific and industrial metrology plays a pivotal role in enhancing industrial quality, competitiveness, and ensuring metrological reliability [1].
Three-dimensional (3D) metrology stands out as a crucial pillar in ensuring metrological reliability in large-volume mechanical assemblies, such as generators, ships, vehicles, or aircraft. Traditional instruments like calipers, micrometers, goniometers, and electronic distance meters (EDMs) are commonly used in 3D metrology, alongside advanced technologies such as coordinate measuring machines (CMMs), total stations, laser trackers, laser tracers, structured light, 3D optical scanners, laser scanners, measurement arms, photogrammetry, laser profilometry, LiDAR (light detection and ranging), and measurement tomography. Each measurement system has its specific characteristics, enabling careful selection based on the requirements of each specific measurement or set of measurements [2,3,4,5,6,7,8,9,10,11,12,13,14]. In recent years, 3D metrology has expanded its presence into new market segments, encompassing applications as diverse as medicine, dentistry, prosthetics and implants, reverse engineering, quality control and inspection, space exploration, forensic investigation, mining mapping, geographic detailing, geodesy, surveying, civil engineering, shipbuilding, archaeology, prototyping, education, quality monitoring, architecture, cultural heritage preservation, art conservation, robotics, and digital agriculture [5,6,7,8,9,10,11,12,13,14,15,16,17].
The technological advancements of recent decades have introduced new dimensional measurement methods in large-scale metrology (LSM), as discussed by Schmitt et al. [4], reviewing current trends in measurement systems for LSM. In this evolving landscape, non-contact measurement methods, especially optical measurement methods, have gained prominence in current metrological developments, offering increasingly innovative solutions for measurement challenges across various industrial sectors [3,4,5,6,7,8,9,10,11,12,13,14,15,16,17]. Two key factors are particularly relevant in these advanced non-contact measurement technologies: the reduced interference of the measurement system with the measured object, especially in non-rigid materials such as polymers and rubbers, and the ability to rapidly capture a large quantity of dimensions, significantly reducing measurement times [3,4]. All of this is achieved with measurement uncertainties comparable to or even lower than traditional contact measurement systems, such as CMMs applied to objects made from these materials. An example is the laser tracer, which has demonstrated errors of less than 0.6 µm over 1000 mm [11]. The laser tracer is an interferometer like a laser tracker but without an angular measurement system. The measurement beam is mounted on a reference sphere, which is connected to a solid stem attached to a base plate [4,11]. The increasing implementation of non-contact measurement methods in recent years has led to improved precision and accuracy in industrial measurements of large volumes (LSM). In this new scenario, optical measurement systems have come to the forefront, offering excellent 3D scanning capabilities with high efficiency—detailed scanning of mechanical assemblies in less measurement time and faster data processing [3,4].
The GOM Atos Core, FARO Focus laser scanner, and Leica laser tracker measurement systems used in this study exemplify these technological advances, each with its unique characteristics, capabilities, and specific applications. Besides simplifying the measurement process, these systems enable measurements in both small and large volumes in industrial environments [13,14,15,16,17,18,19,20,21,22,23].
The GOM Atos Core is an optical measurement system, utilizing the principles of optical triangulation with blue structured light projection [14]. The system projects a set of fringes onto the object’s surface, observed by two cameras on either side of the projector, using confocal microscopy technology for a complete scan of the digitized object [14]. The equipment can record millions of points during a single measurement with an accuracy of 0.01 mm under favorable measurement conditions [14].
The FARO Focus laser scanner operates by sending an infrared laser beam to the center of a rotating mirror. As the mirror rotates, it deflects the laser beam vertically and spreads the laser around the scanned environment. The scanner then captures the scattered light from objects, reflecting to the scanner. Distance is measured through the phase-shift between the emitted infrared laser beam and the reflected laser beam from the object. The x, y, and z coordinates are calculated by combining encoder angle readings associated with each moment of measurement with the measurement of each distance [18]. For the Focus S 150 model, FARO specifies a systematic error of ±1 mm at 10 m and a precision of 1 mm under favorable measurement conditions [18], making this technology appealing for various applications, including environmental scanning, large-volume measurement, and measurements in both outdoor and indoor environments. All laser scanners operate on the same principle of emitting laser pulses but differ in how they capture the return signals: time of flight; phase-based; or triangulation [18,19,20]. The Focus S 150 laser scanner is based on the phase-based principle [18]. The laser scanner not only provides distance data, but it can also record the intensity of the reflected signal and information regarding the RGB (red–green–blue) color spectrum of the object or environment, thereby enhancing the richness of the collected data [18].
Leica’s AT960 laser tracker is a portable coordinate measurement system that measures the position of a reflector target in spherical coordinates (radial distance d, horizontal angle Hz, vertical angle V). The radial distance is measured using an absolute interferometer module (AIFM), combining a heterodyne interferometer (IFM) for dynamic measurements with an absolute distance meter (ADM) to establish an absolute reference distance. The IFM and ADM simultaneously measure the distance to the reflector, allowing dynamic tracking of a moving reflector target with higher precision. The AIFM enables dynamic high-speed measurements; the measurement rate can reach 1000 points per second. During measurement, the system measures air temperature, atmospheric pressure, and air humidity to correct the radial distance sensitive to the refractive index of the ambient air. The spherical coordinates (d, Hz, V) or the corresponding Cartesian coordinates (x, y, z) of the reflector target’s position are displayed on the equipment screen. To obtain these coordinates, the laser tracker is equipped with an encoder for horizontal angles (azimuth encoder) and an encoder for vertical angles (elevation encoder), in addition to the laser beam (AIFM) [21,22]. The Leica AT960 laser tracker has a measurement uncertainty for a single coordinate (Uxyz) of 15 µm + 6 µm/m, Uxyz = 0.075 mm at 10 m, and a 3D measurement range of 60 m [22]. The advent of the laser tracker marked a significant advancement in 3D measurements, enabling higher precision and accuracy values in LSM. The Leica laser tracker is undeniably a reference standard for determining the linear errors or deviations of other laser measurement systems applied to large 3D volumes [12]. The reference standard employed in calibrating the Focus laser scanner is a laser tracker. Additionally, the calibration of industrial robots with high accuracy is performed using laser trackers or optical measurement systems [23].
In the literature, there are several articles addressing the investigation or determination of the accuracy of laser scanners. The article by Beraldin et al. [5] focuses on the importance of conducting precise and stable measurements in a laboratory environment with controlled temperature and humidity at a distance of up to 10 m, and using a laser tracker as a reference instrument—three premises considered in this study. The article by Wang et al. [6] describes the evaluation of a single model of laser scanner, using a laser tracker as a reference instrument, spheres as measurement objects, and measurements conducted in a room with controlled environmental conditions, emphasizing the calculations of measurement uncertainty—guidelines adopted in this study. Muralikrishnan et al. [24] mentioned the use of sphere centers to determine accuracy in a laboratory, the evaluation of sphere shape errors, and the use of a laser tracker as a reference instrument. These guidelines were followed in the present study. The article by Boehler et al. [25] also mentions the use of spheres, plates, and targets for accuracy determination in a laboratory setting.
In this study, the accuracy and dimensional precision of the FARO Focus S 150 laser scanner were evaluated using the Leica laser tracker with T-Scan as the reference measurement method and sphere centers as reference points. The aim of this work was to determine the accuracy and measurement uncertainty of a laser scanner in a new sphere arrangement, with the intention of comparing the influence of three orthogonal planes (walls) on the accuracy determination of this type of instrument. To achieve this, the accuracy of coplanar and non-coplanar distances obtained in a laboratory environment with controlled climatic conditions was assessed, and their measurement uncertainties were estimated. The use of a laboratory environment with controlled climatic conditions prevents their influences from significantly interfering with the precision, accuracy, and measurement uncertainty determinations in this study. Therefore, one of the results of this study was the comparison between the precision results of coplanar and non-coplanar measurements, along with their measurement uncertainties, calculated according to the ISO GUM (guide to the expression of uncertainty in measurement) method [26,27,28]. The determination of precision, accuracy, and measurement uncertainty in coplanar and non-coplanar distances, using the FARO Focus S 150 laser scanner, provides a better understanding of the metrological behavior of this measurement system when used to determine the dimensions of randomly positioned objects within a volume in a scanning scene at distances up to 10 m.

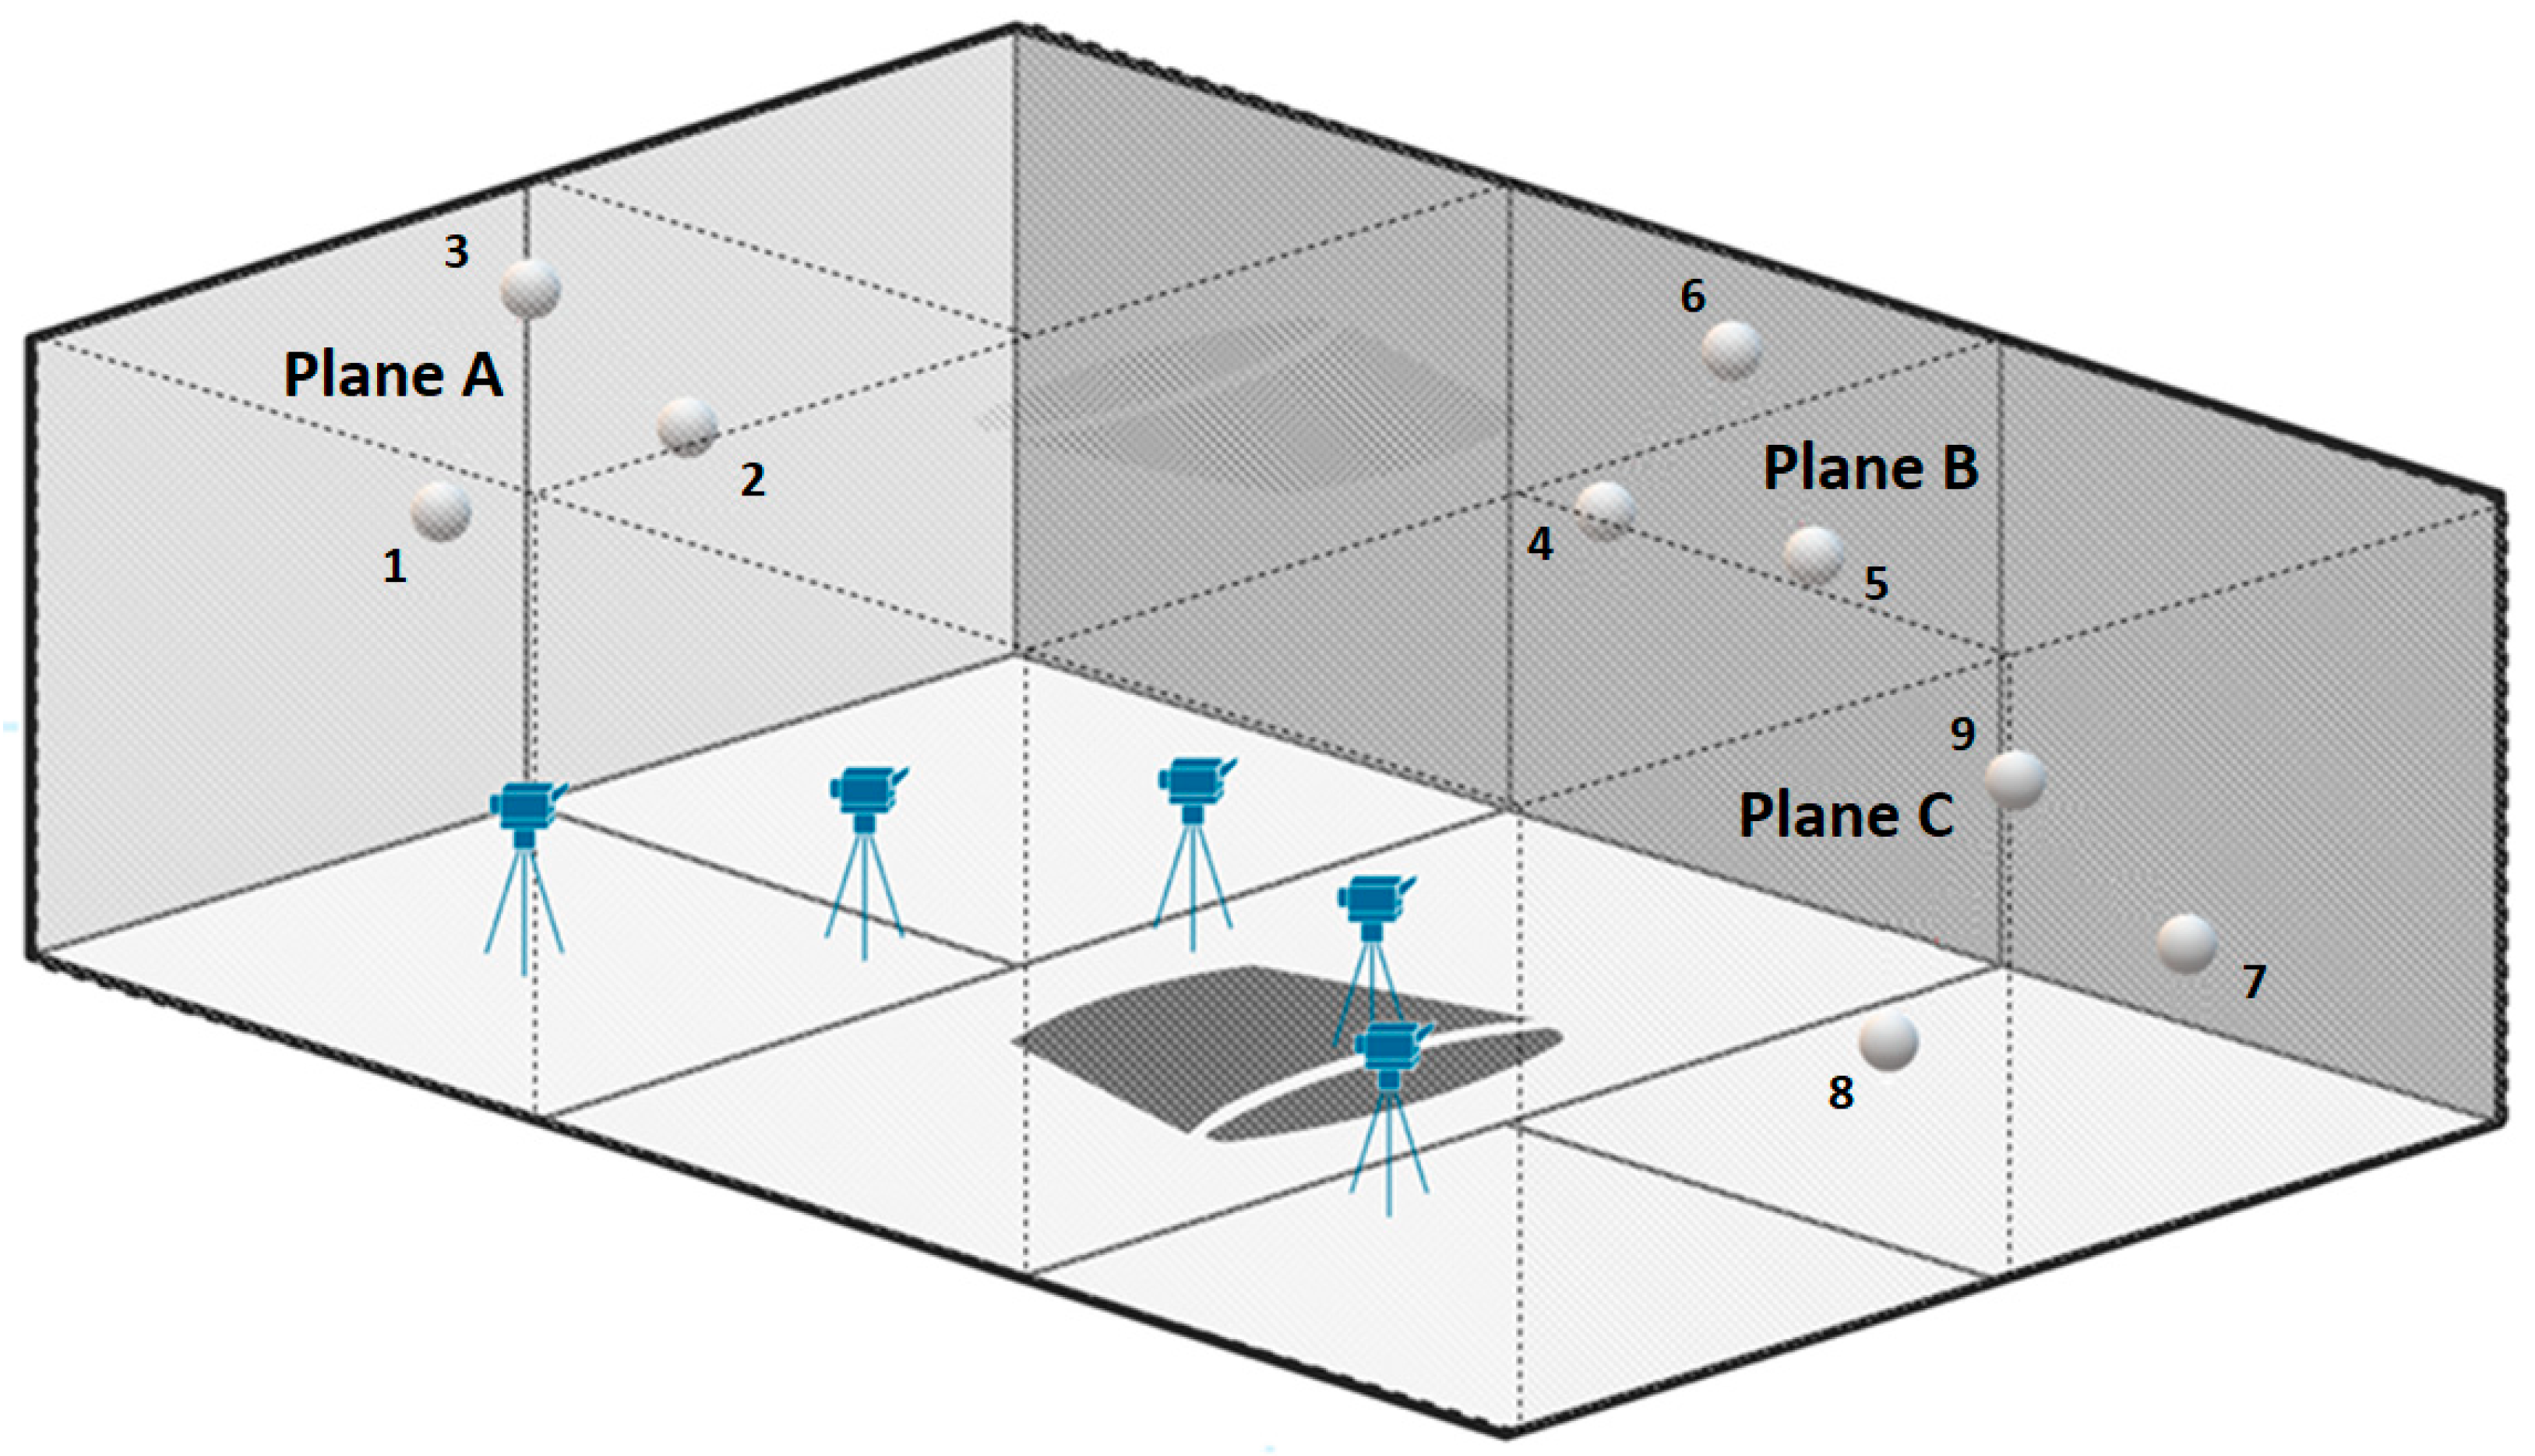
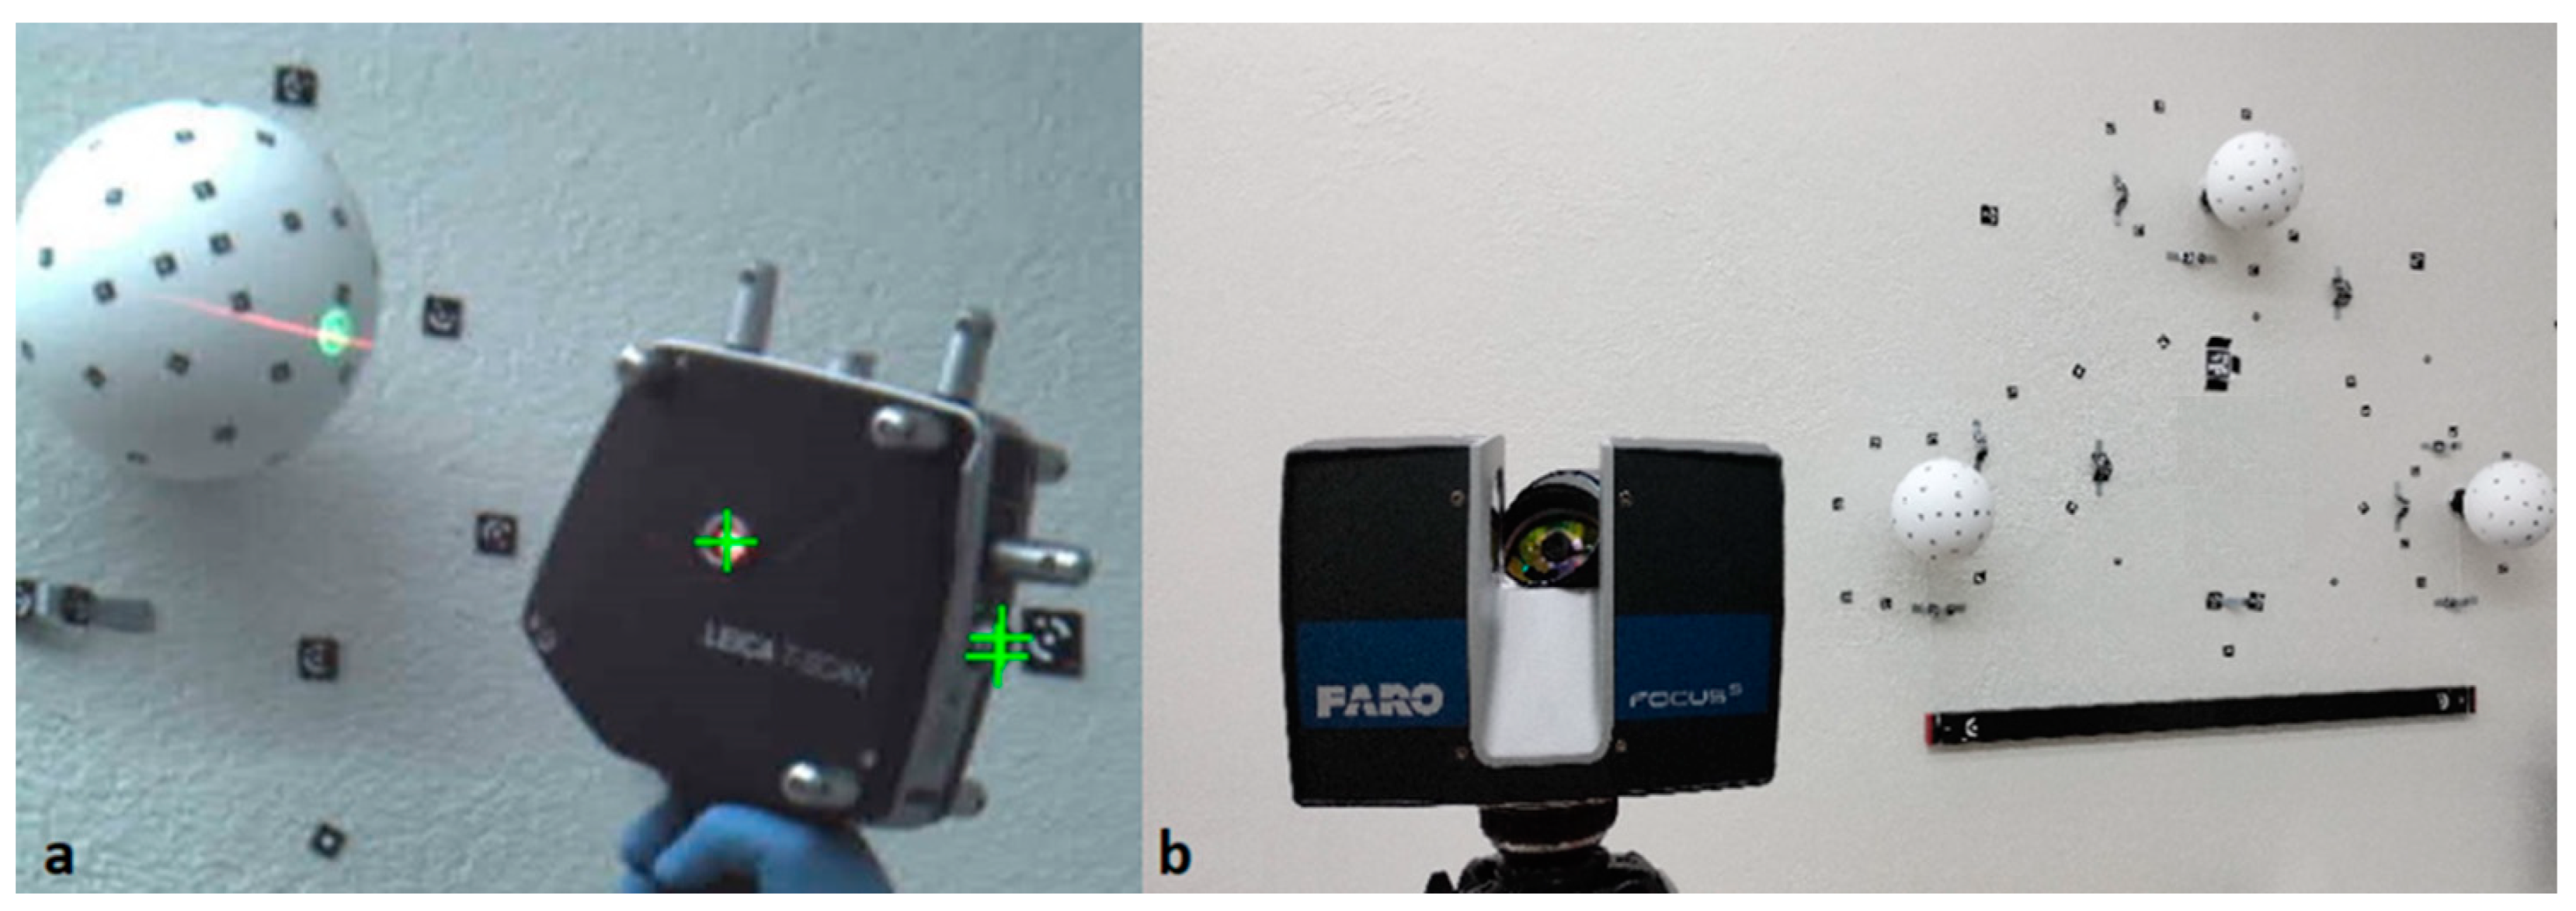
2. Materials and Methods

The accuracy study of the FARO Focus S 150 laser scanner system was conducted in the dimensional laboratory of the SENAI Institute of Innovation for Sensor Systems—ISI-SIM, located in São Leopoldo, Rio Grande do Sul, Brazil. It took place in a laboratory room maintained at a constant temperature of 20 ± 0.5 °C and humidity ≤ 65%, with approximate dimensions of 10 m width, 12 m length, and 3.5 m height. The laboratory room features double walls and a system for controlling temperature and air humidity. Six spheres with a nominal diameter of 150 mm, made of polypropylene-based material, specifically designed for non-contact scanning systems, were used in this environment. These spheres were positioned to obtain coplanar and non-coplanar distances using three distinct planes (A, B, and C) within the laboratory room, with three spheres fixed on each plane (Figure 1).
The six spheres were scanned using a 3D optical scanner, the GOM Atos Core (Figure 2a), manufactured by GOM, to determine the shape errors of each sphere. The GOM Atos Core, with an accuracy of 0.01 mm [14], was chosen as the reference measurement system for this type of measurement. The spheres, numerically identified from 1 to 6, were scanned to capture the upper cap of each sphere (Figure 2b). The processing of measurements aimed to obtain six diameter measurements for each sphere, with an angular offset of 30° between each diameter (Figure 2c). These six diameter measurements determined the shape error of the spheres, representing a key source of measurement uncertainty for both the FARO Focus laser scanner and the Leica laser tracker AT960 with T-Scan in coplanar and non-coplanar measurements conducted in this case study.
After scanning the six spheres using the GOM Atos Core, they were initially positioned in planes A and B within the laboratory room and later in planes B and C. Initially, Spheres 1, 2, and 3 were fixed in plane A, perpendicular to the floor, while Spheres 4, 5, and 6 were positioned in plane B, forming a 90° angle horizontally to plane A. The third plane, named plane C, was created by repositioning Spheres 1, 2, and 3 from plane A. This was carried out after completing the measurements of the spheres positioned in plane AB. The spheres from plane A were then repositioned in plane C and renumbered as 7, 8, and 9, respectively, as shown in Figure 3. Spheres 4, 5, and 6 from plane B did not undergo any movements during the experiment and served as a measurement link between planes A and C (best fit).
With the six spheres positioned to form the vertical A and B planes, the process of scanning and measuring the spheres began. The spheres were scanned and measured using the Leica laser tracker AT960 in conjunction with T-Scan, and subsequently, they were scanned and measured using the FARO Focus laser scanner.
The reference methodology used was digitization with the Leica T-Scan handheld scanner. This accessory for the AT960 laser tracker uses a pulsed laser system, forming a red line. This laser line precisely captures the topology of the object. The T-Scan probe incorporates a set of infrared LED emitters grouped around a laser tracking target, along with a manual laser scanner, to form a 6-degree-of-freedom (6DoF) probe. The T-Scan can measure features that would otherwise be out of reach for a common reflector target. A camera mounted on the tracker head, combined with image processing software, determines the three angular degrees of freedom of the probe, in addition to the 3DoF of the Leica AT960 laser tracker, by analyzing the positions of the LED targets in the camera image [29,30].
Figure 4a illustrates the use of the Leica T-Scan during the scanning process of one of the spheres. The collected data is presented in third-party software, PolyWorks 2019 (InnovMetric, Quebec, QC, Canada), capable of working with different devices and imports. The data is stored in a polygonal model format, where subsequent measurements can be extracted.
The methodology being compared with the Leica laser tracker with T-Scan is that of the FARO Focus laser scanner. The Focus generates a point cloud that can be processed in the Scene software version 2022, provided by FARO. In this experiment, Scene was used for processing and aligning the point clouds, which were then exported to the PolyWorks software for measurement. Scans with the Focus were performed with a total of nine different data capture sessions. The equipment was installed in three different positions and at three different heights per installation (500 mm, 1000 mm, and 1500 mm from the ground), totaling nine measurement sessions. The Focus was configured with a resolution of 1/4 and quality at 4×. Figure 4b presents the sphere scanning process with the FARO Focus S 150 laser scanner.
In both methodologies used, the spheres 1, 2, 3, 4, 5, and 6 (Figure 3) positioned in planes A and B were initially scanned. Three scanning cycles of planes A and B were performed, where only the equipment was repositioned, and the spheres remained unchanged. The scanning of planes B and C was conducted after completing the scanning of planes A and B, using spheres 4, 5, 6, 7, 8, and 9 (Figure 3). Three scanning cycles were also performed on planes B and C, like the procedure carried out on planes A and B.
In the Polyworks software, linear distances between the centers of the three spheres positioned in plane A, the distances between the centers of the three spheres positioned in plane B, and the distances between the centers of the three spheres positioned in plane C were extracted, totaling nine coplanar distances with three replicates. In plane A, coplanar distances 1–2, 1–3, and 2–3 were obtained; in plane B, coplanar distances 4–5, 4–6, and 5–6 were obtained; and in plane C, coplanar distances 7–8, 7–9, and 8–9 were obtained. In the Polyworks software, twenty-seven non-coplanar distances with three replicates were also extracted. These distances were obtained between the centers of the three spheres positioned in plane A to the centers of the three spheres positioned in plane B, resulting in nine mean non-coplanar distances in plane AB: 1–4, 1–5, 1–6, 2–4, 2–5, 2–6, 3–4, 3–5, and 3–6. In plane BC, nine mean non-coplanar distances were also obtained: 4–7, 4–8, 4–9, 5–7, 5–8, 5–9, 6–7, 6–8, and 6–9. Finally, in plane AC, the last nine mean non-coplanar distances were obtained: 1–7, 1–8, 1–9, 2–7, 2–8, 2–9, 3–7, 3–8, and 3–9. Still using the Polyworks software, it was possible to extract the six-diameter measurements staggered by 30° on each sphere, obtained with the Leica T-Scan and the Focus S 150.
Figure 5 presents a complete cycle of the measurement scheme of coplanar and non-coplanar distances among the nine spheres obtained in Polyworks. The extraction of distances between centers was performed in Polyworks using an alignment of planes in the same coordinate system. This was carried out through best-fit, using spheres 4, 5, and 6 (plane B) as a reference. The center of each digitized sphere was determined by selecting points and creating the element, configured with point rejection filtering, adjusted with two standard deviations in each element.
The measurements of coplanar and non-coplanar distances and diameters were tabulated in an Excel spreadsheet. These measurements were extracted from polygonal models and the point cloud, using the PolyWorks software. In the spreadsheet, sample means and standard deviations were calculated for coplanar and non-coplanar distances and diameters. Deviations between the means of these measurements obtained with he FARO Focus laser scanner and the means of these measurements obtained with the Leica T-Scan were also calculated.

3. Results

The results of dimensional precision and accuracy of the FARO Focus S 150 laser scanner, using the Leica T-Scan as a reference measurement method and sphere centers as reference points, are presented in this section. Primarily, the accuracy and precision results of coplanar and non-coplanar distances (up to 10 m) obtained in a laboratory environment with controlled climatic conditions are reported, along with the respective estimates of measurement uncertainties calculated according to the ISO GUM method [26,27,28].

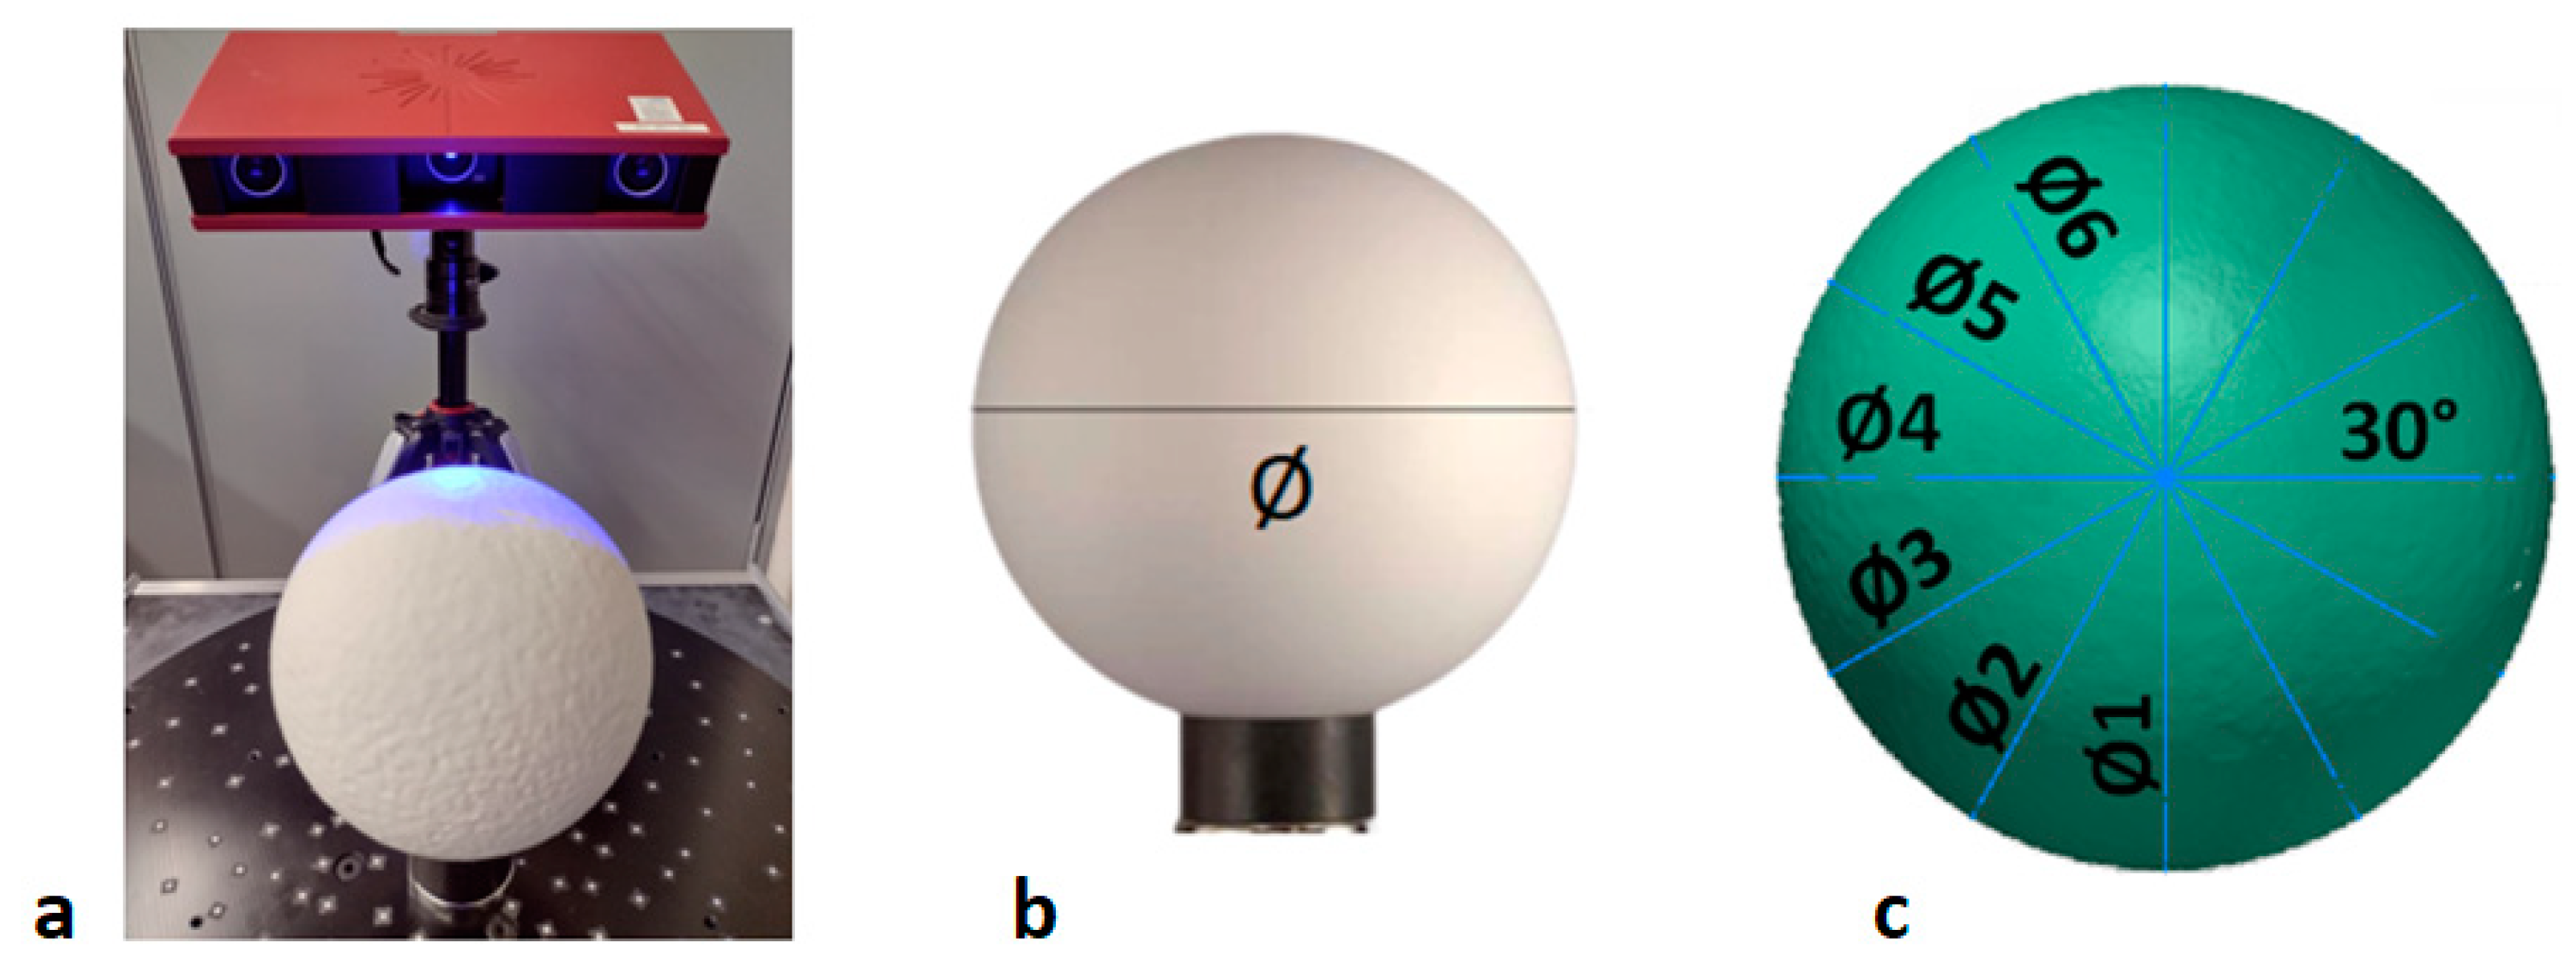
3.1. Determination of Sphere Form Error

The spheres serve as the geometric elements used in this study to determine coplanar and non-coplanar linear measurements, being one of the main sources contributing to the calculations of measurement uncertainty using the Leica T-Scan and the Focus laser scanner in this task-specific context. Therefore, a study of the form error of the six spheres was conducted with the GOM Atos Core 3D optical scanner. The form error of each sphere was obtained from the difference between the largest external diameter and the smallest external diameter, obtained from six diameters phased at 30° intervals, and the results are presented in Table 1. The highest calculated sphere form error was 0.716 mm, a result obtained for sphere 6 (Table 1).

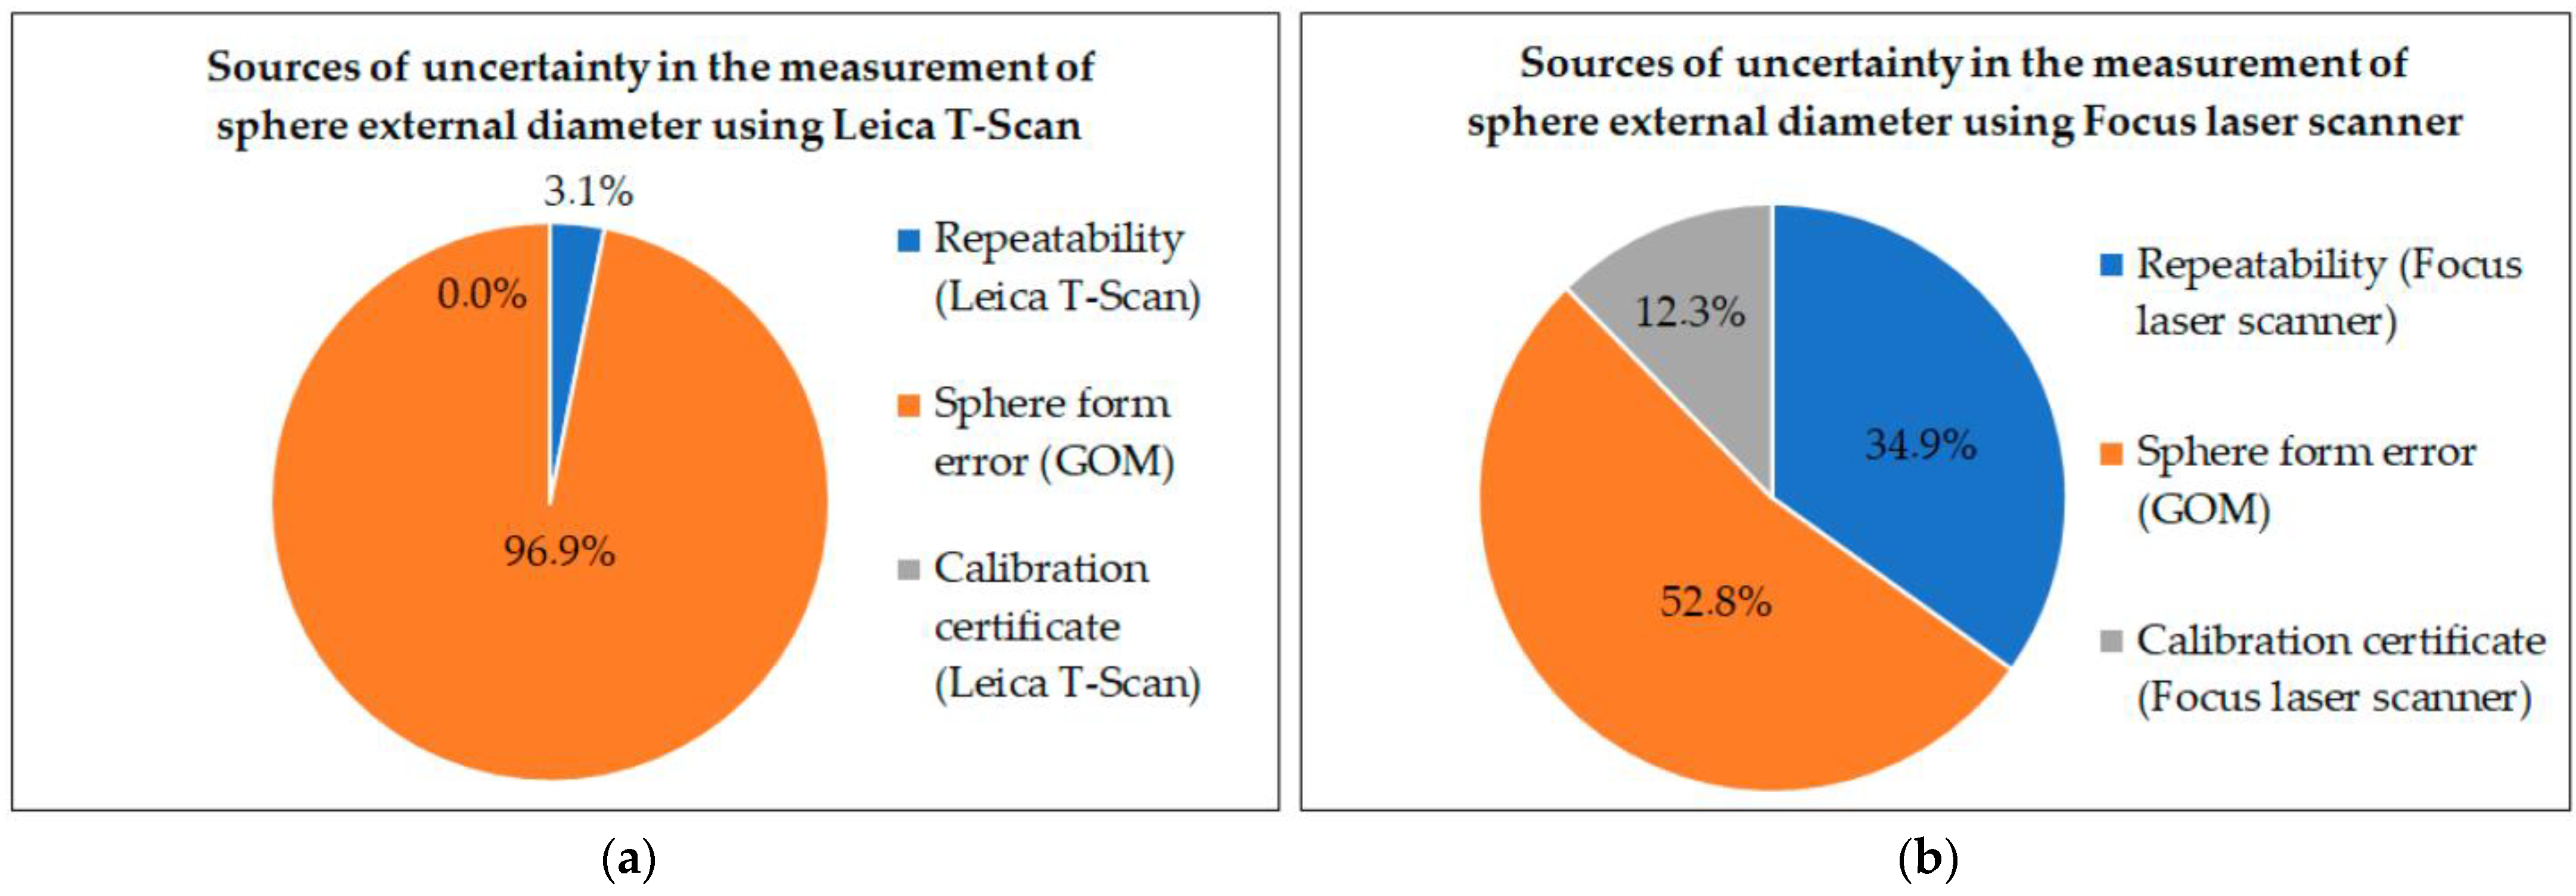
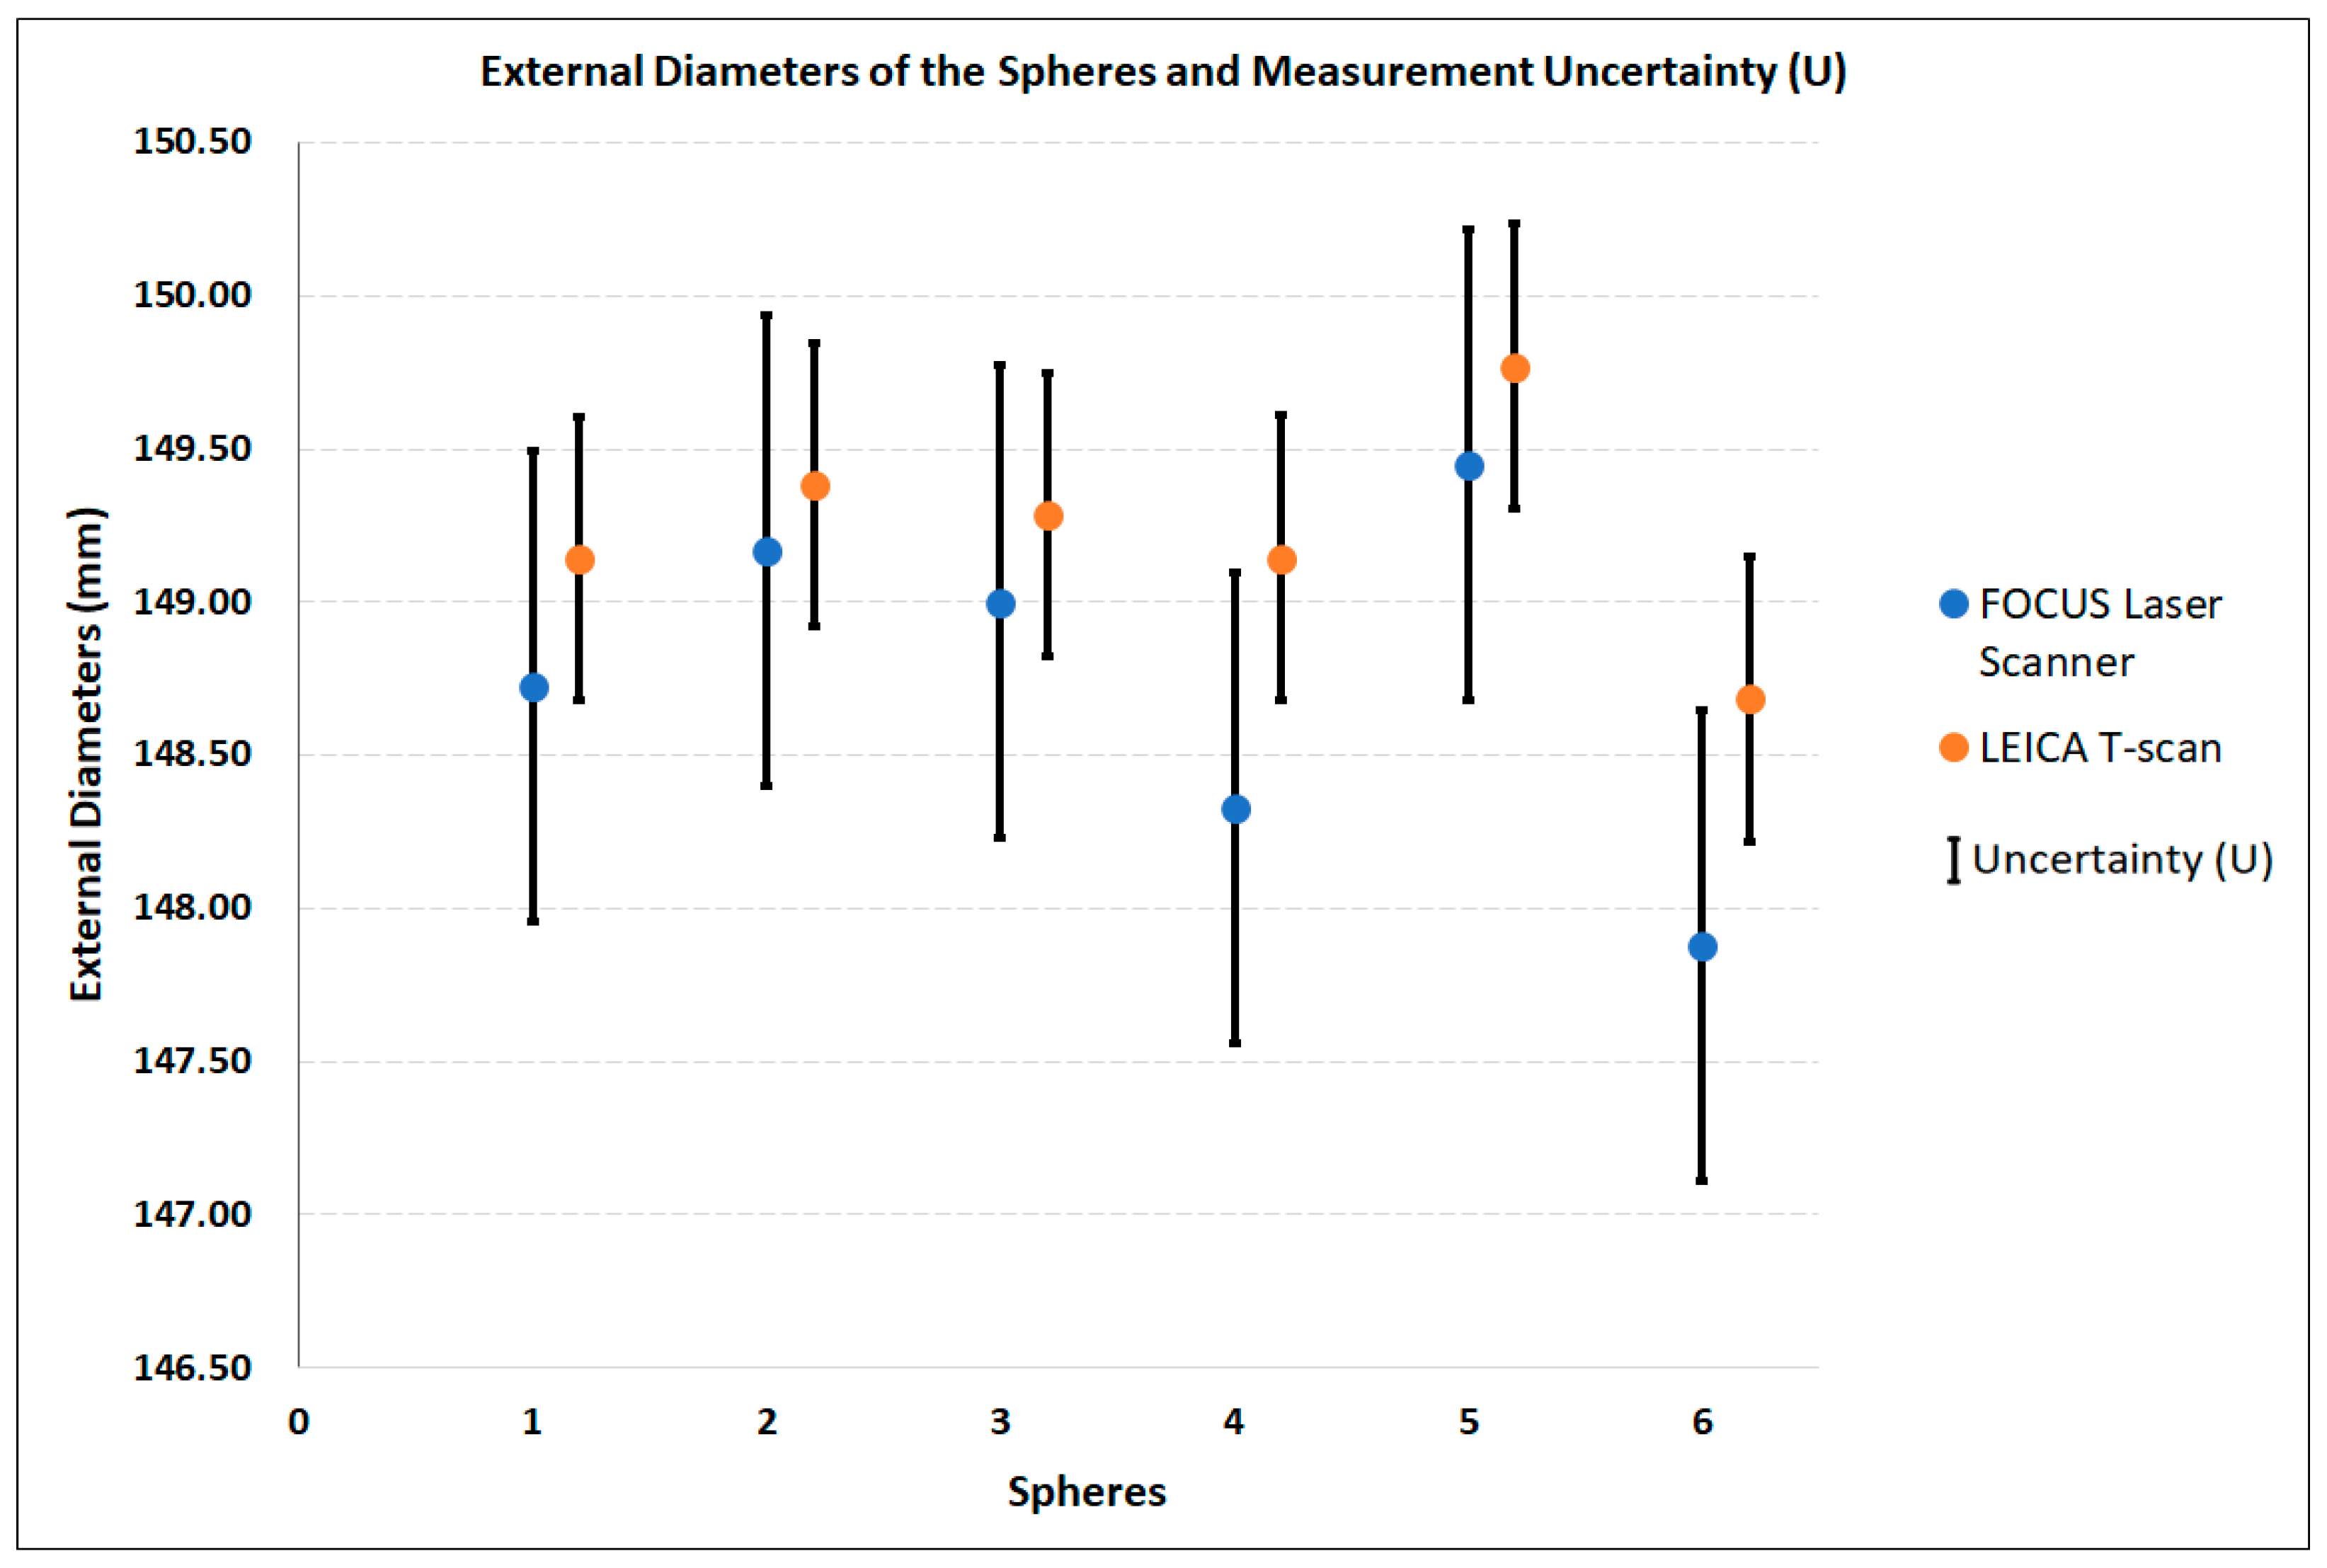
3.2. Measurement of the External Diameters of the Spheres with Leica T-Scan and Focus Laser Scanner, and Estimates of Measurement Uncertainties

As described in Section 2, the six spheres were initially positioned in the AB plane and later in the BC plane. This process resulted in six random measurements of the external diameter for each sphere, with three measurements obtained in each plane. Table 2 presents the measurement results, including the calculated means and sample standard deviations (SDs), obtained using the Leica AT960 laser tracker in conjunction with the T-Scan reference measurement system. On the other hand, Table 3 presents the results obtained with the FARO Focus laser scanner measurement system.
The results of the sphere measurements obtained with the two methods (Table 2 and Table 3) served as the basis for estimating the measurement uncertainties of the sphere diameters with the Leica T-Scan (Table 4) and the Focus laser scanner (Table 5).
For Table 4 and Table 5, the largest standard deviation value of each method was used for the calculations. These sources were considered Type A contributions to measurement uncertainty [26,27,28], with a Student’s t probability distribution [31,32], using a divisor of n , where n is equal to six measurements, and degrees of freedom (νi) equal to n − 1 [26,27,28]. The values used in the calculations are presented in Table 4 and Table 5.
Another source of uncertainty was the sphere form error, which was measured with the GOM 3D optical scanner for each sphere, with the largest error being 0.716 mm obtained for sphere 6. This sphere form error was considered a Type B contribution to measurement uncertainty in both measurements with the Leica T-Scan and the Focus laser scanner, and it was considered as a rectangular probability distribution with a divisor 12 , and infinite degrees of freedom, according to ISO GUM [26,27,28].
The third source of uncertainty for the measurements with the Leica T-Scan, serial number 751,396, relates to the linear measurement uncertainty, as reported in the Hexagon calibration certificate No. 611/21 dated 23 September 2021, valid until 26 September 2026. The value of the measurement uncertainty of 0.0012 mm and the maximum observed deviation of measurements at the spatial distance of 10 m, being −0.045 mm (uncorrected error), were used in the calculations in Table 4. The measurement uncertainty was considered as a normal distribution, divisor k = 2, with infinite degrees of freedom.
As for the third source of uncertainty for the measurement with the Focus laser scanner, serial number LLS081811991, this pertains to the linear measurement uncertainty, as reported in the FARO calibration certificate No. LLS11991-20221213-US dated 13 December 2022, valid until 27 December 2023. A measurement uncertainty value of 0.20 mm and a maximum deviation up to 25 m, being 0.18 mm (uncorrected error), were used in the calculations in Table 5. The measurement uncertainty was considered as a normal distribution, divisor k = 2, with infinite degrees of freedom.
The calculations to estimate the measurement uncertainty (Table 4 and Table 5) were performed following the ISO GUM methodology [26,27,28]. In this methodology, the expression of measurement uncertainty was formulated with two significant figures, and the measurement of the measurand (sample mean) was adjusted and rounded to the same number of decimal places as the already rounded measurement uncertainty [28]. Equation (1) was employed in the calculations, in accordance with the section “F.2.4.5 Uncertainty when corrections from a calibration curve are not applied” of the GUM [26]. In this Equation (1), the measurement uncertainty (U) is computed by multiplying the combined standard uncertainty uc(y) by a coverage factor (k) and adding the largest absolute bias or uncorrected error ( b m a x ) [26].
U = k · u c y + b m a x
Equation (2) enables the precise calculation of the k value, using the bilateral t-distribution (t95.45%) and the effective degrees of freedom νeff to obtain an interval with a confidence level of 95.45% [26,27,28].
k = t 95.45 % ν e f f
The νeff values were computed using the Welch–Satterthwaite formula (Equation (3)). In cases where the calculation of νeff does not result in an integer, which is typically the case, νeff is truncated to the next lower integer [26,27,28].
ν e f f = u c 4 y i = 1 N u i 4 y ν i   w i t h   ν e f f i = 1 N ν i
The measurement uncertainty estimates for the external diameter of spheres measured with the Leica T-Scan (UØTscan) is presented in Equation (4), calculated based on Equations (1)–(3).
U T s c a n = 2.00 × 0.2100   mm + 0.045   mm = 0.47 mm
Equation (5) outlines the calculation of the measurement uncertainty estimate for the external diameter of spheres measured with the Focus laser scanner (UØFocus).
U F o c u s = 2.06 × 0.2846   mm + 0.18   mm = 0.77 mm
A budget of the standard uncertainties for the measurements of the external diameters of the spheres is presented in Figure 6. It is observed that the primary source of measurement uncertainty for the external diameters of the spheres with the Leica T-Scan is the sphere form error, accounting for 96.9% of the combined standard uncertainty (Figure 6a). In the case of the Focus laser scanner, it is evident that the sphere form error and the repeatability of measurements together contribute to 87.7% of the combined standard uncertainty (Figure 6b). This demonstrates that, particularly in large-volume measurement or LSM, the Leica T-Scan serves as a reference instrument.
In the graph presented in Figure 7, a comparison of the measurements of the mean external diameters of the spheres using both methods are depicted, with the vertical bars representing the measurement uncertainty for each method.
Figure 7 seemingly indicates that there is no significant difference between the values of the external diameters of the six spheres obtained by the two methods. In this case, a statistical comparison was conducted on the mean results of the external diameter measurements for each sphere and their measurement uncertainties using Duncan’s test [31,33]. Thus, it can be determined whether there are significant differences (SDif) or no significant differences (NSDif) between the results obtained using the two methods.
Duncan’s test considers that the means are different from each other when their origins are from different populations (Gaussian distribution), meaning that the normal curves around the means do not overlap. In this case, the difference between the means is considered significant if the value is greater than the decision limit (DL), calculated as three times the experimental standard deviation of the means s x ¯ i , and expressed according to Equation (6) [31,33,34]. In this study, the value of s x ¯ i is estimated by the combined standard uncertainty u c p o l l e d as per Equation (7), where u c p o l l e d is calculated as a combined variance (Equation (10) in GUM) with partial derivatives equal to one [26]. Table 6 presents the comparison of results between the two methods.
D L = 3 · s x ¯ i = 3 · u c p o l l e d
u c p o l l e d = U 1 k 1 2 + U 2 k 2 2
Since all differences between the means, deviations in Table 6, considered in absolute value, were smaller than the DL of 1.32 mm, it is assumed that there is no significant difference between the two methods in the measurements of the external diameters of the spheres.

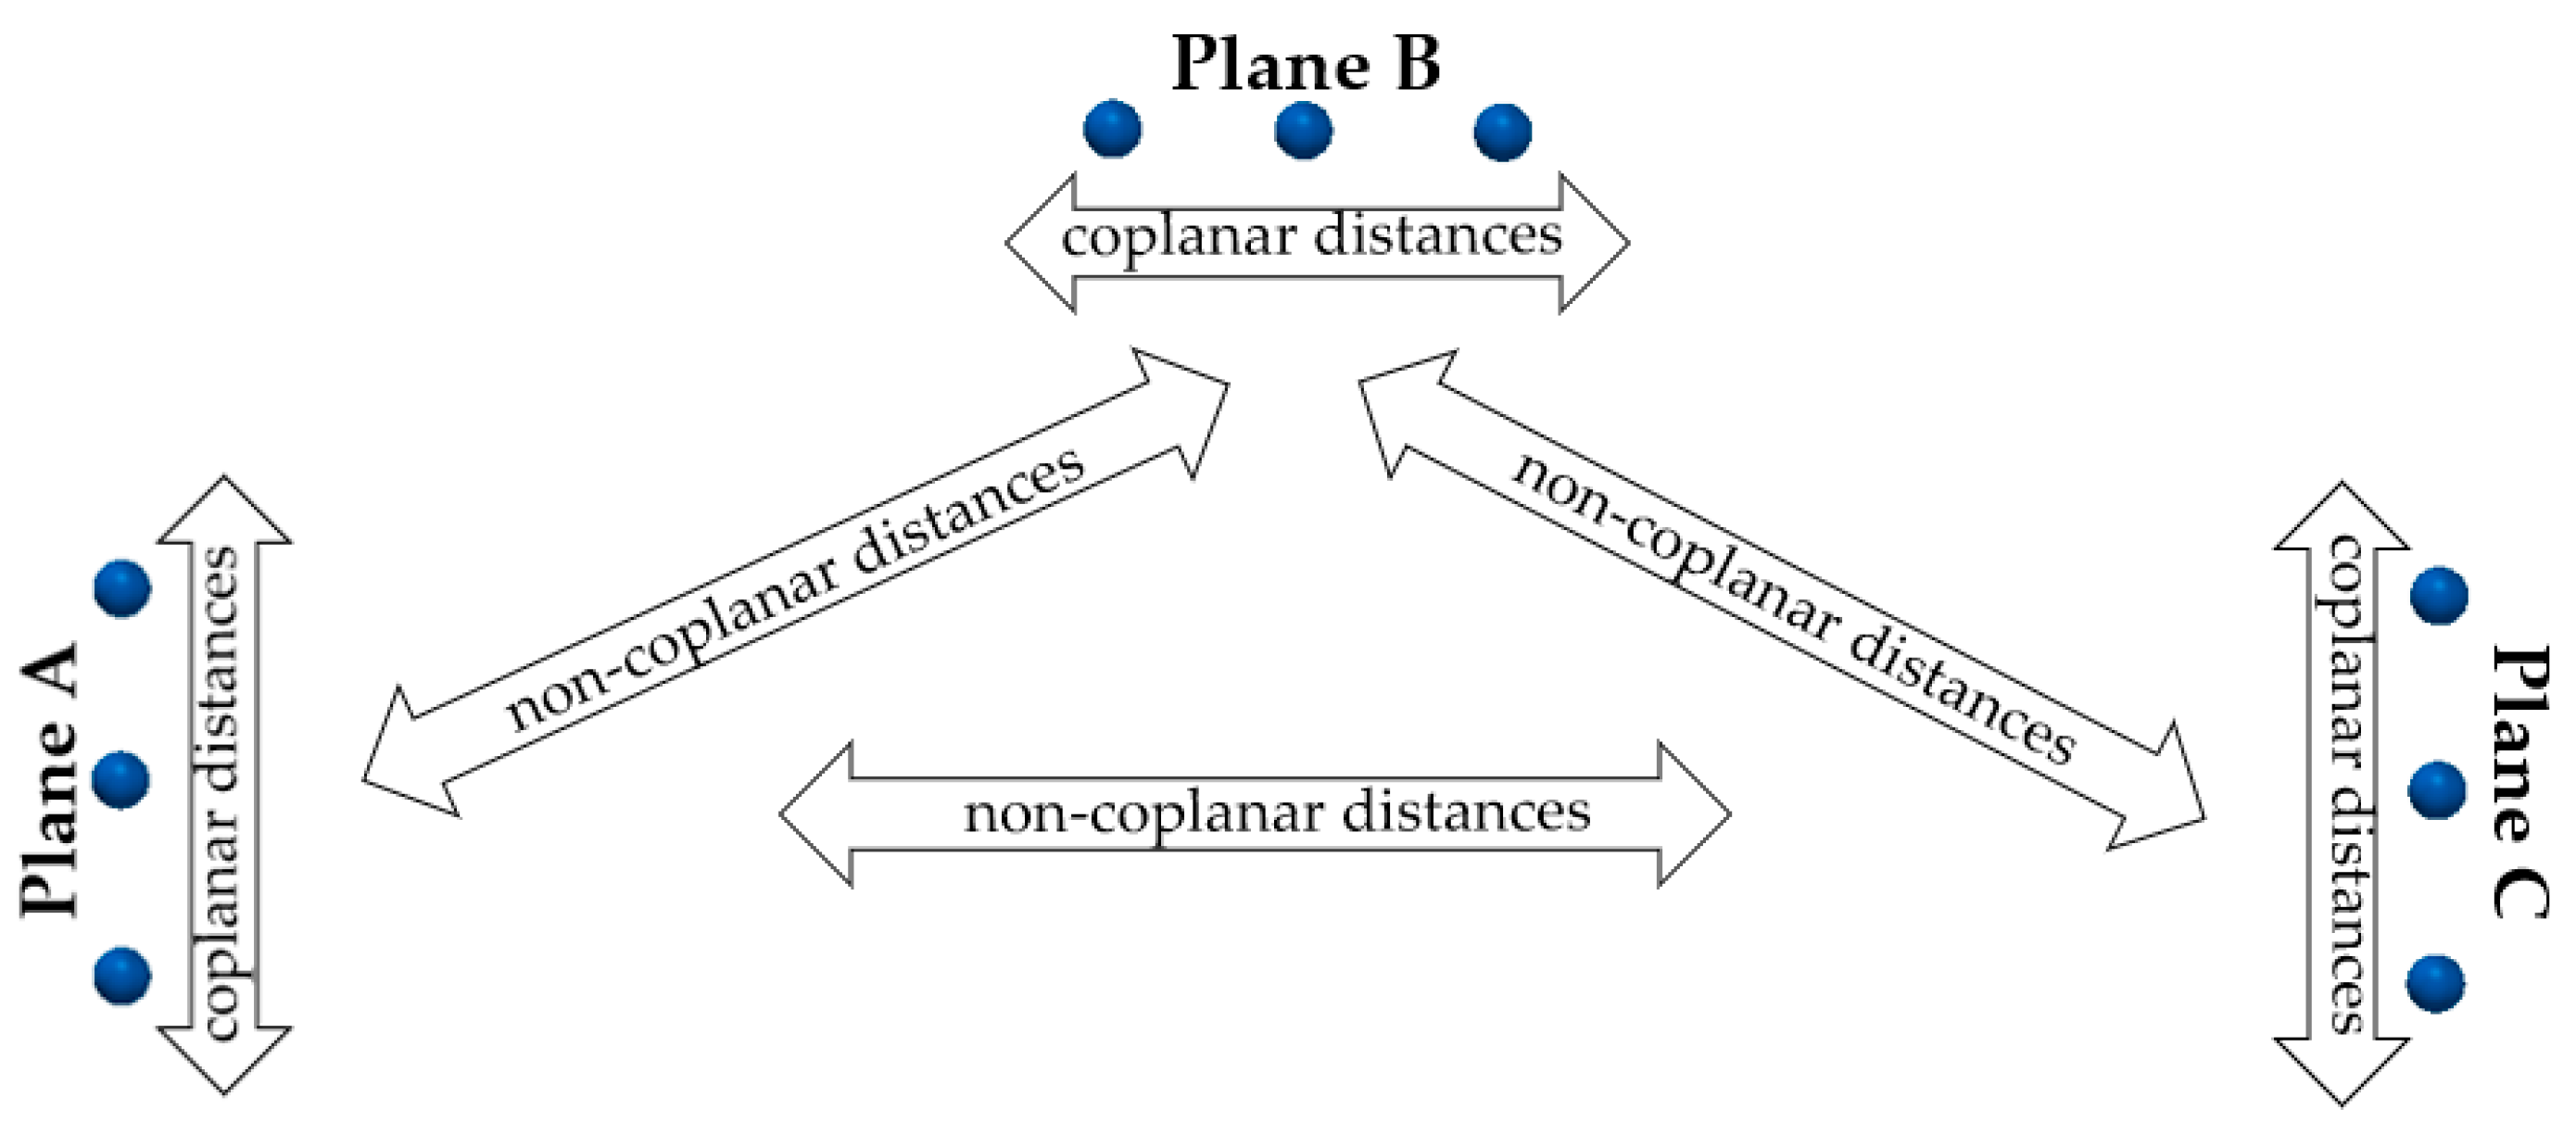
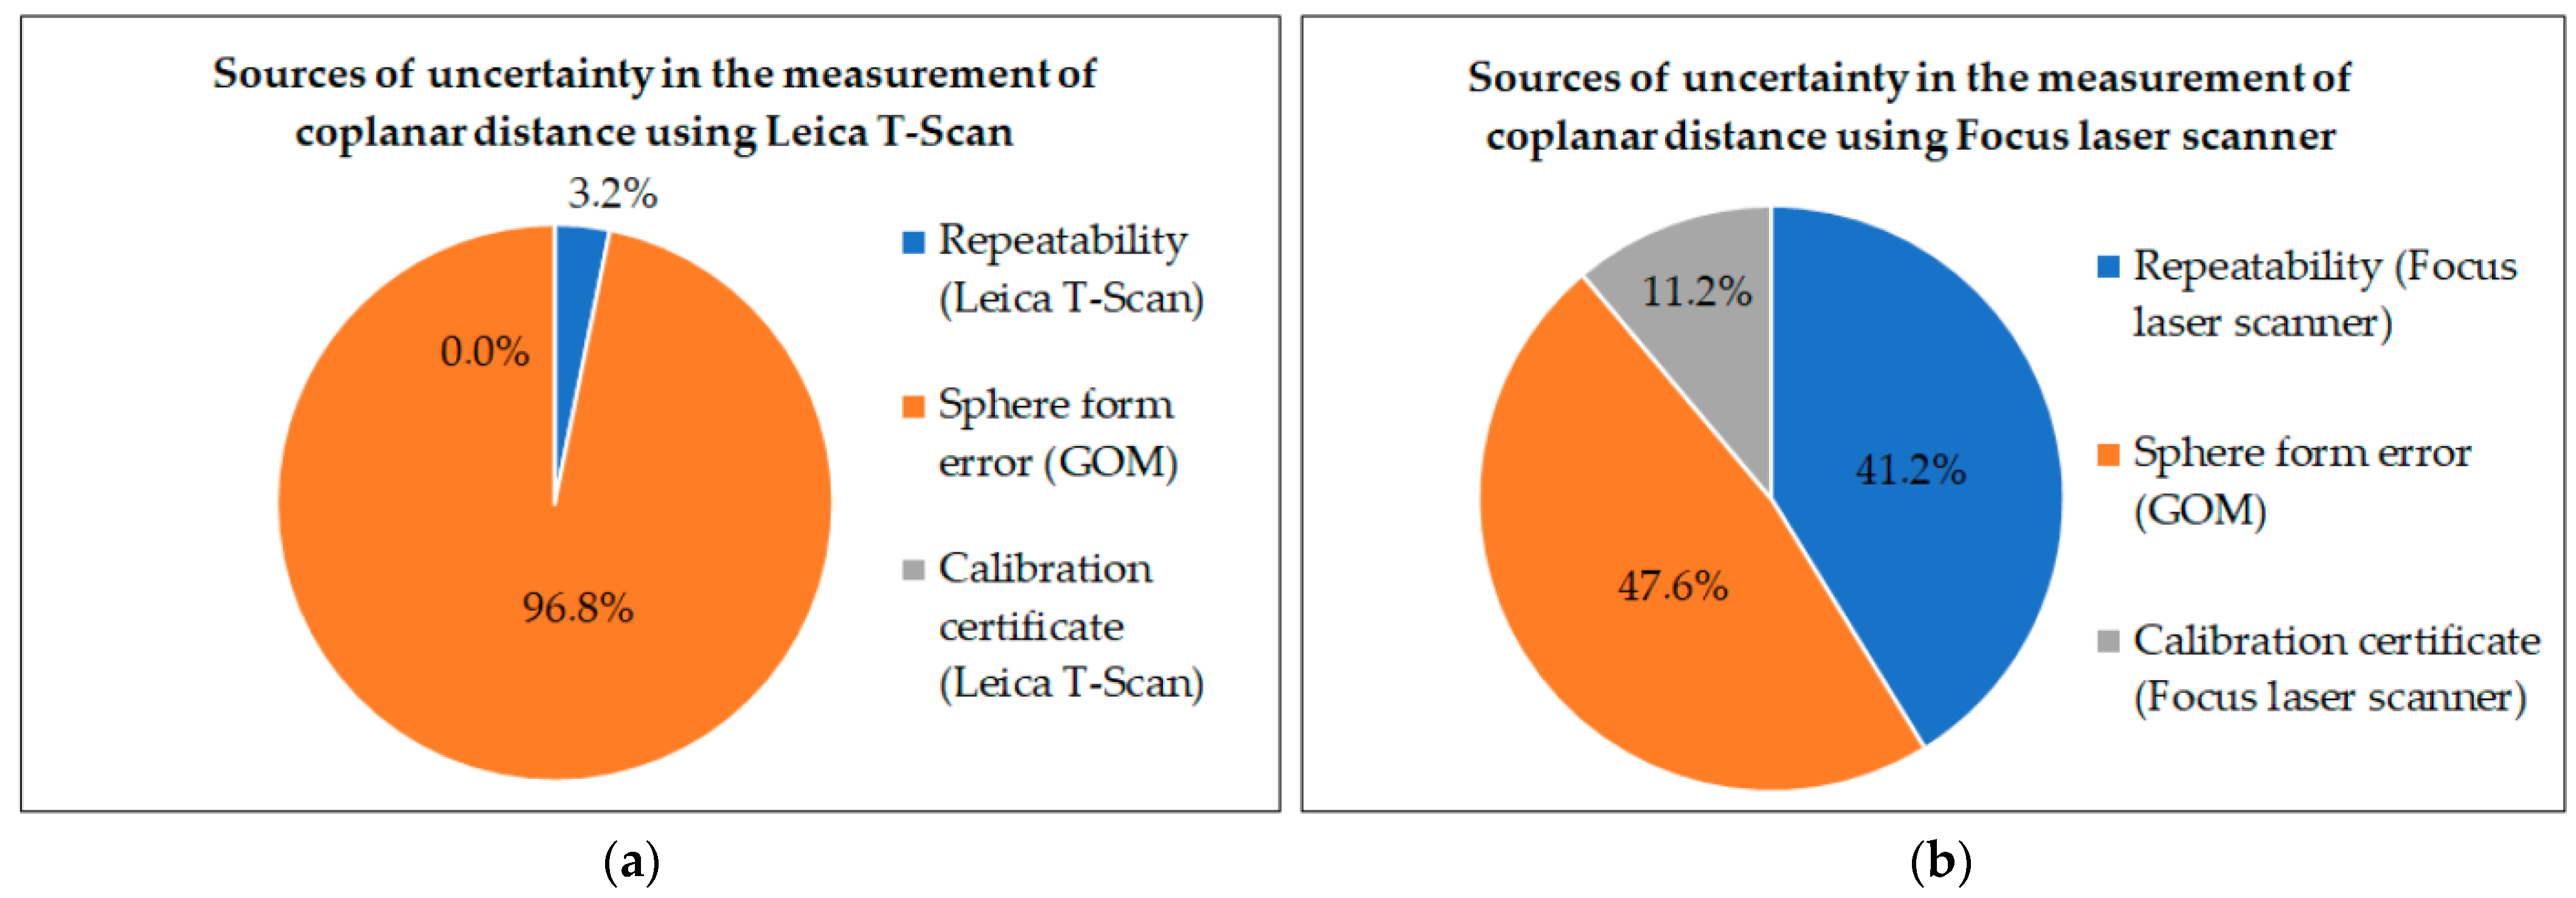
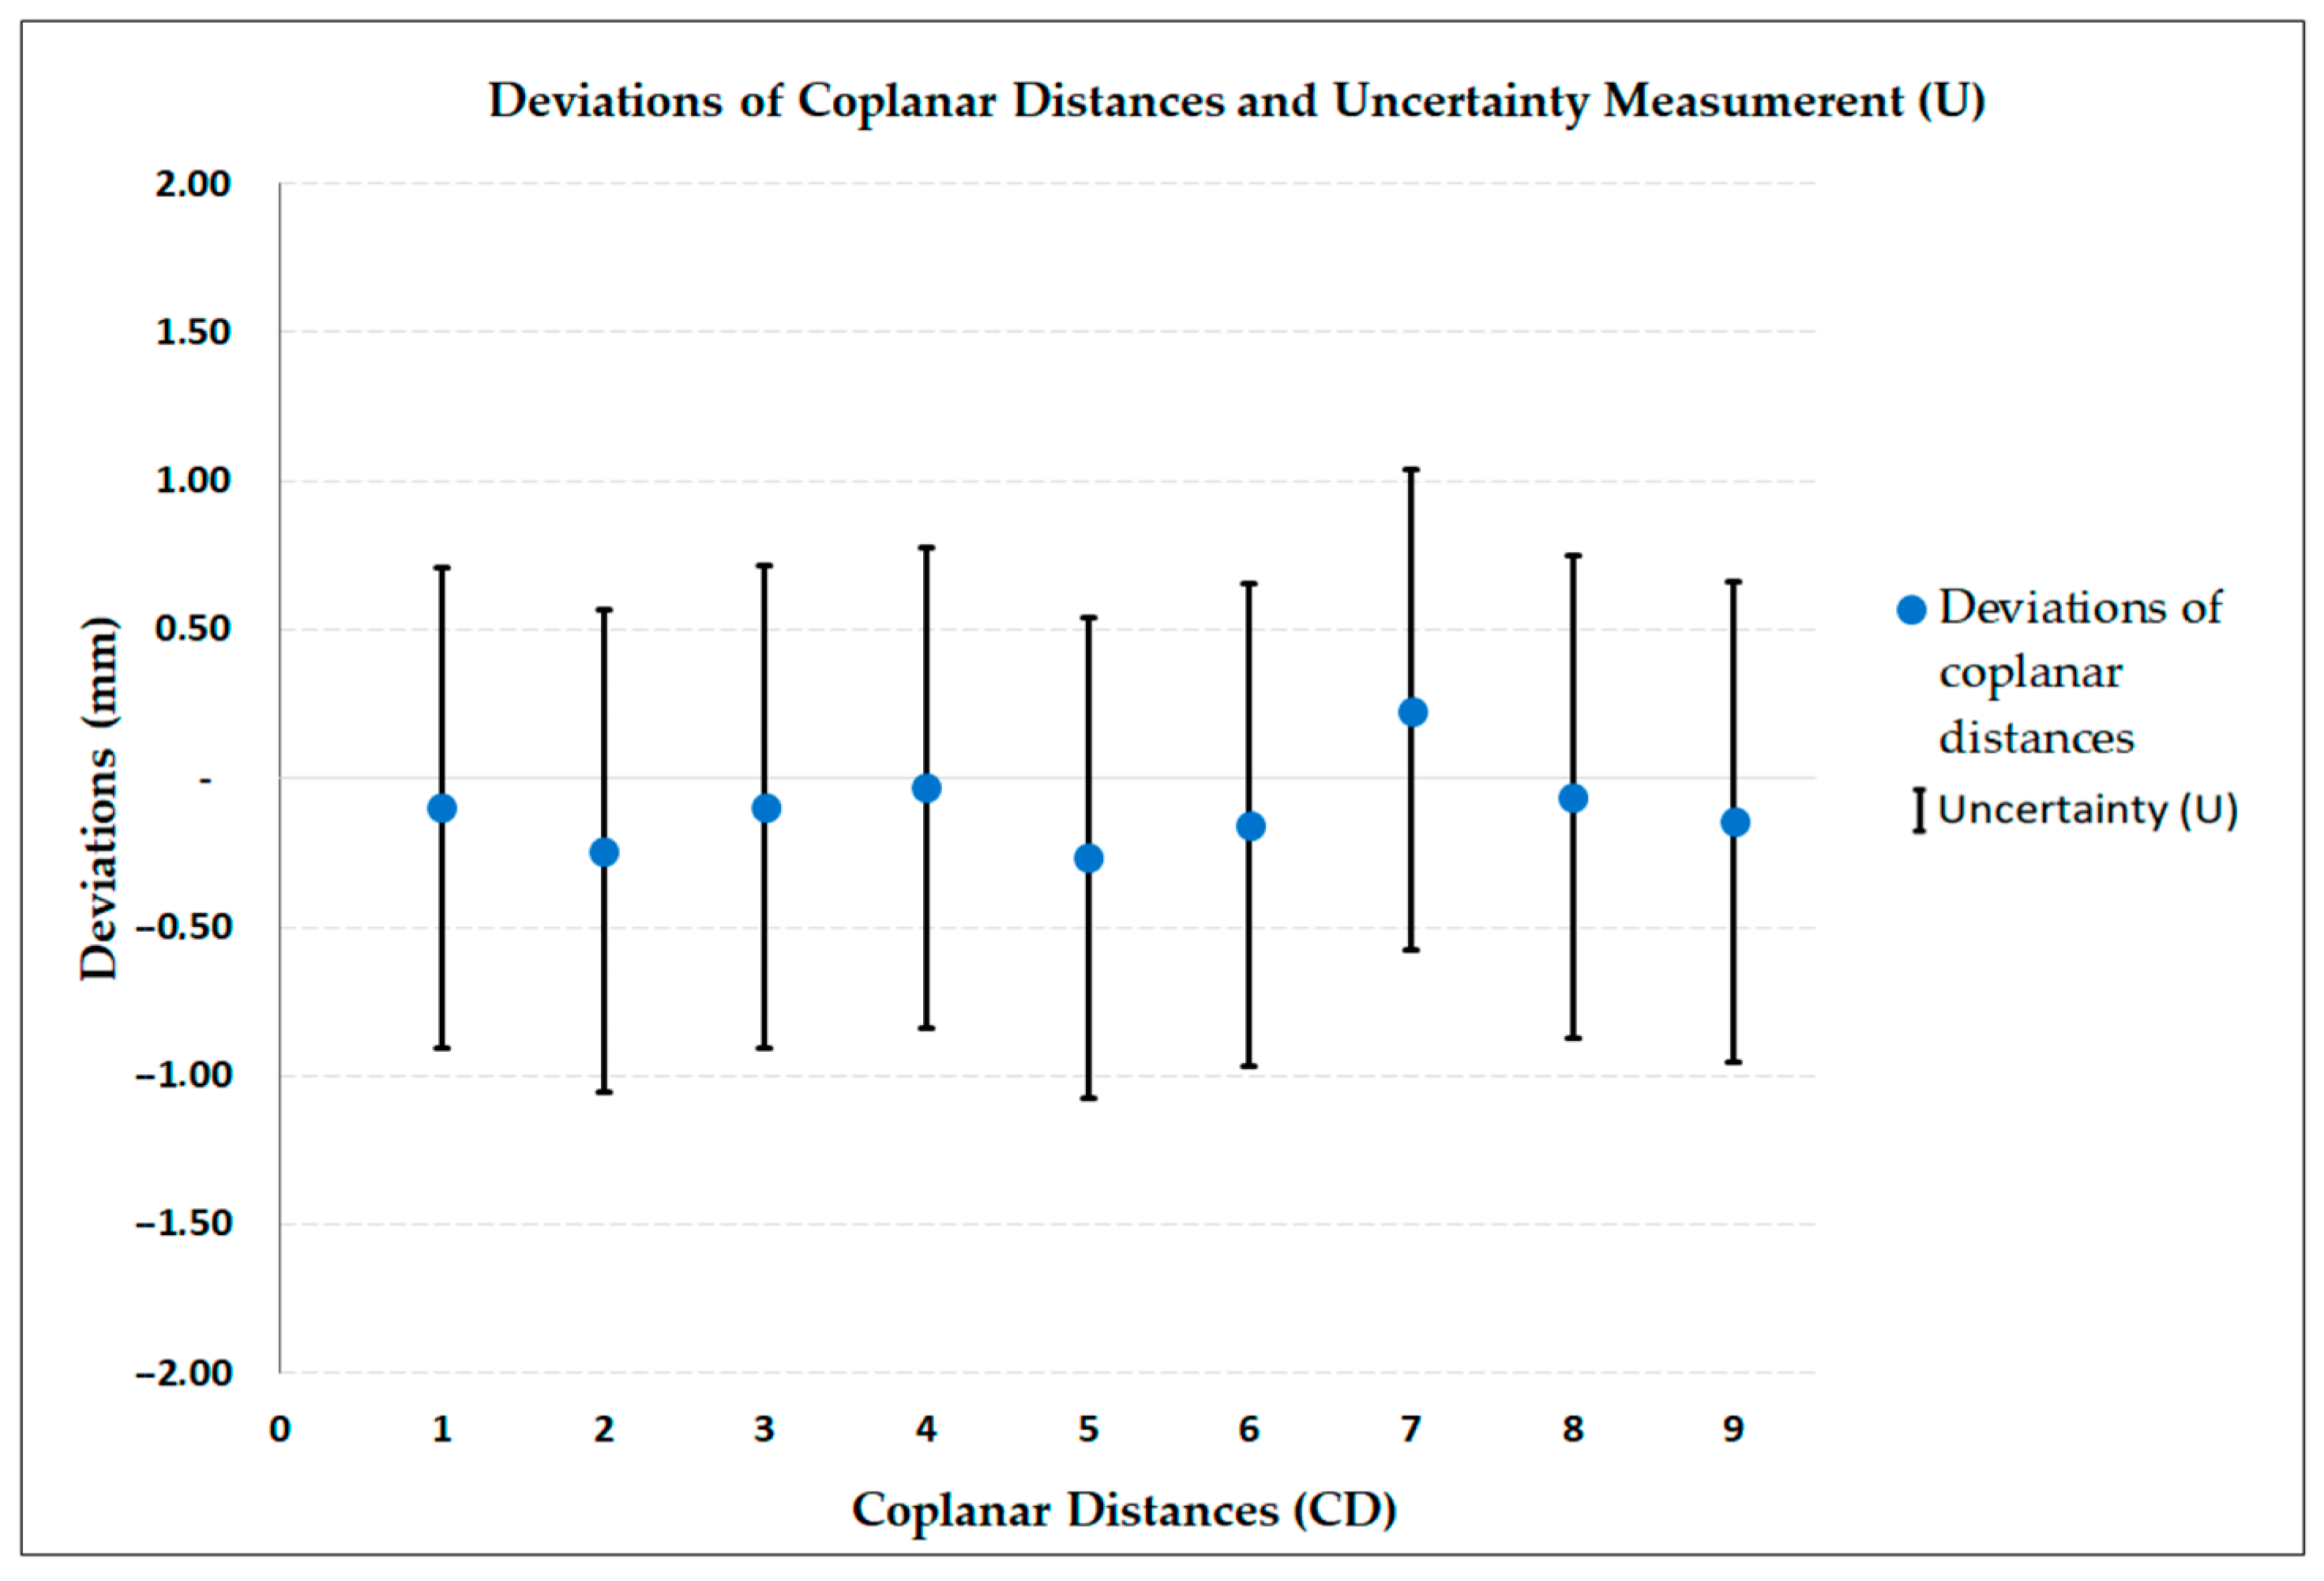
3.3. Measurement of Coplanar Distances with Leica T-Scan and Focus Laser Scanner, and Estimates of Measurement Uncertainties

The measurements of the nine coplanar distances were obtained between the centers of the three spheres positioned in each plane (Figure 3). In order to organize and tabulate these distances, a tag called CD, meaning “Coplanar Distance”, was created and numbered from 1 to 9 (Table 7).
Table 7 presents the calculated values of means and sample standard deviations obtained with the Focus laser scanner measurement system and with the reference measurement system, the Leica AT960 laser tracker in conjunction with the T-Scan, for the coplanar distances. The last column in this table shows the deviation value, which is the difference between the mean distance obtained with the Focus laser scanner and the mean distance obtained with the Leica T-Scan. The deviation values numerically indicate the accuracy of the Focus laser scanner for coplanar distances in this measurement volume.
Analyzing the results presented in Table 7, it can be observed that the highest standard deviation was 0.092 mm with the Leica T-Scan and 0.471 mm with the Focus laser scanner. It is noteworthy that this repeatability measure obtained with the Focus laser scanner is more than four times larger than the repeatability obtained with the Leica T-Scan, similar to what was observed in the measurements of the external diameters of the spheres (Table 2 and Table 3).
The measurement uncertainty estimates for the coplanar distances obtained with the Leica T-Scan and the Focus laser scanner have the same sources of uncertainty described earlier for the measurements of the external diameters of the spheres. However, in the case of coplanar distances, the highest standard deviation value (highest values in the SD columns in Table 7) of each method was used to elaborate the measurement uncertainty calculations for the coplanar distances obtained with the Leica T-Scan (Table 8) and the Focus laser scanner (Table 9).
The budget of the standard uncertainties for coplanar distances is illustrated in Figure 8. It is evident that the primary source of measurement uncertainty in coplanar distance measurements with the Leica T-Scan is the sphere form error, contributing 96.8% to the combined standard uncertainty (Figure 8a). Similarly, with the Focus laser scanner, it is apparent that the combined effects of sphere form error and repeatability constitute 88.9% of the combined standard uncertainty (Figure 8b). These patterns of uncertainty sources closely resemble those presented earlier in the measurements of the spheres’ external diameters (Figure 6).
The deviation values (difference between means) presented in Table 7 were compared with the decision limit for coplanar distance measurements, following Duncan’s test [31,33,34]. The DL for coplanar distances was calculated using Equations (6) and (7), using the values U1 = 0.47 mm and k1 = 2.00 (values obtained in Table 8), U2 = 0.81 mm and k2 = 2.09 (values obtained in Table 9), resulting in DL = 1.36 mm. Since all differences between the means (deviations in Table 7), considered in absolute value, were smaller than the calculated DL value, it is considered that there is no significant difference between the two methods. This confirms the accuracy of the Focus laser scanner method for coplanar distance measurements, albeit with double the measurement uncertainty of the Leica T-Scan. Figure 9 shows the deviations of the average coplanar distances between the Focus and T-Scan (Table 7), where the vertical bars represent the measurement uncertainty of the Focus laser scanner method in coplanar distance measurement.

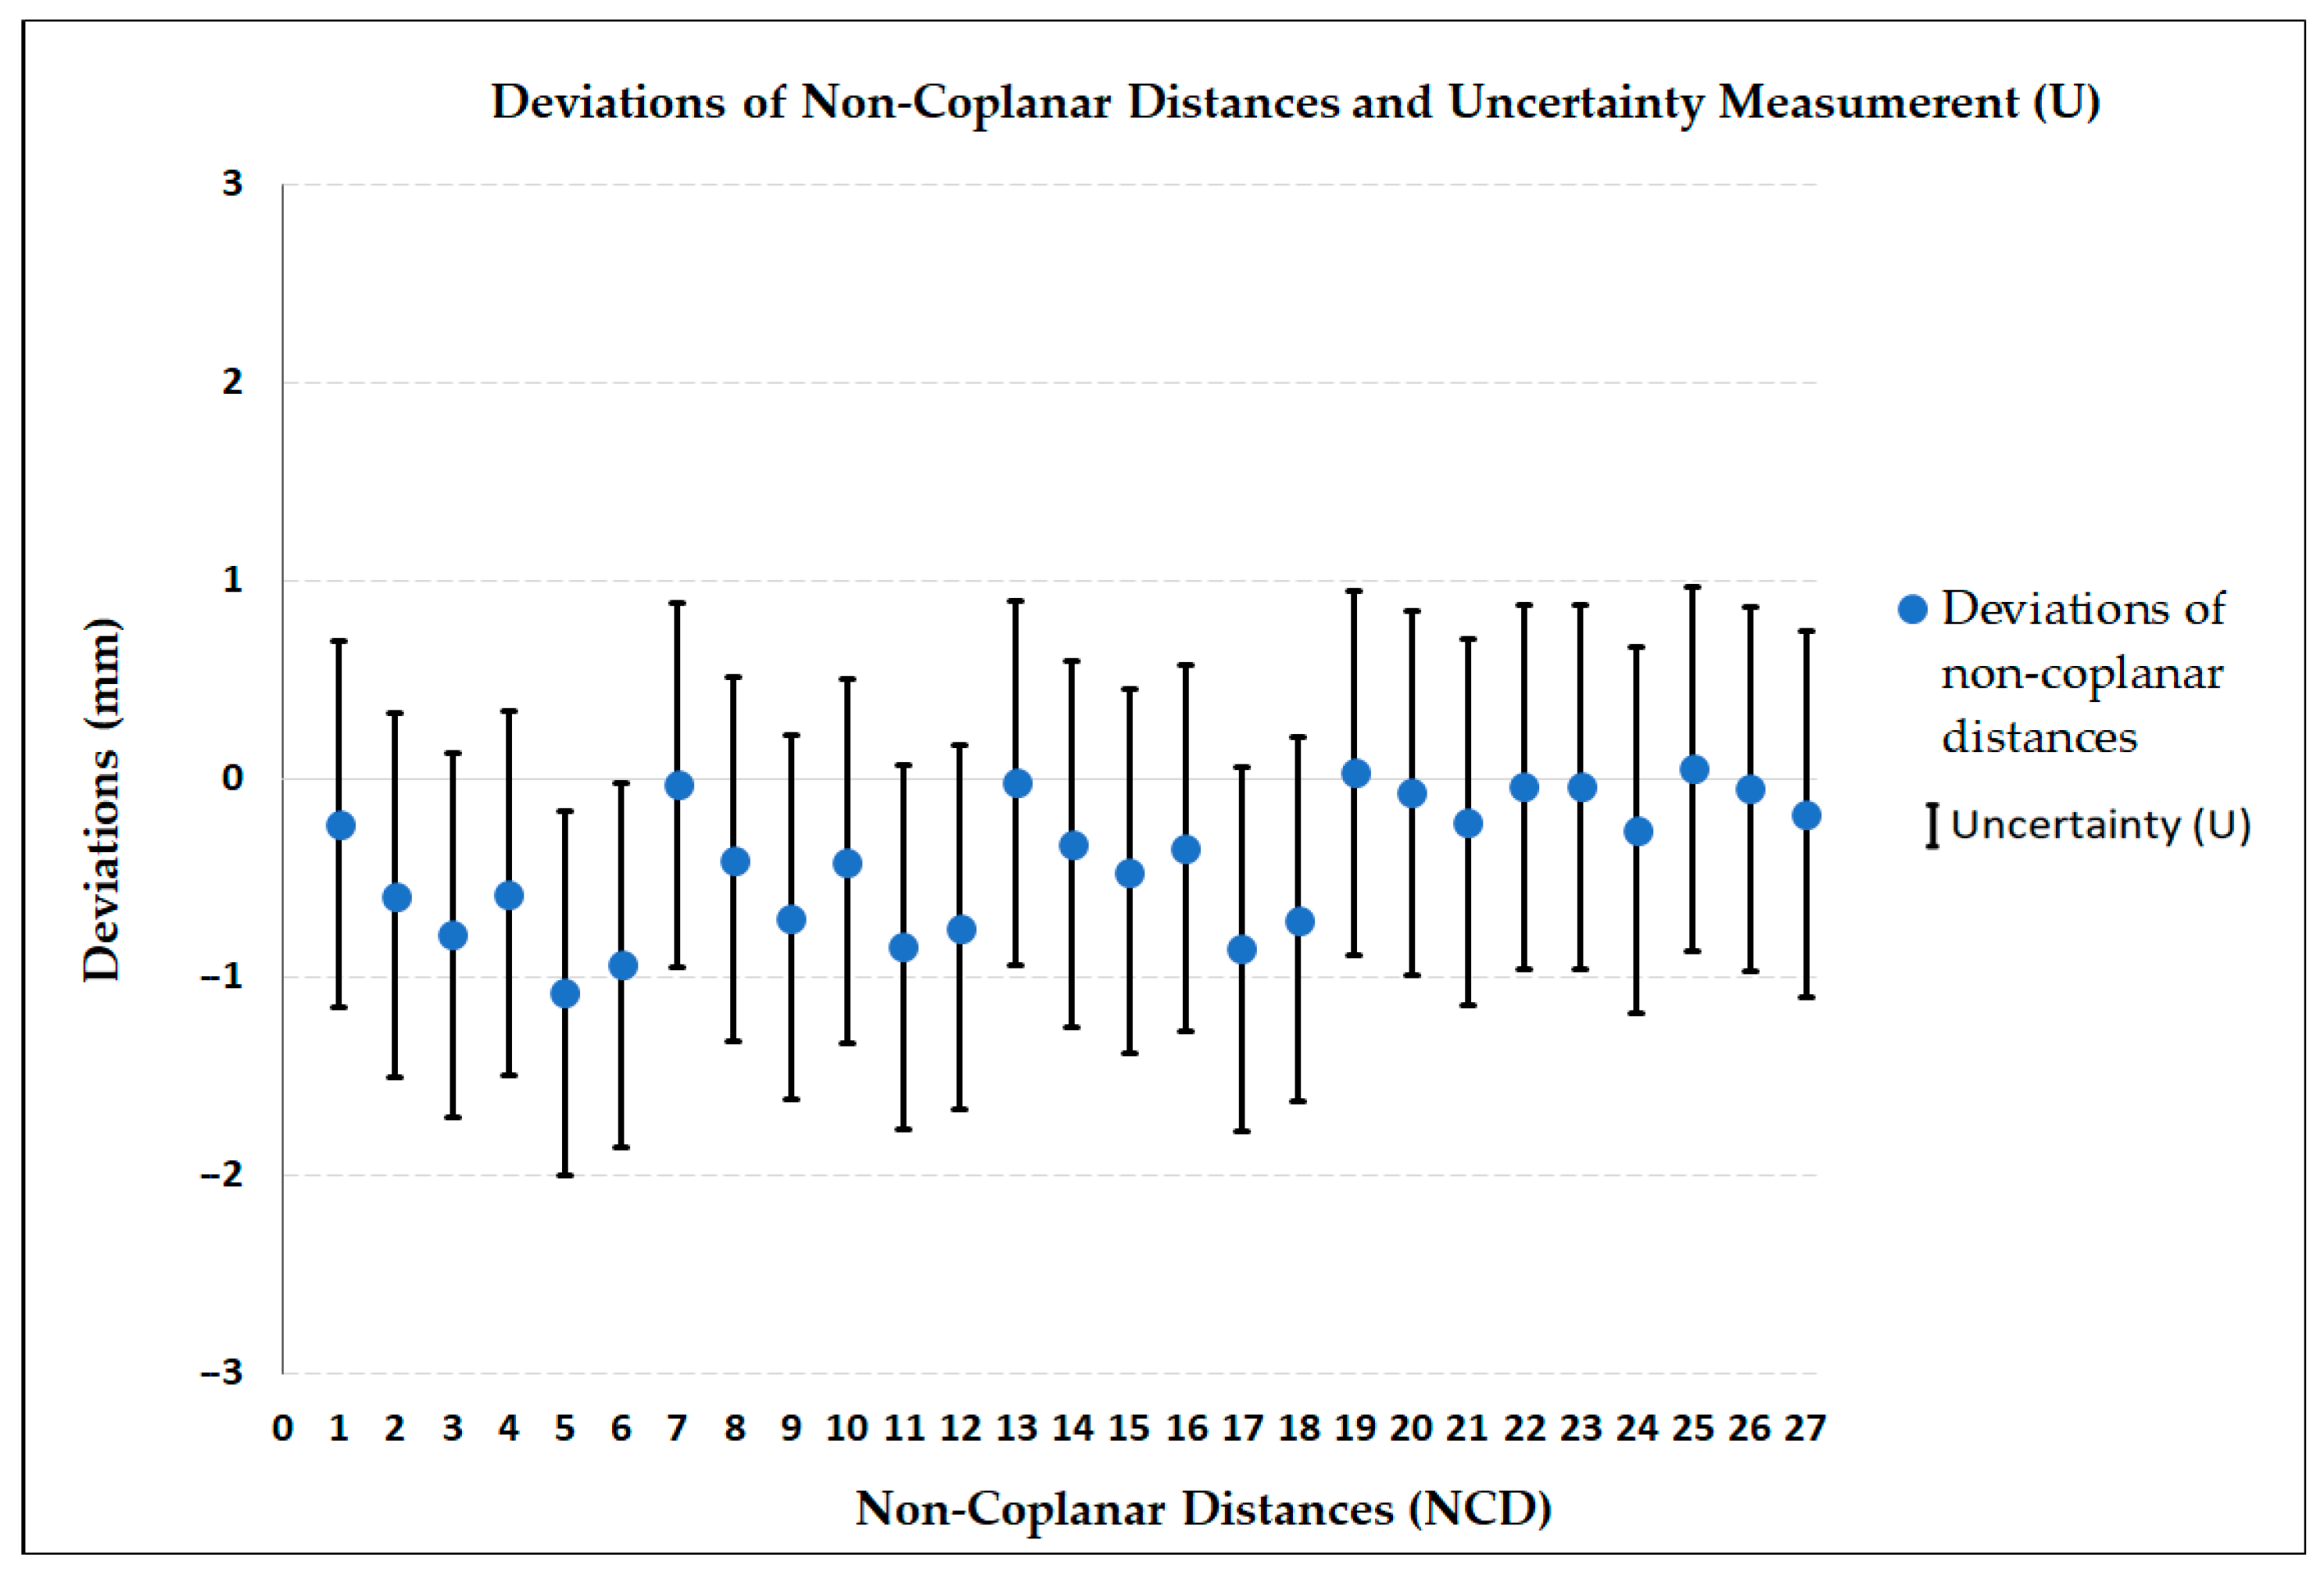
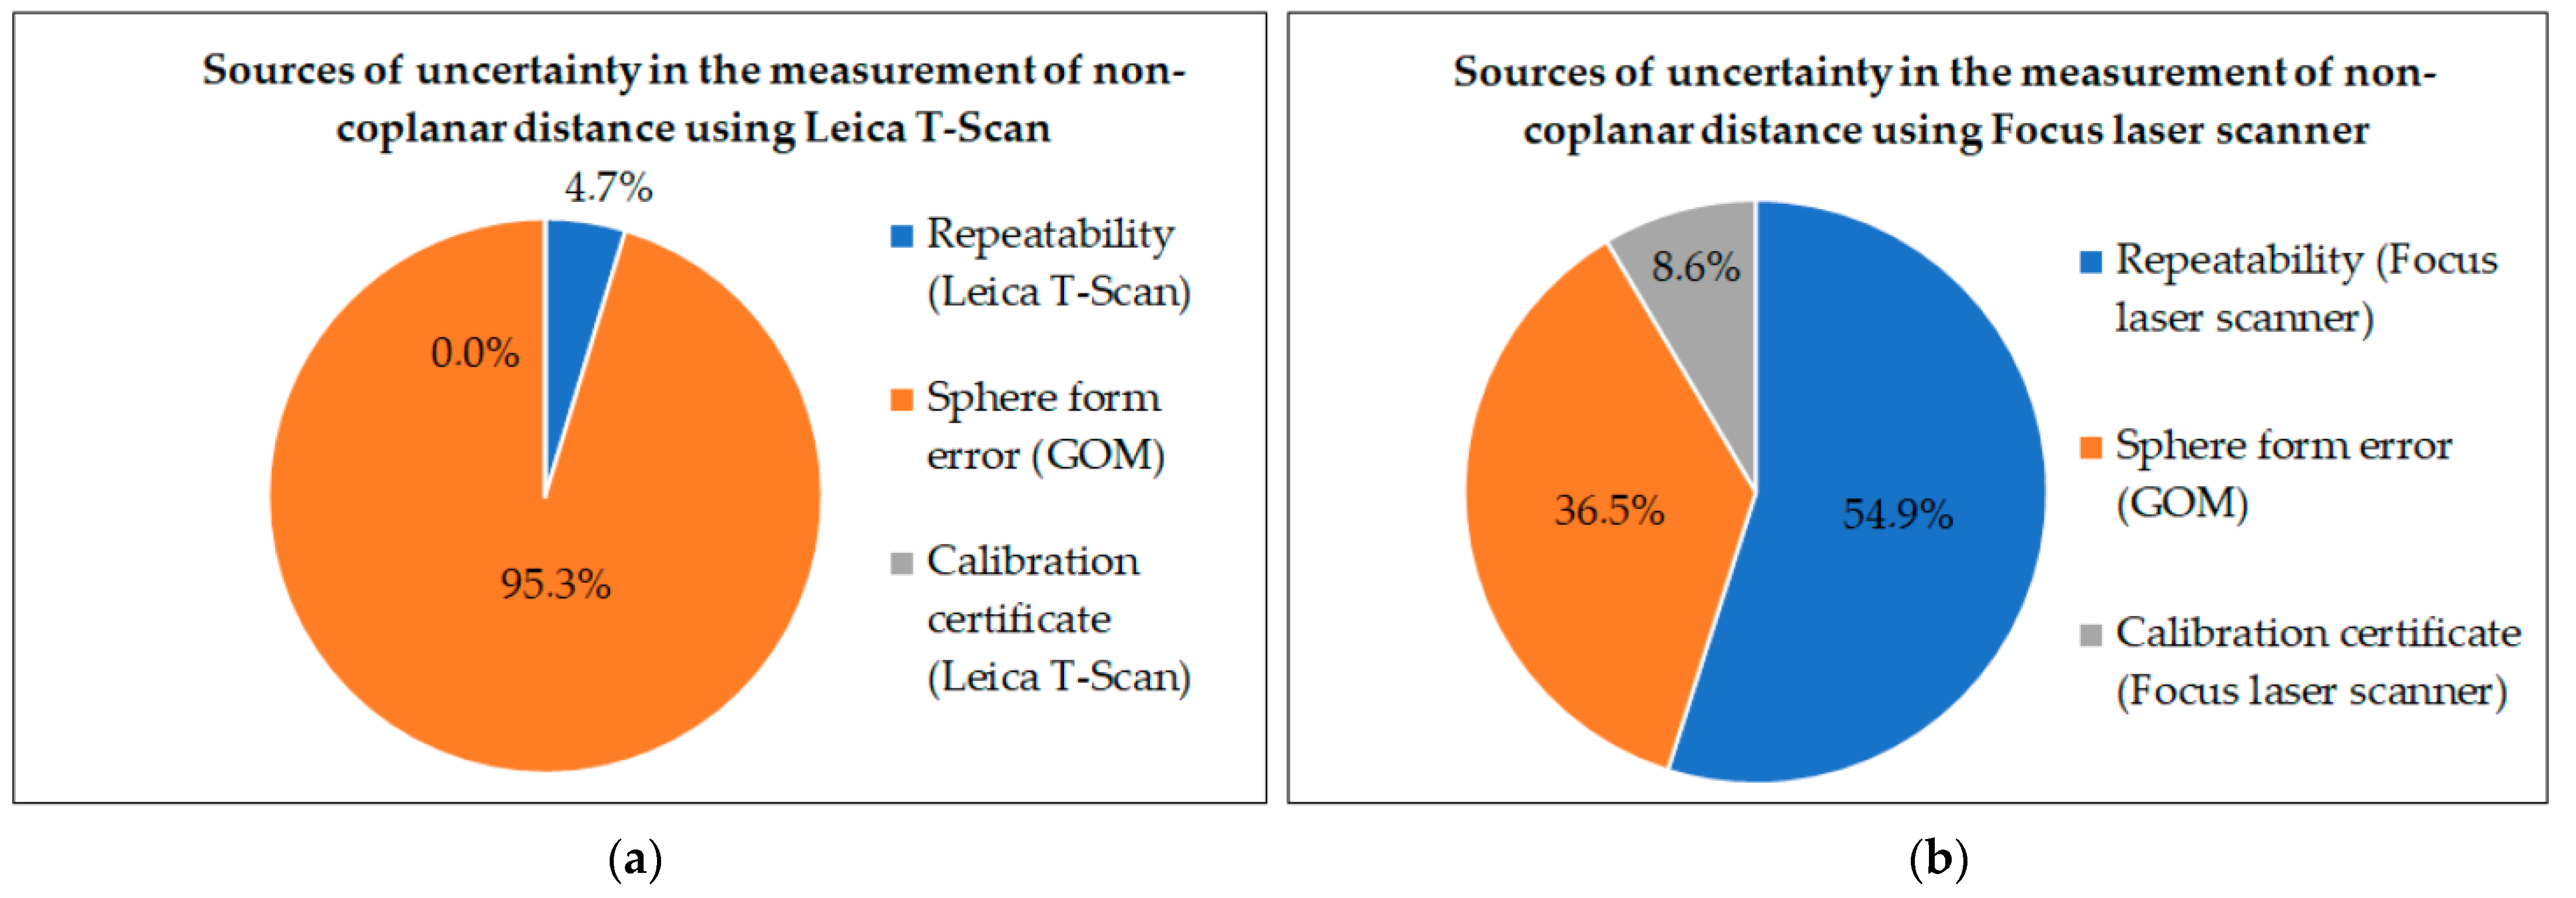
3.4. Measurement of Non-Coplanar Distances with Leica T-Scan and Focus Laser Scanner, and Estimates of Measurement Uncertainties

The measurements of the twenty-seven non-coplanar distances were obtained between the center of each sphere positioned in one plane in relation to the six spheres positioned in the other two planes (Figure 3 and Figure 5). The TAG created for this case was titled NCD and is used in the table of measurement results, meaning “Non-Coplanar Distance”, numbered from 1 to 27. The calculated values of means, standard deviations, and deviations for non-coplanar distances, obtained with the Focus laser scanner and the Leica T-Scan, are presented in Table 10. In Table 10, the cells with the highest standard deviation values are 0.112 mm for the Leica T-Scan and 0.621 mm for the Focus laser scanner.
It is observed that this repeatability measure obtained with the Focus laser scanner is almost six times larger than the repeatability obtained with the Leica T-Scan, a value slightly higher than that obtained in the measurements of external diameters of spheres (Table 2 and Table 3) and coplanar distances (Table 7).
The estimates of measurement uncertainty for non-coplanar distances, obtained with the Leica T-Scan and the Focus laser scanner, also have the same sources of uncertainty described earlier for the measurements of external diameters of spheres and coplanar distances. The highest standard deviation value (highest values in the SD columns in Table 10) of each method was used to elaborate the measurement uncertainty calculations for non-coplanar distances obtained with the Leica T-Scan (Table 11) and the Focus laser scanner (Table 12).
Figure 10 presents the budget of standard uncertainties for non-coplanar distances. In it, the sphere’s form error is the most significant source of measurement uncertainty for coplanar distances measured with the Leica T-Scan, contributing 95.3% to the combined standard uncertainty (Figure 10a). The sphere’s form errors and the repeatability of measurements together are responsible for 91.4% of the combined standard uncertainty (Figure 10b) of the Focus laser scanner. These behaviors of uncertainty sources are similar to those presented earlier in the measurements of external diameters of spheres (Figure 6) and coplanar distances (Figure 8).
The deviation values (difference between means) presented in Table 10 were compared with the decision limit for non-coplanar distance measurements, following the Duncan’s test [31,33,34]. The DL calculation for non-coplanar distances was performed using Equations (6) and (7), using the values U1 = 0.47 mm and k1 = 2.00 (values obtained from Table 11), U2 = 0.92 mm and k2 = 2.17 (values obtained from Table 12), resulting in DL = 1.45 mm. Since the largest deviation is −1.08 mm (Table 10), being in modulus a value smaller than the 1.45 mm DL value, it is considered that there is no significant difference between the two methods. This also confirms the accuracy of the Focus laser scanner method for non-coplanar distance measurements, albeit with twice the measurement uncertainty of the Leica T-Scan. The deviations of the average non-coplanar distances between the Focus and T-Scan (Table 10) are presented in Figure 11, where the vertical bars represent the measurement uncertainty of the Focus laser scanner method in non-coplanar distance measurements.

4. Discussion

The first consideration pertains to the choice of a laboratory environment with controlled climatic conditions, similar to the approach proposed in the articles by Beraldin et al. [5], Wang et al. [6], Muralikrishnan et al. [24], and Boehler et al. [25]. This prevents environmental uncertainties from significantly influencing the measurement uncertainty calculations in the laser scanner accuracy assessment.
The second consideration involves the use of a laser tracker as a reference instrument, a practice employed in the works of Beraldin et al. [5], Wang et al. [6], and Muralikrishnan et al. [24].
The third consideration relates to the use of sphere centers as a reference for determining measurements between center-to-center distances, as described by Wang et al. [6], Muralikrishnan et al. [24], and Boehler et al. [25].
The fourth and final consideration involves assessing the accuracy of the laser scanner at distances up to 10 m, as cited by Beraldin et al. [5], FARO [18], and Boehler et al. [25].
Regarding the analysis of the results obtained in this study, the shape errors of the six spheres used to measure coplanar and non-coplanar distances with the Leica T-Scan and Focus laser scanner were initially examined. In this analysis, the polypropylene spheres with a nominal diameter of 150 mm, specifically designed for non-contact scanning systems, exhibited shape errors ranging from 0.195 mm to 0.716 mm. The largest shape error was considered a Type B measurement uncertainty source in the uncertainty calculations, becoming the primary uncertainty source in measurements with the Leica T-Scan, accounting for over 95% of the estimated uncertainties for this method. Muralikrishnan et al. [24] (p. 554) describe the importance of determining the sphere’s shape error for assessing the derived-point-to-derived-point distance performance of a laser scanner.
In the case of measurements with the Focus laser scanner, the sphere’s form error accounted for 52.8% of the uncertainty in the measurements of external sphere diameters, 47.7% of the uncertainty in coplanar distances, and 36.5% of the uncertainty in non-coplanar distances. The reduced influence of the sphere’s form error in measurements with the Focus laser scanner is attributed to its lower precision compared to the Leica T-Scan. The repeatability values obtained with the Focus laser scanner were four to six times larger than the repeatability values obtained with the Leica T-Scan for the same spheres, in the same laboratory environment, and under the same environmental conditions. However, this lower precision of the Focus laser scanner, in comparison to the Leica T-Scan, was expected, as indicated by the specifications provided by both manufacturers. Additionally, calibration certificates further corroborate this difference, where the measurement uncertainty in the calibration of the Leica T-Scan, as expressed in Hexagon Calibration Report No. 611/21, dated 23 September 2021, is 0.0012 mm, while the measurement uncertainty in the calibration of the Focus, as expressed in FARO Calibration Report No. LLS11991-20221213-US, dated 13 December 2022, is 0.20 mm. This discrepancy in calibration uncertainties highlights that the repeatability of the two instruments differs, and notably, the reference standard for calibrating the Focus, as indicated in Certificate No. LLS11991-20221213-US, is a Vantage-E laser tracker.
The comparison between the methods was conducted using measurements of the external diameters of the six spheres. The results presented in Figure 7 and Table 6 demonstrate that there are no significant differences between the two methods in these measurements. This confirms the accuracy of the Focus laser scanner method for external diameter measurements of spheres, albeit with almost twice the measurement uncertainty of the Leica T-Scan. It is noteworthy that over 95% of the measurement uncertainty with the Leica T-Scan originates from the source of sphere shape error.
However, the main comparison of results in this study pertains to the measurements of coplanar and non-coplanar distances.
In the measurement of the nine coplanar distances, the highest deviation obtained was −0.26 mm (Table 7), with the measurement uncertainty using the Focus being 0.81 mm (Table 9) and using the Leica T-Scan being 0.47 mm (Table 8). In this case, there was no significant difference between methods because the calculated decision limit was 1.36 mm, and the highest deviation, in absolute value, was 0.26 mm (Table 7). In this scenario, the uncertainty of the Focus was also nearly double that of the Leica T-Scan. Examining the chart depicted in Figure 9 reveals that the range between “deviation + U” and “deviation − U” for each coplanar distance was roughly ±1 mm. Muralikrishnan et al. [24] (p. 554) declare that the errors of the laser scanner with center-to-center measured distances in spheres were up to 0.3 mm. Wang et al. [6] presented results of symmetric tests of a laser scanner with errors of up to −0.443 mm. The highest value found in our study for coplanar distances (−0.26 mm in Table 7) aligns with these observations (0.3 mm and −0.443 mm), emphasizing the imperative of employing spheres with smaller shape errors. In our article, it was also observed that sphere shape errors constitute significant sources of uncertainty. The standard deviation results from measurements obtained with the Leica T-Scan reveal values well above those specified by the manufacturer. However, this discrepancy can be attributed to the shape errors of the spheres used in the study, as they are manufactured for use with the Focus laser scanner to align point clouds. It is evident in the budgets of standard uncertainties (Figure 6a, Figure 8a and Figure 10a) that the primary source of uncertainty for the Leica T-Scan is the shape errors of the spheres (contributing to over 95%). In the case of the Focus scanner, this source varies between a 52.8% and a 36.5% contribution. In future works, spheres with matte steel surfaces and shape errors below 0.1 mm will be employed to mitigate the influence of this measurement uncertainty source.
On the other hand, in the measurement of the twenty-seven non-coplanar distances, the deviation values were larger than those observed in the coplanar distances. The highest deviation was −1.08 mm (Table 10), about four times larger than the highest deviation of the coplanar distances. Furthermore, the measurement uncertainty with the Focus for non-coplanar distances was greater than that obtained for coplanar distances, being 0.92 mm (Table 12), while that of the Leica T-Scan remained at 0.47 mm (Table 11), with over 95% of the uncertainty stemming from the errors in the shape of the spheres. Therefore, the Focus yields better results in coplanar distance measurements than in non-coplanar ones. In non-coplanar distances, no significant differences were observed between the methods as the calculated DL was 1.45 mm, and the highest deviation, in absolute value, was 1.08 mm (Table 10). It is noteworthy that in the measurements of non-coplanar distances, the graph in Figure 11, with the interval “deviation + U” to “deviation − U” for each of the twenty-seven non-coplanar distances, ranged from approximately +1 mm to −2 mm, an amplitude 50% larger than that presented in the nine coplanar distances.

5. Conclusions

In conclusion, this study has provided a thorough analysis of the FARO Focus S 150 laser scanner’s metrological performance in coplanar and non-coplanar distance measurements. Utilizing spheres for contactless scanning in a controlled laboratory environment and employing the Leica T-Scan as the reference method, we meticulously assessed precision, accuracy, and measurement uncertainty of the Focus laser scanner.
The configured Focus, with a 1/4 resolution and 4× quality, demonstrated remarkable precision in coplanar distances, achieving a standard deviation of 0.471 mm for approximately 1 m between sphere centers. The accuracy, indicated by the deviation from the reference method, was −0.26 mm, with an associated measurement uncertainty of 0.81 mm.
For non-coplanar distances, spanning up to 10 m between sphere centers, the precision reached 0.621 mm, with an accuracy deviation of −1.08 mm and a measurement uncertainty of 0.92 mm. Importantly, all measurements adhered to the manufacturer’s specifications of a ±1 mm systematic error at 10 m and a precision of 1 mm.
This comprehensive understanding of precision, accuracy, and measurement uncertainty contributes valuable insights into the FARO Focus S 150 laser scanner’s performance. Particularly relevant for scanning scenes involving objects randomly positioned within a volume at distances up to 10 m, these findings affirm the scanner’s reliability and suitability for various metrological applications in large-volume measurement or LSM.

Author Contributions

Conceptualization, A.K., D.B., R.S.S., V.E.d.O.G. and V.C.N.; data curation, A.K.; formal analysis, A.K., D.B. and R.S.S.; funding acquisition, V.E.d.O.G. and V.C.N.; investigation, A.K., D.B. and R.S.S.; methodology, D.B. and R.S.S.; project administration, V.E.d.O.G. and V.C.N.; resources, V.E.d.O.G. and V.C.N.; supervision, A.K., V.E.d.O.G. and V.C.N.; validation, A.K. and V.C.N.; visualization, A.K.; writing—original draft, A.K., D.B. and R.S.S.; writing—review and editing, A.K., D.B. and R.S.S. All authors have read and agreed to the published version of the manuscript.

Funding

This research received no external funding.

Data Availability Statement

Data are contained within the article.

Conflicts of Interest

The authors declare no conflicts of interest.

References

  1. Albertazzi, A.; Souza, A.R. Fundamentos de Metrologia Científica e Industrial, 1st ed.; Manole: Barueri, Brazil, 2008; pp. 1–15. [Google Scholar]
  2. Neto, J.C.D.S. Metrologia e Controle Dimensional: Conceitos, Normas e Aplicações, 2nd ed.; Elsevier: Rio de Janeiro, Brazil, 2018; pp. 39–145. [Google Scholar]
  3. Sladek, J.A. Chapter 1—Introduction. In Coordinate Metrology: Accuracy of Systems and Measurements; Springer Tracts in Mechanical Engineering: Berlin, Germany, 2016; pp. 1–9. [Google Scholar]
  4. Schmitt, R.H.; Peterek, M.; Morse, E.; Knapp, W.; Galetto, M.; Härtig, F.; Goch, G.; Hughes, B.; Forbes, A.; Estler, W.T. Advances in Large-Scale Metrology—Review and future trends. CIRP Ann.–Manuf. Technol. 2016, 65, 643–665. [Google Scholar] [CrossRef]
  5. Beraldin, J.A.; Blais, F.; El-Hakim, S.F.; Cournoyer, L.; Picard, M. Traceable 3D Imaging Metrology: Evaluation of 3D Digitizing Techniques in a Dedicated Metrology Laboratory. In Proceedings of the 8th Conference on Optical 3-D Measurement Techniques, Zurich, Switzerland, 9–12 July 2007; pp. 310–318. [Google Scholar]
  6. Wang, L.; Muralikrishnan, B.; Lee, V.; Rachakonda, P.; Sawyer, D.; Gleason, J. A first realization of ASTM E3125-17 test procedures for laser scanner performance evaluation. Measurement 2020, 153, 107398. [Google Scholar] [CrossRef]
  7. Javaid, M.; Haleem, A.; Singh, R.P.; Suman, R. Industrial perspectives of 3D scanning: Features, roles and it’s analytical applications. Sens. Int. 2021, 2, 100114. [Google Scholar] [CrossRef]
  8. Shi, S.; Muralikrishnan, B.; Sawyer, D. Terrestrial laser scanner calibration and performance evaluation using the network method. Opt. Lasers Eng. 2020, 134, 106298. [Google Scholar] [CrossRef] [PubMed]
  9. Wang, W.; Zhao, W.; Huang, L.; Vimarlund, V.; Wang, Z. Applications of terrestrial laser scanning for tunnels: A review. J. Traffic Transp. Eng. 2014, 1, 325–337. [Google Scholar] [CrossRef]
  10. Fröhlich, C.; Mettenleiter, M. Terrestrial laser scanning—New perspectives in 3D surveying. Intern. Arch. Photogramm.-Remote Sens. Spat. Inform. Sci. 2004, 36, 7–13. [Google Scholar]
  11. Schwenke, H.; Warmann, C. High Speed High Accuracy Multilateration System Based on Tracking Interferometers. In Proceedings of the IMEKO TC14 Symposium on Laser Metrology for Precision Measurement and Inspection in Industry, Braunschweig, Germany, 12–14 September 2011. [Google Scholar]
  12. Clarke, T.A.; Wang, X.; Cross, N.R.; Forbes, A.B.; Fossati, P.M. Performance Verification for Large Volume Metrology Systems. In Laser Metrology and Machine Performance V; Peggs, G.N., Ed.; WIT Transactions on Engineering Sciences: London, UK, 2001; Volume 34, pp. 105–116. [Google Scholar]
  13. Vagovský, J.; Buranský, I.; Görög, A. Evaluation of Measuring Capability of the Optical 3D Scanner. Procedia Eng. 2015, 100, 1198–1206. [Google Scholar] [CrossRef]
  14. Ramesh, L.K. Measuring the Accuracy of Digitization of Contactless Scanners. Master’s Thesis, Technical University of Liberec, Liberec, Czech Republic, 19 May 2022. [Google Scholar]
  15. Kantaros, A.; Ganetsos, T.; Petrescu, F.I.T. Three-Dimensional Printing and 3D Scanning: Emerging Technologies Exhibiting High Potential in the Field of Cultural Heritage. Appl. Sci. 2023, 13, 4777. [Google Scholar] [CrossRef]
  16. Haleem, A.; Javaid, M. 3D scanning applications in medical field: A literature-based review. Clin. Epidemiol. Glob. Health 2019, 7, 199–210. [Google Scholar] [CrossRef]
  17. Ganetsos, T.; Kantaros, A.; Gioldasis, N.; Brachos, K. Applications of 3D Printing and Illustration in Industry. In Proceedings of the 17th International Conference on Engineering of Modern Electric Systems, Oradea, Romania, 9–10 June 2023; pp. 1–4. [Google Scholar]
  18. FARO. FARO Laser Scanner Manual. 2021. Available online: https://downloads.faro.com/index.php/s/zfzkF37J5M4iafj?dir=undefined&openfile=120330 (accessed on 2 October 2023).
  19. Azam, A.; Alshehri, A.H.; Alharthai, M.; El-Banna, M.M.; Yosri, A.M.; Beshr, A.A.A. Applications of Terrestrial Laser Scanner in Detecting Pavement Surface Defects. Processes 2023, 11, 1370. [Google Scholar] [CrossRef]
  20. Xiao, J.; Hu, X.; Lu, W.; Ma, J.; Guo, X. A new three-dimensional laser scanner design and its performance analysis. Optik 2015, 126, 701–707. [Google Scholar] [CrossRef]
  21. Hughes, B.; Forbes, A.; Lewis, A.; Sun, W.; Veal, D.; Nasr, K. Laser tracker error determination using a network measurement. Meas. Sci. Technol. 2011, 22, 45103. [Google Scholar] [CrossRef]
  22. Leica Geosystems, A.G. Leica AT930/AT960 User Manual. 2015. Available online: https://support.hexagonmi.com/s/article/Leica-Absolute-Tracker-AT930-AT960-User-Manual-v1-2-0en-1528374732805 (accessed on 2 October 2023).
  23. Nubiola, A.; Slamani, M.; Joubair, A.; Bonev, I.A. Comparison of two calibration methods for a small industrial robot based on an optical CMM and a laser tracker. Robotica 2013, 32, 447–466. [Google Scholar] [CrossRef]
  24. Muralikrishnan, B.; Shilling, M.; Rachakonda, P.; Ren, W.; Lee, V.; Sawyer, D. Toward the development of a documentary standard for derived-point to derived-point distance performance evaluation of spherical coordinate 3D imaging systems. J. Manuf. Syst. 2015, 37, 550–557. [Google Scholar] [CrossRef]
  25. Boehler, W.; Vicent, M.B.; Marbs, A. Investigating Laser Scanner Accuracy. Intern. Arch. Photogramm.-Remote Sens. Spat. Inform. Sci. 2003, 34 Pt 5, 696–701. [Google Scholar]
  26. JCGM/WG 1. JCGM 100: Evaluation of Measurement Data—Guide to the Expression of Uncertainty in Measurement (JCGM 100:2008—GUM 1995 with Minor Corrections). 2008. Available online: https://www.bipm.org/en/publications/guides (accessed on 18 October 2023).
  27. EA Laboratory Committee. EA 4/02 M: 2022—Evaluation of the Uncertainty of Measurement in Calibration. 2022. Available online: https://european-accreditation.org/publications/ea-4-02-m/ (accessed on 18 October 2023).
  28. Krummenauer, A.; Gomes, V.E.O.; Nardelli, V.C. Estimation of Measurement Uncertainty of the Real-Time Location System (RTLS) with Ultra-Wideband (UWB) Technology. Metrology 2023, 3, 113–130. [Google Scholar] [CrossRef]
  29. Peggs, N.; Maropoulos, G.; Hughes, B.; Forbes, B.; Robson, S.; Ziebart, M.; Muralikrishnan, B. Recent developments in large-scale dimensional metrology. Proc. Inst. Mech. Eng. Part B J. Eng. Manuf. 2009, 223, 571–595. [Google Scholar] [CrossRef]
  30. Leica Geosystems, A.G. Leica T-Scan 5 Quick Guide. 2017. Available online: https://s3.amazonaws.com/hmits/Hardware/Laser+Tracker/Documentation/T+Products/Leica+T-Scan+Quick+Guide+v1.2.0en.pdf (accessed on 26 October 2023).
  31. Montgomery, D.C. Design and Analysis of Experiments, 8th ed.; John Wiley & Sons: New York, NY, USA, 2013; pp. 65–182. [Google Scholar]
  32. Montgomery, D.C. Introduction to Statistical Quality, 6th ed.; John Wiley & Sons: New York, NY, USA, 2009; pp. 61–176. [Google Scholar]
  33. Ten Caten, C.S.; Ribeiro, J.L.D. Projeto de Experimentos; (Academic Press) UFRGS: Porto Alegre, Brazil, 2011; pp. 20–35. Available online: http://www.producao.ufrgs.br/arquivos/disciplinas/117_apostila_pe_2011.pdf (accessed on 18 October 2023).
  34. Rodrigues, L.G.P.; Coelho, F.R.; Krummenauer, A.; Nardelli, V.C.; França, F.H.R. Two-way ANOVA analysis of novel ALBDF functions obtained for H2O–CO2 gas mixtures considering variable mole fraction ratios in oxy and air-fuel combustion conditions. J. Quant. Spectrosc. Radiat. Transf. 2024, 320, 108973. [Google Scholar] [CrossRef]
Figure 1. Visualization of the laboratory room with the identification of the three planes and arrangement of the six spheres in planes B and C.
Metrology 04 00013 g001
Figure 2. (a) GOM Atos Core optical scanner, (b) reference sphere, (c) measured diameters on the sphere.
Metrology 04 00013 g002
Figure 3. Spatial representation of planes A, B, and C in the laboratory room and spatial positions of the spheres.
Metrology 04 00013 g003
Figure 4. (a) Scanning with Leica T-Scan, (b) scanning with Focus S 150 laser scanner.
Metrology 04 00013 g004
Figure 5. Top view of the distance measurements among the nine spheres in the laboratory room shown in Figure 1.
Metrology 04 00013 g005
Figure 6. Budget of standard uncertainties for the measurements of external diameters of the spheres using Leica T-Scan (a) and Focus laser scanner (b).
Metrology 04 00013 g006
Figure 7. External diameters of spheres measured with Leica T-Scan and Focus laser scanner.
Metrology 04 00013 g007
Figure 8. Budget of standard uncertainties for coplanar distances measurements between sphere centers using Leica T-Scan (a) and Focus laser scanner (b).
Metrology 04 00013 g008
Figure 9. Deviations of coplanar distances.
Metrology 04 00013 g009
Figure 10. Budget of standard uncertainties for non-coplanar distance measurements between sphere centers using Leica T-Scan (a) and Focus laser scanner (b).
Metrology 04 00013 g010
Figure 11. Deviations of non-coplanar distances.
Metrology 04 00013 g011
Table 1. Results of the shape error measurements of the spheres with the GOM Atos Core scanner.
DiameterSphere 1 Sphere 2 Sphere 3 Sphere 4 Sphere 5 Sphere 6
Ø1149.116149.730149.483149.755150.213148.932
Ø2149.298149.858149.507149.766150.030148.750
Ø3149.409149.809149.470149.715150.164148.917
Ø4149.115149.730149.312149.398150.313149.217
Ø5149.005149.386149.447149.411150.513148.809
Ø6149.111149.385149.386149.308150.247148.501
Sphere form error0.4040.4730.1950.4580.4830.716
Table 2. Results of measurements with the Leica T-Scan for the external diameters of the spheres.
DiameterSphere 1 Sphere 2 Sphere 3 Sphere 4 Sphere 5 Sphere 6
Measure 1149.196149.420149.349149.133149.791148.685
Measure 2149.155149.310149.227149.001149.689148.587
Measure 3149.190149.332149.236149.093149.635148.746
Measure 4149.103149.394149.288149.181149.784148.792
Measure 5149.126149.422149.306149.212149.871148.698
Measure 6149.085149.418149.305149.238149.846148.605
Mean149.143149.383149.285149.143149.769148.686
SD0.0460.0490.0460.0870.0910.079
Table 3. Results of measurements with the Focus laser scanner for the external diameters of the spheres.
DiameterSphere 1 Sphere 2 Sphere 3 Sphere 4 Sphere 5 Sphere 6
Measure 1148.465149.139148.924148.396149.634147.231
Measure 2148.469148.994148.939148.241149.382147.989
Measure 3148.584149.657149.270147.973148.965147.509
Measure 4149.049149.306149.119148.415149.856148.133
Measure 5149.345149.229149.142148.690149.762148.257
Measure 6148.440148.683148.615148.263149.082148.146
Mean148.725149.168149.001148.330149.447147.877
SD0.3800.3250.2300.2370.3660.412
Table 4. Measurement uncertainty spreadsheet for the external diameter of spheres measured with Leica T-Scan (UØTscan).
Input QuantityEstimate (mm)Probability DistributionDividerStandard
Uncertainty (mm)
Sensitivity CoefficientContribution to Standard Uncertainty (mm)Degrees of Freedom
Repeatability (Leica T-Scan)0.091t-Student n
n = 6
0.03714710.0371475
Sphere form error (GOM)0.716Rectangular 12 0.20669110.206691
Calibration certificate (Leica T-Scan)0.0012Normal 2 0.00060010.000600
Uncorrected error (Leica T-Scan)|−0.045| U Ø T s c a n =
0.47 mm
k Ø T s c a n =
2.00
u c y =
0.2100 mm
ν e f f = 5107
Table 5. Measurement uncertainty spreadsheet for the external diameter of spheres measured with the Focus laser scanner (UØFocus).
Input QuantityEstimate (mm)Probability DistributionDividerStandard
Uncertainty (mm)
Sensitivity CoefficientContribution to Standard Uncertainty (mm)Degrees of Freedom
Repeatability (Focus laser scanner)0.412t-Student n
n = 6
0.16809810.1680985
Sphere form error (GOM)0.716rectangular 12 0.20669110.206691
Calibration certificate (Focus laser scanner)0.20Normal 2 0.10000010.100000
Uncorrected error (Focus laser scanner)|0.18| U Ø F o c u s =
0.77 mm
k F o c u s =
2.06
u c y =
0.2846 mm
ν e f f = 41
Table 6. Comparison of results between measurements of external diameters of spheres using Leica T-Scan and Focus laser scanner.
SphereMethodExternal Diameters Mean, mmDifference between Means (Deviation), mmDecision Limit, mmDecision
1Focus 148.73−0.421.32NSDif
T-Scan149.14
2Focus 149.17−0.21NSDif
T-Scan149.38
3Focus 149.00−0.29NSDif
T-Scan149.29
4Focus 148.33−0.81NSDif
T-Scan149.14
5Focus 149.45−0.32NSDif
T-Scan149.77
6Focus 147.88−0.81NSDif
T-Scan148.69
Table 7. Results of means, standard deviations, and deviations for coplanar distances (CDs) obtained between the centers of the spheres positioned in planes A, B, and C.
PlanTagFocus Laser ScannerLeica T-ScanDeviation
MeanSDMeanSD
ACD 11000.800.2911000.900.035−0.10
ACD 2711.110.018711.350.068−0.24
ACD 3704.230.104704.330.092−0.10
BCD 41000.850.3421000.880.069−0.03
BCD 5708.670.471708.930.078−0.26
BCD 6713.190.260713.340.027−0.15
CCD 7991.440.024991.210.0370.23
CCD 8702.700.033702.760.017−0.06
CCD 9704.260.069704.410.031−0.15
Table 8. Measurement uncertainty spreadsheet for coplanar distances measured using Leica T-Scan (UCD.Tscan).
Input QuantityEstimate (mm)Probability DistributionDividerStandard
Uncertainty (mm)
Sensitivity CoefficientContribution to Standard
Uncertainty (mm)
Degrees of Freedom
Repeatability (Leica T-Scan)0.092t-Student n
n = 6
0.03741710.0374175
Sphere form error (GOM)0.716rectangular 12 0.20669110.206691
Calibration certificate (Leica T-Scan)0.0012normal 2 0.00060010.000600
Uncorrected error (Leica T-Scan)|−0.045| U C D . T s c a n =
0.47 mm
k C D . T s c a n =
2.00
u c y =
0.2101 mm
ν e f f = 4966
Table 9. Measurement uncertainty spreadsheet for coplanar distances measured with Focus laser scanner (UCD.Focus).
Input QuantityEstimate (mm)Probability DistributionDividerStandard
Uncertainty (mm)
Sensitivity CoefficientContribution to Standard Uncertainty (mm)Degrees of Freedom
Repeatability Focus Laser Scanner0.471t-Student n
n = 6
0.19215410.1921545
Sphere form error (GOM)0.716rectangular 12 0.20669110.206691
Calibration certificate (Focus laser scanner)0.20normal 2 0.10000010.100000
Uncorrected error (Focus laser scanner)|0.18| U C D . F o c u s =
0.81 mm
k C D . F o c u s =
2.09
u c y =
0.2994 mm
ν e f f = 29
Table 10. Results of means, standard deviations, and deviations for non-coplanar distances (NCDs) obtained between the centers of the spheres positioned in planes A, B, and C.
PlanTagFocus Laser ScannerLeica T-ScanDeviation
MeanSDMeanSD
ABNCD 15101.110.0825101.340.080−0.23
ABNCD 25981.650.3025982.240.061−0.59
ABNCD 35549.200.2645549.990.060−0.79
ACNCD 410,130.200.43610,130.780.098−0.58
ACNCD 510,078.030.62110,079.110.023−1.08
ACNCD 610,103.910.41310,104.850.082−0.94
ABNCD 74674.170.4014674.200.074−0.03
ABNCD 85623.350.0405623.760.061−0.41
ABNCD 95160.470.1905161.170.055−0.70
ACNCD 1010,088.490.25410,088.910.081−0.42
ACNCD 1110,134.480.48010,135.330.092−0.85
ACNCD 1210,111.560.29510,112.310.112−0.75
ABNCD 134893.850.3214893.870.099−0.02
ABNCD 145805.850.0915806.180.073−0.33
ABNCD 155312.050.1375312.520.054−0.47
ACNCD 1610,112.650.37810,113.000.085−0.35
ACNCD 1710,110.450.59210,111.310.036−0.86
ACNCD 1810,086.720.40610,087.430.076−0.71
BCNCD 195929.330.3545929.300.0620.03
BCNCD 206270.860.3176270.930.081−0.07
BCNCD 216103.830.3046104.050.077−0.22
BCNCD 224974.000.3654974.040.012−0.04
BCNCD 235377.070.3805377.110.036−0.04
BCNCD 245179.610.3415179.870.027−0.26
BCNCD 255482.960.3135482.910.0460.05
BCNCD 265851.320.2595851.370.062−0.05
BCNCD 275626.300.2615626.480.028−0.18
Table 11. Measurement uncertainty spreadsheet for non-coplanar distances measured with Leica T-Scan (UNCD.Tscan).
Input QuantityEstimate (mm)Probability
Distribution
DividerStandard
Uncertainty (mm)
Sensitivity CoefficientContribution to Standard Uncertainty (mm)Degrees of Freedom
Repeatability (Leica T-Scan)0.112t-Student n
n = 6
0.04578410.00457845
Sphere form error (GOM)0.716rectangular 12 0.20669110.206691
Calibration certificate (Leica T-Scan)0.0012normal 2 0.00060010.000600
Uncorrected error (Leica T-Scan)|−0.045| U N C D . T s c a n = 0.47 mm k N C D . T s c a n = 2.00 u c y = 0.2117 mm ν e f f = 2285
Table 12. Measurement uncertainty spreadsheet for non-coplanar distances measured with Focus laser scanner (UNCD.Focus).
Input QuantityEstimate (mm)Probability
Distribution
DividerStandard
Uncertainty (mm)
Sensitivity CoefficientContribution to Standard Uncertainty (mm)Degrees of Freedom
Repeatability Focus laser scanner0.621t-Student n
n = 6
0.25331810.2533185
Sphere form error (GOM)0.716Rectangular 12 0.20669110.206691
Calibration certificate (Focus laser scanner)0.20Normal 2 0.10000010.100000
Uncorrected error (Focus laser scanner)|0.18| U N C D . F o c u s = 0.92 mm k N C D . F o c u s = 2.17 u c y = 0.3419 mm ν e f f = 16
Disclaimer/Publisher’s Note: The statements, opinions and data contained in all publications are solely those of the individual author(s) and contributor(s) and not of MDPI and/or the editor(s). MDPI and/or the editor(s) disclaim responsibility for any injury to people or property resulting from any ideas, methods, instructions or products referred to in the content.

