Review

Combined Use of Acoustic Measurement Techniques with X-ray Imaging for Real-Time Observation of Laser-Based Manufacturing

by
Mahdieh Samimi
1,*,
Mehran Saadabadi
2 and
Hassan Hosseinlaghab
3
1
School of Electronic Engineering, Dublin City University, D09 W6Y4 Dublin, Ireland
2
Mechanical Engineering Department, Amirkabir University of Technology, Tehran 1591634311, Iran
3
Independent Researcher, D09 W6Y4 Dublin, Ireland
*
Author to whom correspondence should be addressed.
Metrology 2024, 4(2), 181-204; https://doi.org/10.3390/metrology4020012
Submission received: 15 December 2023 / Revised: 1 March 2024 / Accepted: 3 April 2024 / Published: 8 April 2024
(This article belongs to the Special Issue Novel Dynamic Measurement Methods and Systems)

Abstract

:
Ensuring high-quality control in laser additive manufacturing and laser welding relies on the implementation of reliable and cost-effective real-time observation techniques. Real-time monitoring techniques play an important role in understanding critical physical phenomena, namely, melt pool dynamics and defect formation, during the manufacturing of components. This review aims to explore the integration of acoustic measurement techniques with X-ray imaging for studying these physical phenomena in laser manufacturing. A key aspect emphasized in this work is the importance of time synchronization for real-time observation using multiple sensors. X-ray imaging has proven to be a powerful tool for observing the dynamics of the melt pools and the formation of defects in real time. However, X-ray imaging has limitations in terms of accessibility which can be overcome through combination with other more-accessible measurement methods, such as acoustic emission spectroscopy. Furthermore, this combination simplifies the interpretation of acoustic data, which can be complex in its own right. This combined approach, which has evolved in recent years, presents a promising strategy for understanding acoustic emission signals during laser processing. This work provides a comprehensive review of existing research efforts in this area.

1. Introduction

Laser-based manufacturing is a rapidly growing industry with a wide range of applications in manufacturing processes [1]. One example of this technology is laser metal welding, which offers non-contact, high-speed processing compared to traditional methods [2]. Laser metal welding is utilized in various fields, including electronics, automotive, aerospace, aircraft, and other industries [3]. Another significant aspect of laser-based manufacturing is metal additive manufacturing (AM), which has the potential to revolutionize global parts manufacturing and logistics [4]. For instance, directed energy deposition (DED) additive manufacturing shows promise in fabricating multi-material parts with controlled microstructures by locally solidifying the deposited powders of different metallic alloys [5]. DED has proven to be effective in repairing damaged automotive and aerospace components, surpassing traditional welding with enhanced precision and automation suitability [6]. Powder bed fusion by laser beam (PBF-LB), another type of AM [7], efficiently utilizes a high-energy laser to selectively melt metal powder layer by layer, solidifying sequentially to produce final lightweight parts. Major advantages of PBF-LB include cavity fabrication, three-dimensional mesh or lattice parts, and geometrical freedom in design [8,9].
In laser-based manufacturing techniques, such as PBF-LB, a keyhole (also known as a vapor depression [10]) is a deep cavity filled with vapor that forms within the molten metal pool when the laser beam interacts with the metal powder. The metal surrounding the keyhole melts due to heat conduction, forming a molten pool [11]. Unstable collapse of the keyhole traps gas bubbles, resulting in voids or pores in the solidified material [12]. These porosities caused by the keyhole can lead to defects in fusion, where layers are not properly bonded. Adjusting the laser energy to the keyhole regime can help mitigate this issue [13]. Additionally, laser manufacturing can also cause cracks and delamination, affecting stress concentration and fatigue resistance [14]. Therefore, a significant obstacle to the widespread industrial adoption of laser-based additive manufacturing is the possibility of keyholes and other various defects (such as balling [15], rippling [16], and spattering [17]). These defects occur during the manufacturing process and impact the quality of the final product [18,19]. For instance, during laser welding, pores, cracks, lack of fusion, and spattering defects inevitably occur, weakening joints and potentially affecting performance [20]. Spattering refers to the ejection of molten metal droplets from the melt pool during the laser–material interaction [21]. However, analyzing the keyhole and its behavior is challenging because the keyhole is concealed within non-transparent workpieces and inaccessible to conventional imaging and non-imaging diagnostics [22]. Therefore, real-time observation of dynamic phenomena during this process and detecting defects in real time can be valuable for industry and manufacturing.
To study the complete volume of material where pores and keyholes form, real-time measurement techniques are necessary. X-ray imaging is a significant technique for monitoring unknown laser–material interactions and the underlying physics. Synchrotron X-ray imaging is a valuable tool for gaining real-time insights into subsurface phenomena, including the dynamic behaviors of melt pools and keyholes. Therefore, real-time imaging of dynamic phenomena includes the motion of spatter and pore formation during laser–material interactions, allowing researchers to understand the origins of defects. For instance, researchers at the Paul Scherrer Institute [23] have miniaturized and specially designed PBF-LB devices for in situ X-ray measurements of PBF-LB. The designed PBF-LB devices mimic the commercial PBF-LB process (shown in Figure 1) and exemplify the apparatus developed. The apparatus enables the use of X-ray measurements to study the laser melting process of PBF-LB under controlled conditions [24].
In addition to the advantages of synchrotron X-ray imaging, there is a notable absence of sufficient details regarding the thermal history and chemical composition of the processed material [26]. Furthermore, the practical utility of X-ray imaging is constrained by issues related to portability and usage outside of laboratory settings [27]. Therefore, alternative measurement techniques are imperative to address these inherent limitations.
Acoustic emission (AE) sensors can address issues of portability and usage outside of laboratory settings [27,28] in X-ray utilities while also being applicable for real-time measurement of dynamic processes in laser advanced manufacturing. AE analysis, as a low-cost and robust monitoring technique, is widely used in laser manufacturing and extends across various manufacturing processes. In laser welding, AE signals are utilized to assess penetration depth [29,30]. In additive manufacturing, they also play a crucial role in defect detection [31,32] and distinguishing between different materials and process regimes [33]. For example, AE signals are employed in DED to differentiate between stable and unstable processes (such as geometric fluctuations, oxidation effects, or other process anomalies) by measuring the mean intensity of the acoustic emissions [34].
Real-time monitoring of industrial processes with AE involves collecting and analyzing AE signals to identify and assess defects throughout the structure [35]. AE signals are valuable tools due to their cost-effectiveness and ability to achieve high temporal resolution (attributed to their 1D signal nature) [36,37]. This high temporal resolution allows AE sensors to detect and record rapid changes in the material during the laser melting process. However, it is important to note that AE signals are highly sensitive to environmental factors, making them susceptible to interference and variations based on surrounding conditions [38].
Interpreting AE signals in laser metal manufacturing is complex due to various factors [39], including variability in process parameters like power settings and scanning speed [40] and material composition [41]. Discriminating between signals associated with regular processing and those indicating defects also requires sophisticated signal processing algorithms. These complexities of interpreting AE signals arise from the intricate nature of AE signals and the need for accurate analysis to ensure quality control [42]. Therefore, integrating AE signals with X-ray imaging, which serves as a ground truth, can enhance the overall analysis.
This paper comprehensively explores AE measuring techniques when coupled with X-ray imaging. X-ray imaging serves as a ground truth, facilitating the validation of other measurement techniques [43]. Precise synchronization of signals captured through various methods with X-ray imaging is critical for achieving this validation. This synchronization allows for subsequent validation and establishes a foundation for robust and accurate results. The present study conducts a comprehensive review of synchronization methods employed in AE signals in conjunction with X-ray imaging, aiming to ensure the validation of obtained results.
The rest of this review is organized as follows: Section 2 discusses the X-ray measurement techniques and their usage for studying the dynamics of the melt pool. Section 3 explores two types (contact and non-contact) of AE technology synchronized with X-ray imaging to investigate the dynamic process in laser-based manufacturing. Finally, Section 4 proposes some conclusions regarding the synchronization of AE testing technology with X-ray imaging, including the advantages, challenges, and development of this synchronization.

2. Synchrotron X-ray Applications in Monitoring Dynamic Phenomena for Laser-Based Manufacturing

This section provides an overview of the application of synchrotron X-ray imaging in monitoring the dynamics of the melt pool [44,45,46,47,48] and powder motion [49,50,51]. These dynamic phenomena are crucial for understanding laser material interactions in laser-based manufacturing.

2.1. Melt Pool Dynamics

The primary result of the interaction between the laser and materials is the formation of a melt pool. Understanding the characteristics of the melt pool is crucial for achieving high-quality products [52]. Cunningham et al. [53] utilized synchrotron X-ray imaging to reveal the sequence of keyhole formation in PBF-LB for metal additive manufacturing, based on laser power density. The study identified five key stages at an approximate frame rate of 200 kHz: (1) melting; (2) formation and growth of a vapor depression; (3) instability of the vapor depression; (4) formation and growth of a keyhole; and (5) change in the shape of the melt pool (Figure 2). The study also discovered two distinct transitions: The first occurred when there were fluctuations in the vapor depression, resulting in an accelerated increase in aspect ratio (depth to width) as seen in D to G in Figure 2 The second transition occurred when the aspect ratio [48,54,55] approached a value close to 0.5 [53]. This evolution from a hemispherical melt pool (conduction mode) to a well-defined sharp keyhole provides more direct insights than other methods that rely on cross-sections of solidified weld pools.
A challenge in X-ray imaging is to display clear boundaries of the melt pool and vapor depression during laser–material interactions. Parab et al. conducted a study on the impact of exposure time on hindering the identification of features with slight density differences, as shown in Figure 3a, where the melt pool lacks sufficient contrast. The laser scanned from left to right, with a sample thickness of 380 µm, a scanning speed of 500 mm/s, and a laser power of 260 W. Increasing the exposure time from 1 to 20 µs (Figure 3a–d) enhances the visibility of the melt pool due to a higher photon flux, which improves the signal-to-noise ratio. These images, with stable interfaces between solid–liquid and liquid–gas phases, are suitable for reliable quantitative analysis of melt pool dynamics. Additionally, further improvements for heavier materials like Ni-based superalloys are expected by utilizing higher-energy photon sources and making beamline adjustments [56].
Parab et al. [56] utilized synchrotron X-ray imaging to observe the dynamics of the PBF-LB process in high resolution, providing insights into vapor depression and melt pool phenomena in both temporal and spatial dimensions. Figure 4 displays high-speed X-ray images of laser AM for an Al-Si10-Mg plate and powder bed fusion for Ti-6Al-4V, capturing the intricacies of vapor depression. The experimental parameters for each case are detailed in the caption of the figure. The images reveal dynamic oscillations in the liquid–vapor interface during the processes. To study dynamic phenomena in the PBF-LB process, ultrafast laser-melting experiments were conducted using a high-speed camera at 1.08 million (Figure 4a,c) and 10 million (Figure 4b) frames per second (fps). The first image sequence (t = 0.8 to 1.1 µs) showed minor changes in vapor depression geometry, while the second sequence (t = 8.3 to 8.6 µs) revealed significant differences. Slower recording speeds are suitable for tracking major vapor depression changes. However, ultrafast recording is essential for capturing rapid oscillations in the liquid–vapor interface, as slower speeds may result in missed phenomena [56]. It is important to note that the 10 MHz camera recording speed represents the maximum continuous recording rate achievable with currently available high-speed CMOS cameras [57,58].
Understanding the flow of the melt pool is crucial for controlling both the microstructure and the process itself [59]. However, evaluating this flow is challenging due to the opacity of liquid metals, which requires in situ assessment. To address this issue, researchers introduced highly attenuating tungsten carbide particles into a blend of aluminium and copper powders with varying compositions. This allows for the visualization of Marangoni flow traces in the melt pool through high-temporal-resolution synchrotron X-ray radiography experiments. The high-magnification images in Figure 5a–e display the movement of a single tungsten tracer particle around the keyhole. Figure 5f presents a composite image created by extracting the pixel-wise minimum intensity from a stack of 250 images, showing a section of the visible melt pool. This method enables us to observe the direction and speed of flow during the process [60].

2.2. Powder Motion

In PBF-LB processes, the ejection of powder spatter is a common problem that can negatively affect the building process, leading to structural defects and reduced construction accuracy [61]. To study this phenomenon, high-speed X-ray imaging is employed [62,63]. When a high-power laser hits the powder bed, the particles rapidly melt and evaporate, resulting in the release of metal vapor that pushes adjacent particles out of the bed. The liquid metal is subsequently propelled outward due to Marangoni flow and recoil pressure, causing the liquid metal to wet and melt the particles [64].
Ultrafast X-ray imaging, recorded at a speed of 1.08 million fps, allows for precise tracking of high-velocity particle ejections in the PBF-LB process. This imaging technique also provides valuable insights into particle rotation. Slower recording speeds, such as 50 kHz, can still capture the trajectories of particles moving in straight lines, but they may not capture inter-particle collisions and complex particle motion. The velocities presented in this study were calculated without considering out-of-plane motion, so these numbers represent minimum ejection velocities [56]. Zhao et al. utilized X-ray imaging to demonstrate the direction and trajectories of particles in the PBF-LB process in Figure 6a,b, respectively. Figure 6c and d display statistics on particle ejection speed and direction under two laser power conditions in PBF-LB processes. When comparing laser powers of 340 W and 520 W, the former ejects fewer particles from the powder bed and exhibits a lower maximum particle speed (12.3 m/s for the lower power case vs. 14.9 m/s for the higher power case), indicating less intense particle motion at lower laser power. The angular distribution of ejection (φ) around φ = 90° (vertical direction) is expected to be symmetrical if a sufficient number of melting events are counted. However, the dynamic flow of the melt pool affects the distribution, resulting in an asymmetric distribution of ejection angles. A subtle difference between the two laser power cases is observed, with 340 W displaying a more symmetrical angular distribution, suggesting a less turbulent melt pool flow [65].
In another study, Wolff et al. utilized X-ray imaging to gain insights into the complex dynamics of the melt pool in directed energy deposition (DED) additive manufacturing. Figure 7 presents raw and differential X-ray sequences from the DED process. The parameters used were a laser power of 200 W, scan speed of 100 mm/s, and powder flow rate of 320 mg/s. The differential images enhance the contrast of the melt pool, revealing dynamic surface variations indicated by red arrows in the raw photos. The study demonstrates that the stability of the melt pool surface is affected by fast-moving particles, particularly when the laser beam spot size, and thus the melt pool dimension, is smaller compared to the particle size. This leads to deformations and surface roughness. These findings emphasize the significance of considering powder characteristics and process control in order to achieve the desired outcomes in DED builds [5].

3. Combined Use of In Situ Acoustic Measurement Techniques with X-ray Imaging

In Section 2, it is noted that various physical phenomena can occur at different speeds, extending up to 10 MHz (or 100 ns). Therefore, it is crucial to consider time synchronization when using multiple measurement techniques simultaneously to gain a comprehensive understanding of the underlying physical processes. Acoustic emission during laser material interactions can provide a unique acoustic signature of different melting regimes (conduction, stable keyhole, unstable keyhole) [66,67,68]. At the same time, X-ray imaging allows for real-time observation of the melt pool and keyhole during the PBF-LB process. However, there are two main reasons why acoustic emission is not widely used in industrial laser processing: First, the signals are highly susceptible to background noise; secondly, establishing a correlation between the AE signal and the actual occurrences is extremely challenging [38]. Nevertheless, researchers have been able to visualize the entire dynamic process of laser material interactions by using high-speed X-ray imaging combined with AE measurements. This allows them to simultaneously acquire AE signals and determine different regimes by applying the softmax function [69] for discrimination [24]. This approach is helpful for defect detection, such as pore formation, and offers valuable in situ monitoring for quality control and efficiency improvement in PBF-LB [24]. Some studies have used AE signals to detect anomalies and defects in additive manufacturing processes [66,67,68]. For example, Tempelman et al.’s study focused on identifying keyhole pores by synchronizing the acoustic signal with the laser position at each moment, which facilitated accurate labeling of defect locations [70].
Typically, two categories of emissions arise within the laser processing zone: structure-borne acoustic emission (SBAE) and air-borne acoustic emission (ABAE) [71]. They can be considered contact and non-contact types, respectively. SBAE sensors require direct contact with the material, while ABAE measurements can be performed remotely without physical contact. Therefore, SBAE and ABAE sensors are referred to as contact and non-contact types of AE sensors, in that order. In ABAE recording, standard membrane microphones are commonly used, while in SBAE, piezoceramic transducers are mostly utilized. There are different detection principles between these two types of AE, including the nonlinear behavior of acoustic waves in solids and the linear propagation of acoustic signals in air. Due to higher damping in air than in solids, SBAE supports a broader frequency spectrum [72]. The widespread use of SBAE in laser welding for quality control is hindered by the challenging reproducibility of sensor coupling to the workpiece, which requires quick sensor reattachment when the workpiece changes [73].
AE relies on the detection and analysis of acoustic emissions that occur when internal stress is released within a material. Contact-type acoustic techniques rely on the nonlinear behavior of acoustic waves to detect and characterize defects, while non-contact techniques are based on the linear propagation of acoustic signals and are suitable for remote sensing applications. In contact AE sensing, nonlinear parameters such as wave distortion and harmonic generation are often used to detect and characterize defects or structural changes within the material [74,75]. These nonlinear effects occur due to the interaction between stress waves and material properties [76]. The detection of SBAE signals is also based on the nonlinear behavior of acoustic waves, allowing for the identification of specific phenomena related to material damage or deformation [77]. SBAE techniques typically require direct contact with the material or structure being investigated to detect mechanical vibrations or acoustic waves traveling through solids. This enables SBAE techniques to provide insights into the dynamic behavior of materials, including the initiation and propagation of defects such as cracks or microfractures [78].
In this section, we will review acoustic measuring techniques combined with X-ray imaging. We will discuss two types of acoustic sensors that are used for acoustic emission spectroscopy with X-ray imaging. Furthermore, we will review the progress of multi-sensors used in combination with other measurement techniques for these two methods (AE sensor and X-ray imaging).

3.1. Non-Contact (ABAE) Type Acoustic Emission Sensor Combined with X-ray Imaging

Wamster et al. [38] were pioneers in combining X-ray imaging with AE signal analysis for laser manufacturing processes. They used a piezo acoustic sensor, specifically an SBAE sensor, that was not in direct contact with the sample but rather with the sample holder. Therefore, this approach falls under the category of ABAE type, which does not directly capture acoustic waves from the sample during the laser process. Their study utilized a signal processing technique called wavelet packet transform (WPT) to analyze non-stationary AE signals. WPT divides the time-frequency space of the acquired AE signals into a finite number of narrow frequency bands, allowing for a more detailed analysis of how the signal’s frequency content changes over time. By selecting only the relative energies of specific frequency bands (from the third to the seventh decomposition levels), they were able to exclude noise from the experimental setup and surrounding environment. After pre-processing the data, the gradient boost technique is applied for machine learning classification, completing both pre-processing and classification within 30 ms. Nasab et al. [24] successfully synchronized X-ray imaging with an optical microphone positioned 100 mm away from the processing area of the build plate. Figure 8a illustrates stochastic regime transitions during the laser processing of 316 L stainless steel, highlighting variations in the melt pool. Figure 8b displays time-evolving AE signals and a spectrogram for keyhole phases, aiding in the identification of different regimes. This integrated setup efficiently captured air-borne acoustic emissions ranging from 10 Hz to 1 MHz during the manufacturing process. X-ray imaging provided real-time insights at a rapid frame rate of 100 microseconds (10 kHz). They optimized regime discrimination in PBF-LB monitoring, which is crucial for real-time PBF-LB/laser melting monitoring, and enhanced the synchronization of X-ray imaging with AE signals using image processing techniques. These techniques include time-windowing for laser tracking, denoising with median filters (with a 7 × 3 × 3 footprint where the first dimension is time and the other two are pixels’ 2D spatial position), and a strip removal algorithm [79] to eliminate diagonal lines caused by the constant speed of texture. Additionally, edge detection using polar coordinates is employed. These techniques improve data quality, aiding in real-time PBF-LB monitoring and control.
The sudden increase in amplitude of the AE signal is associated with the phenomenon of evaporation and the creation of a microjet. This microjet is the main factor in generating acoustic waves during the keyhole melting process. Acoustic waves in laser-based manufacturing detect changes in gas momentum that result from various phenomena, such as metal vaporization, microjet formation, capillary oscillation, surface tension gradients, liquid collisions, microjet penetration, pore formation, and periodic overheating explosions. These events collectively lead to periodic oscillations of the keyhole within a frequency range of 20–50 kHz. These oscillations can be detected using AE sensors (see Figure 8b) [24].
De Foranoir et al. (Nasab’s co-worker) [80] developed a method for in situ pore healing using operando X-ray imaging to understand the mechanisms of pore elimination. They also demonstrated the potential of AE as a monitoring technique for porosity healing during laser remelting by aligning AE signals with X-ray images without relying on machine learning algorithms. Figure 9 provides an overview of time-domain AE signal analysis during laser irradiation. This includes visualizing raw signals, shifting the time axis, superposing AE signals with video events, and highlighting a specific pore removal event. To synchronize X-ray imaging with the corresponding AE signal in the time domain, the start of the laser processing, denoted as “ t s t a r t ”, was determined by identifying the first significant increase in signal intensity. The time shift t t s t a r t was then applied to the time axis of the AE signal (Figure 9), allowing for the AE signal to be aligned with the X-ray video (which started with laser triggered control). Similar to determining t s t a r t , the end of the laser process ( t e n d ) can be determined based on signal characteristics. It is important to note that the estimation of the start time can be prone to error. However, due to the different frequencies (2 MHz for acoustic, 10 kHz for X-ray), a 100-point error (for example) in identifying the laser start ( t s t a r t ) has minimal impact on aligning acoustic signals with X-ray images. This error is only half the duration of one X-ray frame.
The synchronization accuracy can be affected by reverberation time and noise interference in AE sensors. Conventional capacitive and piezoelectric microphones are susceptible to electromagnetic interference from surrounding industrial noise, and their bandwidth is limited to 100 kHz. These limitations may explain why acoustic process monitoring is not widely used in industrial production. In contrast, an optical microphone (shown in Figure 10) is immune to electromagnetic interference and can have a bandwidth of up to 1 MHz in air. Figure 10 illustrates the optical microphone’s Fabry–Pérot cavity, which uses interference to detect density changes, ensuring high sensitivity and compact size. Furthermore, reverberation times in industrial environments are typically longer for audio frequencies, often in the hundreds of milliseconds, making it challenging to accurately monitor rapid acoustic events. It is virtually impossible to achieve reverberation times shorter than 10 ms up to 100 kHz. To address this issue and improve temporal precision, it is imperative to monitor ultra-high acoustic frequencies beyond 100 kHz, where shorter reverberation times are possible, especially in environments with acoustically reflective surfaces [81].
In studies that use X-ray imaging in synchronization with AE signals, there is a lack of attention given to the significance of accounting for the time-lag effect in acoustic signals. This observation holds true even when AE is combined with other measurement techniques, such as CCD cameras, IR cameras, and pyrometers, as discussed in references [82,83,84]. The time-lag effect is caused by various factors, including the distance between the microphone and the laser–material interaction zone, as well as the characteristics of the medium through which the signals travel. It is crucial to carefully consider this aspect to ensure the accurate interpretation and practical application of AE data in laser manufacturing processes, while also avoiding misinterpretations when connecting underlying process phenomena to AE signal signatures.

3.2. Contact (SBAE) Type Acoustic Transmission Sensor Combined with X-ray Imaging

The application of contact or SBAE-type ultrasound sensors in monitoring laser manufacturing processes can be affected by the geometry of the melt pool, including width and depth. However, these sensors are unable to provide precise information about the dynamic behavior of the melt pool. Therefore, synchronized measurements are necessary to determine how the dynamics of the melt pool impact the ultrasonic response [85].
Gillespie et al. conducted a study on laser–material interaction using synchrotron X-ray imaging and two ultrasound transducers immersed in water (see Figure 11a). They adjusted the angle of the ultrasound transducer so that the refracted shear wave in the aluminium sample was directed towards the heat-affected zone (HAZ) (Figure 11b). It is known that shear waves passing through solid-to-liquid media exhibit highly scattering behavior, which helps distinguish the signal from different melt pool states. By utilizing a pair of transducers, the researchers had the option to perform either pulse-echo (PE) assessments, where a single transducer functions as both the transmitter and receiver, or pitch-catch (PC) evaluations, where one transducer sends the signal while the other captures it [27].
In order to achieve a high time resolution in ultrasound signals (and therefore a high time resolution of corresponding physical events), a higher pulse rate frequency (PRF) is required. However, it is essential to note that the PRF is restricted by the time it takes for the ultrasound to travel from the melt pool, scatter, and then be received by the transducer. This is referred to as the time-of-flight [27]. A dual-channel ultrasonic pulser-receiver (JSR DPR-500) controls transducer excitation and reception with a 10 ns duration pulse at a user-set PRF to ensure precise synchronization between ultrasound and X-ray imaging. The received ultrasound data is filtered and sent to a digitizer card (NI PXIe-5162), initiated by another trigger pulse from the pulser-receiver, ensuring exact timing. Simultaneously, a high-speed camera (Photron FastCam SA-Z) captures X-ray images at 28.503 kHz, perfectly synchronized with the ultrasonic PRF. This allows for the precise capture of an image when the ultrasound scatters from the melt pool at a specific time interval, providing accurate alignment of physical events and ultrasound signatures for analysis [27]. Figure 12 displays the synchronized X-ray imaging alongside the ultrasound signal, capturing the events before, during, and after laser activation using two pitch-catch (PC) and pulse-echo (PE) configurations. As the melt pool deepens, the ultrasound’s time-of-flight decreases. This can be seen around time slices 4.25, 5.09, and 5.65 ms in the PC configuration (Figure 12a) and 2.21, 3.89, and 4.84 ms in the PE configuration (Figure 12b) [27].

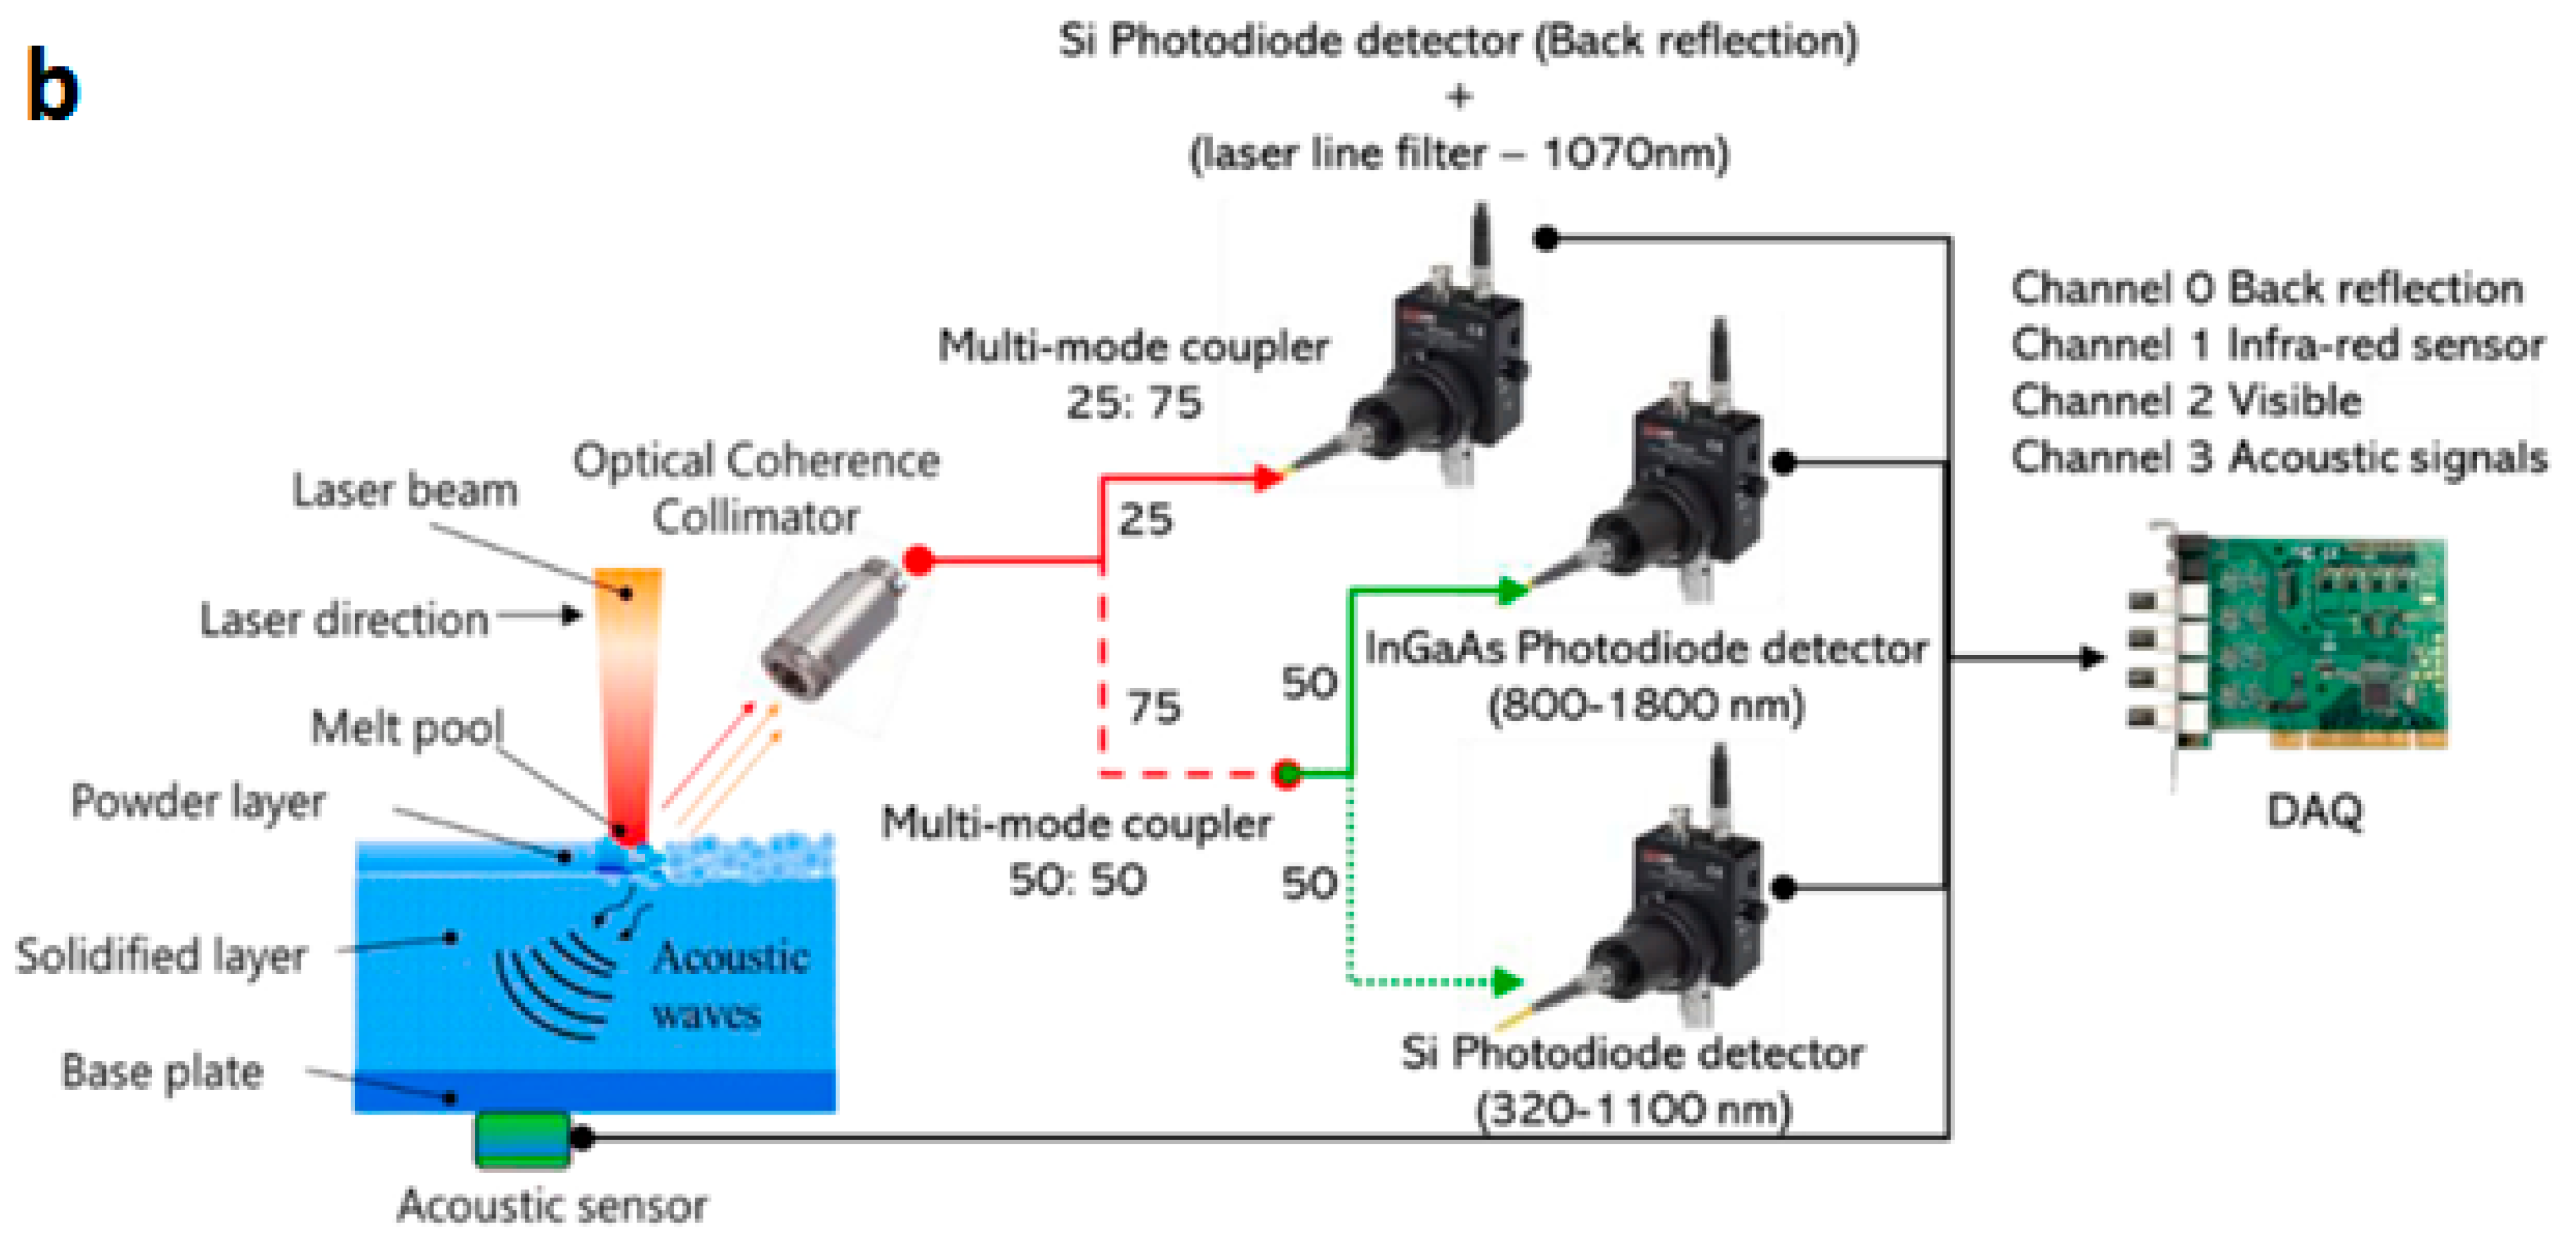
3.3. Multi Sensors (Three Sensors or More) Combined with Acoustic Emission Sensor and X-ray Imaging

Some studies have utilized multiple sensors, including XRI and AE sensors, along with other measuring techniques, to provide information from various and complementary aspects.
Shevchik et al. [43] combined laser back-reflection (LBR) and AE signals with X-ray imaging to monitor laser welding in real time. Figure 13a displays X-ray images of aluminum during a 10 ms laser pulse, showing different phases and events. Figure 13b presents the pixel intensity of the keyhole channel. Figure 13c and d show the LBR and AE signals, along with their wavelet spectrograms, for laser welding. LBR detects surface behavior, while AE captures dynamic changes in the melt pool and keyhole, and X-ray imaging provides a visual representation of the welding process. LBR and AE signals respond differently during welding, reflecting distinct physical phenomena. LBR signals exhibit sharp changes at the start and end of the welding process, measuring the reflected laser energy. In contrast, AE signals show a slight increase in amplitude at the beginning, likely related to the size of the melt pool, and gradually decrease as the melt pool shrinks towards the end. The combination of LBR, AE, and X-ray imaging provides a comprehensive understanding of laser welding, enabling defect detection and real-time control (Figure 13).
The study examines two types of defects, blowout and pore, along with three common categories, namely, conduction, stable keyhole, and unstable keyhole. While LBR can detect blowout by measuring frequency attenuation, AE cannot. This approach is also effective in distinguishing between stable and unstable keyhole states, which is crucial for preventing defects in laser welding. The method can detect pore formation and removal and improve classification accuracy by combining LBR and AE features in real-time welding defect reduction [43]. X-ray phase contrast imaging is used to enhance sensitivity, particularly at phase boundaries (solid, gas, and vapor), where X-ray beam refraction is most noticeable. Both the AE sensor and LBR are triggered by laser control, and wavelet packet transform (WPT) is employed to generate unique signatures for physical events. WPT offers several advantages, including reducing data size, denoising signals by selecting specific frequency bands, and enabling the interpretation of signals over time based on chosen frequency bands. The wavelet spectrogram enhances precision by revealing specific frequency patterns in both signals during different welding phases.
In order to achieve highly accurate classification of various regimes within metal-based PBF-LB processes, Pandiyan et al. [25] have introduced an innovative hybrid deep learning model that merges convolutional neural networks (CNNs) with long short-term memory (LSTM). This achievement is based on data gathered from four sensors, including three photodiodes (back reflection, visible, and infra-red) along with a structure-borne AE sensor. The efficacy of in situ monitoring for PBF-LB processes is further substantiated through X-ray imaging. Figure 14a depicts the mini-SLM configuration with an AE sensor and optical detectors, while Figure 14b shows schematics of the heterogeneous sensing system featuring an AE sensor and photodiode detectors. During the experiment, a fixed focus collimator is positioned at a 30-degree angle, 5 cm from the HAZ (as seen in Figure 14a), to collect optical emissions from the melt pool. These emissions are divided into three channels using various optical filters to isolate specific wavelengths. The BR Si photodiode primarily captures reflected laser light at 1070 nm, providing insights into the absorption and utilization of laser energy in the process [86]. The InGaAs photodiode (PDA20CS2) can detect light in the 800–1700 nm range, utilizing a low-pass optical filter for wavelengths exceeding the laser radiation. The Si photodiode captures visible and NIR light using a short-pass optical filter. The AE sensor (PICO HF-1.2, Physical Instruments, Physical Acoustics, MISTRAS Group, NJ 08550, USA) with a frequency range of 500–1850 kHz serves as a structure-borne sensor, mounted at the base’s bottom and recorded at a sampling rate of 3 MHz to adhere to the Nyquist Shannon theorem. Signal acquisition automatically begins for all channels via a photodiode detector, triggered by a substantial increase in light intensity near the laser’s wavelength upon interaction with the powder bed, resulting in an analog voltage. Crucially, all four channels simultaneously initiate acquisition, ensuring default synchronization [25]. In this way, the authors comprehensively assess various aspects of the PBF-LB process, enabling more informed decision-making within the process regime by receiving a wider range of radiated wavelengths.
To detect defects and correlate them with the exact time of formation, Martin et al. used X-ray imaging in combination with a diagnostic sensor suit. This improved the understanding of the process and quality control in PBF-LB. Figure 15a displays the layout of the in situ diagnostic system, which records thermionic, optical, and acoustic signals during laser exposure. Figure 15b and c show the schematics and information exchange for the laser, X-ray imaging, and diagnostic system control. The sensor suit included a photodiode, aligned with the laser beam, as well as a second dielectric mirror and a microphone positioned in the chamber (Figure 15b). All of these sensor signals were recorded synchronously at 470 kHz using an FPGA-based laser interface module. The synchronization process for X-ray imaging with diagnostic sensors begins with a command from the RTC5 control card. This command initializes the position of the laser scan head and opens the high-speed shutter. However, there is a predetermined delay of approximately 5 ms before the shutter opens. As a result, the laser control signal, which includes the power signal enabling laser irradiation and the gate signal controlling camera recording and sensor acquisition timing, is passed through an FPGA. After applying the necessary programmed delay, this signal is transmitted to the laser (see Figure 15c). This process ensures that the high-speed camera captures images in sync with the diagnostic sensor data, achieving remarkable synchronization with a precision of 2.1 microseconds (at a frequency of 470 kHz) [87].

4. Conclusions and Future Directions

The development of AE measurement synchronized with X-ray imaging over time is summarized in Table 1.
It can be observed in Table 1 that the development of using a combination of X-ray and AE analysis has progressed gradually, but it still requires improvement in order to achieve higher resolution, a deeper understanding of phenomena, and faster recognition. For instance, the frequency range of the AE sensor has been expanded (10 Hz–1 MHz), which has facilitated the study of remelting and pore removal (refer to Table 1). The smaller melt pool resulting from the use of a smaller beam diameter (13.75 µm) has been examined using a facility with higher resolution. By enhancing the exposure time, it becomes possible to investigate time-related phenomena, such as the formation of melt pools and defects. These studies are valuable for process control and enhancing the quality of components during laser processing. However, considering the inherent specificity of acoustic signals, such as the time-lag effect, would allow for more-accurate synchronization of AE signals with X-ray images in future studies. This would aid in interpreting the AE signal in greater detail, which can be applied in machine learning and artificial intelligence for automatic detection. Furthermore, it is evident that multi-sensor systems provide more comprehensive information on defect formation and enable real-time monitoring.

Funding

This research received no external funding.

Acknowledgments

We would like to express our sincere appreciation to Hassan Hosseinlaghab for his invaluable guidance and support throughout the preparation of this review manuscript. His expertise, encouragement, and insightful feedback were instrumental in shaping this work. We are grateful for his unwavering commitment to our professional development and for providing the resources necessary to carry out this research. His mentorship has been a source of inspiration and has greatly contributed to the quality of this manuscript.

Conflicts of Interest

The authors declare no conflicts of interest.

References

  1. Bogue, R. Lasers in Manufacturing: A Review of Technologies and Applications. Assem. Autom. 2015, 35, 161–165. [Google Scholar] [CrossRef]
  2. Katayama, S. Handbook of Laser Welding Technologies; Elsevier: Amsterdam, The Netherlands, 2013; ISBN 978-0-85709-877-1. [Google Scholar]
  3. Cao, X.; Jahazi, M.; Immarigeon, J.P.; Wallace, W. A Review of Laser Welding Techniques for Magnesium Alloys. J. Mater. Process. Technol. 2006, 171, 188–204. [Google Scholar] [CrossRef]
  4. An, N.; Shuai, S.; Hu, T.; Chen, C.; Wang, J.; Ren, Z. Application of Synchrotron X-ray Imaging and Diffraction in Additive Manufacturing: A Review. Acta Metall. Sin. Engl. Lett. 2022, 35, 25–48. [Google Scholar] [CrossRef]
  5. Wolff, S.J.; Webster, S.; Parab, N.D.; Aronson, B.; Gould, B.; Greco, A.; Sun, T. In-Situ Observations of Directed Energy Deposition Additive Manufacturing Using High-Speed X-ray Imaging. JOM 2021, 73, 189–200. [Google Scholar] [CrossRef]
  6. Saboori, A.; Aversa, A.; Marchese, G.; Biamino, S.; Lombardi, M.; Fino, P. Application of Directed Energy Deposition-Based Additive Manufacturing in Repair. Appl. Sci. 2019, 9, 3316. [Google Scholar] [CrossRef]
  7. Kizhakkinan, U.; Seetharaman, S.; Raghavan, N.; Rosen, D.W. Laser Powder Bed Fusion Additive Manufacturing of Maraging Steel: A Review. J. Manuf. Sci. Eng. 2023, 145, 110801. [Google Scholar] [CrossRef]
  8. Seyda, V.; Kaufmann, N.; Emmelmann, C. Investigation of Aging Processes of Ti-6Al-4 V Powder Material in Laser Melting. Phys. Procedia 2012, 39, 425–431. [Google Scholar] [CrossRef]
  9. Tao, W.; Leu, M.C. Design of Lattice Structure for Additive Manufacturing. In Proceedings of the 2016 International Symposium on Flexible Automation (ISFA), Cleveland, OH, USA, 1–3 August 2016; pp. 325–332. [Google Scholar]
  10. Zhao, Y.; Lu, M.; Fan, Z.; Yin, Y.; Lin, W.; Huang, H. Laser Surface Engineering of Ti–6Al–4V with TiO2/Al2O3 Composite Powder for Improved Wear Resistance. Smart Mater. Manuf. 2023, 1, 100015. [Google Scholar] [CrossRef]
  11. King, W.E.; Barth, H.D.; Castillo, V.M.; Gallegos, G.F.; Gibbs, J.W.; Hahn, D.E.; Kamath, C.; Rubenchik, A.M. Observation of Keyhole-Mode Laser Melting in Laser Powder-Bed Fusion Additive Manufacturing. J. Mater. Process. Technol. 2014, 214, 2915–2925. [Google Scholar] [CrossRef]
  12. Guo, L.; Liu, H.; Wang, H.; Wei, Q.; Xiao, Y.; Tang, Z.; Wu, Y.; Wang, H. Identifying the Keyhole Stability and Pore Formation Mechanisms in Laser Powder Bed Fusion Additive Manufacturing. J. Mater. Process. Technol. 2023, 321, 118153. [Google Scholar] [CrossRef]
  13. Guo, L.; Wang, H.; Liu, H.; Huang, Y.; Wei, Q.; Leung, C.L.A.; Wu, Y.; Wang, H. Understanding Keyhole Induced-Porosities in Laser Powder Bed Fusion of Aluminum and Elimination Strategy. Int. J. Mach. Tools Manuf. 2023, 184, 103977. [Google Scholar] [CrossRef]
  14. Barroqueiro, B.; Andrade-Campos, A.; Valente, R.; Neto, V. Metal Additive Manufacturing Cycle in Aerospace Industry: A Comprehensive Review. J. Manuf. Mater. Process. 2019, 3, 52. [Google Scholar] [CrossRef]
  15. Li, R.; Liu, J.; Shi, Y.; Wang, L.; Jiang, W. Balling Behavior of Stainless Steel and Nickel Powder during Selective Laser Melting Process. Int. J. Adv. Manuf. Technol. 2012, 59, 1025–1035. [Google Scholar] [CrossRef]
  16. Tang, P.; Wang, S.; Duan, H.; Long, M.; Li, Y.; Fan, S.; Chen, D. The Formation of Humps and Ripples During Selective Laser Melting of 316l Stainless Steel. JOM 2020, 72, 1128–1137. [Google Scholar] [CrossRef]
  17. Ikeshoji, T.-T.; Yonehara, M.; Kato, C.; Yanaga, Y.; Takeshita, K.; Kyogoku, H. Spattering Mechanism of Laser Powder Bed Fusion Additive Manufacturing on Heterogeneous Surfaces. Sci. Rep. 2022, 12, 20384. [Google Scholar] [CrossRef] [PubMed]
  18. Hasan, N.; Habibor Rahman, M.; Wessman, A.; Smith, T.; Shafae, M. Process Defects Knowledge Modeling in Laser Powder Bed Fusion Additive Manufacturing: An Ontological Framework. Manuf. Lett. 2023, 35, 822–833. [Google Scholar] [CrossRef]
  19. Fu, Y.; Downey, A.; Yuan, L.; Zhang, T.; Pratt, A.; Balogun, Y. Machine Learning Algorithms for Defect Detection in Metal Laser-Based Additive Manufacturing: A Review. J. Manuf. Process. 2022, 75, 693–710. [Google Scholar] [CrossRef]
  20. Spatter in Laser Welding|Journal of Laser Applications|AIP Publishing. Available online: https://pubs.aip.org/lia/jla/article-abstract/23/3/032005/221044/Spatter-in-laser-welding?redirectedFrom=fulltext (accessed on 8 February 2024).
  21. Deng, H.; Cheng, Y.; Feng, Y.; Xiang, J. Industrial Laser Welding Defect Detection and Image Defect Recognition Based on Deep Learning Model Developed. Symmetry 2021, 13, 1731. [Google Scholar] [CrossRef]
  22. Boley, M.; Fetzer, F.; Weber, R.; Graf, T. High-Speed X-ray Imaging System for the Investigation of Laser Welding Processes. J. Laser Appl. 2019, 31, 042004. [Google Scholar] [CrossRef]
  23. Hocine, S.; Van Swygenhoven, H.; Van Petegem, S.; Chang, C.S.T.; Maimaitiyili, T.; Tinti, G.; Sanchez, D.F.; Grolimund, D.; Casati, N. Operando X-ray Diffraction during Laser 3D Printing. Mater. Today 2020, 34, 30–40. [Google Scholar] [CrossRef]
  24. Hamidi Nasab, M.; Masinelli, G.; de Formanoir, C.; Schlenger, L.; Van Petegem, S.; Esmaeilzadeh, R.; Wasmer, K.; Ganvir, A.; Salminen, A.; Aymanns, F.; et al. Harmonizing Sound and Light: X-ray Imaging Unveils Acoustic Signatures of Stochastic Inter-Regime Instabilities during Laser Melting. Nat. Commun. 2023, 14, 8008. [Google Scholar] [CrossRef] [PubMed]
  25. Pandiyan, V.; Masinelli, G.; Claire, N.; Le-Quang, T.; Hamidi-Nasab, M.; de Formanoir, C.; Esmaeilzadeh, R.; Goel, S.; Marone, F.; Logé, R.; et al. Deep Learning-Based Monitoring of Laser Powder Bed Fusion Process on Variable Time-Scales Using Heterogeneous Sensing and Operando X-ray Radiography Guidance. Addit. Manuf. 2022, 58, 103007. [Google Scholar] [CrossRef]
  26. Leung, C.L.A. X-ray Imaging of Powder Consolidation during Laser Additive Manufacturing. Ph.D. Thesis, The University of Manchester, Manchester, UK, 2017. [Google Scholar]
  27. Gillespie, J.; Yeoh, W.Y.; Zhao, C.; Parab, N.D.; Sun, T.; Rollett, A.D.; Lan, B.; Kube, C.M. In Situ Characterization of Laser-Generated Melt Pools Using Synchronized Ultrasound and High-Speed X-ray Imaging. J. Acoust. Soc. Am. 2021, 150, 2409–2420. [Google Scholar] [CrossRef] [PubMed]
  28. Leung, C.L.A.; Marussi, S.; Atwood, R.C.; Towrie, M.; Withers, P.J.; Lee, P.D. In Situ X-ray Imaging of Defect and Molten Pool Dynamics in Laser Additive Manufacturing. Nat. Commun. 2018, 9, 1355. [Google Scholar] [CrossRef] [PubMed]
  29. Huang, W.; Kovacevic, R. Feasibility Study of Using Acoustic Signals for Online Monitoring of the Depth of Weld in the Laser Welding of High-Strength Steels. Proc. Inst. Mech. Eng. Part B J. Eng. Manuf. 2009, 223, 343–361. [Google Scholar] [CrossRef]
  30. Yusof, M.F.M.; Ishak, M.; Ghazali, M.F. Feasibility of Using Acoustic Method in Monitoring the Penetration Status during the Pulse Mode Laser Welding Process. IOP Conf. Ser. Mater. Sci. Eng. 2017, 238, 012006. [Google Scholar] [CrossRef]
  31. Gaja, H.; Liou, F. Defects Monitoring of Laser Metal Deposition Using Acoustic Emission Sensor. Int. J. Adv. Manuf. Technol. 2017, 90, 561–574. [Google Scholar] [CrossRef]
  32. Ghayoomi Mohammadi, M.; Mahmoud, D.; Elbestawi, M. On the Application of Machine Learning for Defect Detection in L-PBF Additive Manufacturing. Opt. Laser Technol. 2021, 143, 107338. [Google Scholar] [CrossRef]
  33. Drissi-Daoudi, R.; Pandiyan, V.; Logé, R.; Shevchik, S.; Masinelli, G.; Ghasemi-Tabasi, H.; Parrilli, A.; Wasmer, K. Differentiation of Materials and Laser Powder Bed Fusion Processing Regimes from Airborne Acoustic Emission Combined with Machine Learning. Virtual Phys. Prototyp. 2022, 17, 181–204. [Google Scholar] [CrossRef]
  34. Hauser, T.; Reisch, R.T.; Kamps, T.; Kaplan, A.F.; Volpp, J. Acoustic Emissions in Directed Energy Deposition Processes. Int. J. Adv. Manuf. Technol. 2022, 119, 3517–3532. [Google Scholar] [CrossRef]
  35. Wang, H.; Li, B.; Xuan, F.-Z. Acoustic Emission for in Situ Process Monitoring of Selective Laser Melting Additive Manufacturing Based on Machine Learning and Improved Variational Modal Decomposition. Int. J. Adv. Manuf. Technol. 2022, 122, 2277–2292. [Google Scholar] [CrossRef]
  36. Schmidt, L.; Roemer, F.; Böttger, D.; Leinenbach, F.; Strass, B.; Wolter, B.; Schricker, K.; Seibold, M.; Bergmann, J.; Del Galdo, G. Acoustic Process Monitoring in Laser Beam Welding. Procedia CIRP 2020, 94, 763–768. [Google Scholar] [CrossRef]
  37. Wasmer, K.; Drissi Daoudi, R.; Masinelli, G.; Le Quang, T.; Logé, R.; Shevchik, S. When AM (Additive Manufacturing) Meets AE (Acoustic Emission) and AI (Artificial Intelligence). In Proceedings of the 35th European and 10th International Conference on AE Testing, Ljubljana, Slovenia, 13–16 September 2022; Volume 28. [Google Scholar] [CrossRef]
  38. Wasmer, K.; Le-Quang, T.; Meylan, B.; Vakili-Farahani, F.; Olbinado, M.P.; Rack, A.; Shevchik, S.A. Laser Processing Quality Monitoring by Combining Acoustic Emission and Machine Learning: A High-Speed X-ray Imaging Approach. Procedia CIRP 2018, 74, 654–658. [Google Scholar] [CrossRef]
  39. Shevchik, S.; Le Quang, T.; Meylan, B.; Wasmer, K. Acoustic Emission for in Situ Monitoring of Laser Processing. In Proceedings of the 33rd European Conference Acoustic Emission Test (EWGAE), Senlis, France, 13–16 September 2018. [Google Scholar]
  40. Shevchik, S.A.; Kenel, C.; Leinenbach, C.; Wasmer, K. Acoustic Emission for in Situ Quality Monitoring in Additive Manufacturing Using Spectral Convolutional Neural Networks. Addit. Manuf. 2018, 21, 598–604. [Google Scholar] [CrossRef]
  41. Wasmer, K.; Wüst, M.; Cui, D.; Masinelli, G.; Pandiyan, V.; Shevchik, S. Monitoring of Functionally Graded Material during Laser Directed Energy Deposition by Acoustic Emission and Optical Emission Spectroscopy Using Artificial Intelligence. Virtual Phys. Prototyp. 2023, 18, e2189599. [Google Scholar] [CrossRef]
  42. Kouprianoff, D.; Yadroitsava, I.; du Plessis, A.; Luwes, N.; Yadroitsev, I. Monitoring of Laser Powder Bed Fusion by Acoustic Emission: Investigation of Single Tracks and Layers. Front. Mech. Eng. 2021, 7, 678076. [Google Scholar] [CrossRef]
  43. Shevchik, S.; Le-Quang, T.; Meylan, B.; Farahani, F.V.; Olbinado, M.P.; Rack, A.; Masinelli, G.; Leinenbach, C.; Wasmer, K. Supervised Deep Learning for Real-Time Quality Monitoring of Laser Welding with X-ray Radiographic Guidance. Sci. Rep. 2020, 10, 3389. [Google Scholar] [CrossRef] [PubMed]
  44. Martin, A.A.; Calta, N.P.; Hammons, J.A.; Khairallah, S.A.; Nielsen, M.H.; Shuttlesworth, R.M.; Sinclair, N.; Matthews, M.J.; Jeffries, J.R.; Willey, T.M.; et al. Ultrafast Dynamics of Laser-Metal Interactions in Additive Manufacturing Alloys Captured by in Situ X-ray Imaging. Mater. Today Adv. 2019, 1, 100002. [Google Scholar] [CrossRef]
  45. Wolff, S.J.; Wang, H.; Gould, B.; Parab, N.; Wu, Z.; Zhao, C.; Greco, A.; Sun, T. In Situ X-ray Imaging of Pore Formation Mechanisms and Dynamics in Laser Powder-Blown Directed Energy Deposition Additive Manufacturing. Int. J. Mach. Tools Manuf. 2021, 166, 103743. [Google Scholar] [CrossRef]
  46. Chen, Y.; Clark, S.J.; Huang, Y.; Sinclair, L.; Lun Alex Leung, C.; Marussi, S.; Connolley, T.; Magdysyuk, O.V.; Atwood, R.C.; Baxter, G.J.; et al. In Situ X-ray Quantification of Melt Pool Behaviour during Directed Energy Deposition Additive Manufacturing of Stainless Steel. Mater. Lett. 2021, 286, 129205. [Google Scholar] [CrossRef]
  47. Parab, N.D.; Zhao, C.; Cunningham, R.; Escano, L.I.; Gould, B.; Wolff, S.; Guo, Q.; Xiong, L.; Kantzos, C.; Pauza, J. High-Speed Synchrotron X-ray Imaging of Laser Powder Bed Fusion Process. Synchrotron Radiat. News 2019, 32, 4–8. [Google Scholar] [CrossRef]
  48. Guo, Q.; Zhao, C.; Qu, M.; Xiong, L.; Escano, L.I.; Hojjatzadeh, S.M.H.; Parab, N.D.; Fezzaa, K.; Everhart, W.; Sun, T.; et al. In-Situ Characterization and Quantification of Melt Pool Variation under Constant Input Energy Density in Laser Powder Bed Fusion Additive Manufacturing Process. Addit. Manuf. 2019, 28, 600–609. [Google Scholar] [CrossRef]
  49. Sun, T. Probing Ultrafast Dynamics in Laser Powder Bed Fusion Using High-Speed X-ray Imaging: A Review of Research at the Advanced Photon Source. JOM 2020, 72, 999–1008. [Google Scholar] [CrossRef]
  50. Li, X.; Zhao, C.; Sun, T.; Tan, W. Revealing Transient Powder-Gas Interaction in Laser Powder Bed Fusion Process through Multi-Physics Modeling and High-Speed Synchrotron X-ray Imaging. Addit. Manuf. 2020, 35, 101362. [Google Scholar] [CrossRef]
  51. Li, X.; Guo, Q.; Chen, L.; Tan, W. Quantitative Investigation of Gas Flow, Powder-Gas Interaction, and Powder Behavior under Different Ambient Pressure Levels in Laser Powder Bed Fusion. Int. J. Mach. Tools Manuf. 2021, 170, 103797. [Google Scholar] [CrossRef]
  52. Xiao, X.; Lu, C.; Fu, Y.; Ye, X.; Song, L.; Xiao, X.; Lu, C.; Fu, Y.; Ye, X.; Song, L. Progress on Experimental Study of Melt Pool Flow Dynamics in Laser Material Processing. In Liquid Metals; IntechOpen: London, UK, 2021; ISBN 978-1-83969-185-0. [Google Scholar]
  53. Cunningham, R.; Zhao, C.; Parab, N.; Kantzos, C.; Pauza, J.; Fezzaa, K.; Sun, T.; Rollett, A.D. Keyhole Threshold and Morphology in Laser Melting Revealed by Ultrahigh-Speed X-ray Imaging. Science 2019, 363, 849–852. [Google Scholar] [CrossRef] [PubMed]
  54. Wang, R.; Garcia, D.; Kamath, R.R.; Dou, C.; Ma, X.; Shen, B.; Choo, H.; Fezzaa, K.; Yu, H.Z.; Kong, Z. (James). In Situ Melt Pool Measurements for Laser Powder Bed Fusion Using Multi Sensing and Correlation Analysis. Sci. Rep. 2022, 12, 13716. [Google Scholar] [CrossRef] [PubMed]
  55. Templeton William, F.; Shawn, H.; Seth, S.; Albert, T.; Sneha Prabha, N. Finding the Limits of Single-Track Deposition Experiments: An Experimental Study of Melt Pool Characterization in Laser Powder Bed Fusion. Mater. Des. 2023, 231, 112069. [Google Scholar] [CrossRef]
  56. Parab, N.D.; Zhao, C.; Cunningham, R.; Escano, L.I.; Fezzaa, K.; Everhart, W.; Rollett, A.D.; Chen, L.; Sun, T. Ultrafast X-ray Imaging of Laser–Metal Additive Manufacturing Processes. J. Synchrotron Radiat. 2018, 25, 1467–1477. [Google Scholar] [CrossRef]
  57. Tochigi, Y.; Hanzawa, K.; Kato, Y.; Kuroda, R.; Mutoh, H.; Hirose, R.; Tominaga, H.; Takubo, K.; Kondo, Y.; Sugawa, S. A Global-Shutter CMOS Image Sensor with Readout Speed of 1-Tpixel/s Burst and 780-Mpixel/s Continuous. IEEE J. Solid-State Circuits 2013, 48, 329–338. [Google Scholar] [CrossRef]
  58. Tsuji, K. (Ed.) The Micro-World Observed by Ultra High-Speed Cameras; Springer International Publishing: Cham, Switzerland, 2018; ISBN 978-3-319-61490-8. [Google Scholar]
  59. Wang, J.; Zhu, R.; Liu, Y.; Zhang, L. Understanding Melt Pool Characteristics in Laser Powder Bed Fusion: An Overview of Single- and Multi-Track Melt Pools for Process Optimization. Adv. Powder Mater. 2023, 2, 100137. [Google Scholar] [CrossRef]
  60. Clark, S.J.; Leung, C.L.A.; Chen, Y.; Sinclair, L.; Marussi, S.; Lee, P.D. Capturing Marangoni Flow via Synchrotron Imaging of Selective Laser Melting; IOP Publishing: Bristol, UK, 2020; Volume 861, p. 012010. [Google Scholar]
  61. Khairallah, S.A.; Anderson, A.T.; Rubenchik, A.; King, W.E. Laser Powder-Bed Fusion Additive Manufacturing: Physics of Complex Melt Flow and Formation Mechanisms of Pores, Spatter and Denudation Zones. Acta Mater. 2016, 108, 36–45. [Google Scholar] [CrossRef]
  62. Young, Z.A.; Guo, Q.; Parab, N.D.; Zhao, C.; Qu, M.; Escano, L.I.; Fezzaa, K.; Everhart, W.; Sun, T.; Chen, L. Types of Spatter and Their Features and Formation Mechanisms in Laser Powder Bed Fusion Additive Manufacturing Process. Addit. Manuf. 2020, 36, 101438. [Google Scholar] [CrossRef]
  63. Guo, Q.; Zhao, C.; Escano, L.I.; Young, Z.; Xiong, L.; Fezzaa, K.; Everhart, W.; Brown, B.; Sun, T.; Chen, L. Transient Dynamics of Powder Spattering in Laser Powder Bed Fusion Additive Manufacturing Process Revealed by In-Situ High-Speed High-Energy X-ray Imaging. Acta Mater. 2018, 151, 169–180. [Google Scholar] [CrossRef]
  64. Wang, D.; Wu, S.; Fu, F.; Mai, S.; Yang, Y.; Liu, Y.; Song, C. Mechanisms and Characteristics of Spatter Generation in SLM Processing and Its Effect on the Properties. Mater. Des. 2017, 117, 121–130. [Google Scholar] [CrossRef]
  65. Zhao, C.; Fezzaa, K.; Cunningham, R.W.; Wen, H.; De Carlo, F.; Chen, L.; Rollett, A.D.; Sun, T. Real-Time Monitoring of Laser Powder Bed Fusion Process Using High-Speed X-ray Imaging and Diffraction. Sci. Rep. 2017, 7, 3602. [Google Scholar] [CrossRef] [PubMed]
  66. Drissi-Daoudi, R.; Masinelli, G.; de Formanoir, C.; Wasmer, K.; Jhabvala, J.; Logé, R.E. Acoustic Emission for the Prediction of Processing Regimes in Laser Powder Bed Fusion, and the Generation of Processing Maps. Addit. Manuf. 2023, 67, 103484. [Google Scholar] [CrossRef]
  67. Hossain, M.S.; Taheri, H. In Situ Process Monitoring for Additive Manufacturing through Acoustic Techniques. J. Mater. Eng. Perform. 2020, 29, 6249–6262. [Google Scholar] [CrossRef]
  68. Fisher, K.A.; Candy, J.V.; Guss, G.; Mathews, M.J. Evaluating Acoustic Emission Signals as an In Situ Process Monitoring Technique for Selective Laser Melting (SLM); Lawrence Livermore National Lab. (LLNL): Livermore, CA, USA, 2016. [Google Scholar]
  69. Jiang, M.; Liang, Y.; Feng, X.; Fan, X.; Pei, Z.; Xue, Y.; Guan, R. Text Classification Based on Deep Belief Network and Softmax Regression. Neural Comput. Appl. 2018, 29, 61–70. [Google Scholar] [CrossRef]
  70. Tempelman, J.R.; Wachtor, A.J.; Flynn, E.B.; Depond, P.J.; Forien, J.-B.; Guss, G.M.; Calta, N.P.; Matthews, M.J. Detection of Keyhole Pore Formations in Laser Powder-Bed Fusion Using Acoustic Process Monitoring Measurements. Addit. Manuf. 2022, 55, 102735. [Google Scholar] [CrossRef]
  71. Eschner, N.; Weiser, L.; Häfner, B.; Lanza, G. Classification of Specimen Density in Laser Powder Bed Fusion (L-PBF) Using in-Process Structure-Borne Acoustic Process Emissions. Addit. Manuf. 2020, 34, 101324. [Google Scholar] [CrossRef]
  72. Deutsch, V.; Platte, M.; Vogt, M. Ultraschallprüfung: Grundlagen und Industrielle Anwendungen; Springer: Berlin/Heidelberg, Germany, 2013; ISBN 978-3-642-59138-9. [Google Scholar]
  73. Huang, W.; Kovacevic, R. Acoustic Monitoring of Weld Penetration during Laser Welding of High Strength Steels; AIP Publishing: Melville, NY, USA, 2009; pp. 630–637. [Google Scholar]
  74. Kim, Y.; Choi, S.; Jhang, K.-Y.; Kim, T. Experimental Verification of Contact Acoustic Nonlinearity at Rough Contact Interfaces. Materials 2021, 14, 2988. [Google Scholar] [CrossRef]
  75. Jin, J.; Johnson, P.; Shokouhi, P. An Integrated Analytical and Experimental Study of Contact Acoustic Nonlinearity at Rough Interfaces of Fatigue Cracks. J. Mech. Phys. Solids 2020, 135, 103769. [Google Scholar] [CrossRef]
  76. Sun, X.; Ding, X.; Li, F.; Zhou, S.; Liu, Y.; Hu, N.; Su, Z.; Zhao, Y.; Zhang, J.; Deng, M. Interaction of Lamb Wave Modes with Weak Material Nonlinearity: Generation of Symmetric Zero-Frequency Mode. Sensors 2018, 18, 2451. [Google Scholar] [CrossRef] [PubMed]
  77. Novak, A.; Bentahar, M.; Tournat, V.; El Guerjouma, R.; Simon, L. Nonlinear Acoustic Characterization of Micro-Damaged Materials through Higher Harmonic Resonance Analysis. NDT E Int. 2012, 45, 1–8. [Google Scholar] [CrossRef]
  78. Zhang, J.; Ma, H.; Yan, W.; Li, Z. Defect Detection and Location in Switch Rails by Acoustic Emission and Lamb Wave Analysis: A Feasibility Study. Appl. Acoust. 2016, 105, 67–74. [Google Scholar] [CrossRef]
  79. Vo, N.T.; Atwood, R.C.; Drakopoulos, M. Superior Techniques for Eliminating Ring Artifacts in X-ray Micro-Tomography. Opt. Express 2018, 26, 28396–28412. [Google Scholar] [CrossRef] [PubMed]
  80. de Formanoir, C.; Hamidi Nasab, M.; Schlenger, L.; Van Petegem, S.; Masinelli, G.; Marone Welford, F.; Salminen, A.; Ganvir, A.; Wasmer, K.; Logé, R. Healing of Keyhole Porosity by Means of Defocused Laser Beam Remelting Operando Observation by X-ray Imaging and Acoustic Emission-Based Detection. Addit. Manuf. 2023, 79, 103880. [Google Scholar] [CrossRef]
  81. Fischer, B.; Rohringer, W.; Panzer, N.; Hecker, S. Acoustic Process Control for Laser Material Processing. Laser Technol. J. 2017, 14, 21–25. [Google Scholar] [CrossRef]
  82. Chen, L.; Yao, X.; Feng, W.; Chew, Y.; Moon, S.K. Multimodal Sensor Fusion for Real-Time Location-Dependent Defect Detection in Laser-Directed Energy Deposition. In Proceedings of the International Design Engineering Technical Conferences and Computers and Information in Engineering Conference, Boston, MA, USA, 20–23 August 2023. [Google Scholar]
  83. Plotnikov, Y.; Henkel, D.; Burdick, J.; French, A.; Sions, J.; Bourne, K. Infrared-Assisted Acoustic Emission Process Monitoring for Additive Manufacturing; AIP Publishing: Vermont, VT, USA, 2019; Volume 2102. [Google Scholar]
  84. Tempelman, J.R.; Wachtor, A.J.; Flynn, E.B.; Depond, P.J.; Forien, J.-B.; Guss, G.M.; Calta, N.P.; Matthews, M.J. Sensor Fusion of Pyrometry and Acoustic Measurements for Localized Keyhole Pore Identification in Laser Powder Bed Fusion. J. Mater. Process. Technol. 2022, 308, 117656. [Google Scholar] [CrossRef]
  85. Kube, C.; Shu, Y.; Lew, A.; Galles, D. Real-Time Characterization of Laser-Generated Melt Pools Using Ultrasound. Mater. Eval. 2018, 76, 525–534. [Google Scholar]
  86. Garavaglia, M.; Demir, A.G.; Zarini, S.; Victor, B.M.; Previtali, B. Process Development and Coaxial Sensing in Fiber Laser Welding of 5754 Al-Alloy. J. Laser Appl. 2019, 31, 022419. [Google Scholar] [CrossRef]
  87. Martin, A.A.; Wang, J.; DePond, P.J.; Strantza, M.; Forien, J.-B.; Gorgannejad, S.; Guss, G.M.; Thampy, V.; Fong, A.Y.; Weker, J.N.; et al. A Laser Powder Bed Fusion System for Operando Synchrotron X-ray Imaging and Correlative Diagnostic Experiments at the Stanford Synchrotron Radiation Lightsource. Rev. Sci. Instrum. 2022, 93, 043702. [Google Scholar] [CrossRef]
  88. Available online: https://www.physicalacoustics.com/content/literature/sensors/Model_PICO_HF-1.2.pdf (accessed on 9 January 2024).
Figure 1. The schematic of operando radiography is set up at the TOMCAT beamline. (a,b) Build of the mini-PBF-LB machine chamber and the camera via two separate views. (c) Zoom of the build plate and the printed object. The laser beam (2) is focused onto a 12 mm2 build plate (3) and the sample (4) during PBF-LB processing via a two-axis scanning head (1). Through the sample (c), a parallel X-ray beam (5) travels to the microscope (6) [25].
Metrology 04 00012 g001
Figure 2. Melt pool and vapor depression evolution under stationary laser light. (A) The initial stage of melt pool formation. (B) A tiny, stable vapor depression forms. (C) The vapor depression is steadily growing. (D) In the vapor depression, instabilities arise. (E,F) Rapid changes occur in the form of vapor depression. (G,H) The vapor depression fluctuates regularly. (I,J) The melt pool changes from quasi-semicircular to bimodal, with a bowl on top and a spike in the center at the bottom. A Ti-6Al-4V bare plate was used as the sample. The laser spot has a diameter of 140 µm in, and the laser output is 156 W. The photos were background-corrected using the image taken prior to the laser illumination. The region of the melt pool is highlighted in red in (E,J) [53].
Metrology 04 00012 g002
Figure 3. The effect of camera exposure duration on solid–liquid interface imaging during the laser AM process: (a) 1 µs; (b) 5 µs; (c) 10 µs; (d) 20 µs. (e) The solid–liquid (red squares) and liquid–gas (blue circles) interfaces. The laser was scanned from left to right. The sample thickness is 380 µm (along the X-ray beam direction). The scanning speed was 500 mm/s, and the laser power was 260 W. The scale bars are 100 µm. Ref. [56].
Metrology 04 00012 g003
Figure 4. High-speed X-ray images of the laser AM process for the Al-Si10-Mg plate (a,b), as well as the powder bed fusion process for Ti-6Al-4V (c). The frames were cropped to allow for easy observation of the vapor depression’s intricacies, including oscillations in the liquid–vapor interface. The experimental parameters for each process were as follows: (a) laser power of 520 W, scan speed of 0.8 m/s, frame rate of 1.08 MHz, and exposure time of 200 ns; (b) laser power of 468 W, scan speed of 0.6 m/s, frame rate of 10 MHz, and exposure time of 50 ns; and (c) laser power of 416 W, scan speed of 0.7 m/s, frame rate of 1.08 MHz, and exposure time of 200 ns. The thickness of the plates was approximately 500 µm. For panel (c), the powder size used was 15–45 µm. The rotation of the particle identified by the red square [56].
Metrology 04 00012 g004
Figure 5. (ae) The time series depicting the movement of a tungsten tracer particle along the side of a keyhole. (f) The tungsten tracers’ trajectories across the melt pool. Passing of a single tungsten tracer particle has been spotlighted in yellow. Ref. [60].
Metrology 04 00012 g005
Figure 6. Powder motion tracking during the Ti-6Al-4V laser powder bed fusion process. (a) Dynamic X-ray pictures taken at various times, with red arrows denoting the velocity of each powder particle. In this scenario, the laser power and beam size are 520 W and ~220 µm (1/e2), respectively. The particle size ranges from 5 to 45 µm, and the powder layer thickness is 100 µm. (b) Moving trajectories of five distinct particles, P1–P5, denoted in (a) by blue dashed squares, and each picture in (a) has the same dimensions. The vertical and horizontal blue dashed lines indicate the laser beam position and the top surface of the powder bed, respectively. Insets in (b) depict a particle merger process. The scale bars in (a,b) are 100 µm. (c,d) Powder movement velocity statistics are shown. Blue and red colors represent distributions of (c) ejection speed and (d) ejection angle of particles outside the powder bed at laser powers of 340 W and 520 W, respectively [65].
Metrology 04 00012 g006
Figure 7. Raw (top row) and differential (bottom row) sequences of X-ray pictures from large-scale DED. The following parameters were used: laser power of 200 W, scan speed of 100 mm/s, and powder flow rate of 320 mg/s. In each bottom frame, the border of the melt pool is indicated by white arrows, and the changing surface of the melt pool is highlighted by red arrows. To enhance the contrast of the melt pool, the bottoms row of images is divided by the preceding frame. The differential photos reveal bright and dark patches on the surface, indicating rapid variations in the surface, as represented by the red arrows in the raw images [5].
Metrology 04 00012 g007
Figure 8. (a) Stochastic regime instabilities and the transition from conduction to stable and unstable keyhole regimes during laser processing of 316 L stainless steel. It presents images of variations in melt pool morphology under constant laser parameters, along with normalized and filtered acoustic signal plots. Vertical lines indicate significant events, such as transitions from conduction to stable keyhole, stable keyhole back to conduction, conduction to unstable keyhole, and unstable keyhole back to conduction. Resultant pores in the unstable keyhole regime are highlighted by green circles. The yellow and white dashed lines represent the solid–liquid (melt pool) and gas-liquid (depression zone) boundaries, respectively [24]. (b) Time evolution of an AE signal using X-ray videos for annotation. The spectrogram on the right represents the signal power spectral density. The orange signal on the left denotes the keyhole regime (1) and conduction (0) as the ground truth. During the keyhole regime, most of the signal energy falls within the 35–105 kHz frequency range. The vertical dotted lines in yellow (or red) on the right chart indicate the initiation (or termination) of the keyhole phases. The spectrogram is generated by segmenting the AE signal into 1024 data points with 512-point overlaps, applying a Hanning window, and computing the spectrum for each segment [24].
Metrology 04 00012 g008
Figure 9. Overview of the time-domain AE signal analysis: (a) visualization of the raw signal, marking the start and end of laser irradiation; (b) shifting of the time axis t’ = t − t s t a r t ; (c) superposition of the AE signal with the pore removal events identified in the video (represented by discontinuous lines); and (d) a typical example of a pore removal event, occurring at t = 10.5 ms, highlighted in orange in part (c). The boundaries of the melt pool are indicated by dotted white lines, determined based on variations in grey level [80].
Metrology 04 00012 g009
Figure 10. Principle of operation for the optical microphone. The shift in the refractive index of a Fabry–Pérot etalon enables the optical detection of ultrasonic waves [81].
Metrology 04 00012 g010
Figure 11. (a) The fixture for holding the ultrasonic transducers and sample. (b) A schematic illustrating the pathways of the incident and refracted rays [27].
Metrology 04 00012 g011
Figure 12. The time history of ultrasound and X-ray frames selected from the (a) PC and (b) PE configurations. The laser was active for a duration of 1 to 6 ms. The video results can be found in the supplemental files [27].
Metrology 04 00012 g012
Figure 13. (a) X-ray images were taken of an aluminum sample that was exposed to a single 10 ms laser pulse with a power of 1 kW. During this exposure, the sample was continuously moved at a constant speed of 1.5 mm/s relative to the laser beam. A scale bar, located at the bottom right of the images, shows a distance of 200 µm. Specifically, at the 5 ms mark, the images were marked with colored arrows: red, orange, blue, and black. These arrows, respectively, denoted the gas phase, liquid phase, solid phase, and the boundary between the liquid and solid phases. Subsequently, red arrows were used at 6 ms and 9 ms to illustrate the expulsion of molten material during a blowout and the creation of a pore during an unstable keyhole, respectively. Finally, during the time interval of 10–10.5 ms, black arrows were employed to indicate the formation of a pore resulting from the rapid collapse of the keyhole at the end of the laser irradiation. (b) The pixel intensity profile of the keyhole channel reveals that regions with increased brightness are associated with lower-density areas. (c) LBR signals (at the top) and AE signals (at the bottom) for the laser welding process. (d) Tensors include three photodiodes (back reflection, visible, and infrared) along with the wavelet spectrograms for the LBR signals (top) and the AE signals (bottom). Red rectangle with dashed and solid lines denotes window, framing two consecutive patterns within. Ref. [43].
Metrology 04 00012 g013
Figure 14. (a) The mini-SLM configuration includes an AE sensor and optical detectors. (b) Schematics of the heterogeneous sensing system, which includes an AE sensor and photodiode detectors [25]. The red arrow shows 25% of the original signal directed to a Si photodiode by a 25:75 multi-mode fiber splitter and the other 75%, specified by red dashed arrow, is split by a 50:50 splitter. The green arrow and green dashed arrow are connected to InGaAs (PDA20CS2) and Si (PDA100A2) photodiodes, respectively.
Metrology 04 00012 g014aMetrology 04 00012 g014b
Figure 15. (a) A simplified layout of the in situ diagnostic system set up to record thermionic (current preamplifier), optical (photodiode), and acoustic (microphone) signals while being exposed to laser light. (b) Breadboard schematic for the laser and diagnostic optics. (c) A diagram illustrating the information exchange between the laser, X-ray imaging, and diagnostic system. The arrow illustrates the direction of information exchange. The ScanLab RTC5 scan controller card inside the PC and the external NI FPGA interface module receive their commands via the Labview-based control software. The FPGA controls the timing of X-ray imaging, laser power commands, and the recording of diagnostic signals, ensuring synchronized data gathering at 470 kHz [87].
Metrology 04 00012 g015
Table 1. Setup characteristics of synchronized AE and X-ray imaging related to research works over the years.
Metrology 04 00012 i001Metrology 04 00012 i002Metrology 04 00012 i003Metrology 04 00012 i004Metrology 04 00012 i005
Research Works K. Wasmer et al., 2018 [38]C. Kube, et al., 2018 [85]S. Shevchik et al., 2020 [43]Gillespie, J. et al., 2021 [27]A.A. Martin et al., 2022 [87]De Formanoir et al., 2023 [80]
Applied Facilities
X-ray source setup characteristicsSynchrotron facilityBeamline ID19 of the ESRFEuropean Synchrotron (ESRF)European Synchrotron (ESRF)European Synchrotron (ESRF)Stanford Synchrotron Radiation Light Source (SSRL)(TOMCAT) beamline of the Swiss Light Source (SLS)
Laser and X-ray acquisition synchronization-Laser control triggeredLaser control triggeredLaser control triggered-TTL triggered, provided by laser control card
X-ray spectrumPink beam mean energy was 26.3 keVPink beam with average power around 26 keVPink beam with average power around 26 keVPink beam with average power around 26 keV7.4 keVFiltered within 10 to 55 keV and peak around 20 keV
X-ray detector characteristicsScintillator250 µm-thick Ce-doped Lu3Al5O12-250 µm-thick Ce-doped LuAG (Lu3Al5O12)European Synchrotron (ESRF)100 µm-thick
YAG:Ce (Crytur)
150 µm-thick LuAg:Ce
Pixel-896 × 776 pixels-896 × 776 pixels1024 × 672 pixels2016 × 2016 CMOS Imaging
Pixel size11 µm1.923 µm11 µm1.923 µm2 µm11 µm
Frame rate28,000 to 36,000 fps28.503 kHz28,762 fps28.503 kHz20 kHz10 kHz
Exposure time--30 µm-45 µm95 µm
Laser characteristicsTypeSingle-mode fiber laser source star fiber 150 P (fiber laser star fiber 150 P/300 P)fiber laserSingle-mode fiber laser
source star fiber 150 P (Coherent Inc., Belp, Switzerland)
Fiber laserSingle-mode CW Yb-fiber laser (IPG
Photonics, YLR-500-AC-Y14)
Pulsed mode
Wavelength1070 nm1070 nm1070 nm1070 nm1070 nm1070 nm
Spot diameter30 µm120 µm30 µm120 µm73–135 µm13.75 µm
Maximum Power-477 W1.5 kW477 W500 W500 W
Acoustic sensor characteristicsTypePiezo acoustic sensor PICOUltrasound transducerPiezo sensor
PICO HF-1.2 (Physical Acoustics, MISTRAS Group, Germany)
Piezo ultrasonic transducersPCB PiezotronicsMembrane-free optical microphone (Eta250 Ultra, XARION Laser Products)
Frequency range500–1850 kHz [88]Resonance frequency: 25 MHzSample rate of oscilloscope: 50–2000 kHzCenter frequency of 25 MHz4 to 100,000 Hz
(+2/−3 dB)
10 Hz to 1 MHz
PlaceContact to holderContactContactContactNon-contactNon-contact
Sampling rate10 MHz500 MHz10 MHz-470 kHz2 MHz
Detected phenomenaConduction welding, stable keyhole, unstable keyhole, and spatterMelt pool characterizationProcess instabilities: conduction welding, stable keyhole, unstable keyhole, blowout, and poresMelt pool characterizationFluctuations in the melt pool, pore formation, defect formationPore removal, remelting, defect healing
Disclaimer/Publisher’s Note: The statements, opinions and data contained in all publications are solely those of the individual author(s) and contributor(s) and not of MDPI and/or the editor(s). MDPI and/or the editor(s) disclaim responsibility for any injury to people or property resulting from any ideas, methods, instructions or products referred to in the content.

