Entry

Biological Pollution of Indoor Air, Its Assessment and Control Methods

1
Institute of Forest Sciences, Faculty of Civil Engineering and Environmental Sciences, Białystok University of Technology, ul. Wiejska 45E, 15-351 Białystok, Poland
2
Forest Protection Department, Forest Research Institute, ul. Braci Leśnej 3, 05-090 Sękocin Stary, Poland
*
Author to whom correspondence should be addressed.
Encyclopedia 2024, 4(3), 1217-1235; https://doi.org/10.3390/encyclopedia4030079
Submission received: 4 June 2024 / Revised: 15 July 2024 / Accepted: 1 August 2024 / Published: 5 August 2024
(This article belongs to the Section Engineering)

Definition

:
The aim of the entry was to write a substantial contribution that analyses and compares the biological pollution of indoor air, the possibilities of its assessment and the control methods. In addition, the aim of our entry was to review journals covering both commercial and residential buildings. By analysing the above topics from the existing articles, one can have the impression that air pollution is one of the most important problems that need to be solved in the modern world. Adequate air quality is important for maintaining human health, affects the health of ecosystems, including animals, and determines crop production. With the development of civilisation, the quality of air in the atmosphere and indoors is constantly deteriorating. Indoor air pollution can be divided into physical (e.g., noise, inadequate lighting, ionising radiation), chemical (e.g., tobacco smoke, household products) and microbiological (bacteria, viruses, fungi and products of their metabolism) factors. Each of these factors can have a negative impact on a person’s health or cause premature death. The entry deals with indoor air pollution, focussing on biological pollutants. It compares different methods available and describes the method of sampling to analyse indoor air pollution and ways to reduce it.

1. Introduction

Today, air pollution is considered one of the greatest environmental threats to human health, and clean air is a basic requirement for staying healthy. Data collected by the World Health Organisation (WHO) show that polluted air was responsible for 6.7 million deaths in 2019 and affected 3 billion people worldwide [1]. The change in people’s lifestyles has meant that they are no longer outdoors, but indoors, where they spend most of their time [2]. Nowadays, each of us spends an average of 87% of our time indoors; in industrialised countries, it is even 90%, of which 60% is at home and 30% is at work [3,4,5]. In enclosed spaces and buildings, occupant actions, poor building design or inadequate maintenance often lead to a condition known as ‘Sick Building Syndrome’ (SBS) [2]. This syndrome often occurs in people who spend a lot of time indoors and manifests itself in headaches and dizziness, fatigue, irritability, sleep and concentration disorders, mucous membrane irritation, allergies and skin lesions [6]. In its report, the European Federation of Allergy and Airways Diseases Patients’ Associations (EFA) confirms reports that Europeans suffer from allergies caused by a systematic deterioration in indoor air quality (EFA 2022). Indoor air is a mixture of components that surrounds people in enclosed spaces. The components that make up indoor air pollutants include chemical, physical and microbiological pollutants. Each of these groups has a specific effect on indoor air quality and can be a cause of health complaints for room [7].
Heating, cooling and ventilating homes is a major problem for people living in buildings. Both homeowners and tenants can experience indoor environmental quality (IEQ) problems, such as poor thermal comfort and humidity, if heating, ventilation and air conditioning (HVAC) systems are not installed or are too small. As they are expensive to run, residents of poorer households are the most affected [8]. There is no need to convince anyone how important the microbiological quality of air in operating rooms is. It is determined by the level of microbiological contamination of air and critical surfaces by passive air sampling and infection control [9]. In this case, a passive method of collecting air samples with Petri dishes on agar is used. To meet microbiological standards, air samples in operating theatres should be within 10 CFU/m3, and the average number of bacterial colonies should be zero to two in quiet phases and one to four in active phases. Approximately 60% of isolates from operating theatres belong mainly to the genus Staphylococcus (S. epidermidis, S. hominis and S. haemolyticus), Streptococcus anginosus and Bacillus sp. Light dehumidifiers are also used, using germicidal ultraviolet radiation (UVGI) in combination with various types of filters (carbon fiber or polyester) [10].
This entry reviews the status of chemical, physical and microbiological indoor air pollution. It describes the known methods for testing indoor air quality, including molecular biological methods, and it analyses the advantages and disadvantages of the methods for treating indoor air (physical, chemical, and biological). It also describes the development of analytical techniques for the determination of volatile substances.

2. Classification of Air Pollution

2.1. Chemical Contaminants

Indoor chemical pollutants are ubiquitous and come in many forms: from smoke produced by burning fuels, especially in households in developing countries, to complex mixtures of volatile organic compounds in modern buildings [11]. Most chemical air pollutants have their source within a building. These are often everyday items, such as hairspray, perfume, air fresheners, disinfectants, carpet cleaners, household appliances, printers and computers [2]. Volatile organic compounds (VOCs), which are released from wall coverings, synthetic paints or adhesives, among other things, can contribute to air pollution and cause irritation to the eyes and respiratory tract [12]. The combustion of solid fuels for heating and cooking purposes in households releases carbon monoxide, polycyclic aromatic hydrocarbons, nitrogen and sulfur oxides, arsenic and fluorine compounds [11]. Compounds released from construction and building components and room furnishings, e.g., fibreglass, mineral wool, linoleum flooring, and polyvinyl chloride, can contribute to skin lesions, allergies and upper respiratory diseases [13]. Daily exposure to indoor chemical pollutants can contribute to an increased incidence of cancer, asthma and autism [11].

2.2. Physical Contaminants

Physical air pollutants include excessive lighting, noise, vibration, ionising and electromagnetic radiation. These can lead to chronic negative health effects. Inadequate lighting leads to visual fatigue, and artificial lighting at night impairs melatonin production and can contribute to an increase in breast and colon cancers [14].
Long-term noise causes hearing impairment, changes in the central nervous system, learning and memory disorders, fatigue or excitability, headaches and insomnia, high blood pressure and balance disorders [15]. Vibrations, i.e., mechanical oscillations with frequencies above 0.5 Hz, can be the cause of skeletal damage, numbness and tingling in the limbs, apathy, fatigue, headaches and dizziness [16].
Ionising radiation has mutagenic effects and damages the structure of nucleic acids. Electromagnetic radiation disrupts the endocrine system and causes changes in hormone levels and blood counts [15].

2.3. Microbiological Contaminants

Microbiological indoor air pollutants include bacterial cells and virus particles, mycelial fragments, and fungal and bacterial spores. As a rule, microorganisms are not present in the air alone but in the form of a biological aerosol (bioaerosol), which is a colloidal system containing a dispersed phase, i.e., air and biological material. Bioaerosols account for 5–34% of indoor air pollutants, and the most important groups of microorganisms include bacteria (e.g., Pseudomonas spp., Xanthomonas spp.), viruses and fungi (e.g., Aspergillus, Trichoderma, Penicillium, Cladosporium, Alternaria, Fusarium) [17,18].
Degree of microbiologica pollution allowed in various environment is presented in Table 1.
The bioaerosol also contains secondary metabolites of fungal or bacterial origin, i.e., mycotoxins, bacterial endotoxins and enterotoxins as well as enzymes [21,22]. Microorganisms in the air retain their infectious potential. The air is also a channel for the movement of bacteria and fungi [18,23].
In indoor air, microorganisms are less exposed to meteorological factors such as temperature or UV radiation. Therefore, their survival time is longer, and their abundance is not subject to large seasonal fluctuations [24,25].
Studies also show that the concentration of microbial pollutants in indoor air is higher than in outdoor air [5,26].
The sources of microbial pollution in the air can be divided into natural and anthropogenic, i.e., caused by human activities [27]. Bioaerosols enter the human body by inhalation, ingestion and through the skin and cause infectious diseases, allergies, cancer and have toxic effects [28].
The main route of entry of microorganisms into the human body is through respiration, so respiratory infections and lung diseases are the most common complaints. As children have a higher pulmonary air exchange than adults and older people have a weaker immune system, these two groups are particularly susceptible to bioaerosols contained in the air [29]. Microorganisms in the air settle on food and skin and can enter the gastrointestinal tract [18].

2.3.1. Bacterial Contamination of Indoor Air

Bacteria make up 19–26% of all microorganisms in indoor air. Indoor air contains mainly bacteria of the following genera: Pseudomonas, Enterobacter, Flavobacterium, Alcaligenes, Microccocus, Bacillus and Streptomyces. Under normal conditions, i.e., low concentrations of microorganisms in the air, they do not pose a health risk. However, some of them exhibit pathogenic, allergenic and toxic properties [30,31].
The forms and stages of bacteria that are resistant to drying out and sunlight, i.e., spore forms (endospores) and vegetative forms that produce carotenoid pigments or protective layers [18], remain in indoor air the longest. In addition to living microorganisms, indoor air also contains their fragments or metabolic products, which also have toxic and allergenic effects [18]. Endotoxins, components of the cell wall of Gram-negative bacteria that are inhaled by humans with the air, can cause bronchial asthma, hypoglycemia, hypotension, respiratory problems and general physical failure [31]. Ventilation and air conditioning systems create favorable conditions for the growth of Legionella bacteria. These microorganisms can cause legionellosis (Legionnaires’ disease), which is characterised by progressive pneumonia with fever above 40 °C, chills, general malaise, dry cough and diarrhoea. In some cases, liver damage and bradycardia, i.e., a slowing of the heart rate, are also present [32]. Airborne bacterial diseases also include pulmonary tuberculosis (Mycobacterium tuberculosis), pneumonia (Staphylococcus, Streptococcus pneumoniae), tonsillitis, whooping cough (Bordetella pertussis bacilli), and diphtheria (Corynebacterium diphtheriae) [18].
Assessment of the degree of atmospheric air pollution by bacteria is presented in Table 2.

2.3.2. Viral Indoor Air Pollution

Viruses that have an envelope that makes them resistant to unfavorable environmental conditions last the longest in the air. Virus particles enter the body and multiply in the epithelial cells of the respiratory tract, and some infect other organs [18,33].
Indoor viruses are mainly spread by aerosols exhaled by humans. Infected people release infectious microorganisms by sneezing, coughing, breathing heavily, talking and singing. A cough releases around 3000 droplets, a sneeze 40,000 droplets [34]. Airborne viral diseases include influenza, mumps, measles, rubella, chickenpox and foot-and-mouth disease [18].
The SARS-CoV-2 virus, which triggered the COVID-19 disease pandemic that has been ongoing since 2019, spreads by air [35]. According to the WHO, a total of 519,729,804 people worldwide have contracted COVID-19 disease, of whom 6,268,281 have died (WHO 2022, accessed on 17 May 2022). The SARS-CoV-2 virus develops in the upper respiratory tract of the host and most commonly leads to fever, dry cough and fatigue, less frequently to headaches, diarrhoea, loss of taste and smell [33]. In the era of the COVID-19 pandemic, special attention has been paid to the ventilation of indoor spaces, as inadequate ventilation can cause microbial contamination. In closed, insufficiently ventilated rooms with many people, the risk of infection is highest, while in well-ventilated rooms, exposure to viral aerosols is lower [36,37,38].

2.3.3. Contamination of Indoor Air by Fungal Spores

Filamentous fungi are widespread in the environment and represent the dominant microbiome of indoor air, accounting for an estimated 70% of all airborne microorganisms [27,39].
The source of fungi in indoor air is the mycelium that develops indoors [40], spores and mycelium fragments from outdoor air. They enter indoor spaces with the outdoor air or are carried by humans and animals [26,41,42].
The cause of mould in buildings is moisture in the building envelope, which is caused by technical defects and construction faults (leaking sewers, leaking roofs) but also by poor operation and lack of maintenance [43]. Fungi in buildings with sufficient moisture can grow on almost all natural and synthetic materials [2,44]. They can occur in building and finishing materials: on wallpaper, fiber materials and plasterboard [45,46]. Due to their hygroscopic nature, the plasterboards used for interior walls favor the growth of microscopic fungi. Paper and adhesives used on interior surfaces are good substrates for the growth of most fungi [2]. Indoor furnishings, i.e., potted flowers, carpets, wooden materials, furniture and food, can provide good conditions for fungal growth [42]. Wooden furniture, plywood and modified wood products are susceptible to infestation by filamentous fungi [2,47]. Excellent conditions for mould growth are created in buildings with high humidity and inadequate ventilation, e.g., in the bathroom or kitchen [43]. Ventilation, air conditioning and heating are important factors that influence the presence of microorganisms in the air.
Unclean ventilation ducts and filters can be a site for the multiplication and spread of fungi with their spores [26,48,49,50]. Indoor fungi are an important group of microbial contaminants and can become a risk factor for human health [51]. Frequently occurring fungi in indoor air include the genera Aspergillus, Cladosporium and Penicillium [52].
Assessment of the degree of atmospheric air pollution by fungi is presented in Table 3.

3. Test Methods for Microbial Contamination of Indoor Air

It is not always technically possible to prevent air pollution, so air quality control is an important element of comfort for room users [53].
Measurement methods for microbiological contaminants have evolved since the beginning of the 20th century, and several methods for microbiological air sampling and testing are currently in use [18,54]. Microbiological air testing ensures that air conditioning and ventilation systems are maintained at an appropriate quality level [23].

3.1. Microscopic Methods for Bioaerosol Studies

In the microscopic methods of contamination testing, the air is passed through a membrane filter on which microorganisms are trapped. A slide coated with a viscous substance (e.g., vaseline or gelatine with glycerine) is also used, which is placed in the path of the aspirated air [54,55]. The captured microorganisms are stained with acridine orange and then observed and counted under a microscope. The final result is given as the number of microorganisms per m3 of air.
This method enables the determination of living and dead microorganisms in the air as well as microorganisms that are difficult to grow on culture media. The microscopic examination makes it possible to detect and identify other biological contaminants such as pollen, mites and organic dust (e.g., epidermal fragments). The disadvantage of the microscopic method is that it is not possible to identify the species of microorganisms [18,23].

3.2. Culture-Based Bioaerosol Test Methods

In the culture methods, microorganisms from the air are collected on a medium. After an incubation period at a suitable temperature, the grown colonies are counted.
For bacterial culture, nutrient-rich media are used with the addition of antibiotics to inhibit fungal growth. Agar with maltose extract, agar with glycerol and dichlorane as well as an antibiotic to inhibit the growth of undesirable bacteria are used for the culture, propagation and quantification of fungi [56]. The microorganisms are incubated at a precisely defined temperature and time. Typically, bacteria are incubated at 30–37 °C for 24–48 h culture time; for fungi, it is 20–27 °C and 5–7 days incubation time [56,57]. The measurement result is given in colony-forming units per m3 air (cfu/m3, colony-forming units) [18,23]. The unit cfu/m3 defines the number of cells or cell aggregates of microorganisms that are able to grow on the medium as separate colonies [56]. A colony grown on the medium can be formed from several aggregated cells, so that there may actually be more microorganisms in the air than the result expressed in CFU units [18].
Only between 1 and 10% of the microorganisms present in the air form colonies on microbial media. The rest are Viable But Non-Culturable microorganisms (VBNCs), which cannot be multiplied and cultivated under laboratory conditions. The advantage of the culture method is that the microorganisms can be identified to genus and species. The disadvantage is the long waiting time for the result and the possibility of only identifying cells that are still alive and able to grow on the culture medium [54].
The study of viruses using the culture method differs from other microorganisms in that viruses can only grow in living cells and therefore require tissue cultures or bacterial cultures. Since viruses are not very common, a larger volume of air is required. Once transferred to the culture surface, the collected viruses penetrate the cells, multiply and attack neighboring cells. Gaps, known as plaques, form around the sites of primary infection. The number of viruses detected is given in plaque-forming units (pfu/m3) [18].

3.3. Molecular Methods for Bioaerosol Studies

Molecular methods for detecting the concentration of microorganisms are based on the presence of their genetic material in the air. The polymerase chain reaction (PCR) is most commonly used to determine DNA [54]. The development of the PCR reaction technique in 1983 by Kary Mullis was honoured with the Nobel Prize in Chemistry in 1993 [58].
The discovery of the PCR reaction became the basis for analysing the genetic code sequence of organisms. PCR is an enzymatic reaction in which a selected DNA fragment is replicated in 30–40 cycles. The reaction is catalyzed by polymerase, which is a thermostable enzyme isolated from the microorganisms Thermus aquaticus or Pyrococcus furiosus. The reaction mixture also requires primers whose sequence determines the beginning and end of the fragment to be duplicated, as well as free deoxynucleotides (dNTPs), which are attached to the newly formed DNA strand [59,60]. The matrix in the PCR reaction is DNA isolated from biological material, such as environmental samples or bioaerosols.
Due to the low concentration of microorganisms in the air, nested PCR is used to identify them, in which two reactions are carried out in succession. In the first reaction, a relatively long (1000–1500 base pairs, pz) DNA fragment is amplified, which forms the template for the second reaction after purification. This increases the sensitivity of the method by a factor of up to 10,000 times [60,61].
To determine the number of microorganisms in the air, the technique of quantitative PCR (qPCR, real-time PCR) is used. Fluorescence-labeled oligonucleotides (so-called molecular probes) make it possible to follow the increase in product copy number during the reaction (in real time) [60].
Molecular methods enable both the qualitative and quantitative identification of microorganisms in the air without the need to grow them on culture media, thus speeding up testing procedures. In addition, molecular biological methods are characterised by high sensitivity, reproducibility and safety, as isolation of the living pathogen is not required [60].

3.4. Metabolic Bioaerosol Test Methods

Methods based on the products of their metabolism are also used to quantify microorganisms in the air. Typically, the concentrations of ergosterol, endotoxins, mycotoxins, glucans and fatty acids in the air are determined. Depending on the pathogen under investigation, diagnostic techniques such as high-performance liquid chromatography (HPLC), gas chromatography (GC), thin liquid chromatography (TLC) and UV spectrophotometry are used [56,62].
Methods for assessing the ability of microorganisms to enzymatically degrade organic substrates in the biochemical API series [56] and methods for analysing metabolism in relation to specific carbon sources in the Biolog system are also used to identify bacteria and fungi [63]. Immunological methods using monoclonal or polyclonal antibodies and immunological markers are also used to determine the presence of groups or strains of microorganisms [56].

4. Methods of Air Sampling for Bioaerosol Studies

4.1. Koch Sedimentation Method

The sedimentation method is the oldest and simplest method of air sampling. It involves the free fall (sedimentation) of particles containing microorganisms from the air onto a solidified medium in open Petri dishes [18,54]. After a certain exposure time, which is usually 10–30 min, the plates are incubated, and the colony-forming units (cfu) that have grown are counted. It is assumed that as many microorganisms colonise an area of 100 cm2 in 5 min as are present in 10 dm3 of air. Based on these assumptions, the formula for calculating the number of microorganisms in the air is used:
x = a 5 × 10 4 t π r 2 ,
where x is the number of organisms in the air (cfu/m3), a is the number of cfu grown on the plate, t is the exposure time (min), and r 2 is the area of the plate (cm2).
The sedimentation method is only used to estimate the number of microorganisms in the air due to the shortcomings of the method. Very fine bioaerosol components cannot be detected with this method, as they have a long settling time or do not sediment at all. In addition, air movements in air-conditioned rooms lead to changes in the sedimentation conditions. The advantages of this method are the ease, speed and low cost of the test [23].

4.2. Impactor Method

The impactor method is one of the volumetric air-sampling methods. In this method, bioaerosol is collected by drawing in a known, defined volume of air through an aspirator (impactor), which then strikes a viscous substrate, usually an agar medium. The high impact force causes the particles suspended in the aspirated air to adhere to the medium, which is then incubated, and the organisms that have grown are counted [18]. Commercially available devices used in the collision method include MAS-100 series samplers (from Merck, Darmstadt, Germany), Air IDEAL® 3PTM (from bioMerieux, Marcy l-Etoile, France), SAS series samplers (from PBI International, Milan, Italy) and a selective aerobioscope designed and patented in Poland by the Institute of Rural Medicine in Lublin [54].
The best-known device is the Andersen Cascade Impactor (ACI, from Tisch Environmental, Inc., Cleves, OH, USA). In this device, the aspirated air is passed through six or eight vertically aligned sieves with decreasing hole diameters, under which Petri dishes are located. As a result, the bioaerosol particles with the greatest mass are deposited on the first plate, while the lighter particles, which are lifted by the flowing air, pass through the subsequent sieves. This results in a size-dependent separation of the bioaerosol particles [18]. The advantages of the collision method include the ability to determine the particle size distribution in the sampled air. Furthermore, the collision method is useful for the investigation of viruses that are introduced into cell cultures after they have been washed out of the medium and destroyed by chloroform or other microorganisms.
The disadvantage of the method is the decrease in viability of the microorganisms due to environmental stress upon impact with the medium. Due to the poor drying of the plate and the presence of water droplets, the microorganisms can spill over the plate, making colony counting impossible [23].

4.3. Filter Method (Aspiration)

In the filter method, a certain volume of air is drawn in using a pump (aspirator) and passed through a sterile absorbent. The filtered microorganisms are transferred to a suitable medium, incubated, and the colonies that have grown are counted. Physiological solution (0.85% NaCl) or membrane filters are used [23]. Filtration through liquids is one of the most commonly used methods for air sampling; it is very efficient, practical and has a high survival rate of the sampled microorganisms.
The uptake of bioaerosols using membrane filters is used both in cultures and with microscopic methods to study air pollution. The disadvantage of this technique is its low efficiency, which is due to the resistance of the air when flowing through the fine pores of the filter [18].

4.4. Electroprecipitation Method

The electroprecipitation method is based on the phenomenon that microorganisms have an electrical charge. Petri dishes with a solid medium are connected to a current with a certain voltage so that they act as electrodes and attract microorganisms from the air under investigation. In this way, the number of positively and negatively charged microorganisms in the bioaerosol is determined [19,64].

5. Microbiological Assessment of Air Pollution Control

Microbiological contaminants in the air can pose a risk to occupant health and product purity in food and pharmaceutical companies. Air quality control is required to ensure an appropriate standard. The assessment of air hygiene is based on qualitative and quantitative analyses. Depending on the type of room in which the air is assessed, the permissible values of pollutant concentrations also vary [18].
Qualitative analysis of the hygienic condition of the air is based on the identification of indicator microorganisms, the presence of which indicates the risk of pathogenic microorganisms [18]. Indicator organisms include actinomycetes, Pseudomonas fluorescens, hemolytic staphylococci and mannitol-positive and mannitol-negative staphylococci. The presence of actinomycetes in the air may indicate soil infections as a source of air pollution. In contrast, P. fluorescens bacteria isolated from the air are an indication of the aquatic environment as the source of pollution [18]. Pathogenic staphylococci induce an acidic fermentation of mannitol on Chapman medium, which distinguishes them from non-pathogenic species. In contrast to the non-pathogenic staphylococci, pathogenic staphylococci also show the ability for the complete and incomplete hemolysis of erythrocytes on blood agar due to the action of hemolysins. Hemolysis α (complete) is manifested by the complete translucency of the medium around the bacterial colonies and is an indication of the presence of staphylococci of human origin. Hemolysis β (incomplete) is manifested by a discoloration of the medium and is characteristic of staphylococci isolated from animals [18].
The use of different methods for the collection of bioaerosols and different conditions for the cultivation of microorganisms makes it very difficult to compare the final analytical results of different authors. The reason for this is the lack of standardised regulations (standards, guidelines) in the European Union, according to which the degree of microbiological air pollution can be uniformly assessed [54].

6. Methods for Cleaning Indoor Air

Preventing the formation and emission of pollutants is the most legitimate method of influencing indoor air quality (IAQ). Key methods include ventilation, the removal of pollutant sources (e.g., asbestos), smoking and e-cigarette bans, humidity and temperature control [65,66].
However, it is not always technically feasible to prevent indoor pollution, so effective methods must be used to reduce it. There is a constant search for technology that is capable of cleaning the air of all pollutants, and various methods are therefore being used. Conventional methods are in use: mechanical, physical and chemical. Increasingly, biotechnologies based on the biocatalytic action of bacteria, plants, fungi and microalgae are also being used [53].

6.1. Mechanical Air Purification Methods

Mechanical methods of air purification are mainly based on filtration techniques. Filters use materials that are highly efficient and effective at retaining microbiological contaminants. High-Efficiency Particulate Air (HEPA) filters, which can retain 99.97% of particles with a diameter of ≥0.3 μ m, and Ultra-Low Particulate Air (ULPA) filters, which retain 99.99% of microbiological contaminants with a diameter of ≥0.12 μ m, are used in filter systems [67]. Many devices assume biological treatment with HEPA filters, but there is no clear evidence for the elimination of mould and bacteria. Their assumption is based on the reduction in PM2.5, which is effective against mites.
The standardisation process for HEPA filters is defined in the European standard EN 1822:2009, which deals with classification, performance testing and labeling. The filters are used in rooms with high and very high air purity requirements, e.g., in pharmaceutical plants, laboratories, operating theaters, food processing plants, electronics plants, military facilities and shelters. In addition, HEPA filters are also installed in individual devices, e.g., in laboratory laminar flow chambers, vacuum cleaners and air purifiers [67,68].
The disadvantage of filtration methods is that the filter media must be changed regularly. Living microorganisms on the surface of the filter material multiply in the filter, which reduces filter efficiency and creates an unpleasant odor, and a contaminated filter poses a risk to the people who maintain the filter [67,68].
To minimise the risk to the workers maintaining the filter systems and prolong the efficiency of the filters, changes have been introduced to reduce microbial activity. The filters are soaked with germicidal preparations: iodine and cell membrane-destroying enzymes [69,70]. Modern materials, such as zeolites [71] or polymers [72], are also used as effective particle filters. Recently, indoor air purification devices have come onto the market that use sensors to assess the quality of the air. Artificial intelligence has also attracted a lot of interest recently, so it is not surprising that it is being used in air purifiers, among other things. Devices equipped with this technology are designed to automatically adapt the device settings to the user’s preferences and the air and room conditions. However, the following methods are used to detect microorganisms in the air: microscopic, cultural and combined methods. To perform this type of test, the air must be passed through a membrane filter on which microorganisms colonise. Glass coated with a sticky substance, e.g., Vaseline, is also used here.

6.2. Physical Methods of Air Purification

Physical methods for inactivating microorganisms in the air are mainly based on exposure to high temperatures. To destroy the vegetative microorganisms present in indoor air with low humidity, temperatures of over 200 °C must be applied [73].
The mechanism of inactivation of most microbial contaminants occurs through the denaturation of proteins under the influence of the applied temperature. However, the effectiveness of this process depends on the humidity, the exposure time and the type of microorganisms [67,74].
To achieve the appropriate temperature, electric coils are used that are installed in existing air purification systems in buildings. With this solution, at a temperature of 250 °C, an air flow of 36 L/min and a time of 0.1 to 1 s, 99.99% of bacteriophages are inactivated, and in less than 0.3 s and a temperature of 160 °C, 99.9% of vegetative Escherichia coli cells are killed [75].
The dehumidifiers with bactericidal ultraviolet radiation (UVGI) in combination with different types of filters improve the air temperature in the room by removing moisture and solid particles and limiting the development of mould and bacteria in the room [10]. The most effective configuration was a polyester filter with UV light (PFUV). PFUV effectively inhibited mould growth and caused a 13.3% reduction in relative humidity and a 4.1 °C increase in room temperature without the need for a heating source. The results show great potential for improving air quality in buildings [10].
Another physical method for inactivating microorganisms is air ionisation, which has proven to be highly effective against viruses, bacteria and fungi [76]. This method uses the Multifunction Ion Air Cleaning (MFI) technique, which is based on the effect of ionisation and electrostatic attraction of particles with a diameter of more than 0.003 μ m, and the method has a capacity of 250 m3/h [77]. Due to the large amounts of ozone and electrical charge generated, the use of air ionisation can be harmful to human health [78].
Another physical method for killing microorganisms in the air is the use of ultraviolet germicidal irradiation (UVGI). The effectiveness of the method is influenced by the irradiation dose, exposure time, air movement and humidity [79]. The use of wavelengths of 254 nm in a dose appropriate for the individual species enables the inactivation of 99% of microorganisms in the air and on the surfaces in the room [80].
UV radiation interacts with the DNA of microorganisms, which leads to a distortion of their structure and thus to their inactivation [81]. The technology is an effective method of sterilisation; however, the radiation is harmful to human health. In addition, the non-specific UV radiation can produce undesirable compounds such as ozone or secondary organic pollutants [53,65].
In the cold plasma method, a cloud of highly ionised gas containing positive ions, oxidants and free radicals is generated [65,82]. The generated non-thermal plasma (NTP) removes up to 90 μ g of microorganisms [83] and organic compounds from the air [84]. High humidity reduces the effectiveness of this method [53].
Among the modern physical methods for inactivating bioaerosols, the microwave oxidation system (MOS) is also mentioned. The gases to be purified are introduced into a metal chamber filled with ceramic beads that are heated to a temperature of 1000–1300 °C by microwave radiation [85].

6.3. Chemical Air Purification Methods

Chemicals for air purification are used in the form of aerosols and gases. However, most of them (e.g., ethylene oxide, formaldehyde, propylene oxide) are toxic to humans. During nebulisation, one of the techniques of chemical air purification, a strong air stream is released together with a disinfectant. The nebuliser atomises the disinfectant in the form of 0.5–50 μ m droplets. The small size of the droplets enables penetration into every corner of the room and a longer residence time of the mist in the air. Air disinfection by nebulisation is typically used in hospitals, laboratories, dental practices and outpatient clinics [86].
A modern and safe technique is the use of vaporised hydrogen peroxide (VHP) for sterilisation [87,88]. The hydrogen peroxide method is highly effective against bacteria, viruses, fungi and spores due to its strong oxidising properties. It quickly decomposes into non-toxic products (2 H2O2 O2 + 2 H2O) and therefore has little impact on the human body and the environment. The VHP system enables the sterilisation of air at an atmospheric pressure of 1013 hPa and a temperature of about 20 °C. It is often used in healthcare facilities, laboratories and pharmaceutical plants [89].

6.4. Biological Methods of Air Purification

The low concentration, diversity and variability of pollutants limit the performance of conventional physico-chemical methods for cleaning indoor air. These limitations offer an opportunity for the development of modern systems based on biotechnologies [53]. Biological methods of air purification involve the removal of pollutants through the action of microorganisms or plants for which the pollutants are a source of energy or carbon [68,90]. The biodegradation processes of pollutants mainly involve bacteria, which are present in the form of a biofilm consisting of a layer of cells on the surface of the substrate [91,92]. In microorganisms, the biodegradation of air pollutants is mainly based on the action of oxidative enzymes without the need to use chemicals under indoor conditions (ambient temperature and pressure) [53].
Biological treatment methods are effective, efficient and more economically viable than physico-chemical methods. Biological methods also have the advantage that they can completely biodegrade pollutants under the right conditions. During biological degradation processes, no further pollutants are produced nor do they pass into another (e.g., gaseous) phase [93].
Biological air purification methods are a ‘green alternative’ to conventional physico-chemical methods for improving indoor air quality. Most biological methods for cleaning the air of organic compounds [90] and odorous substances [91] are described in the literature.

6.4.1. Purification Systems Based on Plants and Microalgae

Treatment with plants (phytoremediation) is a common method for the remediation of soil and water contaminated with organic substances such as hydrocarbons. Potted plants are able to clean indoor air from organic compounds [94,95].
Botanical technologies can be divided into passive technologies (e.g., potted plants), where a slow diffusion of gaseous pollutants takes place, and active technologies, where mechanical devices are used to improve the efficiency of the process. Plant-based bio-dry filters (PBTFs) are active biological air purification systems consisting of hydroponic plants in vertical plates [90]. In PBTFs, the airflow is directed through the above-ground parts and roots of the plants to improve the removal of pollutants [96].
Microalgae bind CO2 and release O2 during photosynthesis and are more efficient than plants [92]. Microalgae bioreactors are a solution for environments with elevated CO2 levels, e.g., schools, offices, and shopping centers. In addition, some microalgae species utilise hydrocarbons from the environment as a carbon and energy source [92,97].

6.4.2. Microbial-Based Treatment Systems

Currently, microorganisms are most commonly used in biological air purification processes in biofilter, bioscrubber and trickle bed bioreactor (TBB) systems [90]. A biofilter is a system whose main element is a porous filter material that is colonised by microorganisms. Impurities from the flowing gas are absorbed by the filter layer and then decomposed by the microorganisms. The purified gas leaves the filter chamber [90].
In biofouling, the microorganisms are dispersed in the liquid phase, while impurities from the gas phase flowing in the counter-current diffuse into the spray liquid. The circulation of the liquid with the microorganisms takes place in a closed system that is periodically aerated and regenerated [91,98].
In trickle bioreactors, microorganisms are deposited on a solid filling (e.g., raschig rings, glass beads, ceramic, plastic). Water with nutrient salts flows down the filling, and the contaminated gas flows in a counter-current. The contaminants from the gas diffuse into the biofilm on the solid filling, where they are biodegraded. The adsorption and subsequent degradation of the pollutants take place in a single process chamber [92].

7. Analytical Techniques for the Analysis of Volatile Substances

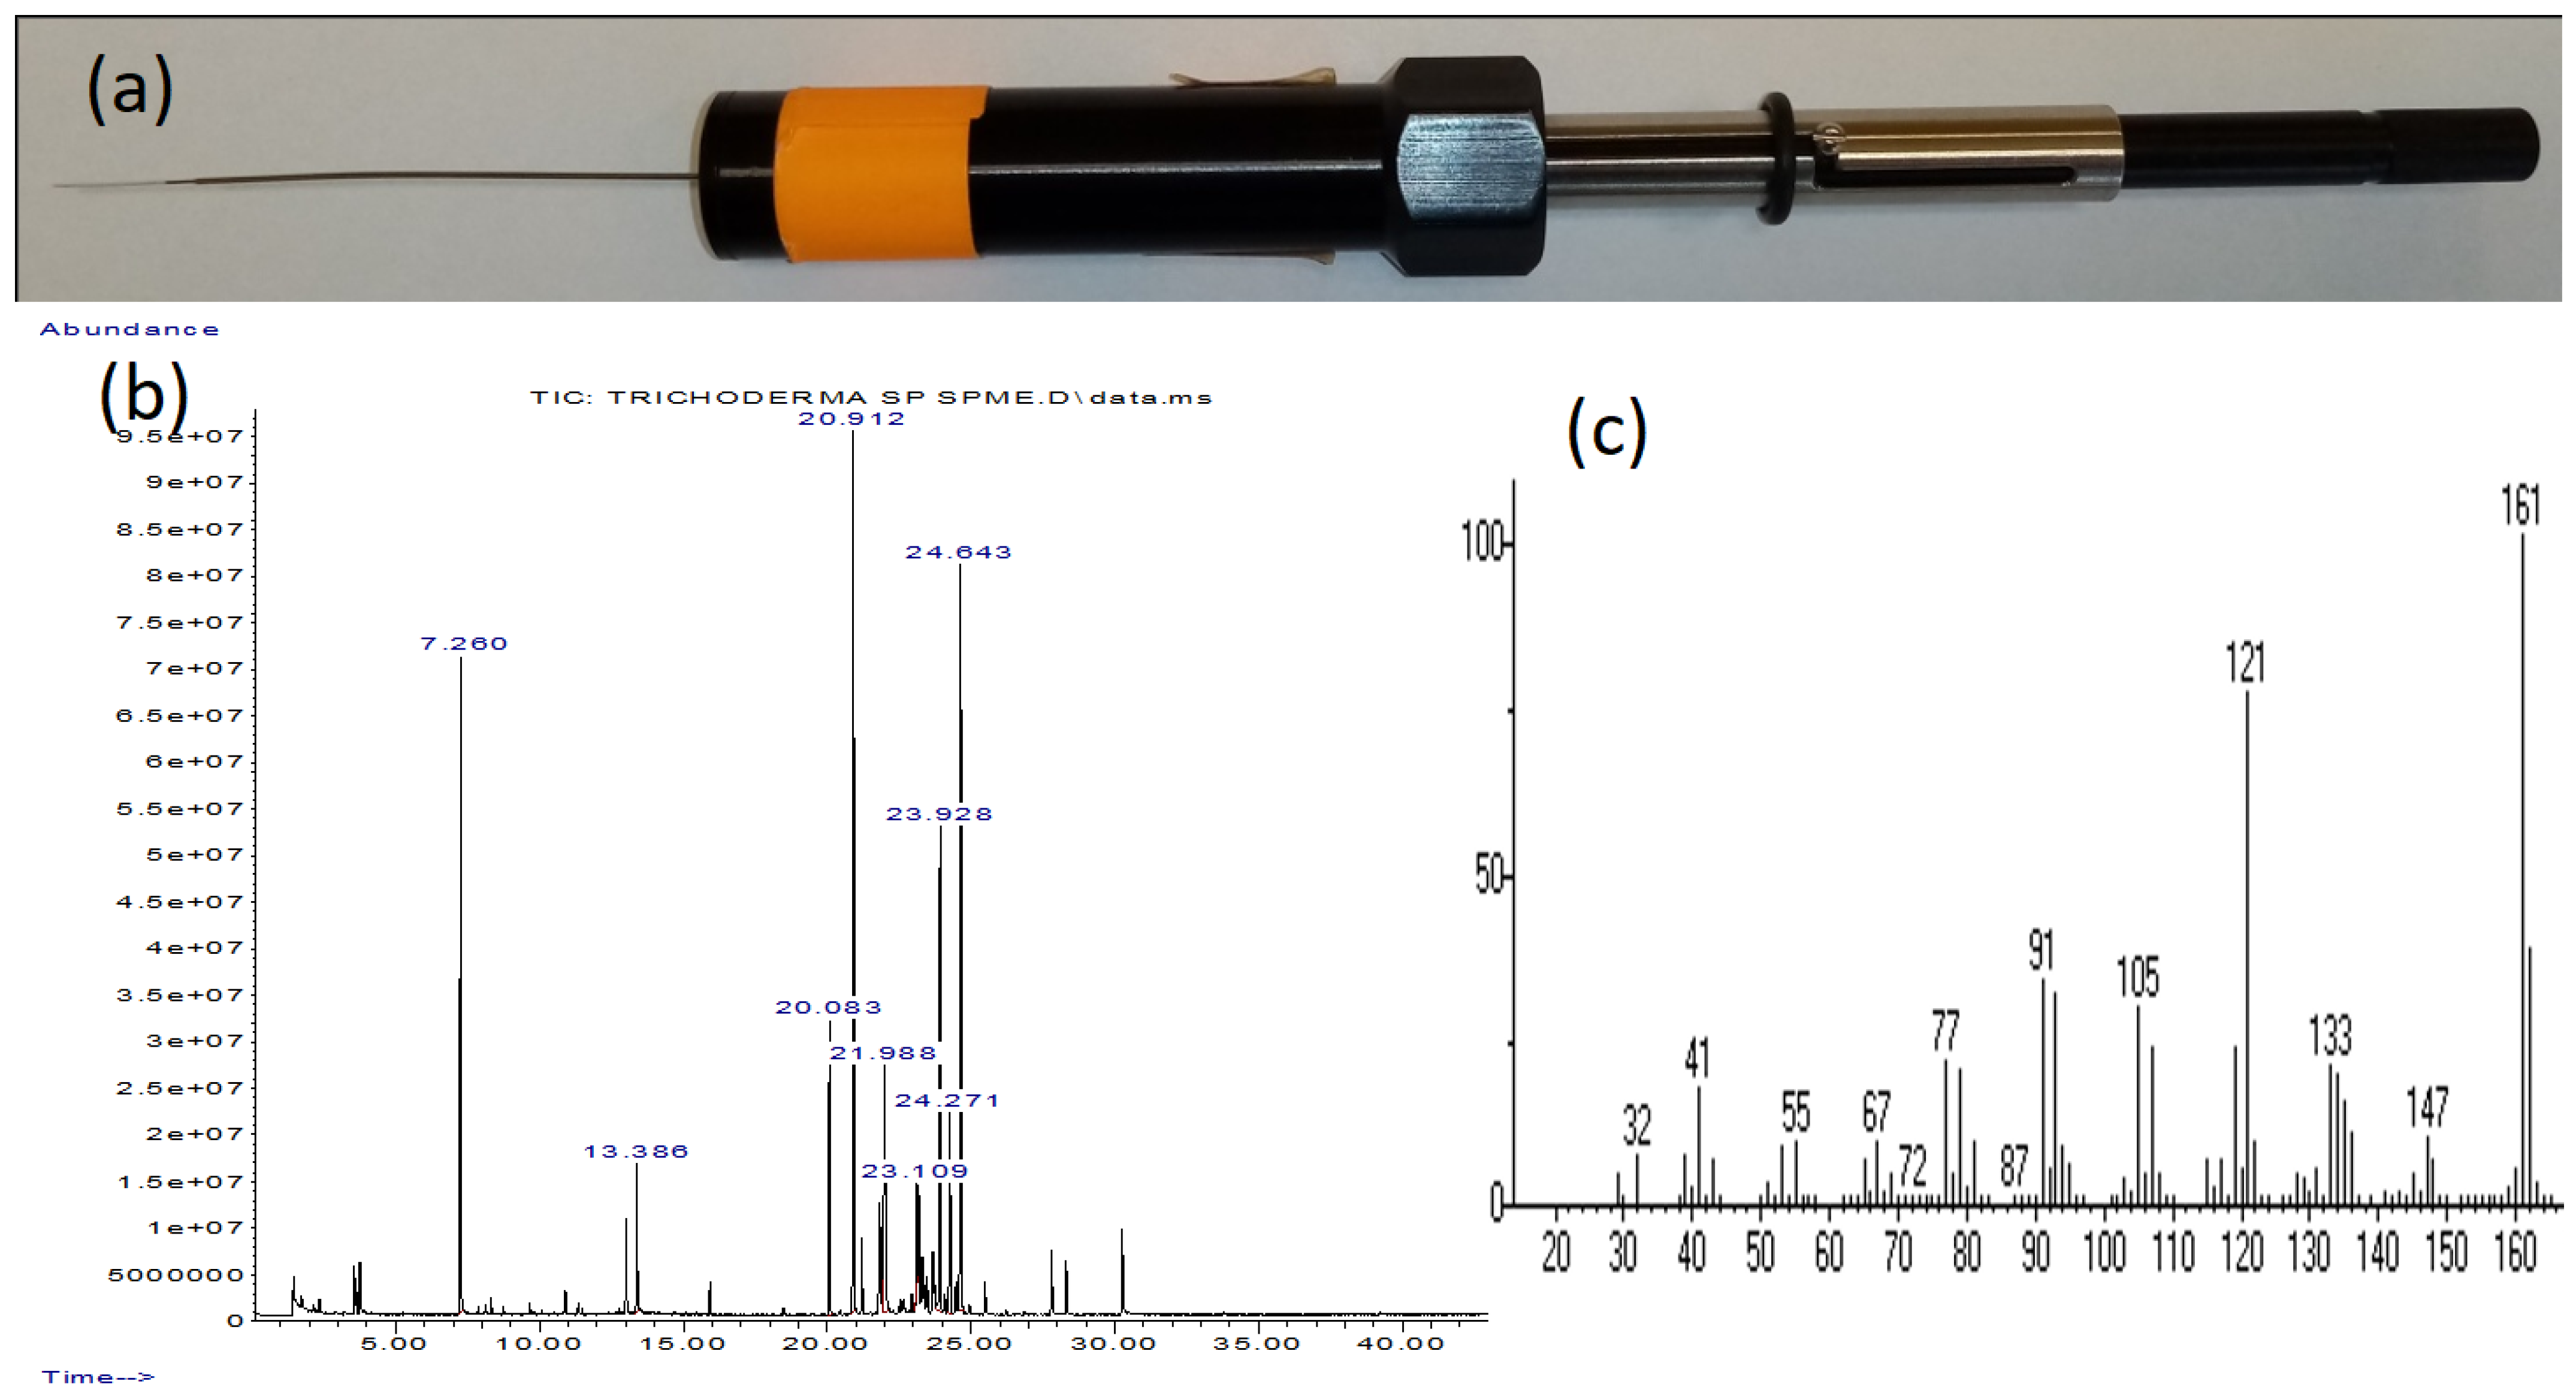
7.1. Stationary Phase Microextraction

Solid phase microextraction (SPME) is a non-exhaustive sample preparation technique in which a small volume of the extraction phase (immobilised on a solid support) is exposed to the sample for a precisely defined period of time. It was invented in the 1990s by Janusz Pawliszyn and his colleagues at the University of Waterloo (Waterloo, ON, Canada). A company called Supelco Analytical licenced the patent granted by Pawliszyn and now sells SPME devices [99,100].
Microextraction into the stationary phase is used to determine compounds in liquid samples and volatile substances in the gas phase above the surface of a liquid or solid sample. In SPME, the volatile compounds are sorbed onto a fiber and then thermally desorbed, e.g., in a gas chromatograph dispenser. The analysis technique in question does not require the use of organic solvents that are harmful to health and the environment and is therefore part of the green chemistry trend being propagated today [100,101,102].
The most important component of the SPME kit is the sorption fiber, whose core consists of quartz glass and is coated with a layer of sorbent: the so-called stationary phase. It is located in a metal needle that protects the brittle fiber from breaking (Figure 1). The fiber and the needle are located in a syringe with a plunger, with which the SPME fiber can be pulled out and retracted into the metal needle.
Commercially available fibers for SPME contain different types of stationary phases and are coated with different thicknesses of these phases. The most commonly used sorption phases are polymers such as polydimethylsiloxane (PDMS), divinylbenzene (DVB) and polyacrylate (PA), which have absorption properties, and activated carbon with adsorption properties, which are known commercially as carboxes or carbowax. Fibers for SPME are available both coated with a homogeneous stationary phase such as PDMS and as a mixture of several different sorption phases such as DVB/CAR/PDMS. The SPME fiber is a consumable component, and about 100 analyses can be performed with one fiber [100,101,102].
To analyse volatile substances with an SPME device, the sample is placed in a sealed container with a membrane through which a metal needle is inserted. The SPME fiber is then expelled from the needle. The volatile compounds that are in the vapor phase above the surface of the sample are sorbed onto the fiber, and this analysis is called Head-Space Solid Phase Microextraction (HS-SPME). After extraction of the volatiles, the fiber is pulled into a protective needle, and the needle is removed from the vessel containing the sample. Immediately afterwards, the needle is inserted into the dispenser of the gas chromatograph (at a temperature of about 250 °C), the fiber is pulled out and the volatile compounds are thermally desorbed so that they can be analysed chromatographically [100,101,102].

7.2. Gas Chromatography

Gas chromatography (GC) was introduced in 1952 by Anthony James and Archer Martin [103]. In the same year, Martin and his colleague Richard Synge were awarded the Nobel Prize in Chemistry for their contribution to chromatography.
Volatile compounds that have a relatively low molecular weight and are non-polar can be analysed using gas chromatography. This analytical technique also allows the analysis of compounds with lower volatility, which must first be derivatised to convert them into more volatile derivatives. Gas chromatography can be used to determine compounds that change to the gaseous state and do not decompose thermally; there is no decomposition of the chemical compound under the influence of temperature [101,104,105].
The sample is added to the GC dispenser in gaseous or liquid form. Liquid samples are also converted into the gas phase under the influence of the high temperature in the dispenser. Volatile substances can also be introduced into the dispenser using a fiber for SPME. There are many types of GC dispensers, and one of the most popular is the split/splitless dispenser. In split mode, the sample is split in the GC dispenser according to a predetermined ratio, e.g., 1:10, and only one tenth of it reaches the chromatography column. In splitless mode, on the other hand, the entire injected sample is transferred to the GC column. The choice of dispenser mode, i.e., split or splitless, depends on the concentration of the compounds to be determined in the sample [101,104,105].
A carrier gas, which forms the mobile phase, flows continuously through the dispenser and then through the chromatography column connected to it. Hydrogen or helium are most commonly used for this purpose. Hydrogen, which can be taken from a cylinder or produced with a generator, is used in gas chromatographs equipped with a flame ionisation detection (FID) unit. In contrast, gas chromatographs coupled to a mass spectrometer usually use high-purity helium, i.e., 99.999% and even 99.9999%, designated 5N and 6N, respectively [101,104,105].
A chromatographic column is used to separate a mixture of compounds into individual compounds. The chromatographic separation results from the different affinity of the compounds for the stationary phase in the chromatography column. Chemical compounds that have a lower affinity for the stationary phase used to be eluted from the chromatography column. Nowadays, packed columns are rarely used in gas chromatography, and capillary columns, where the sorbent is deposited on the inner wall of the column, are much more common. In recent decades, three generations of capillary columns have appeared in succession, which are designated by abbreviations derived from the English language:
(a)
Wall-coated open-tebular (WCOT) column—the inner wall of the column is coated with a sorption layer;
(b)
Porous-layer open-tebular (PLOT) column—column with porous adsorbent;
(c)
Support-coated open-tebular (SCOT) column—column in which a liquid polymer layer, characterised by a high density, is applied to the surface of the adsorbent and which is the most commonly used column of this type today.
The most versatile applications are columns with a non-polar stationary phase, e.g., 100%-dimethylpolysiloxane, or a medium-polar stationary phase, e.g., 5%-phenyl-95%-dimethylpolysiloxane. Columns with polar stationary phases are used much less frequently. Typical GC columns have a length of 10 to 60 m, an inner diameter of 0.10 to 0.53 mm and a stationary phase thickness of 0.1 to 3.0 μ m. The GC column is installed in a chromatography oven. The chromatographic separation of the compounds can be carried out at a constant temperature (isotherm) or with the aid of a temperature programme, whereby the temperature increases during the analysis.
After passing through the chromatographic column, the compounds are transferred via a transfer line to a detector, e.g., a mass spectrometer [101,104,105].

7.3. Mass Spectrometry

Mass spectrometry (MS) is an analytical method for identifying a chemical compound based on the resulting mass spectrum. A chemical compound introduced into the mass spectrometer is ionised under the influence of physical or chemical agents. Several types of ionisation are known, but electron ionisation (EI) is the most commonly used because it is the most versatile. In EI, a chemical compound is ionised by bombardment with an electron beam emitted from an ion source. A molecular ion (M+) is formed, which can be broken down into smaller fragments, which are known as fragment ions. The resulting ions are then passed to an ion analyser. Several types of analysers are known, the most commonly used being the quadrupole mass filter (QMF), the quadrupole ion trap (QIT) or the time-of-flight analyser (TOF).
The most widely used mass analyser is the QMF, as it has a wide range of applications and a relatively low price compared to other types of analysers. The principle of the quadrupole analyser is to selectively pass ions with a precisely defined ratio of mass (m) to charge (z), which is abbreviated as m/z. The analyser can sequentially pass ions with m/z within the specified range (e.g., m/z in the range 29–600)—the mass spectrometer scanning mode or only one ion with a fixed mass-to-charge ratio (e.g., m/z = 100)—Selected Ion Monitoring (SIM) mode. After passing through the quadrupole mass analyser, the individual ions are counted using electronic devices, and the signal recorded by the mass spectrometer is called the ion current. The resulting signal is sent to a computer so that the results obtained can be analysed using special computer software [101,106,107].

7.4. Analysis of Chromatograms and Mass Spectra Obtained by the Gas Chromatography-Mass Spectrometry Technique

Gas chromatography with mass spectrometry (GC-MS) is one of the most commonly used analytical techniques today. In contrast to LC-MS, GC-MS technology has extensive databases of compounds that enable the automatic identification of the analytes by the device. The mass detector is a universal detector that is more sensitive than the FID but also much more expensive to purchase and operate. In the laboratory, GC-MS can be used to detect volatile substances, analyse environmental samples and identify unknown samples. This is due to the diverse applications of this research method in many areas of life, including environmental protection, pharmacy and medicine, as well as in the food, petroleum or perfume industries [108,109,110].
The result of analysing a mixture of volatile compounds by GC-MS is a chromatograph with numerous peaks. Each peak usually corresponds to a chemical compound. Compounds of similar volatility that cannot be sufficiently separated chromatographically can also form a single peak. The horizontal axis of the chromatogram shows the retention time of the chemical, i.e., the time it takes for the compound to pass through the GC column. The vertical axis of the chromatogram, on the other hand, shows the frequency (abundance) resulting from the content of the chemical compound in the sample, so that the peak height or area is used to quantify the compound [108,109,110].
GC-MS analysis makes it possible to identify the chemical compounds that make up a sample. Each peak appearing in the chromatogram is assigned its own mass spectrum. In electron ionisation (EI) spectrometers, the mass spectrum is usually recorded under standardised analysis conditions, i.e., with an ionisation energy of 70 eV and ion source and quadrupole temperatures of 230 °C and 150 °C, respectively. The use of standardised conditions for spectral analysis leads to a reproducible mass spectrum.
The use of electron ionisation usually leads to a strong fragmentation of the chemical compound. In addition to the molecular ion, numerous fragmentation ions are formed. These ions are compound-specific, and therefore, the mass spectrum of a particular compound is unique [108,109,110].
By comparing the mass spectrum of an experiment with mass spectra in available databases, it is possible to identify a chemical compound, i.e., to indicate its chemical structure. However, it is important to have access to extensive databases, such as the mass spectra libraries of NIST (2022) or Wiley (2022), which contain mass spectra of hundreds of thousands of different chemical compounds. The GC-MS method has the advantage that it can identify chemical compounds without having their standards available. However, due to the limited resources of mass spectral libraries, it is not always possible to accurately identify a compound. In such cases, the identification of the individual components provides valuable information about the chemical composition of the sample under investigation, even if only at the level of a group of compounds and, if possible, by providing the molecular formulas of the compounds to be determined [108,109,110].
In addition to the mass spectrum, the GC-MS method often uses a second parameter, the retention index, to identify compounds. The retention index values of the analysed compounds are usually determined taking into account the retention times of the n-alkanes. It is important to compare the experimental retention indices and those given in the literature, which are determined on columns with an identical stationary phase, e.g., 5%-phenyl-95%-dimethylpolysiloxane [108,109,110].

8. Summary

The main objective of this entry is to verify the chemical, physical and microbiological status of indoor air pollutants. Known methods for testing indoor air quality using molecular biological methods are described as well as the advantages and disadvantages of methods for cleaning indoor air (physical, chemical and biological). Methods for counting mould spores in surgical hospitals, classrooms and homes are also presented.
Indoor environmental quality assessment addresses substandard, overcrowded buildings that jeopardise health safety through microbial air pollution. Sustainable technologies to improve indoor air quality are also presented. The entry defines indoor air pollutants and describes sampling and analysis methods, focussing on the investigation of biological air pollutants.

Author Contributions

Conceptualisation, A.B. and T.O.; methodology, N.S., A.B. and T.O.; software, M.S.; validation, N.S., T.O. and M.S.; formal analysis, N.S. and M.S.; investigation, N.S.; resources, N.S., A.B. and T.O.; data curation, N.S.; writing—original draft preparation, N.S.; writing—review and editing, T.O. and P.B.; visualisation, N.S. and M.S.; supervision, A.B. and T.O.; project administration, T.O.; funding acquisition, A.B. and M.S. All authors have read and agreed to the published version of the manuscript.

Funding

This research received no external funding.

Data Availability Statement

Not applicable.

Conflicts of Interest

The authors declare no conflicts of interest.

References

  1. World Health Organization. WHO Global Air Quality Guidelines: Particulate Matter (PM2.5 and PM10), Ozone, Nitrogen Dioxide, Sulfur Dioxide and Carbon Monoxide; World Health Organization: Geneva, Switzerland, 2021. [Google Scholar]
  2. Khan, A.H.; Karuppayil, S.M. Fungal pollution of indoor environments and its management. Saudi J. Biol. Sci. 2012, 19, 405–426. [Google Scholar] [CrossRef] [PubMed]
  3. Guo, H.; Lee, S.; Chan, L. Indoor air quality investigation at air-conditioned and non-air-conditioned markets in Hong Kong. Sci. Total Environ. 2004, 323, 87–98. [Google Scholar] [CrossRef] [PubMed]
  4. Mannan, M.; Al-Ghamdi, S.G. Indoor air quality in buildings: A comprehensive review on the factors influencing air pollution in residential and commercial structure. Int. J. Environ. Res. Public Health 2021, 18, 3276. [Google Scholar] [CrossRef]
  5. Yang, W.; Sohn, J.; Kim, J.; Son, B.; Park, J. Indoor air quality investigation according to age of the school buildings in Korea. J. Environ. Manag. 2009, 90, 348–354. [Google Scholar] [CrossRef] [PubMed]
  6. Butarewicz, A. Mikrobiologiczna jakosc powietrza w budynku Wydzialu Budownictwa i Inzynierii Srodowiska Politechniki Bialostockiej. Rocz. Państwowego Zakładu Hig. 2005, 2, 199–206. [Google Scholar]
  7. Baek, S. Assessing indoor air quality. In Encyclopedia of Environmental Health; Elsevier: Oxford, UK, 2019; pp. 191–198. [Google Scholar]
  8. Al-Rawi, M.; Lazonby, A.; Wai, A.A. Assessing Indoor Environmental Quality in a Crowded Low-Quality Built Environment: A Case Study. Atmosphere 2022, 13, 1703. [Google Scholar] [CrossRef]
  9. Gradisnik, L.; Bunc, G.; Ravnik, J.; Velnar, T. Enhancing Surgical Safety: Microbiological Air Control in Operating Theatres at University Medical Centre Maribor. Diagnostics 2024, 14, 1054. [Google Scholar] [CrossRef] [PubMed]
  10. Al-Rawi, M.; Ikutegbe, C.A.; Auckaili, A.; Farid, M.M. Sustainable technologies to improve indoor air quality in a residential house—A case study in Waikato, New Zealand. Energy Build. 2021, 250, 111283. [Google Scholar] [CrossRef]
  11. Zhang, J.; Smith, K.R. Indoor air pollution: A global health concern. Br. Med Bull. 2003, 68, 209–225. [Google Scholar] [CrossRef]
  12. Guo, H. Source apportionment of volatile organic compounds in Hong Kong homes. Build. Environ. 2011, 46, 2280–2286. [Google Scholar] [CrossRef]
  13. McDonnell, G.; Burke, P. Disinfection: Is it time to reconsider Spaulding? J. Hosp. Infect. 2011, 78, 163–170. [Google Scholar] [CrossRef] [PubMed]
  14. Li, D.W.; Yang, C.S. Fungal contamination as a major contributor to sick building syndrome. Adv. Appl. Microbiol. 2004, 55, 31–112. [Google Scholar] [PubMed]
  15. Siemiński, M. Środowiskowe Zagrożenia Zdrowia; Wydawnictwo Naukowe PWN: Warszawa, Poland, 2008. [Google Scholar]
  16. Harazin, B.; Zielińnski, G. Zawodowa Ekspozycja na Miejscowe Wibracje w Polsce. Med. Pr. 2004, 55, 465–472. (In Polish) [Google Scholar]
  17. An, H.; Mainelis, G.; Yao, M. Evaluation of a high-volume portable bioaerosol sampler in laboratory and field environments. Indoor Air 2004, 14, 385–393. [Google Scholar] [CrossRef] [PubMed]
  18. Kołwzan, B.; Adamiak, W.; Grabas, K.; Pawełczyk, A. Podstawy Mikrobiologii w Ochronie Środowiska; Oficyna Wydawnicza Politechniki Wrocławskiej: Wrocław, Poland, 2005. (In Polish) [Google Scholar]
  19. Krzysztofik, B. Mikrobiologia Powietrza; Wydawnictwo Politechiki Warszawskiej: Warszawa, Poland, 1992. [Google Scholar]
  20. Górny, R. Biologiczne czynniki szkodliwe: Normy, zalecenia i propozycje wartości dopuszczalnych. Podstawy I Metod. Oceny Środowiska Pr. 2004, 3, 17–39. (In Polish) [Google Scholar]
  21. Law, A.K.; Chau, C.K.; Chan, G.Y. Characteristics of bioaerosol profile in office buildings in Hong Kong. Build. Environ. 2001, 36, 527–541. [Google Scholar] [CrossRef]
  22. Agranovski, I.E.; Agranovski, V.; Reponen, T.; Willeke, K.; Grinshpun, S.A. Development and evaluation of a new personal sampler for culturable airborne microorganisms. Atmos. Environ. 2002, 36, 889–898. [Google Scholar] [CrossRef]
  23. Kaiser, K.; Wolski, A. Kontrola czystości mikrobiologicznej powietrza. Tech. Chłodnicza I Klimatyzacyjna 2007, 4, 158–162. (In Polish) [Google Scholar]
  24. Cabral, J.P. Can we use indoor fungi as bioindicators of indoor air quality? Historical perspectives and open questions. Sci. Total Environ. 2010, 408, 4285–4295. [Google Scholar] [CrossRef]
  25. Krzyśko-upicka, T. Przegląd metod stosowanych wykrywania grzybów w pomieszczeniach. In Proceedings of the Materiały Konferencyjne, VI Międzynarodowa Konferencja Naukowa–Mikotoksyny w Środowisku Człowieka i Zwierząt, Bydgoszcz, Poland, 25–27 September 2002; pp. 203–205. (In Polish). [Google Scholar]
  26. Ogórek, R.; Pląskowska, E. Analiza mikologiczna powietrza wybranych pomieszczeń użytku publicznego. Doniesienie wstępne. Med Mycol. 2011, 18, 24. (In Polish) [Google Scholar]
  27. Chmiel, M.; Frączek, K.; Grzyb, J. Problemy monitoringu zanieczyszczeń mikrobiologicznych powietrza. Woda-Środowisko Wiej. 2015, 15, 17–27. (In Polish) [Google Scholar]
  28. Sadigh, A.; Fataei, E.; Arzanloo, M.; Imani, A.A. Bacteria bioaerosol in the indoor air of educational microenvironments: Measuring exposures and assessing health effects. J. Environ. Health Sci. Eng. 2021, 19, 1635–1642. [Google Scholar] [CrossRef] [PubMed]
  29. Franck, U.; Herbarth, O.; Röder, S.; Schlink, U.; Borte, M.; Diez, U.; Krämer, U.; Lehmann, I. Respiratory effects of indoor particles in young children are size dependent. Sci. Total Environ. 2011, 409, 1621–1631. [Google Scholar] [CrossRef]
  30. Brickus, L.S.; Siqueira, L.F.; de Aquino Neto, F.R.; Cardoso, J.N. Occurrence of airborne bacteria and fungi in bayside offices in Rio de Janeiro, Brazil. Indoor Built Environ. 1998, 7, 270–275. [Google Scholar] [CrossRef]
  31. Gołofit-Szymczak, M.; Skowroń, J. Zagrożenia mikrobiologiczne w pomieszczeniach biurowych. Bezpieczeństwo Pr. Nauka Prakt. 2005, 3, 29–31. (In Polish) [Google Scholar]
  32. Stojek, N. Zagrożenie bakteriami z rodzaju Legionella w środowisku pracy. Podstawy I Metod. Oceny Środowiska Pr. 2004, 3, 61–67. (In Polish) [Google Scholar]
  33. Abouelela, M.E.; Assaf, H.K.; Abdelhamid, R.A.; Elkhyat, E.S.; Sayed, A.M.; Oszako, T.; Belbahri, L.; El Zowalaty, A.E.; Abdelkader, M.S.A. Identification of potential SARS-CoV-2 main protease and spike protein inhibitors from the genus aloe: An in silico study for drug development. Molecules 2021, 26, 1767. [Google Scholar] [CrossRef] [PubMed]
  34. Vlaskin, M.S. Review of air disinfection approaches and proposal for thermal inactivation of airborne viruses as a life-style and an instrument to fight pandemics. Appl. Therm. Eng. 2022, 202, 117855. [Google Scholar] [CrossRef] [PubMed]
  35. Zhu, N.; Zhang, D.; Wang, W.; Li, X.; Yang, B.; Song, J.; Zhao, X.; Huang, B.; Shi, W.; Lu, R.; et al. A novel coronavirus from patients with pneumonia in China, 2019. N. Engl. J. Med. 2020, 382, 727–733. [Google Scholar] [CrossRef]
  36. Elias, B.; Bar-Yam, Y. Could air filtration reduce COVID-19 severity and spread. N. Engl. Complex Syst. Inst. 2020, 9, 1–4. [Google Scholar]
  37. Ryńska, J. Filtracja i Oczyszczanie Powietrza z Pyłów Zawieszonych i Wirusów. Rynek Instal. 2021, 11, 45–48. (In Polish) [Google Scholar]
  38. Fan, M.; Fu, Z.; Wang, J.; Wang, Z.; Suo, H.; Kong, X.; Li, H. A review of different ventilation modes on thermal comfort, air quality and virus spread control. Build. Environ. 2022, 212, 108831. [Google Scholar] [CrossRef]
  39. Libudzisz, Z.; Kowal, K.; Żakowska, Z. Mikrobiologia Techniczna. T. 1, Mikroorganizmy i Środowiska ich Występowania; Wydawnictwo Naukowe PWN: Warszawa, Poland, 2007. (In Polish) [Google Scholar]
  40. Leslie, J.F.; Summerell, B.A. The Fusarium Laboratory Manual; John Wiley & Sons: Hoboken, NJ, USA, 2008. [Google Scholar]
  41. Meklin, T.; Reponen, T.; Toivola, M.; Koponen, V.; Husman, T.; Hyvärinen, A.; Nevalainen, A. Size distributions of airborne microbes in moisture-damaged and reference school buildings of two construction types. Atmos. Environ. 2002, 36, 6031–6039. [Google Scholar] [CrossRef]
  42. Jo, W.K.; Kang, J.H. Workplace exposure to bioaerosols in pet shops, pet clinics, and flower gardens. Chemosphere 2006, 65, 1755–1761. [Google Scholar] [CrossRef] [PubMed]
  43. Piontek, M. Występowanie Grzybów Pleśniowych w Budownictwie Mieszkaniowym; Oficyna Wydawnicza Uniwersytetu Zielonogórskiego: Zielona Góra, Poland, 1998. (In Polish) [Google Scholar]
  44. Samet, J.M.; Spengler, J.D. Indoor environments and health: Moving into the 21st century. Am. J. Public Health 2003, 93, 1489–1493. [Google Scholar] [CrossRef] [PubMed]
  45. Maus, R.; Goppelsröder, A.; Umhauer, H. Survival of bacterial and mold spores in air filter media. Atmos. Environ. 2001, 35, 105–113. [Google Scholar] [CrossRef]
  46. Sivasubramani, S.K.; Niemeier, R.T.; Reponen, T.; Grinshpun, S.A. Fungal spore source strength tester: Laboratory evaluation of a new concept. Sci. Total Environ. 2004, 329, 75–86. [Google Scholar] [CrossRef]
  47. Doherty, W.O.; Mousavioun, P.; Fellows, C.M. Value-adding to cellulosic ethanol: Lignin polymers. Ind. Crop. Prod. 2011, 33, 259–276. [Google Scholar] [CrossRef]
  48. Bonetta, S.; Bonetta, S.; Mosso, S.; Sampò, S.; Carraro, E. Assessment of microbiological indoor air quality in an Italian office building equipped with an HVAC system. Environ. Monit. Assess. 2010, 161, 473–483. [Google Scholar] [CrossRef]
  49. Li, A.; Liu, Z.; Zhu, X.; Liu, Y.; Wang, Q. The effect of air-conditioning parameters and deposition dust on microbial growth in supply air ducts. Energy Build. 2010, 42, 449–454. [Google Scholar] [CrossRef]
  50. Noris, F.; Siegel, J.A.; Kinney, K.A. Evaluation of HVAC filters as a sampling mechanism for indoor microbial communities. Atmos. Environ. 2011, 45, 338–346. [Google Scholar] [CrossRef]
  51. Fan, G.; Xie, J.; Yoshino, H.; Yanagi, U.; Zhang, H.; Li, Z.; Li, N.; Lv, Y.; Liu, J.; Zhu, S.; et al. Investigation of fungal contamination in urban houses with children in six major Chinese cities: Genus and concentration characteristics. Build. Environ. 2021, 205, 108229. [Google Scholar] [CrossRef]
  52. Nabrdalik, M.; Latala, A. Wystepowanie grzybów strzepkowych w obiektach budowlanych. Rocz. Państwowego Zakładu Hig. 2003, 1, 119–127. (In Polish) [Google Scholar]
  53. Gonzalez-Martin, J.; Kraakman, N.J.R.; Perez, C.; Lebrero, R.; Munoz, R. A state–of–the-art review on indoor air pollution and strategies for indoor air pollution control. Chemosphere 2021, 262, 128376. [Google Scholar] [CrossRef] [PubMed]
  54. Michałkiewicz, M. Metody Badań Mikrobiologicznego Zanieczyszczenia Powietrza na Terenach Oczyszczalni ścieków - Przegląd Literaturowy. Kosmos 2019, 68, 475–487. (In Polish) [Google Scholar] [CrossRef]
  55. Patentalakis, N.; Pantidou, A.; Kalogerakis, N. Determination of enterobacteria in air and wastewater samples from a wastewater treatment plant by epi-fluorescence microscopy. Water Air Soil Pollut. Focus 2008, 8, 107–115. [Google Scholar] [CrossRef]
  56. Gołofit-Szymczak, M.; awniczek-Wałczyk, A.; Górny, R.L. Ilościowa i jakościowa kontrola szkodliwych czynników biologicznych w środowisku pracy. Podstawy Metod. Oceny Środowiska Pr. 2013, 2, 5–17. (In Polish) [Google Scholar] [CrossRef]
  57. Dutkiewicz, J. Bacteria and fungi in organic dust as potential health hazard. Ann. Agric. Environ. Med. 1997, 4, 11–16. [Google Scholar]
  58. Shampo, M.A.; Kyle, R.A. Kary B. Mullis—Nobel Laureate for procedure to replicate DNA. In Mayo Clinic Proceedings; Elsevier: Amsterdam, The Netherlands, 2002; Volume 77, p. 606. [Google Scholar]
  59. Mullis, K.B.; Faloona, F.A. Specific synthesis of DNA in vitro via a polymerase-catalyzed chain reaction. In Methods in Enzymology; Elsevier: Amsterdam, The Netherlands, 1987; Volume 155, pp. 335–350. [Google Scholar]
  60. Bakal, A.; Górny, R.; Ławniczek-Wałczyk, A.; Cyprowski, M. Zastosowanie metod biologii molekularnej w ocenie narażenia zawodowego na szkodliwe czynniki biologiczne. Podstawy Metod. Oceny Środowiska Pr. 2017, 3, 5–16. (In Polish) [Google Scholar] [CrossRef]
  61. Stärk, K.D.; Nicolet, J.; Frey, J. Detection of Mycoplasma hyopneumoniae by air sampling with a nested PCR assay. Appl. Environ. Microbiol. 1998, 64, 543–548. [Google Scholar] [CrossRef]
  62. Gutarowska, B. Przegląd metod oceny zanieczyszczenia mikrobiologicznego powietrza. In Problemy jakości powietrza wewnętrznego w Polsce; Wyd. Inst. Ogrzew. Went. Politech. Warsz.: Warszawa, Poland, 2002; pp. 93–102. (In Polish) [Google Scholar]
  63. Frac, M. Ocena Mikologiczna osadu z Oczyszczalni ścieków Mleczarskich oraz jego wpływ na różnorodność funkcjonalną Mikroorganizmów Glebowych; Instytut Agrofizyki im. Bohdana Dobrzańskiego, Polska Akademia Nauk: Lublin, Poland, 2012; Volume 1. (In Polish) [Google Scholar]
  64. Krajewska-Kułak, E.; Gniadek, A.; Łukaszuk, C.R.; Macura, A.B.; Kułak, W. Wstępne porównanie wyników badań zanieczyszczenia powietrza grzybami z wykorzystaniem aparatu SAS SUPER 100 i MAS 100. Doniesienie wstępne. Med. Mycol./Mikol. 2009, 16, 221–227. (In Polish) [Google Scholar]
  65. Luengas, A.; Barona, A.; Hort, C.; Gallastegui, G.; Platel, V.; Elias, A. A review of indoor air treatment technologies. Rev. Environ. Sci. Bio/Technol. 2015, 14, 499–522. [Google Scholar] [CrossRef]
  66. Chenari, B.; Carrilho, J.D.; da Silva, M.G. Towards sustainable, energy-efficient and healthy ventilation strategies in buildings: A review. Renew. Sustain. Energy Rev. 2016, 59, 1426–1447. [Google Scholar] [CrossRef]
  67. Lewandowski, R.; Jóźwik, P. Aktualne techniki oczyszczania powietrza z czynników biologicznych. Hygeia Public Health 2017, 52, 103–110. (In Polish) [Google Scholar]
  68. Guieysse, B.; Hort, C.; Platel, V.; Munoz, R.; Ondarts, M.; Revah, S. Biological treatment of indoor air for VOC removal: Potential and challenges. Biotechnol. Adv. 2008, 26, 398–410. [Google Scholar] [CrossRef] [PubMed]
  69. Lee, T.; Park, D.; Kim, K.; Lim, S.M.; Yu, N.H.; Kim, S.; Kim, H.Y.; Jung, K.S.; Jang, J.Y.; Park, J.C.; et al. Characterization of Bacillus amyloliquefaciens DA12 showing potent antifungal activity against mycotoxigenic Fusarium species. Plant Pathol. J. 2017, 33, 499. [Google Scholar] [CrossRef] [PubMed]
  70. Prussin, A.J.; Marr, L.C. Sources of airborne microorganisms in the built environment. Microbiome 2015, 3, 1–10. [Google Scholar] [CrossRef] [PubMed]
  71. Zhu, L.; Lv, X.; Tong, S.; Zhang, T.; Song, Y.; Wang, Y.; Hao, Z.; Huang, C.; Xia, D. Modification of zeolite by metal and adsorption desulfurization of organic sulfide in natural gas. J. Nat. Gas Sci. Eng. 2019, 69, 102941. [Google Scholar] [CrossRef]
  72. Tang, X.; Wei, J.; Kong, Z.; Zhang, H.; Tian, J. Introduction of amino and rGO into PP nonwoven surface for removal of gaseous aromatic pollutants and particulate matter from air. Appl. Surf. Sci. 2020, 511, 145631. [Google Scholar] [CrossRef]
  73. Grinshpun, S.; Adhikari, A.; Li, C.; Reponen, T.; Yermakov, M.; Schoenitz, M.; Dreizin, E.; Trunov, M.; Mohan, S. Thermal inactivation of airborne viable Bacillus subtilis spores by short-term exposure in axially heated air flow. J. Aerosol Sci. 2010, 41, 352–363. [Google Scholar] [CrossRef]
  74. Coleman, W.H.; Chen, D.; Li, Y.q.; Cowan, A.E.; Setlow, P. How moist heat kills spores of Bacillus subtilis. J. Bacteriol. 2007, 189, 8458–8466. [Google Scholar] [CrossRef] [PubMed]
  75. Jung, J.H.; Lee, J.E.; Kim, S.S. Thermal effects on bacterial bioaerosols in continuous air flow. Sci. Total Environ. 2009, 407, 4723–4730. [Google Scholar] [CrossRef] [PubMed]
  76. Kim, Y.S.; Yoon, K.Y.; Park, J.H.; Hwang, J. Application of air ions for bacterial de-colonization in air filters contaminated by aerosolized bacteria. Sci. Total Environ. 2011, 409, 748–755. [Google Scholar] [CrossRef] [PubMed]
  77. Kałużny, J.; Muszyński, Z.; Kałużny, B. Ophthalmic operating theatre–chance of limiting contamination and infection risk. Part I. Decontamination of the microbial air pollution. Klin. Oczna/Acta Ophthalmol. Pol. 2008, 110, 102–107. [Google Scholar]
  78. Huang, R.; Agranovski, I.; Pyankov, O.; Grinshpun, S. Removal of viable bioaerosol particles with a low-efficiency HVAC filter enhanced by continuous emission of unipolar air ions. Indoor Air 2008, 18, 106–112. [Google Scholar] [CrossRef] [PubMed]
  79. Reed, N.G. The history of ultraviolet germicidal irradiation for air disinfection. Public Health Rep. 2010, 125, 15–27. [Google Scholar] [CrossRef] [PubMed]
  80. Kesavan, J.; Schepers, D.; Bottiger, J.; Edmonds, J. UV-C decontamination of aerosolized and surface-bound single spores and bioclusters. Aerosol Sci. Technol. 2014, 48, 450–457. [Google Scholar] [CrossRef]
  81. Małecka, I.; Borowski, G. Dezynfekcja powietrza promieniami UV i promieniową jonizacją katalityczną w instalacjach wentylacyjnych. Zesz. Nauk. Inżynieria Lądowa Wodna Kształtowaniu Środowiska 2011, 3, 25–30. (In Polish) [Google Scholar]
  82. Vaze, N.D.; Gallagher, M.J.; Park, S.; Fridman, G.; Vasilets, V.N.; Gutsol, A.F.; Anandan, S.; Friedman, G.; Fridman, A.A. Inactivation of bacteria in flight by direct exposure to nonthermal plasma. IEEE Trans. Plasma Sci. 2010, 38, 3234–3240. [Google Scholar] [CrossRef]
  83. Liang, Y.; Wu, Y.; Sun, K.; Chen, Q.; Shen, F.; Zhang, J.; Yao, M.; Zhu, T.; Fang, J. Rapid inactivation of biological species in the air using atmospheric pressure nonthermal plasma. Environ. Sci. Technol. 2012, 46, 3360–3368. [Google Scholar] [CrossRef]
  84. Chen, W.; Zhang, J.S.; Zhang, Z. Performance of air cleaners for removing multiple volatile organic compounds in indoor air. ASHRAE Trans. 2005, 111, 1101–1114. [Google Scholar]
  85. Iordache, D.; Niculae, D. Microwave thermal oxidation of gas emissions resulting from the risky medical waste incineration. UPB Sci. Bull. Ser. C 2012, 74, 169–180. [Google Scholar]
  86. Hildebrandt, R.; Zgórska, A. Fizyczne i chemiczne metody oczyszczania powietrza w pomieszczeniach i obiektach zamkniętych w aspekcie zapobiegania zakażeniu COVID-19. Przemysł Chem. 2021, 1, 55–62. (In Polish) [Google Scholar] [CrossRef]
  87. Davies, A.; Pottage, T.; Bennett, A.; Walker, J. Gaseous and air decontamination technologies for Clostridium difficile in the healthcare environment. J. Hosp. Infect. 2011, 77, 199–203. [Google Scholar] [CrossRef] [PubMed]
  88. Linley, E.; Denyer, S.P.; McDonnell, G.; Simons, C.; Maillard, J.Y. Use of hydrogen peroxide as a biocide: New consideration of its mechanisms of biocidal action. J. Antimicrob. Chemother. 2012, 67, 1589–1596. [Google Scholar] [CrossRef] [PubMed]
  89. Rogers, J.; Sabourin, C.; Choi, Y.; Richter, W.; Rudnicki, D.; Riggs, K.; Taylor, M.; Chang, J. Decontamination assessment of Bacillus anthracis, Bacillus subtilis, and Geobacillus stearothermophilus spores on indoor surfaces using a hydrogen peroxide gas generator. J. Appl. Microbiol. 2005, 99, 739–748. [Google Scholar] [CrossRef] [PubMed]
  90. Kraakman, N.J.R.; González-Martín, J.; Pérez, C.; Lebrero, R.; Muñoz, R. Recent advances in biological systems for improving indoor air quality. Rev. Environ. Sci. Bio/Technol. 2021, 20, 363–387. [Google Scholar] [CrossRef]
  91. Skowron, K.; Grudlewska, K.; Krawczyk, A.; Gospodarek-Komkowska, E. The effectiveness of radiant catalytic ionization in inactivation of Listeria monocytogenes planktonic and biofilm cells from food and food contact surfaces as a method of food preservation. J. Appl. Microbiol. 2018, 124, 1493–1505. [Google Scholar] [CrossRef] [PubMed]
  92. Soreanu, G.; Dumont, É. From Biofiltration to Promising Options in Gaseous Fluxes Biotreatment: Recent Developments, New Trends, Advances, and Opportunities; Elsevier: Amsterdam, The Netherlands, 2020. [Google Scholar]
  93. Klepacka, K. Biologiczne oczyszczanie gazów z ksylenu, styrenu oraz ich mieszanin w bioreaktorach strużkowych-aktualny stan wiedzy i kierunki rozwoju. Pr. Nauk. Inst. Inż. Chem. Pol. Akad. Nauk. 2010, 14, 41–58. (In Polish) [Google Scholar]
  94. Irga, P.; Torpy, F.; Burchett, M. Can hydroculture be used to enhance the performance of indoor plants for the removal of air pollutants? Atmos. Environ. 2013, 77, 267–271. [Google Scholar] [CrossRef]
  95. Cervera Sardá, R.; Gómez Pioz, J. Architectural bio-photo reactors: Harvesting microalgae on the surface of architecture. In Biotechnologies and Biomimetics for Civil Engineering; Springer: Berlin/Heidelberg, Germany, 2014; pp. 163–179. [Google Scholar]
  96. Moya, T.A.; van den Dobbelsteen, A.; Ottele, M.; Bluyssen, P.M. A review of green systems within the indoor environment. Indoor Built Environ. 2019, 28, 298–309. [Google Scholar] [CrossRef]
  97. Anbalagan, A.; Toledo-Cervantes, A.; Posadas, E.; Rojo, E.M.; Lebrero, R.; González-Sánchez, A.; Nehrenheim, E.; Muñoz, R. Continuous photosynthetic abatement of CO2 and volatile organic compounds from exhaust gas coupled to wastewater treatment: Evaluation of tubular algal-bacterial photobioreactor. J. CO2 Util. 2017, 21, 353–359. [Google Scholar] [CrossRef]
  98. Żarczyński, A.; Rosiak, K.; Anielak, P.; Ziemiński, K.; Wolf, W. Praktyczne metody usuwania siarkowodoru z biogazu. II, Zastosowanie roztworów sorpcyjnych i metod biologicznych. Acta Innov. 2015, 15, 57–71. (In Polish) [Google Scholar]
  99. Arthur, C.L.; Pawliszyn, J. Solid phase microextraction with thermal desorption using fused silica optical fibers. Anal. Chem. 1990, 62, 2145–2148. [Google Scholar] [CrossRef]
  100. Pawliszyn, J. Solid Phase Microextraction: Theory and Practice; John Wiley & Sons: Hoboken, NJ, USA, 1997. [Google Scholar]
  101. Sparkman, O.D.; Penton, Z.; Kitson, F.G. Gas Chromatography and Mass Spectrometry: A Practical Guide; Academic Press: Cambridge, MA, USA, 2011. [Google Scholar]
  102. Spietelun, A.; Kloskowski, A.; Chrzanowski, W.; Namieśnik, J. Understanding solid-phase microextraction: Key factors influencing the extraction process and trends in improving the technique. Chem. Rev. 2013, 113, 1667–1685. [Google Scholar] [CrossRef]
  103. James, A.T.; Martin, A.J. Gas-liquid partition chromatography: The separation and micro-estimation of volatile fatty acids from formic acid to dodecanoic acid. Biochem. J. 1952, 50, 679. [Google Scholar] [CrossRef]
  104. Kolb, B.; Ettre, L.S. Static Headspace-Gas Chromatography: Theory and Practice; John Wiley & Sons: Hoboken, NJ, USA, 2006. [Google Scholar]
  105. Scott, R.P. Introduction to Analytical Gas Chromatography, Revised and Expanded; CRC Press: Boca Raton, FL, USA, 2017. [Google Scholar]
  106. Herbert, C.G.; Johnstone, R.A. Mass Spectrometry Basics; CRC Press: Boca Raton, FL, USA, 2002. [Google Scholar]
  107. De Hoffmann, E.; Stroobant, V. Mass Spectrometry: Principles and Applications; John Wiley & Sons: Hoboken, NJ, USA, 2007. [Google Scholar]
  108. Watson, J.T.; Sparkman, O.D. Introduction to Mass Spectrometry: Instrumentation, Applications, and Strategies for Data Interpretation; John Wiley & Sons: Hoboken, NJ, USA, 2007. [Google Scholar]
  109. Bouchonnet, S. Introduction to GC-MS Coupling; CRC Press: Boca Raton, FL, USA, 2013. [Google Scholar]
  110. Hübschmann, H.J. Handbook of GC-MS: Fundamentals and Applications; John Wiley & Sons: Hoboken, NJ, USA, 2015. [Google Scholar]
Figure 1. Photography of Supelco SPME (Merck, Darmstadt, Germany) needle (a) the examples of the results of the gas chromatography (b) and mass spectrometry (c) output of the GCMS measurements.
Encyclopedia 04 00079 g001
Table 1. Permissible degree of microbiological air pollution in utility rooms [19,20].
Type of EnvironmentPermissible No. of Microorg. in 1 m3
Total No. of Microorg. on MPA MediumTotal No. of Fungi
Operating rooms1000
Residential houses1000–2000200–300
College lecture hall1500200
Food industry production room6000
Production halls of the pharmaceutical industry1000
Cowsheds150,0005000
Piggeries200,00010,000
Chicken coops100,0002000
Table 2. Assessment of the degree of atmospheric air pollution by bacteria [20,27].
Total No. [m−3]Number [m−3]Degree
ActinomycotesHemolytic Type StraphylococciPseudomonas fluorescens
α β
<1000<10nonenonenonenot polluted
1000–300010–1001–251–501–50moderately polluted
>3000>100>25>50>50heavily polluted
Table 3. Assessment of the degree of atmospheric air pollution by fungi [20,27].
Total No. [m−3]Degree of Atmospheric Air Pollution
<3000air not polluted
3000–5000averagely clean atmospheric air, especially in early autumn and late autumn
5000–10,000pollution that may have a negative impact on human natural environments
>10,000pollution that threatens the human environment
Disclaimer/Publisher’s Note: The statements, opinions and data contained in all publications are solely those of the individual author(s) and contributor(s) and not of MDPI and/or the editor(s). MDPI and/or the editor(s) disclaim responsibility for any injury to people or property resulting from any ideas, methods, instructions or products referred to in the content.

