Technical Note

Implementing A Flexible Sensor to Identify Forces during Instrument-Assisted Soft Tissue Mobilization

by
Nickolai J. P. Martonick
1,*,
Russell T. Baker
1 and
Craig P. McGowan
2
1
WWAMI Medical Education Program, University of Idaho, Moscow, ID 83843, USA
2
Department of Integrative Anatomical Sciences, University of Southern California, Los Angeles, CA 90089, USA
*
Author to whom correspondence should be addressed.
BioMed 2024, 4(2), 100-111; https://doi.org/10.3390/biomed4020008
Submission received: 26 February 2024 / Revised: 29 March 2024 / Accepted: 10 April 2024 / Published: 16 April 2024

Abstract

:
Instrument-assisted soft tissue mobilization (IASTM) techniques use specialized hand-held instruments for applying controlled mechanical forces to the body with the goal of facilitating healing, improving range of motion, and reducing pain. Nevertheless, an optimal range of forces for achieving clinical outcomes has yet to be established. A barrier to advancing research on IASTM force optimization is the lack of commercially available instruments that quantify treatment forces. The aim of the current study was to assess the feasibility of attaching a flexible force sensor to a commercially available IASTM instrument to obtain valid force measurements. The validity of this novel approach was assessed by comparing data between the flexible force sensor and a force plate during a simulated treatment. Intraclass correlation coefficients, linear regression models, and Bland Altman plots all indicated excellent agreement between the force plate and flexible sensor when the instrument was used at 45°, 65°, and 90° treatment angles. Agreement between measures decreased when the instrument was held at 30°. Thus, commercially available instruments with attached sensors could make force measurement more accessible and feasible for a wider range of research settings, facilitating the advancement of IASTM research and ultimately informing clinical decision-making to improve patient care.

1. Introduction

Instrument-assisted soft tissue mobilization (IASTM), an approach derived from cross-friction massage, incorporates the use of specially designed instruments to provide soft tissue mobilization [1,2]. IASTM treatments are commonly used by physical therapists, chiropractors, and other healthcare professionals to treat various musculoskeletal conditions (i.e., lateral epicondylitis, myofascial trigger points, hamstring strains) [2,3]. The use of an instrument to assist in soft tissue mobilization is thought to increase the ability to detect deformities in the tissue and apply greater force and depth of treatment than using hands alone [2,4]. Clinicians have reported a preference for using instruments in certain clinical scenarios because IASTM is thought to promote healing, increase range of motion, and improve patient outcomes [5,6]. Proposed mechanisms of action for IASTM are theorized to arise from either neurophysiological effects or mechanical effects on tissues [7]. The different theorized mechanisms of action for IASTM, either neurophysiological or mechanical, suggest that various treatment forces may have the potential to achieve positive therapeutic outcomes. A lack of available instruments that gauge the amount of force being applied during IASTM treatment limits the potential for researchers to quantify dose-response relationships, optimize treatment protocols, and improve the understanding for the treatment’s mechanism of action.
Inconsistencies have been found across findings from human trials which may be the result of limited guidance related to IASTM force application, and challenges implementing evidence-based IASTM practices are highlighted by lack of high-quality evidence and the varied conclusions of recent IASTM systematic reviews [8,9,10]. Heterogeneous IASTM applications in clinical practice and research limit the conclusions from the available literature and may result from differences in numerous protocol variables (e.g., instrument type, treatment duration, stroke type); however, the lack of knowledge or consistency of force application is another key factor that is often overlooked when determining treatment application and potential effect on clinical outcome measures. For example, clinicians have provided varied responses to their estimated IASTM force application, with some that may not be representative of clinical practice. Some clinicians estimated using lighter forces (≤5.0 N), some estimated using more moderate forces (≥2 N), and others reported not considering force application during treatment [5,6]. These inconsistencies may be due to the limited human trials considering applied IASTM forces and the variability within those studies. For instance, studies have included lower levels of estimated force (~2 N) to treat delayed onset muscle soreness (DOMS) [11], a wider force range (i.e., 2.6–9.1 N) captured with an instrumented tool for healthy participants [12], or treating with as much force as the patient could tolerate [3].
Variation in IASTM methodologies and unknown IASTM force ranges used in the literature support the need to develop recommendations to inform clinical practice and future research designs. The potential for clinicians to grossly underestimate their applied IASTM force, as well as the potential influence different IASTM forces may have on patient outcomes, also warrants further exploration. Moreover, training programs for the various techniques lack the ability to quantifiably gauge whether students are producing the intended amount of forces being taught. A valid and reliable method of obtaining force data during IASTM treatments is necessary to advance the ability of clinicians to document treatment parameters and for researchers to assess clinical methods. Currently, there is a lack of available options when it comes to designing studies aimed at assessing the force production used by clinicians when treating with IASTM.
Initial efforts to quantify IASTM forces used by trained clinicians have been conducted on simulated tissue attached to a force plate: one-handed IASTM strokes resulted in 2.6 to 14.0 N for peak forces and 1.6 to 10.0 N for average force across clinicians [13], while two-handed IASTM stroke forces ranged from 1.1 to 21.3 N for average peak force and 0.9 to 15.3 N for average mean force across clinicians [14]. Simulated treatment scenarios have also found that trained clinicians can be reliable when applying forces across days when using instruments of different sizes, shapes, and weights [15]. Interestingly, findings from simulated treatment studies have also indicated the potential for different instruments and grip types (i.e., one versus two-handed grips) to impact the amount of force being applied over a single simulated treatment session [14]. Although this initial information is valuable for the current understanding of how much force patients may be receiving in practice, these simulations were unable to account for variability that occurs due to the different shapes and tissue types that make up the human anatomy.
Several methods have been utilized to analyze the amount of force used during a soft tissue treatment that include a range of instrumented handheld devices [16,17,18,19] and robotic manipulators [20,21]. Robotic set-ups, while lacking the inherent variability in force production of human applications, are impractical for clinical applications because they may not be portable or handheld and thus lack the necessary coordination for the varied treatment applications of IASTM. For these reasons, IASTM engineers and researchers have focused their efforts on incorporating force sensors into the instrument. While these devices have been found to produce reliable and valid forces when used on force plates [16,17,18,19], they are not yet readily available for purchase by clinicians and researchers. A reliable and valid sensor that could be attached to commercially available instruments may be a viable solution for the evaluation of forces during the clinical application of IASTM.
The Economical Load and Force (ELF) measurement system is a flexible pressure sensor that can be easily attached to commercially available IASTM products and may be an economical option for measuring IASTM forces in human trials. Prior to the current study, the ELF system has been used in one human trial [12] and the forces found with the ELF measurement system were similar to the forces found in force plate studies [13,14]. However, the methods of instrument calibration were not included within the prior study and it is unknown how the forces measured with the ELF measurement system relate to those measured on a force plate. Additionally, it is unknown if the ELF system can serve as a valid indicator of force across different instrument angles during treatment. Identifying a valid instrument to utilize during IASTM to measure force application would be a valuable tool for conducting more rigorously controlled IASTM studies to improve our understanding of the effects of the intervention. Thus, the purpose of our study was to examine the agreement and linear relationship between IASTM forces measured using the ELF measurement system and a force plate during four different angles of application.

2. Materials and Methods

2.1. Methods

Three methods were used to assess the agreement and correlation of force readings between the ELF measurement system and a force plate at four different instrument angles (90°, 65°, 45°, and 30°), during a simulated IASTM treatment. First, Bland Altman (BA) plots were used to assess the agreement of peak and average forces at four different treatment angles between the measures of the two instruments. Next, intraclass correlation coefficients (ICC) were also used to assess the agreement between the peak and average force data as measured by the ELF measurement system and the force plate data at the four treatment angles. Lastly, the correlation between the two measures was assessed with a linear regression model at the four treatment angles.

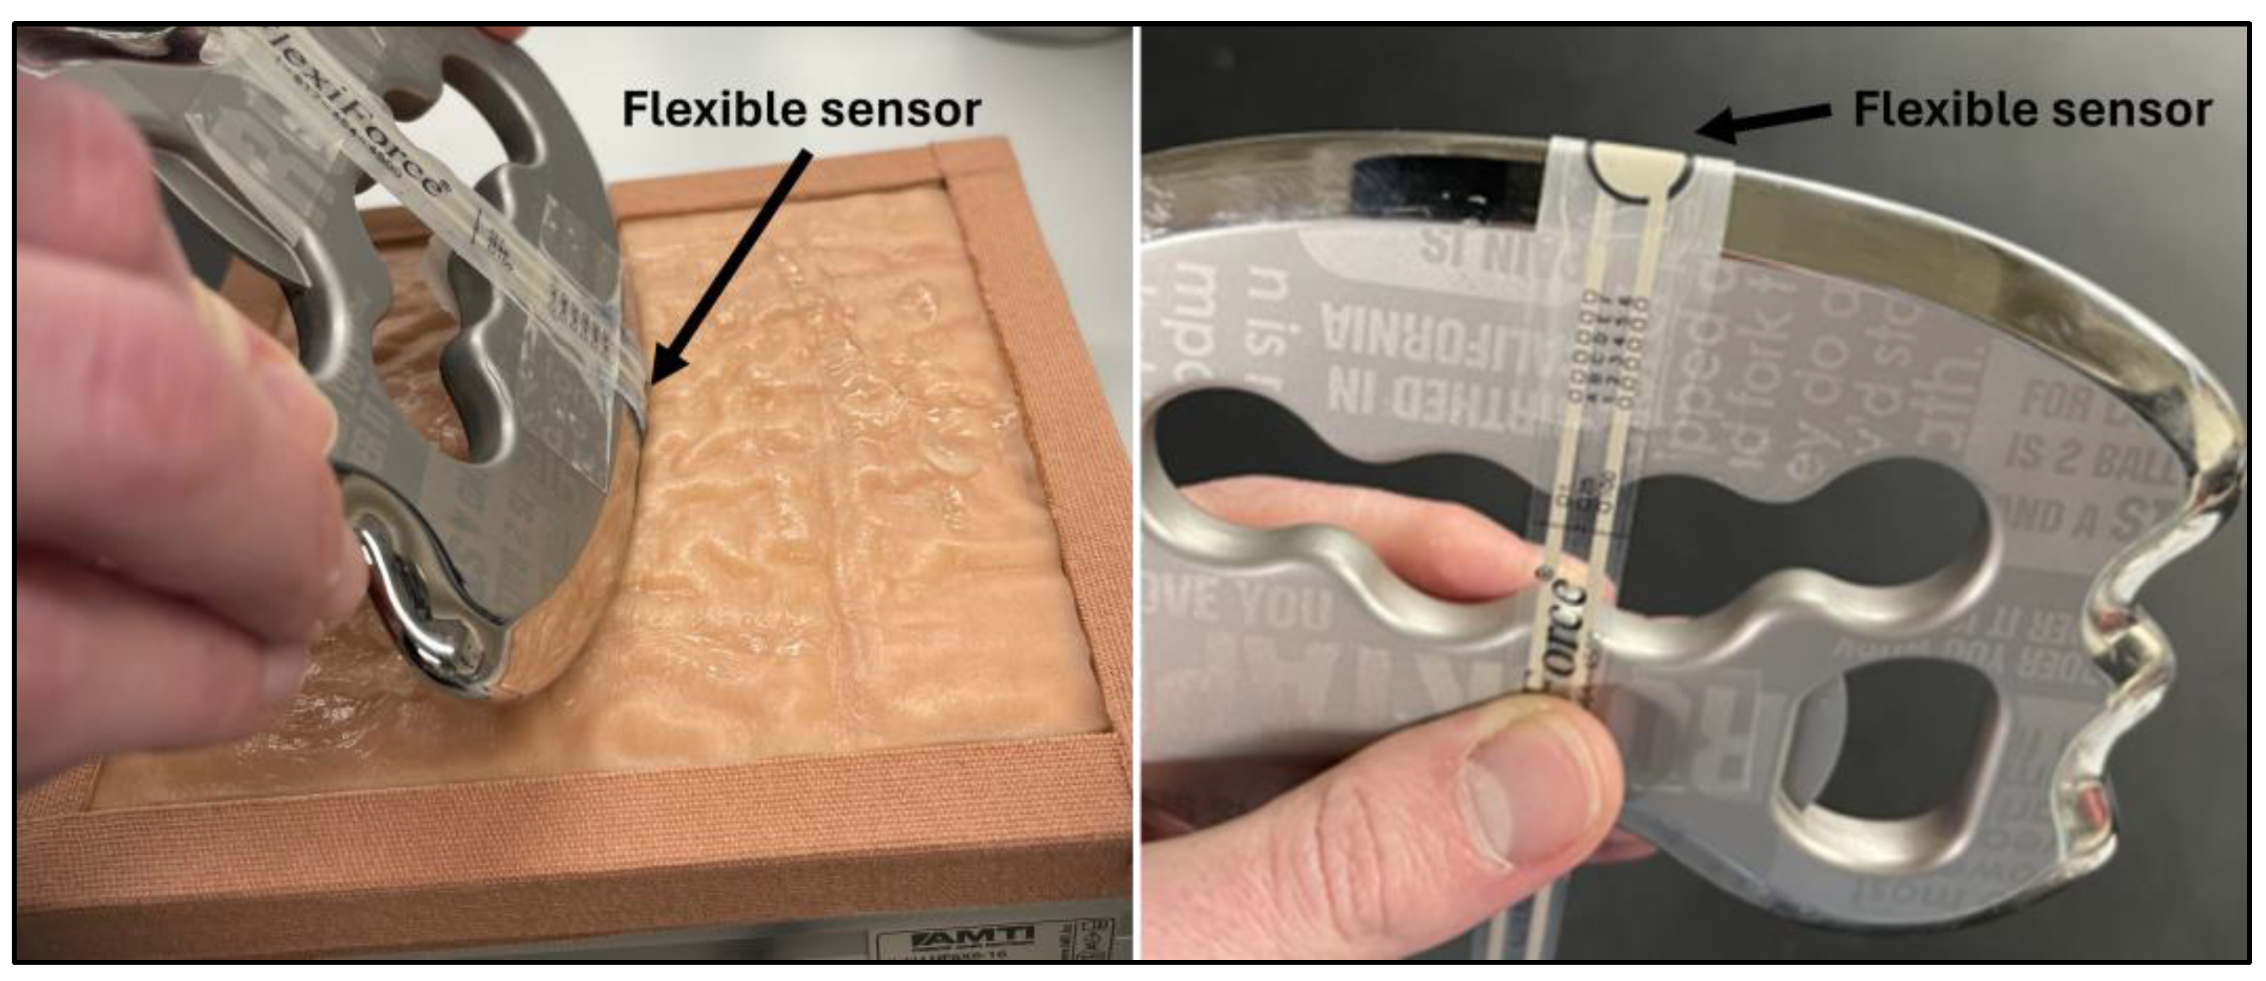
2.2. Instrumentation

Following previously established methods [13,14], a skin simulant (SynTissue, SynDaver, Tampa, FL, USA) was attached to a force plate (HE6X6, AMTI, Watertown, MA, USA) and used to obtain the resultant force readings from the combined x (anterior/posterior), y (horizontal), and z (vertical) vectors during a simulated IASTM treatment using the following formula:
R e s u l t a n t   F o r c e = F x 2 + F y 2 + F z 2
The skin simulant was 10 mm in thickness and comprised of skin, subcutaneous adipose tissue, and muscle tissue. Force plate data was analyzed with NetForce software (ver. 3.5.3, AMTI, Watertown, MA, USA) at 100 Hz and filtered with a 3 Hz low-pass Butterworth filter in MATLAB (ver. 2021a, Natick, MS, USA). The flexible ELF measurement system sensor was attached using adhesive tape [12] to a RockBlades instrument (Mullet, Durham, NC, USA). A picture of the setup is included in Figure 1. The ELF measurement system software (ver. 4.3) was used to collect data from the ELF at 100 Hz and filtered in MATLAB with a 3 Hz low-pass filter. Calibration of the ELF measurement system (ELF, Tekscan, Boston, MA, USA) was performed by holding the instrument perpendicular to skin simulant and applying a vertical force through the instrument to the tissue and force plate. Force plate readings were then input to the ELF software at six different points (6–36 N) and used the system’s best fit linear model to estimate forces (Figure 2). The ELF sensitivity was set to 50% using the ELF measurement system software and the sensor was zeroed prior to each application. All simulated treatments were performed by the same licensed clinician trained in the use of IASTM.

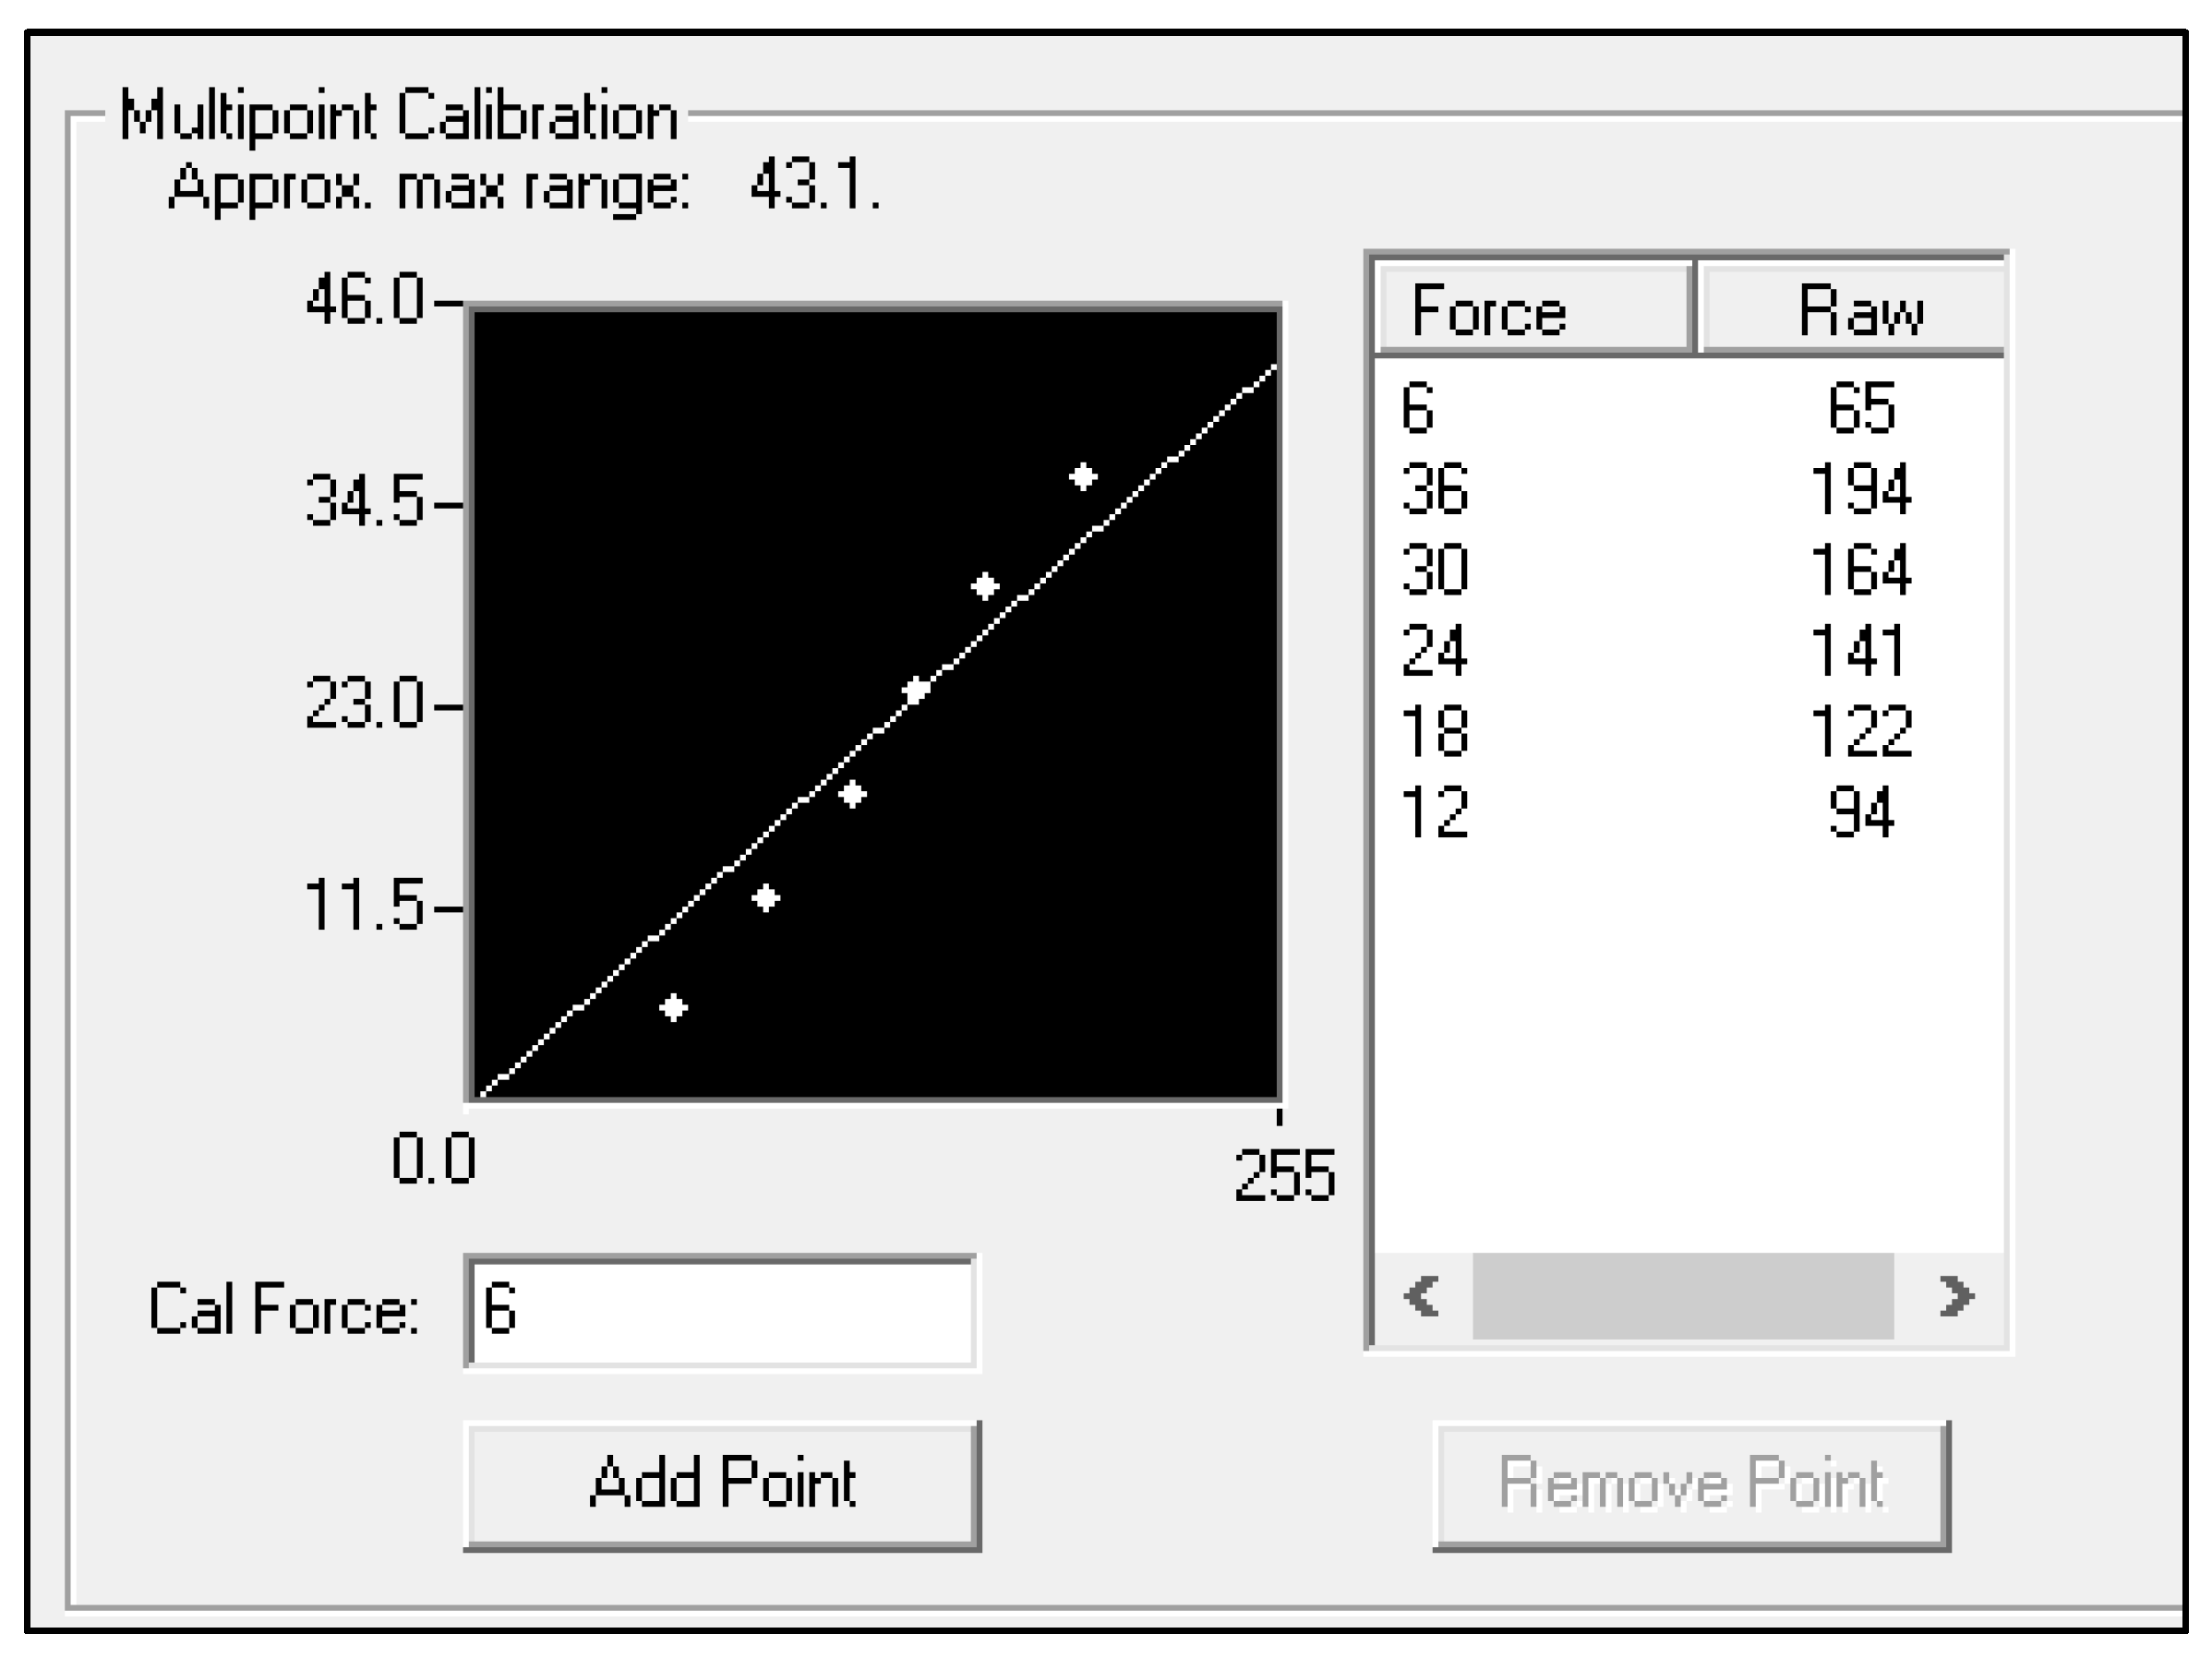
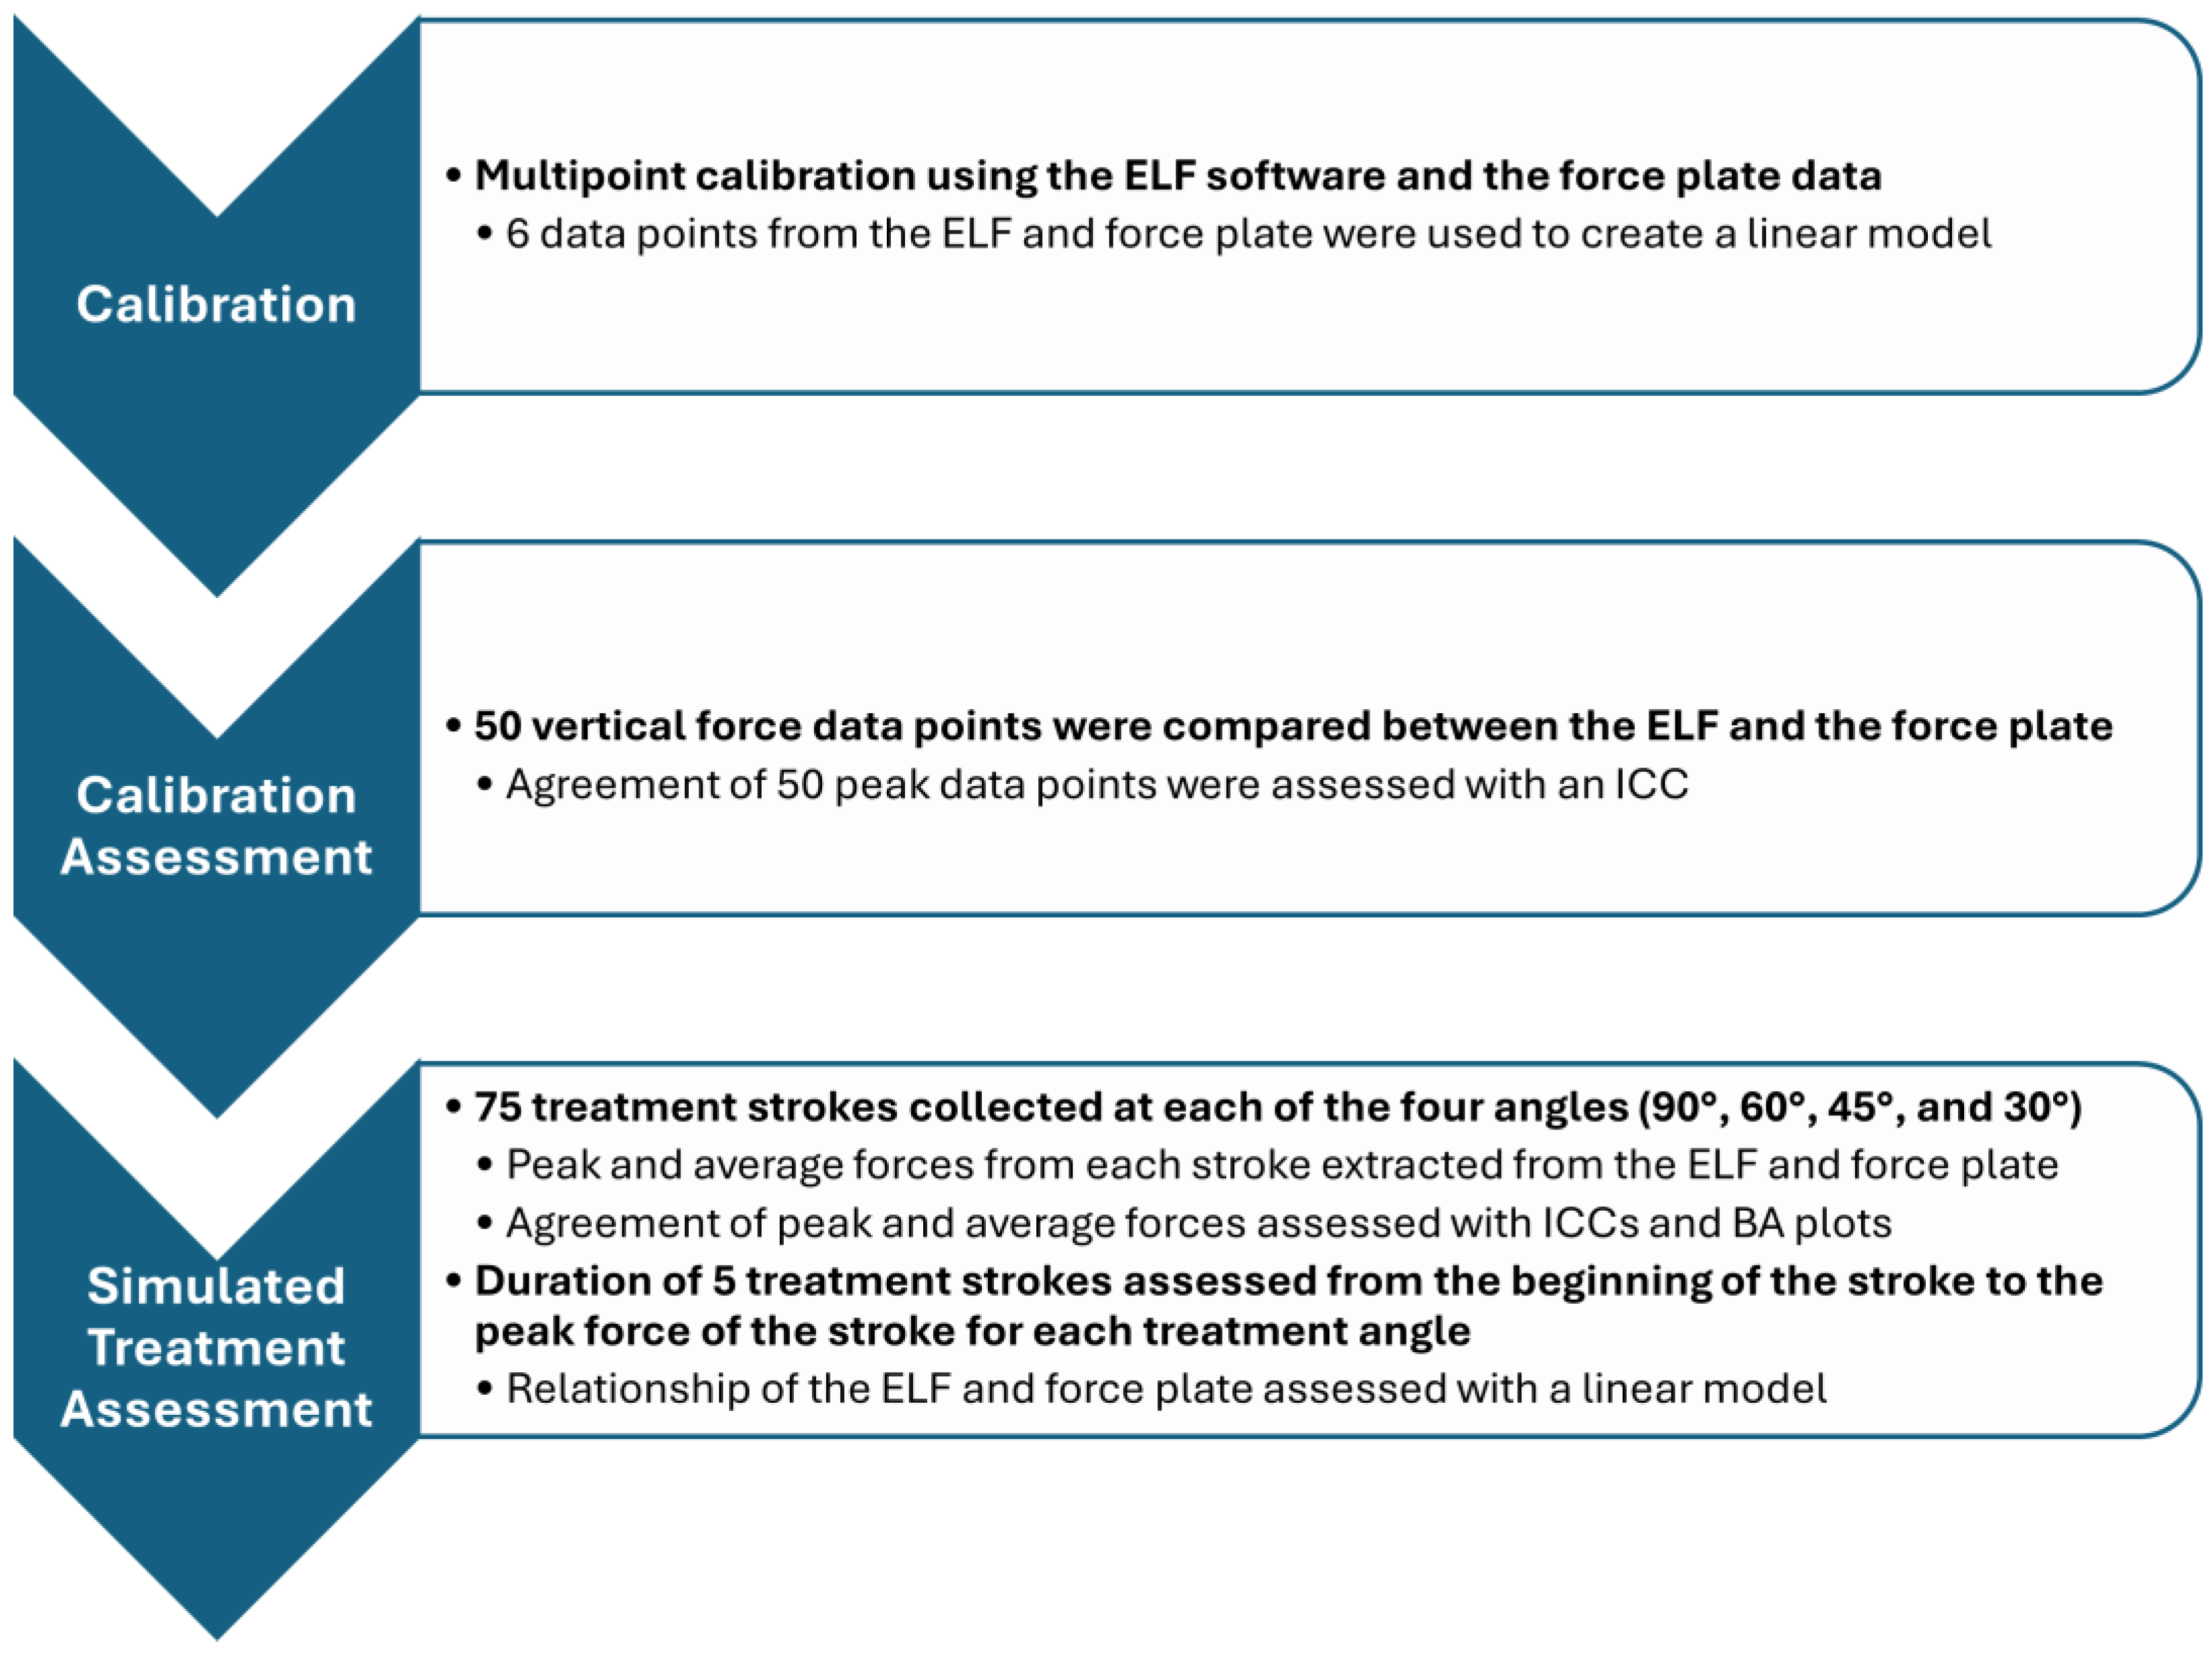
2.3. Calibration Assessment

The instrument calibration was first assessed by pressing the instrument vertically into the skin simulant at an angle perpendicular to the force plate (90°). Fifty data points of varied forces were collected for both the ELF and force plate in this manner. The peak vertical force data were identified with the findpeaks function in MATLAB for the calibration assessment and the subsequent simulated treatment assessments.

2.4. Simulated Treatment Assessment

Seventy-five sweeping strokes were performed with the instrument at each of the four different instrument angles (90°, 65°, 45°, and 30°) with peak vertical forces ranging from 5 to 30 newtons. A goniometer was placed adjacent to the force plate to aid the researcher in determining/maintaining the angle of the instrument [17,18]. Strokes were performed at a rate of one stroke per second as guided by a metronome. The strokes were unidirectional (proximal to distal), and the researcher lifted the instrument off the skin simulant at the end of each stroke. The instrument was held with two hands to ensure that the flexible pressure sensor maintained contact with the skin simulant. Lifting the instrument off the skin simulant was performed to identify individual strokes more accurately from the data. Peak and average forces were identified for each stroke. Average forces for each stroke were identified by cutting the data from 25 frames before and after the occurrence of the peak force and calculating the mean of the 51 data points. To identify the relationship between the two measurement devices across the duration of a treatment stroke, a single stroke was analyzed from zero newtons to peak force at each of the four instrument angles. To calculate a linear model on the cut data (i.e., beginning to peak), the interp1 function in MATLAB was used to interpolate both measures of data to an equal number of 100 data points.

2.5. Statistical Analysis

All statistical analyses were performed in R studio (version 4.1.2; The R Foundation for Statistical Computing Platform, 2021). ICC estimates and their 95% confidence intervals based on a single-rating (k = 2), absolute-agreement, two-way mixed-effects model were used to assess the absolute agreement between the ELF and force plate for both the calibration assessment and the simulated treatments. For the calibration assessment, the 50 peak force values from the ELF and force plate were compared. For the simulated treatment assessment, the peak and average values were each compared between the ELF and force plate for the 75 strokes at each treatment angle. ICC values were interpreted as less than 0.50 as poor, from 0.51 to 0.75 as moderate, between 0.75 and 0.9 as good, and greater than 0.90 as excellent [22]. Agreement between the ELF and force plate for the calibration assessment and the simulated treatments was also assessed with BA plots. The BA plots were used to calculate and display the mean difference between the measurements of the force plate and ELF as well as the limits of agreement (LOA), defined as the range expected to include 95% of the future differences between the two measurements [23]. Lastly, the interpolated data from the ELF and force plate were plotted against each other for each of the four treatment angles. A linear regression equation was applied to the plotted data for each of the five strokes to obtain five R2 values for each treatment angle. A descriptive analysis of the interpolated force plate data was also performed to better understand how much each of the three force vectors (i.e., Fx, Fy, and Fz) contributed to the resultant force. This was accomplished by taking the mean force data of the five interpolated strokes for the three force vectors and dividing each vector by the mean resultant force at each of the four angles of application. Thus, the contribution from each of the force vectors to the resultant force could be assessed. A flow chart overviewing the procedures and statistical analysis techniques is provided in Figure 3.

3. Results

The BA stats for calibration forces were found to have a mean difference of −0.19 N and upper and lower limits of agreement ranging from −2.63 to 2.33 N. The ICC for calibration forces demonstrated excellent agreement (ICC = 0.97, 95%CI = 0.96–0.99). The force plate and ELF measurements also demonstrated agreement during the simulated treatment strokes (Table 1, Figure 4). Mean differences for the peak forces of sweeping strokes were within 1.29 newtons across the three highest instrument angles (90° = 1.10, 60° = −0.12, 45° = 1.29); however, when the instrument was used at a 30°, the mean difference increased to 3.49 N. Mean differences for average forces were less than one newton (90° = −0.06 N, 65° = −0.95 N, 45° = 0.44 N) for all instrument angles other than 30° (2.87 N). Linear relationships were found at each of the four instrument angles during the simulated treatment strokes (Figure 5). Greater than 95% of the resultant forces from the force plate was contributed to by the vertical force vector for each of the four instrument angles (Figure 6).

4. Discussion

The purpose of our study was to examine the agreement and linear relationship between IASTM forces measured using the ELF measurement system and a force plate. Findings from the current study indicated excellent agreement between the ELF and force plate when performing a simulated IASTM treatment with the instrument held at angles between 45 and 90°, and agreement was considered “good” when the instrument was angled at 30°. Furthermore, strong linear relationships were found between the ELF and force plate at all treatment angles. As there is currently a paucity of evidence for optimal treatment forces, attaching a flexible sensor to an IASTM tool is a feasible method to start quantifying IASTM forces in practice and research. Including force data during IASTM treatments may also have benefits for understanding the potential physiological mechanism behind IASTM treatments.
Theories for neurophysiological effects from IASTM suggest that activation of low-threshold mechanoreceptors in the dermis (e.g., Pacinian corpuscles, Meissner corpuscle, Merkle’s disks) can be used to modify pain or increase blood flow [7,24,25]. Gentle mechanical forces have been found to stimulate the activation of these mechanoreceptors [24,25] and result in pain relief [24]. Thus, IASTM researchers have investigated the effectiveness of light pressure to optimize treatments. Preliminary evidence that IASTM works from a neurophysiological mechanism is supported by findings of modulated grip strength [7] improved tactile discrimination [11] and increased blood flow [26] following light pressure IASTM. While each of these studies demonstrated that lighter forces can be effective, there is also evidence that increased forces stimulate connective tissue remodeling, reduce fascial adhesions, and break down scar tissue that limit ROM [4,27,28].
The proposed therapeutic mechanical effects of IASTM are largely based on tissue healing findings following induced ligament injury in rat ligaments [29,30] or tendons [31]. Animal studies have consistently indicated that IASTM application increases fibroblast recruitment, stimulates collagen repair, and promotes connective tissue remodeling following induced injury [29,30,31]. Researchers have also indicated tissue healing (e.g., fibroblast recruitment, fibroblast maturation) has a positive relationship with IASTM force application, which may lead to conclusions that higher levels of IASTM force during treatment results in better outcomes [31]. Although, animal model studies have used low IASTM forces (i.e., 0.5 to 1.5 N) applied for short durations to small animal tendons or ligaments during induced injury situations [29,30]. Thus, the basic scientific evidence supporting the use of IASTM may not translate to clinical practice scenarios, lead to replicable findings in human trials, or be an effective guide for informing how much force to use when applying IASTM with the intent of promoting tissue remodeling. Nevertheless, clinicians and researchers continue to use methods that apply maximal force within subject tolerance [3,27,32] instead of seeking the potential to develop delineated thresholds. Given that pain pressure thresholds from algometry have been found to have a high degree of inter-individual variability [33,34], vary depending on sight of application [33], and are influenced by the shape of the algometer pad [33]; it stands to reason that using participant-identified thresholds for IASTM tolerance would not yield similar forces across individuals or studies. Therefore, developing evidence for whether specified doses of higher, lower, or moderate force applications are more optimal will depend on the ability of researchers to quantify forces rather than rely on pain tolerance levels.
The standardization of IASTM force application may also limit the potential for adverse events or detrimental treatment outcomes. Discomfort and bruising (e.g., petechiae) are adverse effects associated with IASTM which may result from higher applied forces, increased duration of treatment sessions, more frequent treatment sessions, or a synergistic influence of these aspects of IASTM interventions [9]. Due to substantial variations in IASTM forces reported, minimal force guidance from training courses, and no current clinical guidelines on optimal forces, clinicians have had no choice but to depend on intuitive and individualized approaches for determining IASTM forces based on personal experience, patient responses, and potentially biased perspectives from commercial IASTM training. While clinicians and researchers [11] may use the mass of instrument and the force of gravity to estimate the amount of force (e.g., 102 g ≈ 1 N); the force exerted by the instrument on the tissue depends not only on its mass but also on the acceleration of the stroke and the angle of application. Thus, the application of forces using real time feedback provided by systems like the ELF may not only provide more consistent forces across treatments and patients but limit the opportunity for adverse events as clinicians would be guided by evidence-based doses.
In addition to the amount of force being applied, the angle of the instrument is often considered as modifiable factor when treating with IASTM. For example, steeper instrument angles (i.e., 90–65°) are thought to achieve effects such as increasing shear forces on the soft tissue and subsequently increasing tissue temperature [35,36]. Increased tissue temperature may benefit the healing process as it is associated with increased blood flow to the targeted treatment area [35,36]. More shallow treatment angles of 45 and 30° have also been used by researchers investigating the effects of IASTM on joint ROM [6,12,37] and DOMS [11]. However, treatment forces during these investigations were either not reported [35,37], estimated by using the weight of the instrument [7,11], or quantified without reporting the reliability of the measurement device [12]. As simulated treatments within the range of 90–45° were found to be within the capabilities of the ELF measurement system to measure forces accurately and reliably; the inclusion of force measures during IASTM could elucidate how force factors into achieving increased tissue temperatures [35] or increases in shoulder ROM [37].
Investigations using treatment angles of 30° should be cautious of the ELF system measurements due to the increased mean differences and broader limits of agreement (Figure 4); however, researchers may consider using regression models to accurately predict forces as the ELF had a strong linear relationship with the force plate (Figure 5). Decreased reliability for vertical force production at more shallow instrument angles was also demonstrated by prior studies that have investigated custom manufactured force instrumented devices [16,17]. Both prior studies found instrument reliability between 60–90° [16], and 70–90° [17]. These manufactured devices used either uniaxial [16], or triaxial [17,18,19] compressive force sensors to determine force production, whereas the ELF measurement system utilizes a resistive-based technology that gauges the change in resistance at the sensing element. Triaxial sensors offer the advantage of providing three-dimensional force assessments which are valuable when assessing the complexities of different IASTM strokes (e.g., sweeping, fanning, j-shaped strokes) that may not be linear in their application. Different treatment strokes and treatment angles are often used for the progression of treatments [4]. For example, shallower scanning and sweeping strokes may be applied initially to identify potential adhesions before applying deeper, more targeted strokes that are often not linear [4]. Although pressure sensors can only provide one-dimensional force readings, the ELF was assessed against the resultant forces from the force plate. The ELF was able to account for the lack of three-dimensional outputs because the vertical forces from the simulated treatment accounted for greater than 95% of the resultant forces during the simulated treatment at each of the assessed treatment angles (Figure 5). Thus, the overall forces experienced by patients and participants may be encompassed by the ELF measurements during linear strokes.
The current study is also not the first to assess the effectiveness of the ELF for providing accurate force readings. Brimacombe et al. [38] found the ELF to have a root mean square error to be as low as 2.7% in static conditions when the sensor is not flexed. Moreover, commercially available flexible resistive pressure sensors have been found to be suitable for dynamic compression therapy applications [39]. Dynamic applications of the ELF have also been used to study forces on the curved surfaces of different laryngoscopes to compare in patient care [40]. The ability to wrap the flexible sensing element ELF measurement system around the treatment edge of the RockBlades instrument may explain why it was able to reliably achieve a greater range of treatment angles (up to 45°). However, it should be noted that this instrument was selected for its rounded edge beveling which avoided creating a crease in the sensor when it was attached to the instrument. The prior study that used the ELF system also used instruments with rounded edge beveling [14]. Instruments with a sharper beveled edge may not be suitable for the ELF system. This is an important consideration because IASTM tools will commonly come with a sharper beveled edge that may not be suitable for the ELF system.
The methods of the current study also expand upon previous findings on custom devices by examining the reliability of sweeping strokes for both peak and average forces across a treatment stroke. Average forces may be more applicable for determining the overall treatment dose while peak forces could be useful in assessing a patients response to treatment intensity. Although other devices [16,17] have the ability to assess a greater range of forces (greater than 100 N), these forces likely exceed a therapeutic range and certainly exceed the forces previously reported to be used by clinicians in simulated treatments [13]. Nevertheless, the ELF measurement system was found to be reliable within and beyond the range of the previously reported peak and average forces. There are limitations however, when comparing the ELF sensor attached to an instrument when compared to other custom designed devices found in the literature. Although the ELF was able to capture the resultant forces during simulated treatments, this may not translate to multi-planar strokes that are common in IASTM practice. This limits its ability to be used when determining the potential importance of shear versus vertical forces when treating with IASTM, as well as the evaluation of non-linear treatment strokes. Thus, triaxial sensors, or simulated treatments on force plates may be necessary for future investigations to begin quantifying how different treatment strokes may be more effective at generating shear forces between the instrument and the soft tissue. Other devices have also been equipped with inertial measurement units and accelerometers to determine the three-dimensional orientation of the device in space as well as evaluate the angular motion of the treatment stroke [17,18,19]. Ultimately, these three-dimensional factors could be used to aid in the analysis and description of the various IASTM stroke types used in practice and whether specific strokes or force vectors are more effective for certain conditions. Lastly, the ELF system limits analysis to where the flexible sensor is attached to the instrument, where custom devices with multi-axial force sensors quantify forces at any point of contact between the instrument and the tissue. While the set-up used in this study may have limitations when compared to other devices, until these devices become commercially available to researchers and clinicians, attaching the flexible ELF sensor to clinically available instruments is a viable option for assessing force production during live treatments.

5. Conclusions

The lack of consistency when reporting the amount of force used during IASTM investigations results in equivocal decisions when replicating the methods or when applying the methods in clinical practice. The findings from the current study indicate that attaching a flexible sensor to a commercially available IASTM tool provided valid and reliable feedback about the amount of force being applied between the treatment angles of 45 and 90°. Thus, clinicians and researchers could use these methods to accurately gauge the amount of force being used during IASTM training, when documenting treatment forces with patients, and during laboratory research. Applying and documenting quantitative measures of force application is necessary for advancing the homogeneity of IASTM research and understanding the potential importance of force as it relates to the mechanisms of this treatment. Future studies should perform evaluations of different forces on different tissues and conditions to best develop therapeutic ranges for optimal treatment forces.

Author Contributions

Conceptualization, N.J.P.M., C.P.M. and R.T.B.; methodology, N.J.P.M., C.P.M. and R.T.B.; software, N.J.P.M.; validation, N.J.P.M.; formal analysis, N.J.P.M.; investigation, N.J.P.M.; writing—original draft preparation, N.J.P.M. and R.T.B.; writing—review and editing, N.J.P.M., C.P.M. and R.T.B.; visualization, N.J.P.M.; project administration, N.J.P.M. All authors have read and agreed to the published version of the manuscript.

Funding

This research received no external funding.

Data Availability Statement

Data can be made available upon request to the authors.

Conflicts of Interest

The authors declare no conflicts of interest.

References

  1. Loghmani, T.; Whitted, M. Soft tissue manipulation: A powerful form of mechanotherapy. Physiother Rehabil. 2016, 1, 1000122. [Google Scholar] [CrossRef]
  2. Gulick, D.T. Instrument-assisted soft tissue mobilization increases myofascial trigger point pain threshold. J. Bodyw. Mov. Ther. 2018, 22, 341–345. [Google Scholar] [CrossRef]
  3. Fousekis, K.; Mylonas, K.; Charalampopoulou, V. Aggressive massage techniques can accelerate safe return after hamstrings strain: A case study of a professional soccer player. J. Sports Med. Doping Stud. 2013, 4, 2161-0673. [Google Scholar] [CrossRef]
  4. Bush, H.M.; Stanek, J.M.; Wooldridge, J.D.; Stephens, S.L.; Barrack, J.S. Comparison of the Graston Technique® with instrument-assisted soft tissue mobilization for increasing dorsiflexion range of motion. J. Sport Rehabil. 2021, 30, 587–594. [Google Scholar] [CrossRef] [PubMed]
  5. Baker, R.T.; Start, A.; Larkins, L.; Burton, D.; May, J. Exploring the preparation, perceptions, and clinical profile of athletic trainers who use instrument-assisted soft tissue mobilization. Athl. Train. Sports Health Care 2018, 10, 169–180. [Google Scholar] [CrossRef]
  6. Koumantakis, G.A.; Roussou, E.; Angoules, G.A.; Angoules, N.A.; Alexandropoulos, T.; Mavrokosta, G.; Nikolaou, P.; Karathanassi, F.; Papadopoulou, M. The immediate effect of IASTM vs. Vibration vs. Light Hand Massage on knee angle repositioning accuracy and hamstrings flexibility: A pilot study. J. Bodyw. Mov. Ther. 2020, 24, 96–104. [Google Scholar] [CrossRef] [PubMed]
  7. Cheatham, S.W.; Martonick, N.; Krumpl, L.; Baker, R.T. The effects of light pressure instrument-assisted soft tissue mobilization at different rates on grip strength and muscle stiffness in healthy individuals. J. Sport Rehabil. 2023, 32, 731–773. [Google Scholar] [CrossRef] [PubMed]
  8. Nazari, G.; Bobos, P.; MacDermid, J.C.; Birmingham, T. The effectiveness of instrument-assisted soft tissue mobilization in athletes, participants without extremity or spinal conditions, and individuals with upper extremity, lower extremity, and spinal conditions: A systematic review. Arch. Phys. Med. Rehabil. 2019, 100, 1726–1751. [Google Scholar] [CrossRef] [PubMed]
  9. Seffrin, C.B.; Cattano, N.M.; Reed, M.A.; Gardiner-Shires, A.M. Instrument-assisted soft tissue mobilization: A systematic review and effect-size analysis. J. Athl. Train. 2019, 54, 808–821. [Google Scholar] [CrossRef] [PubMed]
  10. Lambert, M.; Hitchcock, R.; Lavallee, K.; Hayford, E.; Morazzini, R.; Wallace, A.; Conroy, D.; Cleland, J. The effects of instrument-assisted soft tissue mobilization compared to other interventions on pain and function: A systematic review. Phys. Ther. Rev. 2017, 22, 76–85. [Google Scholar] [CrossRef]
  11. Cheatham, S.W.; Kreiswirth, E.; Baker, R.; Professor, A. Does a light pressure instrument assisted soft tissue mobilization technique modulate tactile discrimination and perceived pain in healthy individuals with DOMS? J. Can. Chiropr. Assoc. 2019, 63, 1. [Google Scholar]
  12. Vardiman, J.P.; Siedlik, J.; Herda, T.; Hawkins, W.; Cooper, M.; Graham, Z.A.; Deckert, J.; Gallagher, P. Instrument-assisted soft tissue mobilization: Effects on the properties of human plantar flexors. Int. J. Sports Med. 2015, 36, 197–203. [Google Scholar] [CrossRef] [PubMed]
  13. Martonick, N.J.; Reeves, A.J.; Whitlock, J.A.; Stevenson, T.C.; Cheatham, S.W.; McGowan, C.P.; Baker, R.T. Instrument-Assisted Soft Tissue Mobilization Forces Applied by Trained Clinicians During a Simulated Treatment. J. Sport Rehabil. 2021, 31, 120–124. [Google Scholar] [CrossRef]
  14. Martonick, N.J.; North, K.; Reeves, A.; McGowan, C.; Baker, R.T. Effect of instrument type and one-handed versus two-handed grips on force application during simulated instrument-assisted soft tissue mobilisation. BMJ Open Sport Exerc. Med. 2023, 9, e001483. [Google Scholar] [CrossRef] [PubMed]
  15. Duffy, S.; Martonick, N.; Reeves, A.; Cheatham, S.W.; McGowan, C.; Baker, R.T. Clinician reliability of one-handed instrument-assisted soft tissue mobilization forces during a simulated treatment. J. Sport Rehabil. 2022, 31, 505–510. [Google Scholar] [CrossRef] [PubMed]
  16. Everingham, J.B.; Martin, P.T.; Lujan, T.J. A hand-held device to apply instrument-assisted soft tissue mobilization at targeted compression forces and stroke frequencies. J. Med. Devices 2019, 13, 0145041. [Google Scholar] [CrossRef] [PubMed]
  17. Bhattacharjee, A.; Chien, S.Y.P.; Anwar, S.; Loghmani, M.T. Quantifiable Soft Tissue Manipulation (QSTMTM)—A novel modality to improve clinical manual therapy with objective metrics. In Proceedings of the Annual International Conference of the IEEE Engineering in Medicine and Biology Society, EMBS, Virtual, 1–5 November 2021; Institute of Electrical and Electronics Engineers Inc.: Piscataway, NJ, USA, 2021; pp. 4961–4964. [Google Scholar]
  18. Alotaibi, A.M.; Anwar, S.; Loghmani, M.T.; Chien, S. Force sensing for an instrument-assisted soft tissue manipulation device. J. Med. Devices 2017, 11, 031012. [Google Scholar] [CrossRef]
  19. Bhattacharjee, A.; Anwar, S.; Chien, S.; Loghmani, M.T. A handheld quantifiable soft tissue manipulation device for tracking real-time dispersive force-motion patterns to characterize manual therapy treatment. IEEE Trans. Biomed. Eng. 2023, 70, 1553–1564. [Google Scholar] [CrossRef] [PubMed]
  20. Wang, Q.; Zeng, H.; Best, T.M.; Haas, C.; Heffner, N.T.; Agarwal, S.; Zhao, Y. A mechatronic system for quantitative application and assessment of massage-like actions in small animals. Ann. Biomed. Eng. 2014, 42, 36–49. [Google Scholar] [CrossRef] [PubMed]
  21. Zeng, H.; Butterfield, T.A.; Agarwal, S.; Haq, F.; Best, T.M.; Zhao, Y. An engineering approach for quantitative analysis of the lengthwise strokes in massage therapies. J. Med. Devices 2008, 2, 041003. [Google Scholar] [CrossRef]
  22. Koo, T.K.; Li, M.Y. A Guideline of Selecting and Reporting Intraclass Correlation Coefficients for Reliability Research. J. Chiropr. Med. 2016, 15, 155–163. [Google Scholar] [CrossRef] [PubMed]
  23. Haghayegh, S.; Kang, H.-A.; Khoshnevis, S.; Smolensky, M.H.; Diller, K.R. A comprehensive guideline for Bland–Altman and intra class correlation calculations to properly compare two methods of measurement and interpret findings. Physiol. Meas. 2020, 41, 055012. [Google Scholar] [CrossRef] [PubMed]
  24. Shaikh, S.; Nagi, S.S.; McGlone, F.; Mahns, D.A. Psychophysical investigations into the role of low-threshold c fibres in non-painful affective processing and pain modulation. PLoS ONE 2015, 10, e0138299. [Google Scholar] [CrossRef] [PubMed]
  25. Olson, W.; Dong, P.; Fleming, M.; Luo, W. The specification and wiring of mammalian cutaneous low-threshold mechanoreceptors. Wiley Interdiscip. Rev. Dev. Biol. 2016, 5, 389–404. [Google Scholar] [CrossRef] [PubMed]
  26. Speicher, T.E.; Selkow, N.M.; Warren, A.J. Manual Therapy Improves Immediate Blood Flow and Tissue Fiber Orientation of the Forearm Extensors. J. Phys. Med. Rehabil. 2022, 4, 28–36. [Google Scholar] [CrossRef]
  27. Coviello, J.P.; Kakar, R.S.; Reynolds, T.J. Short-term effects of instrument assisted soft tissue mobilization on pain free range of motion in a weightlifter with subacromial pain syndrome. Int. J. Sport Phys. Ther. 2017, 12, 144–154. [Google Scholar]
  28. Hammer, W.I. The effect of mechanical load on degenerated soft tissue. J. Bodyw. Mov. Ther. 2008, 12, 246–256. [Google Scholar] [CrossRef] [PubMed]
  29. Loghmani, M.T.; Warden, S.J. Instrument-assisted cross fiber massage increases tissue perfusion and alters microvascular morphology in the vicinity of healing knee ligaments. BMC Complement. Altern. Med. 2013, 13, 240. [Google Scholar] [CrossRef]
  30. Loghmani, M.T.; Warden, S.J. Instrument-assisted cross-fiber massage accelerates knee ligament healing. J. Orthop. Sports Phys. Ther. 2009, 39, 506–514. [Google Scholar] [CrossRef]
  31. Davidson, C.; Ganion, L.; Gehlsen, G.; Verhoestra, B.; Roepke, J.; Sevier, T. Rat tendon morphologic and functional changes resulting from soft tissue mobilization clinical sciences: Clinically relevant. Med. Sci. Sports Exerc. 1997, 29, 313–319. [Google Scholar] [CrossRef]
  32. Ikeda, N.; Otsuka, S.; Kawanishi, Y.; Kawakami, Y. Effects of instrument-assisted soft tissue mobilization on musculoskeletal properties. Med. Sci. Sports Exerc. 2019, 51, 2166–2172. [Google Scholar] [CrossRef] [PubMed]
  33. Melia, M.; Geissler, B.; König, J.; Ottersbach, H.J.; Umbreit, M.; Letzel, S.; Muttray, A. Pressure pain thresholds: Subject factors and the meaning of peak pressures. Eur. J. Pain 2019, 23, 167–182. [Google Scholar] [CrossRef] [PubMed]
  34. Persson, A.; Brogårdh, C.; Sjölund, B. Tender or not tender: Test-retest repeatability of pressure pain thresholds in the trapezius and deltoid muscles of healthy women. J. Rehabil. Med. 2004, 36, 17–27. [Google Scholar] [CrossRef] [PubMed]
  35. Fousekis, K.; Varda, C.; Mandalidis, D.; Mylonas, K.; Angelopoulos, P.; Koumoundourou, D.; Tsepis, E. Effects of instrument-assisted soft-tissue mobilization at three different application angles on hamstring surface thermal responses. J. Phys. Ther. Sci. 2020, 32, 506–509. [Google Scholar] [CrossRef] [PubMed]
  36. Portillo-Soto, A.; Eberman, L.E.; Demchak, T.J.; Peebles, C. Comparison of blood flow changes with soft tissue mobilization and massage therapy. J. Altern. Complement. Med. 2014, 20, 932–936. [Google Scholar] [CrossRef] [PubMed]
  37. Laudner, K.; Compton, B.D.; A McLoda, T.; Walters, C.M. Acute effects of instrument assisted soft tissue mobilization for improving posterior shoulder range of motion in collegiate baseball players. Int. J. Sport Phys. Ther. 2014, 9, 1–7. [Google Scholar]
  38. Brimacombe, J.M.; Wilson, D.R.; Hodgson, A.J.; Ho, K.C.T.; Anglin, C. Effect of calibration method on tekscan sensor accuracy. J. Biomech. Eng. 2009, 131, 034503. [Google Scholar] [CrossRef] [PubMed]
  39. Parmar, S.; Khodasevych, I.; Troynikov, O. Evaluation of flexible force sensors for pressure monitoring in treatment of chronic venous disorders. Sensors 2017, 17, 1923. [Google Scholar] [CrossRef] [PubMed]
  40. Cordovani, D.; Russell, T.; Wee, W.; Suen, A.; Cooper, R.M. Measurement of forces applied using a Macintosh direct laryngoscope compared with a Glidescope video laryngoscope in patients with predictors of difficult laryngoscopy: A randomised controlled trial. Eur. J. Anaesthesiol. 2019, 36, 221–226. [Google Scholar] [CrossRef] [PubMed]
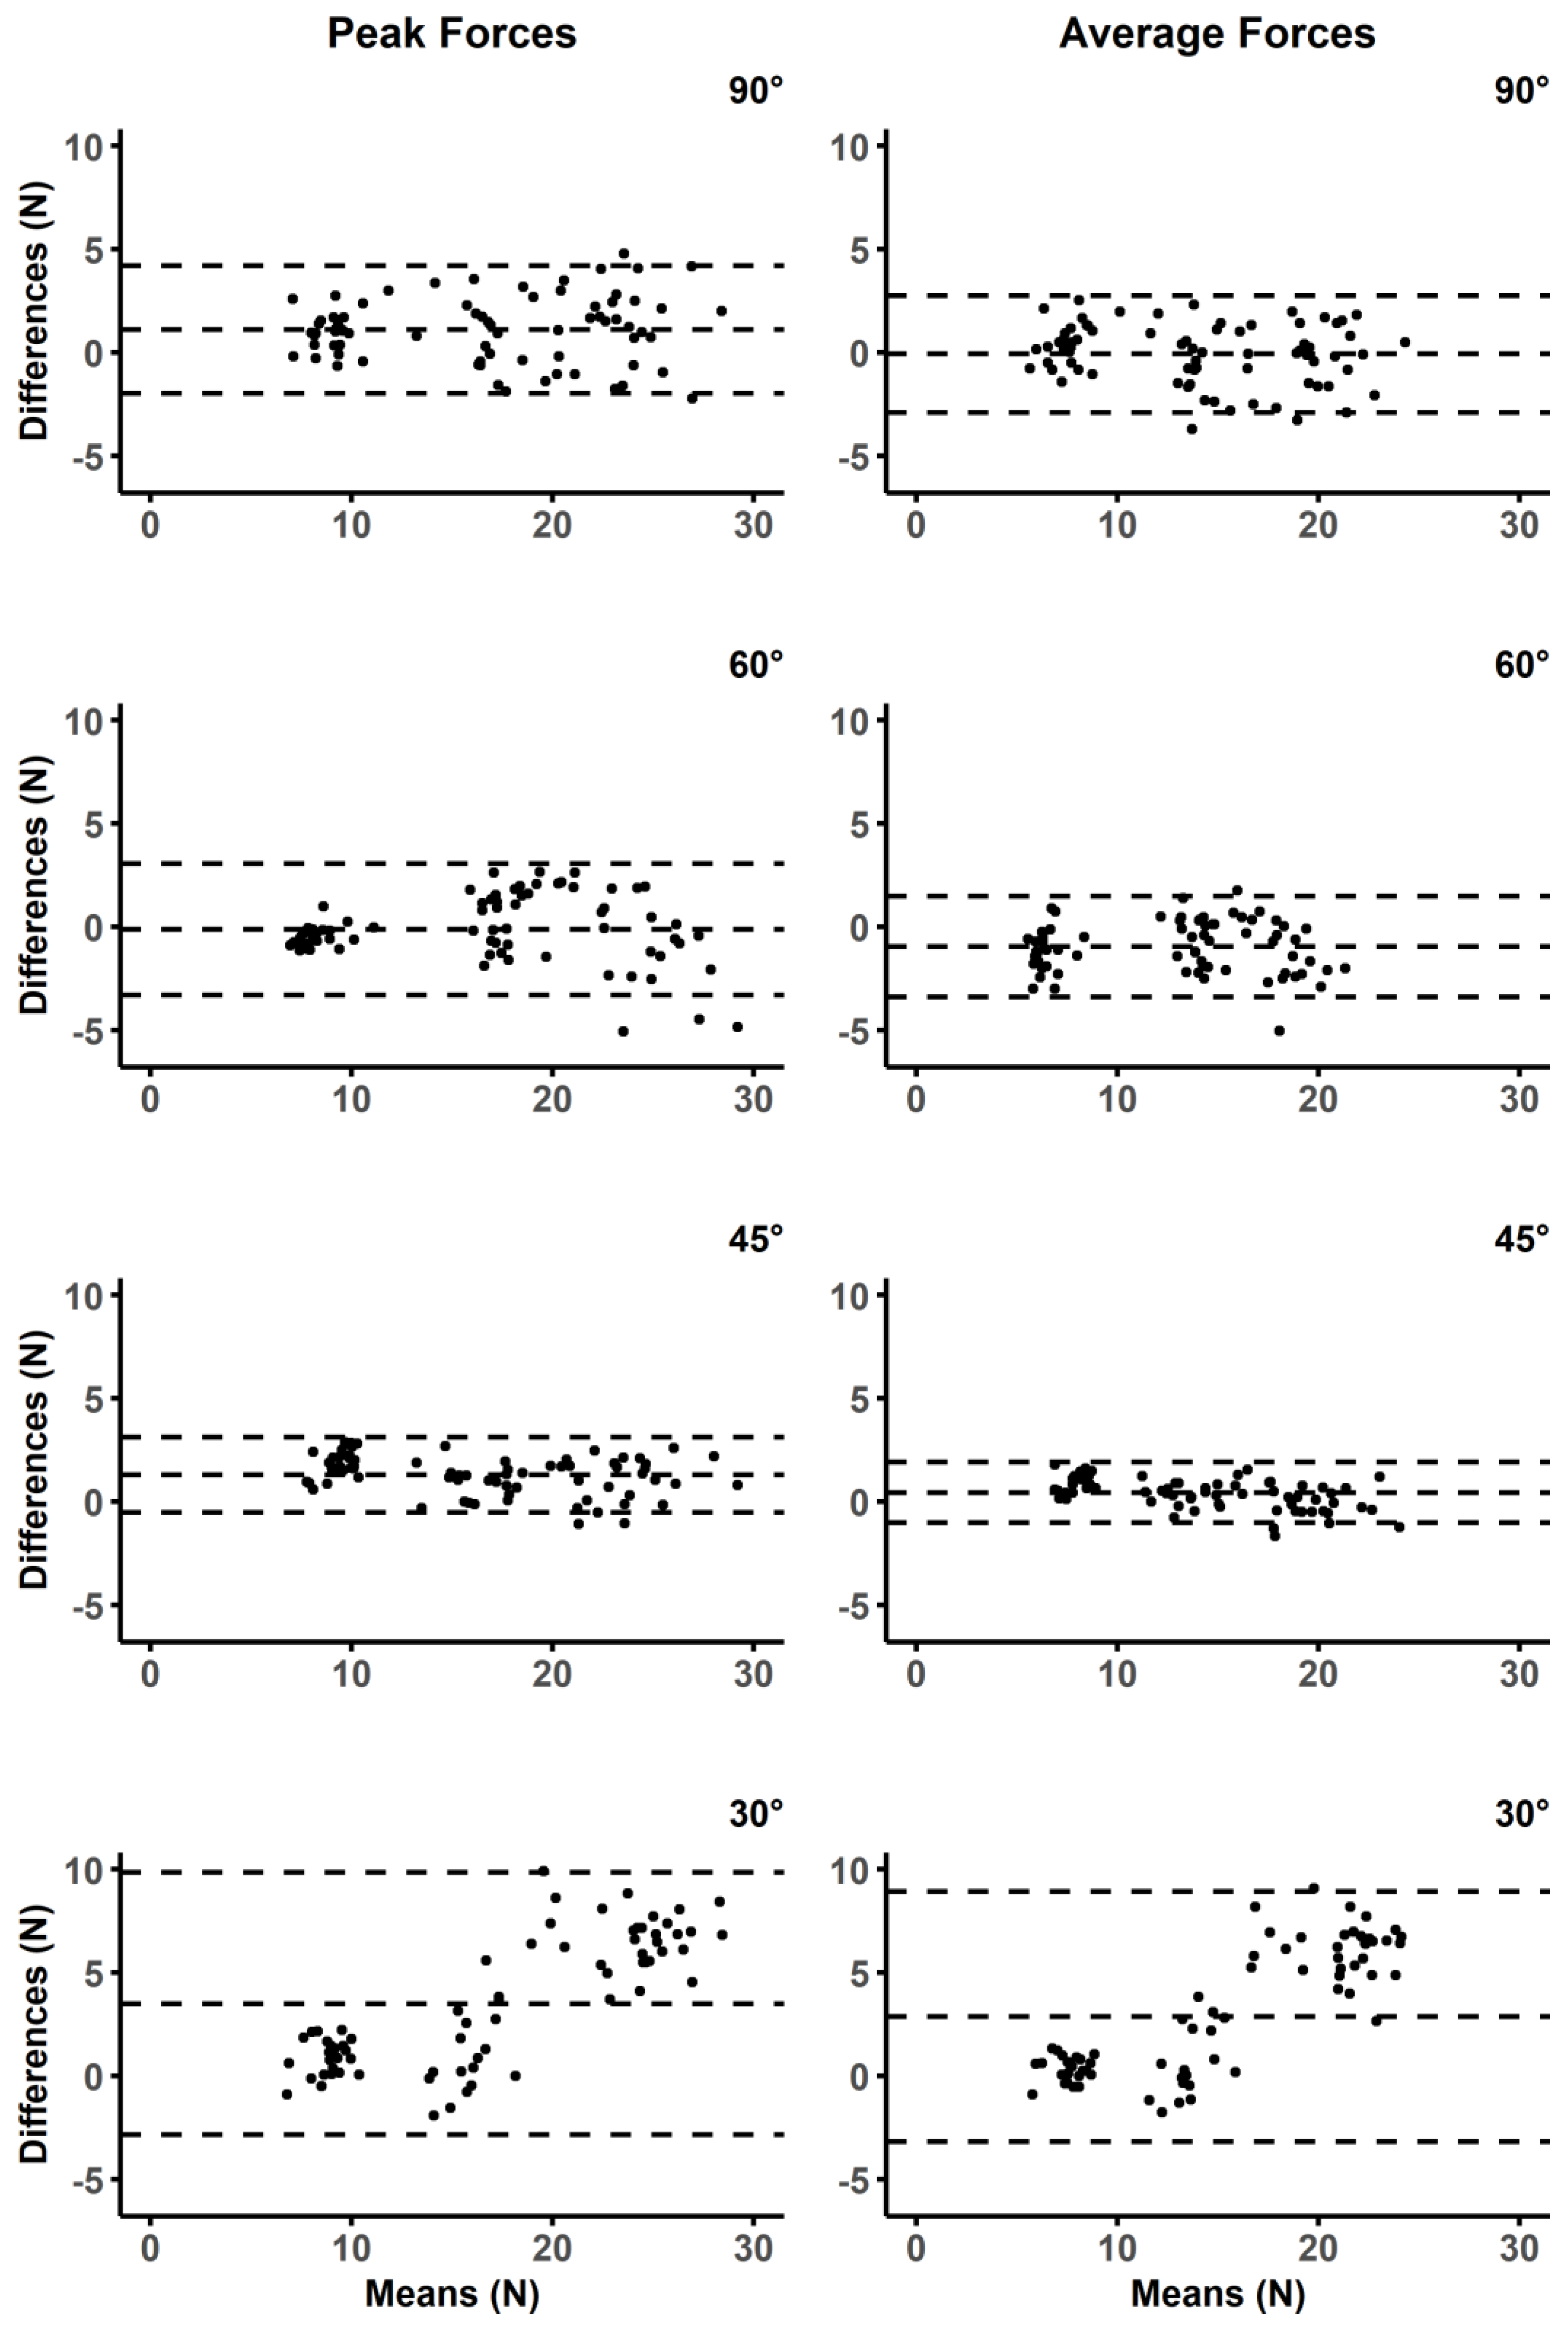
Figure 1. Images of the setup including the ELF system attached to the instrument and skin simulant attached to the force plate.
Biomed 04 00008 g001
Figure 2. Image of multipoint calibration from the Tekscan software (version 4.3). The Y-axis represents the amount of force in newtons that was input from the force plate readings. The X-axis is representative of the change in millivolts from the ELF sensor.
Biomed 04 00008 g002
Figure 3. Flow chart overviewing procedures (delineated in bold) and analysis techniques for instrument calibration, calibration validation, and the simulated treatment validation.
Biomed 04 00008 g003
Figure 4. Bland Altman plots for peak and average forces at four different instrument angles. The middle of the dashed lines for each plot represents the mean difference, and the upper and lower dashed lines display the limits of agreement.
Biomed 04 00008 g004
Figure 5. Plots of linear models and color matched R2 values for five separate strokes from each of the four different instrument angles.
Biomed 04 00008 g005
Figure 6. Plots of descriptive data from the force plate averaged from five simulated treatment strokes each normalized to 100 data points. The three forces that make up the resultant force (i.e., Fx [anterior/posterior], Fy [horizontal], and Fz [vertical]) were divided as a percentage of the overall resultant force.
Biomed 04 00008 g006
Table 1. Results of interclass correlation coefficients (ICC), their 95% confidence intervals (CIs), and Bland Altman plot statistics including mean differences and 95% limits of agreement (LOA).
AnglePeak ForcesAverage Forces
ICC (CIs)Mean Diff. (LOA) (N)ICC (CIs)Mean Diff. (LOA) (N)
900.95 (0.86−0.98)1.10 (−1.89, 4.19)0.97 (0.94−0.98)−0.06 (−2.89, 2.75)
600.97 (0.95−0.98)−0.12 (−3.30, 3.04)0.95 (0.82−0.98)−0.95 (−3.40, 1.48)
450.97 (0.49−0.99)1.29 (−0.53, 3.11)0.98 (0.96−0.99)0.44 (−1.03, 1.91)
300.80 (0.18−0.92)3.49 (−2.84, 9.83)0.80 (0.31−0.92)2.87 (−3.16, 8.91)
Disclaimer/Publisher’s Note: The statements, opinions and data contained in all publications are solely those of the individual author(s) and contributor(s) and not of MDPI and/or the editor(s). MDPI and/or the editor(s) disclaim responsibility for any injury to people or property resulting from any ideas, methods, instructions or products referred to in the content.

