Abstract
The dynamic behaviour of a spring-mounted symmetrical NACA0012 wing in a freestream flow of air is studied in the pre-stall region, over 0° to 12° angles of incidence. The primary aim of this work is for use within the automotive sector to reduce drag and fuel emissions. However, this work will also be of interest in the motorsport sector to improve performance, and also have some applications within the aerospace and renewable energy sectors. The general operation of the concept has previously been verified at these low angles in the pre-stall region with that of a theoretical estimation using finite and infinite wings. This paper provides a numerical solution of the same problem and is compared with the previous experimentation. At these low angles, the computations yield a dynamic response settling into a static equilibrium. The stable solutions match the start of a steady regime well, when compared with the experiment. The trends are also comparable with the experiment, but the velocities at which they occur are underestimated in the computation. The computations demonstrate a drag reduction of 59% when compared to a fixed wing, whereas the lift remains stable at a near constant value with increasing wind speed. Thence, downforce is maintained whilst drag is reduced, which will facilitate higher speeds on the straight whilst maintaining vehicle direction stability. Limitations to this proof-of-concept work are highlighted and future development work is suggested to achieve even further increases in performance.
1. Introduction
If a fluid in motion contacts the surface of a solid, the flow is diverted, and if the structure of the solid is not rigid enough, an interaction is found. The governing equations of fluids and of structures can be utilised to define the fluid structure interaction (FSI). Understanding these interactions is essential in solving many difficult engineering problems. Designing a structure to withstand aerodynamic loads is a problem many engineers face [1], and it is made even more complex if the structure interacts with the fluid. An example is the Tacoma Narrows Bridge, whereby the structure collapsed due to the failure to consider the effects of fluid structure interaction [2]. With structures, such as the bridge, designs can be engineered accurately using mathematical modelling processes with discretised approaches. Szabó and Györgyi [3] and Zhang et al. [4] show the importance of modal analysis, where structures’ resonating frequencies are determined. These two papers show how failures can be prevented by using a Computational Fluid Dynamics (CFD) simulation coupled with modal analysis.
The use of CFD software has increased dramatically, and their modelling capabilities have also improved in complexity. Lee et al. [5] show how the bending and twisting characteristics of wind turbine fan blades are identified. Knight et al. [6] have shown how different material properties effect the FSI of a hydrofoil. These additional modelling complexities are also seen in work by Garelli et al. [7] and Pelosi [8]. These show the FSI of a rocket take-off and internal combustion engine respectively. From these papers and many others, the performance and adaptability of CFD software to solve modern physics problems is gaining in accuracy and growing in use.
The development of car aerodynamic devices began in the 1960s [9]. In 1966, the Chaparral 2E debuted in the Can-Am racing series, featuring an inverted airfoil mounted on two tall struts that were mounted on the suspension [10]. Mounting directly to the suspension hub carriers meant that the downforce produced from the wing pushed down directly onto the rear wheels, greatly increasing the grip of the tyres [11]. Another feature of the massive wing on the Chaparral 2E was a pedal in the driver’s cockpit that could alter the angle of attack for the wing [10]. If the driver was to fully depress the pedal, the wing would be held in a flat, low-drag position to maximise straight line speed. For braking and cornering, the pedal would be released back up, increasing the angle of attack and thus producing more aerodynamic downforce to increase the car’s grip, thereby increasing cornering speeds [12]. This active aerodynamic concept was so successful that it was banned the following year. However, the use of fixed wings was allowed. In 1968, the Lotus F1 Team produced a car design including fixed front wings and a spoiler in the Monaco grand prix [13]. Since then, extensive research has led to the development of aerodynamic devices resulting in greater race car performance year on year.
Flow separation occurs at the rear of vehicles, due to the sudden change in profile resulting in a wake [14]. Streamlining vehicles helps delay the flow separation, resulting in a smaller wake, which leads to decreased fuel consumption and increased vehicle performance [15]. Spoilers and wings can also be used at the rear of road and motorsport vehicles to reduce the size of the wake and the resulting drag caused by flow separation. In addition, the flow over the wing or spoiler adds to the downforce, enabling the car to stick to the ground more, so that corners can be taken faster, resulting in lower lap times. Buljac et al. [16] used a BMW E38 as a test vehicle. Different wing heights were tested and simulated in CFD to find the optimal height for a fixed wing to be set at. They found for this car that 39% of the distance between the upper surface of the boot lid and the vehicle roof was optimal as it offered the best downforce-to-drag ratio of 0.57 [16]. As this study used a fixed wing, an optimal solution had to be found to balance both drag and downforce. Diffusers placed underneath at the rear of race cars can also be used to further reduce drag and at the same time increase downforce [17].
Ideally, racing cars would have a high downforce around corners and low drag on the straight. Similarly, production cars should have enough downforce to be stable and low drag to reduce fuel consumption. These requirements can be at odds with each other, and so a compromise is usually required. However, with moveable aerodynamics surfaces such as that used on the Chaparral 2E and, more recently, with the drag reduction system (DRS) used in Formula 1 racing [18], optimised scenarios can be found for both driving conditions. Both of these systems are classified as active aerodynamic devices, as an external input is required to activate them.
Over recent years, there has been a rise in the usage of active aerodynamic devices or systems, developed to be electronically linked to the vehicle’s computer to receive information for when and how to move to alter the aerodynamic profile [12]. These systems can alter a vehicle’s overall aerodynamic shape to make the vehicle more fuel efficient, increasing the range a vehicle can travel [12]. Active systems are also capable of improving braking and cornering by altering the angle of attack and height of the wing [10]. The nature of the system being electronically altered means that there is a large cost to developing, fitting and repairing the systems themselves. Furthermore, an electronically controlled active rear wing will add more weight than a fixed wing, due to the extra components required. A passive wing system could be considered to overcome the cost and weight issues, while retaining most of the benefits of an active wing system. A passive system requires no external input and responds automatically or naturally. For the same problem, passive systems can be flexible wings or spring-mounted wings that are designed to deform at given velocities.
Experimental results of a passive spring-mounted wing are presented by Knight [19]. In this experiment, an NACA0012 airfoil is mounted on a rod (as shown in Figure 1a) in which a torsion spring is attached. The airfoil is rotated to a certain preload angle and held in place using a pin, which holds the airfoil at an initial incidence of 40° as shown in Figure 1b. The whole rig shown in Figure 1b is inserted into the wind tunnel, and testing is performed by slowly increasing the windspeed. Eventually, the aerodynamic force on the airfoil becomes larger than the resistive force in the spring due to preload, so that the airfoil reduces its incidence. Thence, a new equilibrium is found, and the airfoil is no longer in contact with the pin. Thereafter, with further increases in windspeed, the angular deflection of the airfoil is further reduced, at the same time as the torsion in the spring is further increased. The experiment demonstrated the effect of different spring preload torque settings on the behaviour of the wing and the resultant incidence of the airfoil with different air velocities. An increase in the spring preload torque required a larger air velocity to generate more force to rotate the airfoil. This is as expected and quantified by Knight [19], providing a benchmark which can be used to compare numerical results with.
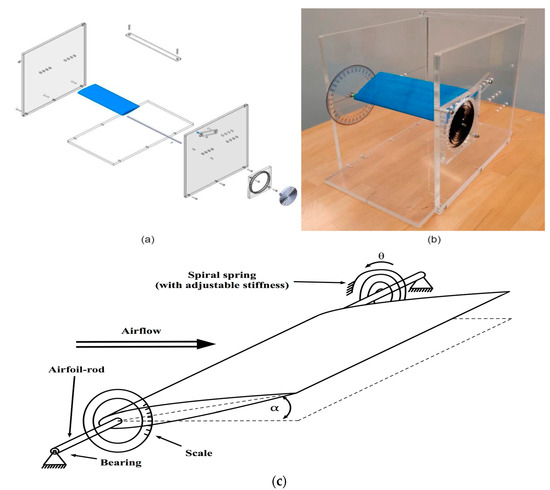
Figure 1.
Experimental setup (a) exploded view in CAD, (b) photo, (c) schematic [19], © SAE International.
Symmetrical airfoils do not produce any lift at 0°; hence, the airfoil could not achieve an angle of 0°, because an aerodynamic force is still required to overcome the spring torque. Each spring torque showed a similar trend in the resulting incidence, α, of the airfoil which is shown in Figure 2. In steady state, Newton’s third law is maintained, so that the spring torque is balanced with the lift and drag forces produced from fluid flow, as well as the weight of the airfoil. As a result, incidence can be maintained within both the pre- and post-stall regions, below an approximate 12 degree angle and above a 20 degree angle, respectively [19]. At angles within 12 and 20 degrees, the NACA0012 airfoil is in the stall region where periodic unstable motions are found [19]. In this work, the spring is purely an element connected to a rigid wing to demonstrate the FSI. However, the spring can also serve to simulate the stiffness of a real wing system with flexibility due to material properties.
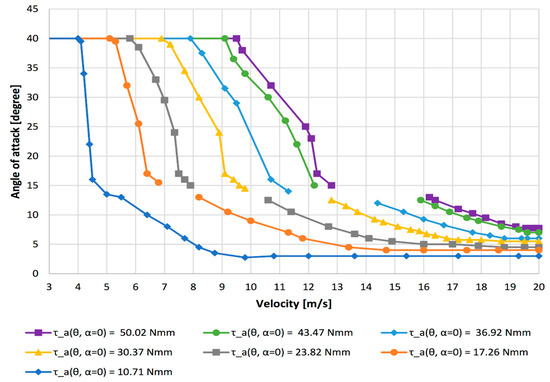
Figure 2.
Experimental angle of incidence response for various spring preloads of NACA 0012 wing mounted at 10% chord [19], © SAE International.
The main aim of the work presented herein is to replicate the results from the experiment by Knight et al. [19] using a numerical approach with CFD simulation software. In doing so, using this novel approach, the secondary aim is to characterize the system in respect to changes in downforce and drag, which will be discovered as part of the simulation. In addition, our third aim is to prove the novel concept of a flexible wing system to provide constant downforce, promoting stability whilst at the same time reducing drag, to improve fuel economy or increase top speeds.
The methodology is first described, followed by results for various simulated preload spring angles using CFD. A comparison is then made between the simulated and experimental results for two of the preload angles. The results are then compared to a wing of fixed incidence in order to assess the performance enhancement using the torsion spring approach. The coefficient of lift (CL), downforce, coefficient of drag (CD), drag and downforce-to-drag ratios are presented to allow comparisons between a fixed wing and two flexible springed wings. Finally, limitations and future work are highlighted.
2. Methodology
2.1. Geometry
All of the known conditions used in the experiment [19] are matched in the computational approach. The test section of the wind tunnel is used as the boundaries of the computational domain. The height of the fluid domain was set to 0.334 m, corresponding with the experiment, and the distance from the inlet and outlet to the airfoil set at 0.2 m and 0.5 m, respectively. The width of the fluid domain was set at 0.124 mm to match half the width of the wind tunnel test section. The airfoil was created within the STAR CCM+ 3D CAD section [20]. The NACA0012 airfoil was chosen as it has been used widely in many research papers, so that comparisons can be made. The coordinates for the NACA0012 airfoil were obtained from airtools [21]. The same chord length of 0.1 m is used, which is identical to the one used in the wind tunnel experiment by Knight [19]. The airfoil contained 200 geometric points and was imported at x and y coordinates of −0.01 m and 0 m, respectively. This allowed the airfoil to rotate at the rod location by simply rotating the plane about its origin (0 m, 0 m). The airfoil extended to 0.01 m from the edge of the domain, allowing for flow around the wingtip as found in the experiment.
2.2. Numerical Modelling
The inlet was set 0.2 m upstream of the airfoil and specified as a velocity inlet boundary, which varied from 4 to 15 m/s. The outlet was set 0.5 m downstream of the airfoil and was specified as a pressure outlet boundary with a 0 Pa gauge pressure. The 3D simulation used a symmetry plane halfway across the airfoil. The use of a symmetry plane in this method is common and reduces the computational expense of simulating the full wing in wind tunnel geometry [22]. The symmetry plane was specified as a slip wall boundary. All other boundaries of the domain, which include the wind tunnel walls and the airfoil itself, were set to non-slip wall boundaries. The exact density and viscosity of air in the experiment is not known, so standard ISA conditions of 1.226 kg/m3 and 1.784 × 10⁻⁵ kg/ms, respectively, are used to calculate the Reynolds number (Re) according to Equation (1),
where is the density of air, is the freestream velocity, is the chord length and is the viscosity of air. The highest Reynolds number in the computation is found using the highest inlet velocity, which is 15 m/s. Using the chord length of 0.1 m as the characteristic length in Equation (1) results in a Reynolds number of 103,000. Hence, over most of the airfoil over most of the flow speeds, the flow will be laminar, so all of the simulations used the same laminar flow model [23] throughout, over an NACA0012 airfoil with inlet velocities between 4 m/s and 15 m/s. The Navier–Stokes equations were solved within Star CCM+ using second-order upwind spatial discretization, as it provides enhanced accuracy by applying Taylor series expansion in order to achieve more accurate values at the cell faces, instead of assuming that the cell centroid and faces have the same value as in the first-order upwind [24]. Initially and to validate the mesh, the simulation was run steady state for the static wing using the SIMPLE scheme [25]. Thereafter, the same mesh was used for the transient fluid–structure interactions with the PISO scheme [25]. A range of timesteps were run to resolve the FSI but at reasonable computational cost. An arbitrary timestep of 0.001 s was found to be a suitable compromise to provide a stable solution.
2.3. Modelling Assumptions
The wing in the experiment was 3D-printed and sanded to a smooth finish. Its chord was 0.1 m, with a span of 0.228 m. The weight of the airfoil was 119.3 g with a centre of gravity (CoG) determined to be at 42.4% of the chord or 0.0424 m from the wingtip. The experiment used angles ranging from 0 to 40 degrees incidence [19], but only the pre-stall region of below 12 degrees is considered in the computational work presented herein. Simulations were conducted at higher angles than 12 degrees and found to diverge. The natural frequency of the system is crucial in understanding the dynamic motions of the springed wing system. This is particularly important in the stall region, where large dynamic motions persist. For all simulations reported here, the solutions are stable and converge to a static equilibrium. The natural frequency will have an effect in the pre-stall region reported here, but the oscillations are quickly damped and a static equilibrium is found. Further work in this regard is suggested but beyond the scope of this current work. The primary importance here is to demonstrate the computational approach and show the lift and drag characteristics to prove the concept, so, to simplify the approach, the natural frequency is not considered in this work. The objective here is to achieve a stable solution to match the experiment, which is also shown to be stable below 12 degrees incidence.
2.4. Mesh
Both background and overset [26] mesh types were created with base sizes of 0.05 m and 0.0025 m, respectively. Both background and overset meshes can be seen in Figure 3a,b. The mesh of the domain at the longitudinal centreline is shown in Figure 3a, and a zoomed-in section around the airfoil is shown in Figure 3b. Two refinement zones, which can be seen Figure 3a, were created around the airfoil to concentrate the resolution on the airfoil surface. A third refinement zone was created around the nose of the airfoil, as can be seen in Figure 3b. A prism layer mesh over the airfoil was also created and tested, but was found to be unstable above 5 degrees incidence for the FSI reported later. To be consistent, we used the same polyhedral mesh throughout, with 5 million cells. Two coarser mesh variations were created in order to review the effects of mesh refinement within the simulation and were found to be within 3% for lift and drag. The authors note that further refinement is necessary to achieve greater accuracy. Nevertheless, for the purpose of this study involving a fluid–structure interaction, we proceeded and deem the results to be suitable to demonstrate the computational methodology.
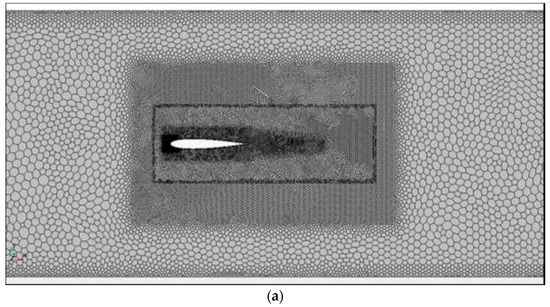
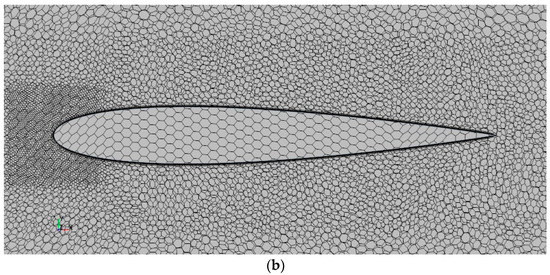
Figure 3.
Mesh of NACA0012 wing: (a) whole domain at centreline, (b) zoomed-in section.
The lift (L) and drag (D) are defined in Equations (2) and (3) respectively.
where CL and CD are the coefficients of lift and drag, respectively, and A is the reference area, which is the span x chord and equal to 0.0228 m2. The density of air and velocity are used within the Star CCM+ CFD software version 12 to generate the CL and CD values. The mesh we used gave CL values between 0.6 and 0.7, depending on the Reynolds number. The CD values were found to be between 0.04 and 0.07, or between 40 and 70 drag counts, depending on the Reynolds number. This correlates reasonably with the two-dimensional numerical data of Jain [27], where the coefficients of lift and drag or drag counts at 10 degrees were found to be 1.07 and 0.02 or 20 drag counts, respectively. Our results are slightly lower for lift and higher for drag. This is as expected due to a loss of flow around the tip, leading to reduced lift and increased drag.
2.5. Fluid–Structure Interaction Modelling
The solver settings were then modified to support the motion of the airfoil and the effect of the spring force. In order to do so, a Dynamic Fluid Body Interaction (DFBI) was created which allows the user to specify rotation as a degree of freedom and implement torsion spring settings [26]. Within the DFBI settings, the mass moment of inertia, spring constant and relaxation angle all need to be defined in order to run the simulation. The spring constant and relaxation angle, which corresponds to the preload angle, are obtained from the experimental report [19] and matched in our computation. However, the mass moment requires calculation in order to be defined. The mass moment of inertia was calculated using the CAD software package Creo version 9.0 [28]. The geometry was first imported, then extruded, and a coordinate origin was created at the point of rotation of the airfoil. The density of the solid airfoil was adjusted in the material properties section, so the mass of the airfoil matched that of the experiment [19], which was 0.1193 kg. Then, through selecting the coordinate system as the material property reference, the inertia tensor is provided. The mass moment of inertia was determined to be 1.862991 × 10⁻⁴ kgm2. The torsional spring constant was found in the experiment [19] by loading the spring, starting at the lowest preload to compensate for the gravitational force of the wing. The spring preload is then raised incrementally in steps of 40°. The results are fitted by a linear function in Python and extrapolated. From this, numerical values of both the torsional spring constant and the zero point of the angle can be derived. The gradient of the linear function, and hence the torsional spring constant, was found to be κ = 0.1638 Nmm/degree, which is 9.385048684 × 10⁻³ Nm/rad. Preload angles were simulated in the range of 296.7 to 536.7 degrees, which corresponds to the 10.71 to 50.02 Nmm torque reported in the experiment [19]. The weight of the airfoil is 0.1193 kg and is considered in the experiment and in the computation. A summary of all the parameters used in the computation is shown in Table 1.

Table 1.
Summary of parameters used in computation.
3. Results
3.1. Initial Findings
The velocity was set at 12 m/s, corresponding to a Reynolds number of 82,000, and the preload set to 536.7 degrees. The simulation started with an initial angle of 8 degrees. The resulting simulation converged, with the airfoil remaining in a steady equilibrium of 4 degrees. The resulting computation is shown in Figure 4 for velocity magnitude at the centreline of the wing.
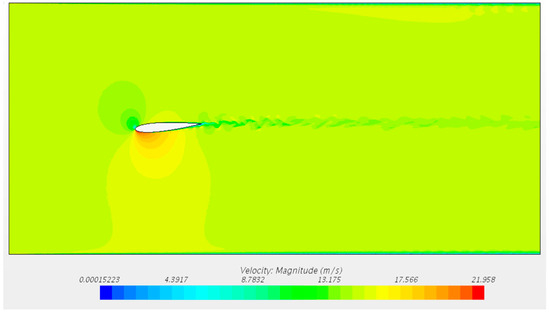
Figure 4.
Velocity magnitude plot at centreline of wing with 4-degree incidence.
In this simulation, at this angle, the elastic forces from the preload and torsion resistance of the spring are balanced by the aerodynamic forces at this particular windspeed. This three-dimensional simulation includes a 10 mm gap between the airfoil and wind tunnel wall to match that of the experiment. The streamlines close to the wingtip are shown in Figure 5. These streamlines capture the small, swirling nature of the wingtip vortices and downwash produced from the airfoil trailing edge.
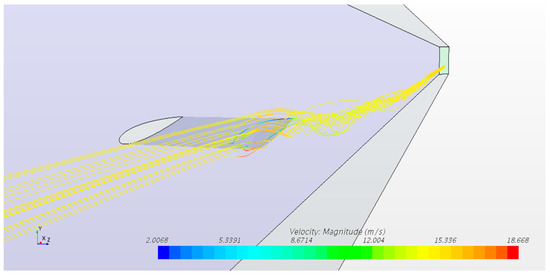
Figure 5.
Streamlines around tip of wing with 4-degree incidence.
3.2. Variation of Preload
The velocity was then varied between 4 and 15 m/s, corresponding to Reynolds numbers between 27,000 and 103,000. The starting angles were also varied. The spring constant was kept at 9.385048684 × 10⁻³ Nm/Rad, whilst the preload was reduced to 296.7 in 40-degree increments. The results are presented in Figure 6 and show the response of the incidence angle under an increasing velocity of airflow for the NACA0012 airfoil at a 10% chord mounting position for various spring preloads. In all cases, the incidence decreases as the velocity increases. This is expected, as the aerodynamic centre is always behind the elastic axis or centre of rotation. Simulations were also run with angles higher than 12 degrees, but the solutions were found to be unstable. The starting angle for the lowest preload had to be below 10 degrees, as shown in Figure 6.
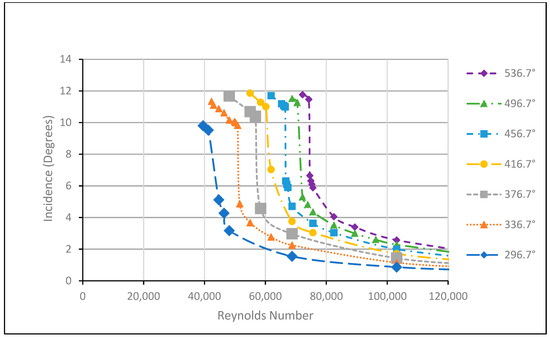
Figure 6.
Computed incidence response for various spring preloads of NACA0012 airfoil pivoted at 10% chord.
From Figure 6, it appears that each set of results, regardless of preload, follow a similar trend, with higher velocities required to alter the incidence at higher spring preload values and as such, larger spring torques. This is due to the increase in moment required to overcome the torque applied from the spring. For all results, the initial gradient in incidence is shallow, followed by a steep drop, and then flattens out at higher windspeeds. Due to the symmetry of the airfoil, the lift coefficient at 0° is equal to 0, so the incidence will not reach 0° in theory, and this is supported by the computational data shown in Figure 6. This is because aerodynamic force, in this case negative lift or downforce, is required to achieve the equilibrium of the system and balance the torque applied from the spring. Furthermore, at the largest velocities tested, the resultant incidence is higher for the larger spring constant values. This is due to the increase in aerodynamic force required for the same change in the incidence achieved by the airfoil.
3.3. Validation with Experiment
The preload angles of 296.7 and 376.7 degrees are compared with the experiment in Figure 7. The 296.7 and 376.7 degrees preload angles correspond to the 10.71 and 23.82 Nmm torques, respectively, that are reported in the experiment and Figure 2 [19].
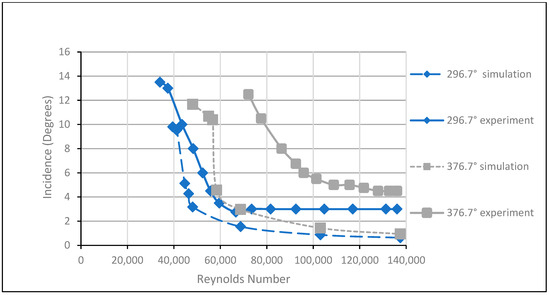
Figure 7.
Comparison of predicted and experimental results for incidence response for two spring preloads of NACA 0012 wing.
For the lower preload of 296.7 degrees, the gradient of incidence is similar but the computation underpredicts the velocity when compared to the experiment. At higher windspeeds, the computation demonstrates further reductions in incidence angles as expected, but this is not evident in the experiment. The larger preload of 376.7 degrees exhibits similar trends in both the experiment and computation, but likewise with higher velocities needed in the experiment to achieve the same incidence angles. This is expected, as a larger air flow velocity is required to overcome the larger torque generated by the larger preload. However, with the increased preload, the computation more significantly underestimates the velocities required to achieve a certain incidence when compared to the experiment. The differences are believed to be due to local mesh resolution on the surface of the airfoil and not modelling bearing friction within the computation. Possible inaccuracies in the modelling of the spring constant or preload must also be examined. Further work is needed to provide an improved correlation, particularly at higher spring preloads. Nevertheless, we use these results as indicative, to highlight the effects on downforce and drag. Hence, a comparison using the lift and drag results of the computation with both stationary and spring-mounted simulations is next presented.
3.4. Variation of Downforce
The static wing simulations are at a fixed angle of 10.5 degrees and are compared with the springed wing, using the same overset mesh setup and model properties. The comparison includes the spring setting preloads of 296.7 and 376.7 degrees and is compared to a static wing at a fixed incidence of 10.5 degrees. The results are shown in Figure 8 for the lift coefficient and Figure 9 for downforce.
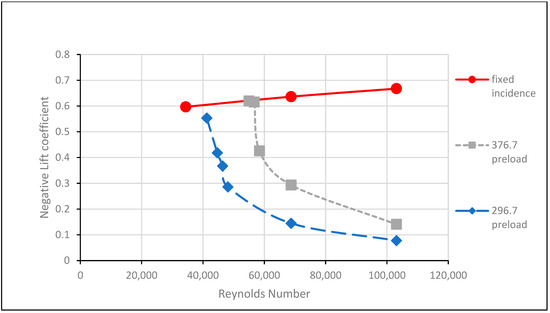
Figure 8.
Comparison of negative lift coefficients for fixed and springed wings.
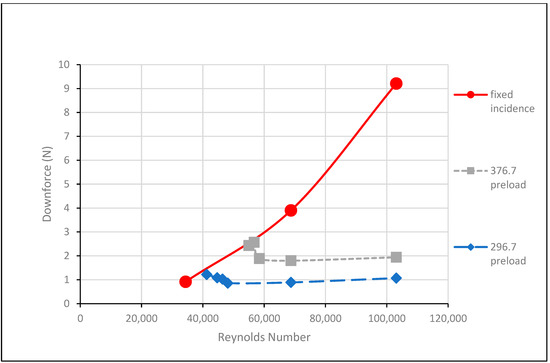
Figure 9.
Comparison of downforce for fixed and springed wings.
The negative lift coefficients can be seen to reduce in size in Figure 8 for both springed wings at higher Reynolds numbers, when compared to the static wing. The reduction is at lower Reynolds numbers for the lower spring preload, as expected. These reductions result in an initial decrease in downforce over a short Reynolds number range. Thereafter, the downforce then remains near constant at higher Reynolds numbers, as can be seen in Figure 9. Hence, the downforce is maintained with both springed wings, whereas the downforce increases with the Reynolds number for the static wing. The amount of spring preload is shown to be relative to the amount of downforce for a given flow speed or Reynolds number.
3.5. Variation in Drag
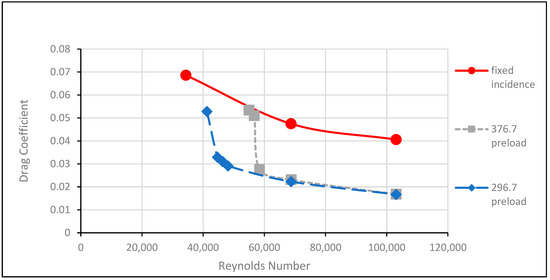
Figure 10.
Comparison of drag coefficients for fixed and springed wings.
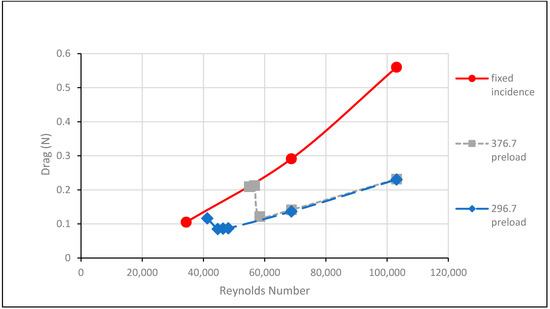
Figure 11.
Comparison of drag for fixed and springed wings.
The drag coefficients in Figure 10 follow a similar pattern to the lift coefficients. A sharp reduction is found initially, before flattening out at higher Reynolds numbers. These decreases also give rise to a sharp reduction in drag over a small range of Reynolds number, as shown in Figure 11. Thereafter, unlike the downforce, the drag increases, but at a lower rate when compared to the static wing. The onset of drag reduction occurs at a lower speed with the lower preload angle but appears to be consistent with the larger preload angle at higher speeds. The profile drag for both springed wings is less than that for the static wing, due to the reduced incidence. However, the skin friction drag is similar for all wings and increases with speed, as is eluded to in Figure 11.
3.6. Efficiency
The lift-to-drag or downforce-to-drag ratio is a measure of efficiency and is shown in Figure 12.
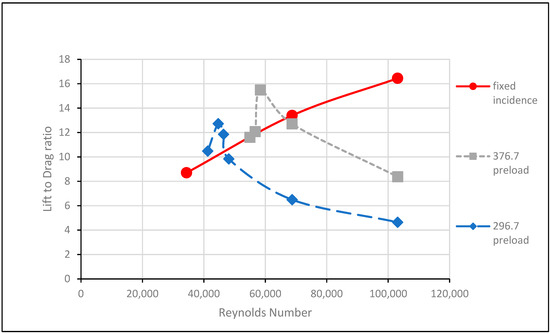
Figure 12.
Comparison of downforce-to-drag ratios for fixed and springed wings.
The downforce-to-drag ratios are shown to be improved compared to the fixed wing at the onset of spring motion, as can be seen in Figure 12. This is due to the initial steeper reduction in drag when compared to downforce. However, the improvement is over a small range of Reynolds numbers. This could lead to the tailoring of a spring preload angle to give an increase in efficiency at a particular Reynolds range. Thereafter, the downforce-to-drag ratios decrease for both springed wings when compared to the static wing. Hence, the springed wings are found to be less efficient over a certain Reynolds number.
4. Discussion
The numerical results presented herein demonstrate similar trends in the incidence response of the NACA0012 airfoil when compared to the existing experimental data [19]. However, the numerical results from all the spring-mounted simulations underpredict the velocities at which equilibrium is found, when compared to experiment. Hence, a lower angle at the same Reynolds number is found in the simulation when compared to the experiment. The simulation captures the response reasonably well at the lowest preload investigated, resulting in reasonably accurate lift and drag values. However, the simulation does not accurately capture the response at the higher preloads tested, and hence the lift or drag forces acting on the airfoil will not be as accurate and are presumed to be higher in reality. Changes to the methodology are required to attain results that correspond with improved accuracy to the experimental values. Nevertheless, regardless of the inaccuracy in preload, the incidence response is demonstrated to exhibit similar behaviour. Both the numerical and experimental results show that increasing spring preloads require increased air velocities to pivot the airfoil about the mounting point.
The coefficients of lift and drag and the aerodynamic forces at two spring preloads are presented, to show the difference in performance due to the value of spring preload. The lift and drag values are compared with static wings and shown to be more aerodynamically efficient over a small range of Reynolds numbers. At higher flow speeds, the downforce is shown to be near constant around 1 N with changes in velocity and much smaller when compared to the fixed-incidence wing. The reduction in downforce for springed wings with preloads of 296.7 degrees is 77% at a Re of 68,000 and 88% at a Re of 103,000, when compared to the fixed wing. The drag is also smaller but increases with flow velocity, with reductions of 53% at a Re of 68,000 and 59% at a Re of 103,000. Therefore, in principle, the use of a spring-mounted wing on a vehicle is shown to improve performance in a straight line, by maintaining downforce whilst reducing drag.
Further investigations are needed to scale these findings and find out the cause of the inaccuracies between the numerical and experimental results. Improvements in accuracy, particularly at higher preloads, are needed to confirm these trends. The use of a transition model may provide more accurate results [29] and can be used to model a Laminar Separation Bubble (LSB) presence, which may lead to differences in results [30]. The uncertainty in the spring settings should be explored to assess its sensitivity, which could lead to fine tuning the spring settings, which may further result in greater accuracy.
Further work is recommended, running simulations using different mounting point locations to validate the trends found Knight [31]. Furthermore, CFD validation can also be carried out to examine the behaviour of a cambered airfoil [31]. After validation at these low angles, it is recommended to model and investigate the post-stall region, as well as the stall regions where the airfoil exhibits sustained dynamic behaviour, as found by Knight [19]. This could possibly result in further increases in lift and drag, albeit of a transient nature. After improved validation of the methodology, the design of a spring-mounted wing system for a specific vehicle can be considered. Perhaps even simpler, the design of a wing using certain materials with specific properties of elasticity could also be considered.
5. Conclusions
A numerical model has been shown to replicate the fluid–structure interaction of a spring-mounted wing. Downforce is held as near constant, whilst drag is reduced by 59%. Efficiency is shown to improve over a small range of Reynolds numbers. Computations in the near-stall region and angles above 12 degrees are found to be numerically unstable. In essence, they are periodic and exhibit similar behaviour to that shown in the experimentation. The transient limitations associated in the near-stall region with variations in spring loading and flow velocities are highlighted and found to be slightly lower in the numerical simulation when compared to the experiment. This work provides a valuable insight into a novel concept, but we only recommend its use in the pre-stall region to achieve dynamically stable results. Use at higher angles is only recommended if dynamic effects are acceptable, with potentially further increases in overall performance, albeit of a transient nature.
Author Contributions
Conceptualisation, J.K., J.P. and H.P.-E.; methodology, J.K., J.P. and H.P.-E.; software, J.P. and H.P.-E.; validation, J.K., J.P. and H.P.-E.; formal analysis, J.K., J.P., H.P.-E., S.F., D.M. and A.L.; investigation, J.K., J.P. and H.P.-E.; resources, J.K.; data curation, J.K., J.P., H.P.-E., S.F., D.M. and A.L.; writing—original draft preparation, J.K., J.P. and H.P.-E.; writing—review and editing, J.K., S.F., D.M. and A.L.; visualisation, J.K., S.F., D.M. and A.L.; supervision, J.K.; project administration, J.K. All authors have read and agreed to the published version of the manuscript.
Funding
This research received no external funding.
Data Availability Statement
The original data presented in the study are openly available at the University of Portsmouth. dataset_Knight_et_al_2024(.xlsx). https://doi.org/10.17029/7882ced3-6780-4aca-ad94-2c6e0f361845 (accessed on 4 July 2024).
Conflicts of Interest
Author Simon Fels was employed by the company MHP—A Porsche Company. The remaining authors declare that the research was conducted in the absence of any commercial or financial relationships that could be construed as a potential conflict of interest.
References
- Buresti, G. Vortex Shedding from Bluff Bodies. In Wind Effects on Buildings and Structures; Reira, J.D., Davenport, A.G., Eds.; Balkema: Rotterdam, The Netherlands, 1998; pp. 61–95. [Google Scholar]
- Morgenthal, G. Fluid-Structure Interaction in Bluff-Body Aerodynamics and Long-Span Bridge Design_Phenomena and Methods; University of Cambridge: Cambridge, UK, 2000. [Google Scholar]
- Szabó, G.; Györgyi, J. Three-dimensional Fluid-Structure Interaction Analysis for Bridge Aeroelasticity. In Lecture Notes in Engineering and Computer Science; Springer: Berlin, Germany, 2009; Volume 2179, pp. 1–81. [Google Scholar]
- Zhang, H.; Liu, L.; Dong, M.; Sun, H. Analysis of wind-induced vibration of fluid-structure interaction system for isolated aqueduct bridge. Eng. Struct. 2013, 46, 28–37. [Google Scholar] [CrossRef]
- Lee, Y.J.; Jhan, Y.T.; Chung, C.H. Fluid–structure interaction of FRP wind turbine blades under aerodynamic effect. Compos. Part B Eng. 2012, 43, 2180–2191. [Google Scholar] [CrossRef]
- Knight, J.; McConnell, M.R.; Ledger, A.; Azcueta, R. Fluid structure interaction of hydrofoils. In Proceedings of the ICMET Oman 2019—International Conference on Marine Engineering and Technology, Muscat, Oman, 5–7 November 2019. [Google Scholar]
- Garelli, L.; Paz, R.; Storti, M. Fluid-structure interaction study of the start-up of a rocket engine nozzle. Comput. Fluids 2010, 39, 1208–1218. [Google Scholar] [CrossRef]
- Pelosi, M. An Investigation of the Fluid-Structure Interaction of Piston/Cylinder Interface; Purdue University: West Lafayette, IN, USA, 2012. [Google Scholar]
- Rehnberg, S.; Börjesson, L.; Svensson, R.; Rice, J. Race Car Aerodynamics—The Design Process of an Aerodynamic Package for the 2012 Chalmers Formula SAE Car. 2013. Available online: https://www.sae.org/publications/technical-papers/content/2013-01-0797/ (accessed on 4 July 2024).
- Barnard, R.H. Road Vehicle Aerodynamics, 3rd ed.; Mechaero Publishing: St Albans, UK, 2010. [Google Scholar]
- Katz, J. New Directions in Race Car Aerodynamics: Designing for Speed, 2nd ed.; Bentley Publishers: Cambridge, MA, USA, 2008. [Google Scholar]
- Jung, F. All vehicles can benefit from active aerodynamics. ATZ Worldw. 2021, 123, 22–25. [Google Scholar] [CrossRef]
- Maughmer, S.S.; Lesieutre, G.A. Formula 1 Race Car Performance Improvement by Optimization of the Aerodynamic Relationship between the Front and Rear Wings. Master’s Thesis, Penn State University Libraries, State College, PA, USA, 2 December 2014. [Google Scholar]
- Cakir, M. Scholar Commons CFD Study on Aerodynamic Effects of a Rear Wing/Spoiler on a Passenger Vehicle. 2012. Available online: http://scholarcommons.scu.edu/mech_mstr/1 (accessed on 4 July 2024).
- Koike, M.; Nagayoshi, T.; Hamamoto, N. Research on Aerodynamic Drag Reduction. Mitsubishi Mot. Tech. Rev. 2004, 11, 49. [Google Scholar]
- Buljac, A.; Džijan, I.; Korade, I.; Krizmanić, S.; Kozmar, H. Automobile aerodynamics influenced by airfoil-shaped rear wing. Int. J. Automot. Technol. 2016, 17, 377–385. [Google Scholar] [CrossRef][Green Version]
- Knight, J.; Spicak, M.; Kuzenko, A.; Haritos, G.; Ren, G. Investigation of Vehicle Ride Height and Diffuser Ramp Angle on Downforce and Efficiency. Proc. Inst. Mech. Eng. Part D J. Automob. Eng. 2018, 233, 2139–2145. [Google Scholar] [CrossRef]
- GPfans.com. F1 DRS Explained: What Is Drag Reduction System and How Does It Work? 2024. Available online: https://www.gpfans.com/en/f1-news/102569/drs-f1/ (accessed on 9 May 2024).
- Knight, J.; Fels, S.; Haritos, G.; Carolus, T. Fluid-Structure Interaction of a Spring-Mounted Symmetrical Rigid Wing for Drag Reduction of Cars at Higher Wind Velocities. SAE Technical Papers. 2020, pp. 1–13. Available online: https://www.sae.org/publications/technical-papers/content/2020-01-5037/ (accessed on 4 July 2024).
- Siemens Digital Industries Software. Simcenter STAR-CCM+, version 2023.1; Siemens: Munich, Germany, 2023. [Google Scholar]
- Airfoil Tools. NACA 0012 AIRFOILS (n0012-il). Airfoiltools.com. 2019. Available online: http://airfoiltools.com/airfoil/details?airfoil=n0012-il (accessed on 4 July 2024).
- Narayan, G.; John, B. Effect of winglets induced tip vortex structure on the performance of subsonic wings. Aerosp. Sci. Technol. 2016, 58, 328–340. [Google Scholar] [CrossRef]
- Yousefi, K.; Razeghi, A. Determination of the critical reynolds number for flow over symmetric NACA airfoils. In Proceedings of the AIAA Aerospace Sciences Meeting, Kissimmee, FL, USA, 8–12 January 2018; Volume 210059, pp. 1–11. [Google Scholar] [CrossRef]
- Anderson, J.D.; Degroote, J.; Degrez, G.; Dick, E.; Grundmann, R.; Vierendeels, J. Computational Fluid Dynamics an Introduction, 3rd ed.; Wendt, J.F., Ed.; Springer: Berlin/Heidelberg, Germany, 2009. [Google Scholar]
- Jeong, W.; Seong, J. Comparison of effects on technical variances of computational fluid dynamics (CFD) software based on finite element and finite volume methods. Int. J. Mech. Sci. 2014, 78, 19–26. [Google Scholar] [CrossRef]
- Siemens Digital Industries Software. Introductory Guide to Overset Simulations 2020. Available online: https://community.sw.siemens.com/s/article/Introductory-Guide-to-Overset-Simulations (accessed on 4 July 2024).
- Jain, S.; Sitaram, N.; Krishnaswamy, S. Computational Investigations on the Effects of Gurney Flap on Airfoil Aerodynamics. Int. Sch. Res. Not. 2015, 2015, 402358. [Google Scholar] [CrossRef] [PubMed]
- Kanife, P.O. Computer Aided Virtual Manufacturing Using Creo Parametric: Easy to Learn Step by Step Guide; Springer International Publishing: Cham, Switzerland, 2015. [Google Scholar]
- Mo, J.O.; Rho, B.S. Characteristics and effects of laminar separation bubbles on NREL S809 airfoil using the γ-ReΘ transition model. Appl. Sci. 2020, 10, 6095. [Google Scholar] [CrossRef]
- Koca, K.; Genç, M.S.; Açıkel, H.H.; Çağdaş, M.; Bodur, T.M. Identification of flow phenomena over NACA 4412 wind turbine airfoil at low Reynolds numbers and role of laminar separation bubble on flow evolution. Energy 2018, 144, 750–764. [Google Scholar] [CrossRef]
- Knight, J.; Fels, S.; Beazley, B.; Haritos, G.; Lewis, A. Fluid–Structure Interaction of Symmetrical and Cambered Spring-Mounted Wings Using Various Spring Preloads and Pivot Point Locations. Appl. Mech. 2021, 2, 591–612. [Google Scholar] [CrossRef]


Disclaimer/Publisher’s Note: The statements, opinions and data contained in all publications are solely those of the individual author(s) and contributor(s) and not of MDPI and/or the editor(s). MDPI and/or the editor(s) disclaim responsibility for any injury to people or property resulting from any ideas, methods, instructions or products referred to in the content. |
© 2024 by the authors. Licensee MDPI, Basel, Switzerland. This article is an open access article distributed under the terms and conditions of the Creative Commons Attribution (CC BY) license (https://creativecommons.org/licenses/by/4.0/).