Article

Optimization of the Factors Affecting Biogas Production Using the Taguchi Design of Experiment Method

by
Sidahmed Sidi Habib
1,*,
Shuichi Torii
1,
Kavitha Mol S.
2 and
Ajimon Charivuparampil Achuthan Nair
2
1
Department of Mechanical System Engineering, Graduate School of Science and Technology, Kumamoto University, P.O. Box 860-8555, Chuo-ku, Kumamoto 860-8555, Japan
2
Department of Mechanical Engineering, Government Polytechnic College, Directorate of Technical Education, Adoor 691 551, Kerala, India
*
Author to whom correspondence should be addressed.
Biomass 2024, 4(3), 687-703; https://doi.org/10.3390/biomass4030038
Submission received: 11 April 2024 / Revised: 29 May 2024 / Accepted: 21 June 2024 / Published: 2 July 2024
(This article belongs to the Special Issue Biomass Materials: Synthesis, Functionalisation, and Applications)

Abstract

:
The present study analyzed the effect of temperature, pH, pre-treatment and mixing ratio on the anaerobic digestion process. The parameters during the anaerobic co-digestion of cow manure and food waste were then optimized using the Taguchi experimental design method. ANOVA was carried out to find the significant parameters which influence biogas production. Experimental tests were carried out at laboratory-scale reactors kept at different temperatures (28 °C, 35 °C, and 50 °C). The specific methanogenic performance (SMP) during anaerobic digestion at higher temperatures was characterized with the analysis of acetate, propionate, butyrate, hydrogen, glucose, and formate, and was validated with the literature. The improvement of biogas production with different pre-treatments, i.e., ultrasonic, autoclave, and microwave techniques, was also analyzed. The results showed that the reactor that was maintained at 35 °C showed the highest biogas production, while the reactor that was maintained at a lower temperature (28 °C) produced the lower volume of biogas. As the retention time increases, the amount of biogas production increases. Methanogenic activities of microorganisms were reduced at higher temperature conditions (65 °C). Biogas production increased by 28.1%, 20.23%, and 13.27% when the substrates were treated with ultrasonic, autoclave, and microwave, respectively, compared to the untreated substrate. The optimized condition for the highest biogas production during anaerobic co-digestion of food waste and cow manure is a temperature of 35 °C, a pH of 7 and a mixing ratio (CM:FW = 1.5:0.5). ANOVA showed that temperature is the most important input parameter affecting biogas production, followed by mixing ratio.

1. Introduction

Global energy consumption has increased significantly, mainly using fossil energy. The primary energy consumption has been shared by oil, natural gas, coal, nuclear energy, renewable energies and electricity, at 31.2%, 24.7%, 27.2%, 6.7%, 5.7% and 4.3% of overall energy in the world in 2020, respectively [1]. More or less 80% of the world’s main energy use is provided by fossil fuels in 2020 [2]. Most countries, particularly developing countries, face energy crunches owing to over-dependence on fossil fuels [3]. The energy carters of all nations are environmental safety, energy protection, and economic development. Fossil fuels face the risk of imminent reduction, whereas non-oil producing nations face energy security problems as a result of over dependence on fossil fuels, whose distribution is mainly influenced by external factors [4]. Adding to the energy crisis and climate changes due to greenhouse gas emissions, the Kyoto Protocol recommends that all countries switch to renewable energy to reduce the energy crisis. Rather than this, according to the World Energy Council, landfill waste is rapidly increasing and it gives a projection that more than six million tons of waste will be produced every day by 2025, worldwide [5].
Biogas technology is the best strategy for managing landfill waste as raw material to produce energy. Biogas has proven to be a multi-purpose solution technology that can provide an efficient strategy for producing clean energy while at the same time conserving the environment. Biogas production through an anaerobic digestion (AD) process leads to the generation of approximately 40–70% methane (CH2) and small amounts of toxic and corrosive gases which include carbon dioxide (CO2), nitrogen (N2), hydrogen sulfide (H2S), hydrogen (H2), ammonia (NH3), oxygen (O2), carbon monoxide (CO), water (H2O), dust particles, siloxanes, and aromatic and halogenated compounds [6].
Anaerobic digestion is the breakdown of organic material (biomass) by microorganisms in the absence of oxygen. The AD process consists of three stages, which include hydrolysis, fermentation (acidogenesis and acetogenesis), and methane fermentation [7]. Hydrolysis is a process where larger and insoluble organic materials are broken down into soluble compounds such as sugar, amino acid, and fatty acids by different microorganisms, which include Streptococci, Bactericides, Clostridia, etc. In the second stage of anaerobic digestion (acidogenesis and acetogenesis), soluble organic compounds from the hydrolysis process are broken down by various microorganisms such as methanothrix, methanococcus, and methanobacterium into different compounds, which include acetic acid, carbon dioxide, and hydrogen. Methane fermentation is the last stage of anaerobic digestion where compounds are broken down into methane and other gases such as carbon dioxide. The various stages of the biogas production process are shown in Figure 1.
The gas produced by the above process can be used as energy for various purposes, such as heating, power generation fuel, and fuel cell substrate to replace natural gas [8]. Although anaerobic digestion is a suitable technology widely used around the world, system instability and lower efficiency than other energy sources are common problems faced during biogas operation [9]. By controlling thermophysical parameters like temperature, pH, hydraulic retention time (HRT), C/N ratio, solid concentration, moisture, organic loading rate (OLR), nitrogen content, stirring/mixing, seeding of biogas plants, particle size, nutrient concentration and pre-treatment, the efficiency of the biogas power plants can be improved [10,11,12,13].
Anaerobic digestion of waste materials often suffers from carbon deficiency, moisture content, slower microbial population…etc.; due to this reason, the biogas production rate becomes slower than the expected rate. To overcome these obstacles, anaerobic co-digestion can be used instead of single and separate anaerobic digestion [14]. The research reveals that the co-digestion of chicken waste or food wastes with cattle manure provides better nutrients to the digestion system and thus enhance the biogas production process compared to the single anaerobic digestion of the above-mentioned wastes. Though there are many advantages of anaerobic co-digestion, the use of different types of organic wastes has made this technique more sophisticated. In particular, the wrong choice of organic substrate can easily damage the system. In addition, in anaerobic co-digestion, the mixing ratio among waste raw materials plays a very important and influential role. Unconventional mixing ratios can easily disrupt the biogas production process, while appropriate mixing ratios can produce more biogas with higher methane concentrations [15]. In the same way, temperature and pH have great influence on the efficiency of the biogas power plants [12]. To validate the behavior of the reactor performance and methanogenic populations at different temperatures, this study analyzed the activity of microorganisms at different temperatures.
Many researchers have studied the effects of various parameters on biogas production. However, optimizing parameters using some experimental design methods is of great significance for improving the efficiency of biogas power plants. The optimization of these thermophysical parameters will help to enhance the efficiency of the biogas power plants. In traditional optimization methods, optimization of parameters is carried out by changing one process parameter for an instant, while keeping all other parameters constant. It requires extensive experimental testing to derive the effect of a parameter on the output response. More than that, it becomes impossible to analyze the interaction between the parameters. Therefore, researchers have used many new technologies and optimization methods to enrich biogas production by controlling input parameters. Currently, various optimization methods and technologies like the Taguchi design of experiments, and the artificial neural network (ANN), particle swarm optimization (PSO) and random forest (RF) method are widely used. Taguchi design of experiments can be used to optimize the factors affecting a system with a minimal number of experiments [16,17].
The objectives of this study include the following: (1) to analyze the effects of temperature and pH on biogas production during anaerobic digestion of cow manure. (2) To analyze the specific methanogenic performance of microorganisms from the reactor and validate it with the literature. (3) To compare the effects of anaerobic digestion of cow manure, with different pre-treatments, on biogas production. (4) To optimize the parameters (temperature, mixing ratio and pH) to achieve the highest biogas yield during anaerobic co-digestion of cow manure and food waste (i.e., rice and cooked vegetable waste collected from the canteen of Kumamoto University, Japan) using the Taguchi experimental design.

2. Factors Affecting Anaerobic Digestion

Anaerobic decomposition depends on various thermophysical parameters for efficient operation. For obtaining an efficient operation of biogas power plants, several operational parameters have to be considered and taken into account, rather than the design criteria. These operational parameters need to be controlled to avoid the problems that lead to inhibition of biogas production. The different parameters selected for the present study are detailed below.

2.1. Temperature

The anaerobic digestion system depends significantly on the inside digester temperature. Many researchers have observed that the physical and physio-chemical properties of compounds, microbial species, kinetic and thermodynamic properties of biological processes, stability and methane yield are significantly affected by temperature [18]. There are different temperature extents that can be applied during anaerobic decomposition: psychrophilic, mesophilic and thermophilic, of <30 °C, 30–40 °C and 50–60 °C, respectively. In most cases, AD processes are preferred under mesophilic conditions [19] because it requires minimal energy consumption under medium temperature conditions and is more stable during operation. Due to lower temperatures in the digestive system, microbial growth, feedstock degradation rates, and biogas yield are reduced [20,21]. Also, cellular energy depletion and intracellular material leakage may also be affected by low temperatures [22]. On the other hand, volatile CH4 gases are produced at high temperatures, inhibiting methanogenesis activities and leading to a decrease in biogas production [23]. Briški et al. [24] stated that temperature should maintained below 65 °C, since the enzyme will denature during digestion above 65 °C. Faster digestion of organic matter, higher methane production, lower waste water viscosity, and higher annihilation of pathogen growth are possible anyway, under high temperature conditions [25].
Owing to the upholding of the optimal temperature within the digester, some factors can be considered when setting up the digester, such as coating with thermal insulation materials within an appropriate temperature [26]. By coating charcoal around the digester floor, gas production in a biogas plant increased by 7–15% [27]. If the internal temperature of the digester is maintained at 40 °C, the HRT can be decreased by more than 40% [28]. Hot water can also be used during raw material preparation, which helps improve production performance. The operating temperature for the anaerobic digestion process goes up to approximately 60 °C. Thermophilic bacteria are active at (50–60 °C). Mesophilic bacteria are active in a temperature range of (30 to 40 °C) and psychrophilic bacteria in less than 30 °C [20].

2.2. Pre-Treatment

Pre-treatment of substrates aids bio-digestion and maximizes the efficiency of biogas power plants. Since there are multiple pre-treatment methods, one method effective for one type of substrate may not be suitable for another. Therefore, it is important to analyze the change in other process parameters during pre-treatment. Hren et al. [29] examined two different pre-treatment technologies, thermal and biological, during the fermentation of sewage sludge and riverbank grass. Thermal treatments were carried out at a lower temperature (38.6 °C) and higher temperature (80 °C). Biological treatment was performed by mixing the substrate with cattle rumen fluid. The results showed that pre-treatment helps to effectively change operating parameters, while low-temperature biological and thermal treatment improves biogas production. Hamdi [30] found that pre-treatment of olive mill waste by fermentation with Aspergillus Niger reduced the toxicity of methanogens and improved the AD process. Lin et al. [31] showed that alkali pre-treatment with various proportions of sodium hydroxide solutions prior to AD of pulp and paper sludge (PPS) can increase methane production.

2.3. pH

The growth of microorganisms during the AD process is significantly influenced by pH. Many researchers have reported that neutral pH is optimal for high methane yield because most of the microorganisms which produce methane cultivate at the pH range of 6.7–7.5 [32]. During digestion, hydrolysis and acidogenesis processes happens at acidic pH ranges of 5.5–6.5, while the methanogenic stage happens at a pH of 6.5 to 8.2 [33]. Nearly 3000 mg/L of alkalinity concentration must be maintained for the appropriate buffering capability of the bio digester. Ward et al. [34] reported that an optimal pH level of 6.8–7.2 can enhance the AD process. Lee et al. [35] concluded that the methanogenesis phase can be completed successfully at pH levels of 6.5–8.2.

2.4. Mixing Ratio

Anaerobic digestion of waste materials often suffers from carbon deficiency, and for this reason the biogas production rate becomes slower than the expected rate. The agricultural wastes are known as the most potential biomass for anaerobic digestion, but the single digestion of agricultural waste provides an insufficiency of carbon [36]. Also, animal manure is now being used as a potential source of biogas, but the moisture content in the animal manure causes dilution in the anaerobic digestion [37]. Agricultural residues and cattle manure are both very promising substrates for the extraction of biogas via anaerobic digestion, with very low capital costs. However, the above-mentioned shortcomings have hindered the productivity of biogas. Therefore, researchers utilize different optimization techniques to find the optimal mixing ratio to enhance the efficiency of biogas power plants.

3. Materials and Methods

Anaerobic decomposition depends on various thermophysical parameters for efficient operation. For obtaining efficient operation of biogas power plants, several operational parameters have to be considered and taken into account, rather than only its design criteria. These operational parameters need to be controlled to avoid the problems that lead to inhibition of biogas production. This study focused on analyzing the effect of temperature, pre-treatment, pH and mixing ratio of biogas production, and optimizing the parameters based on highest biogas production using the Taguchi design of experiments.

3.1. Experimental Set Up

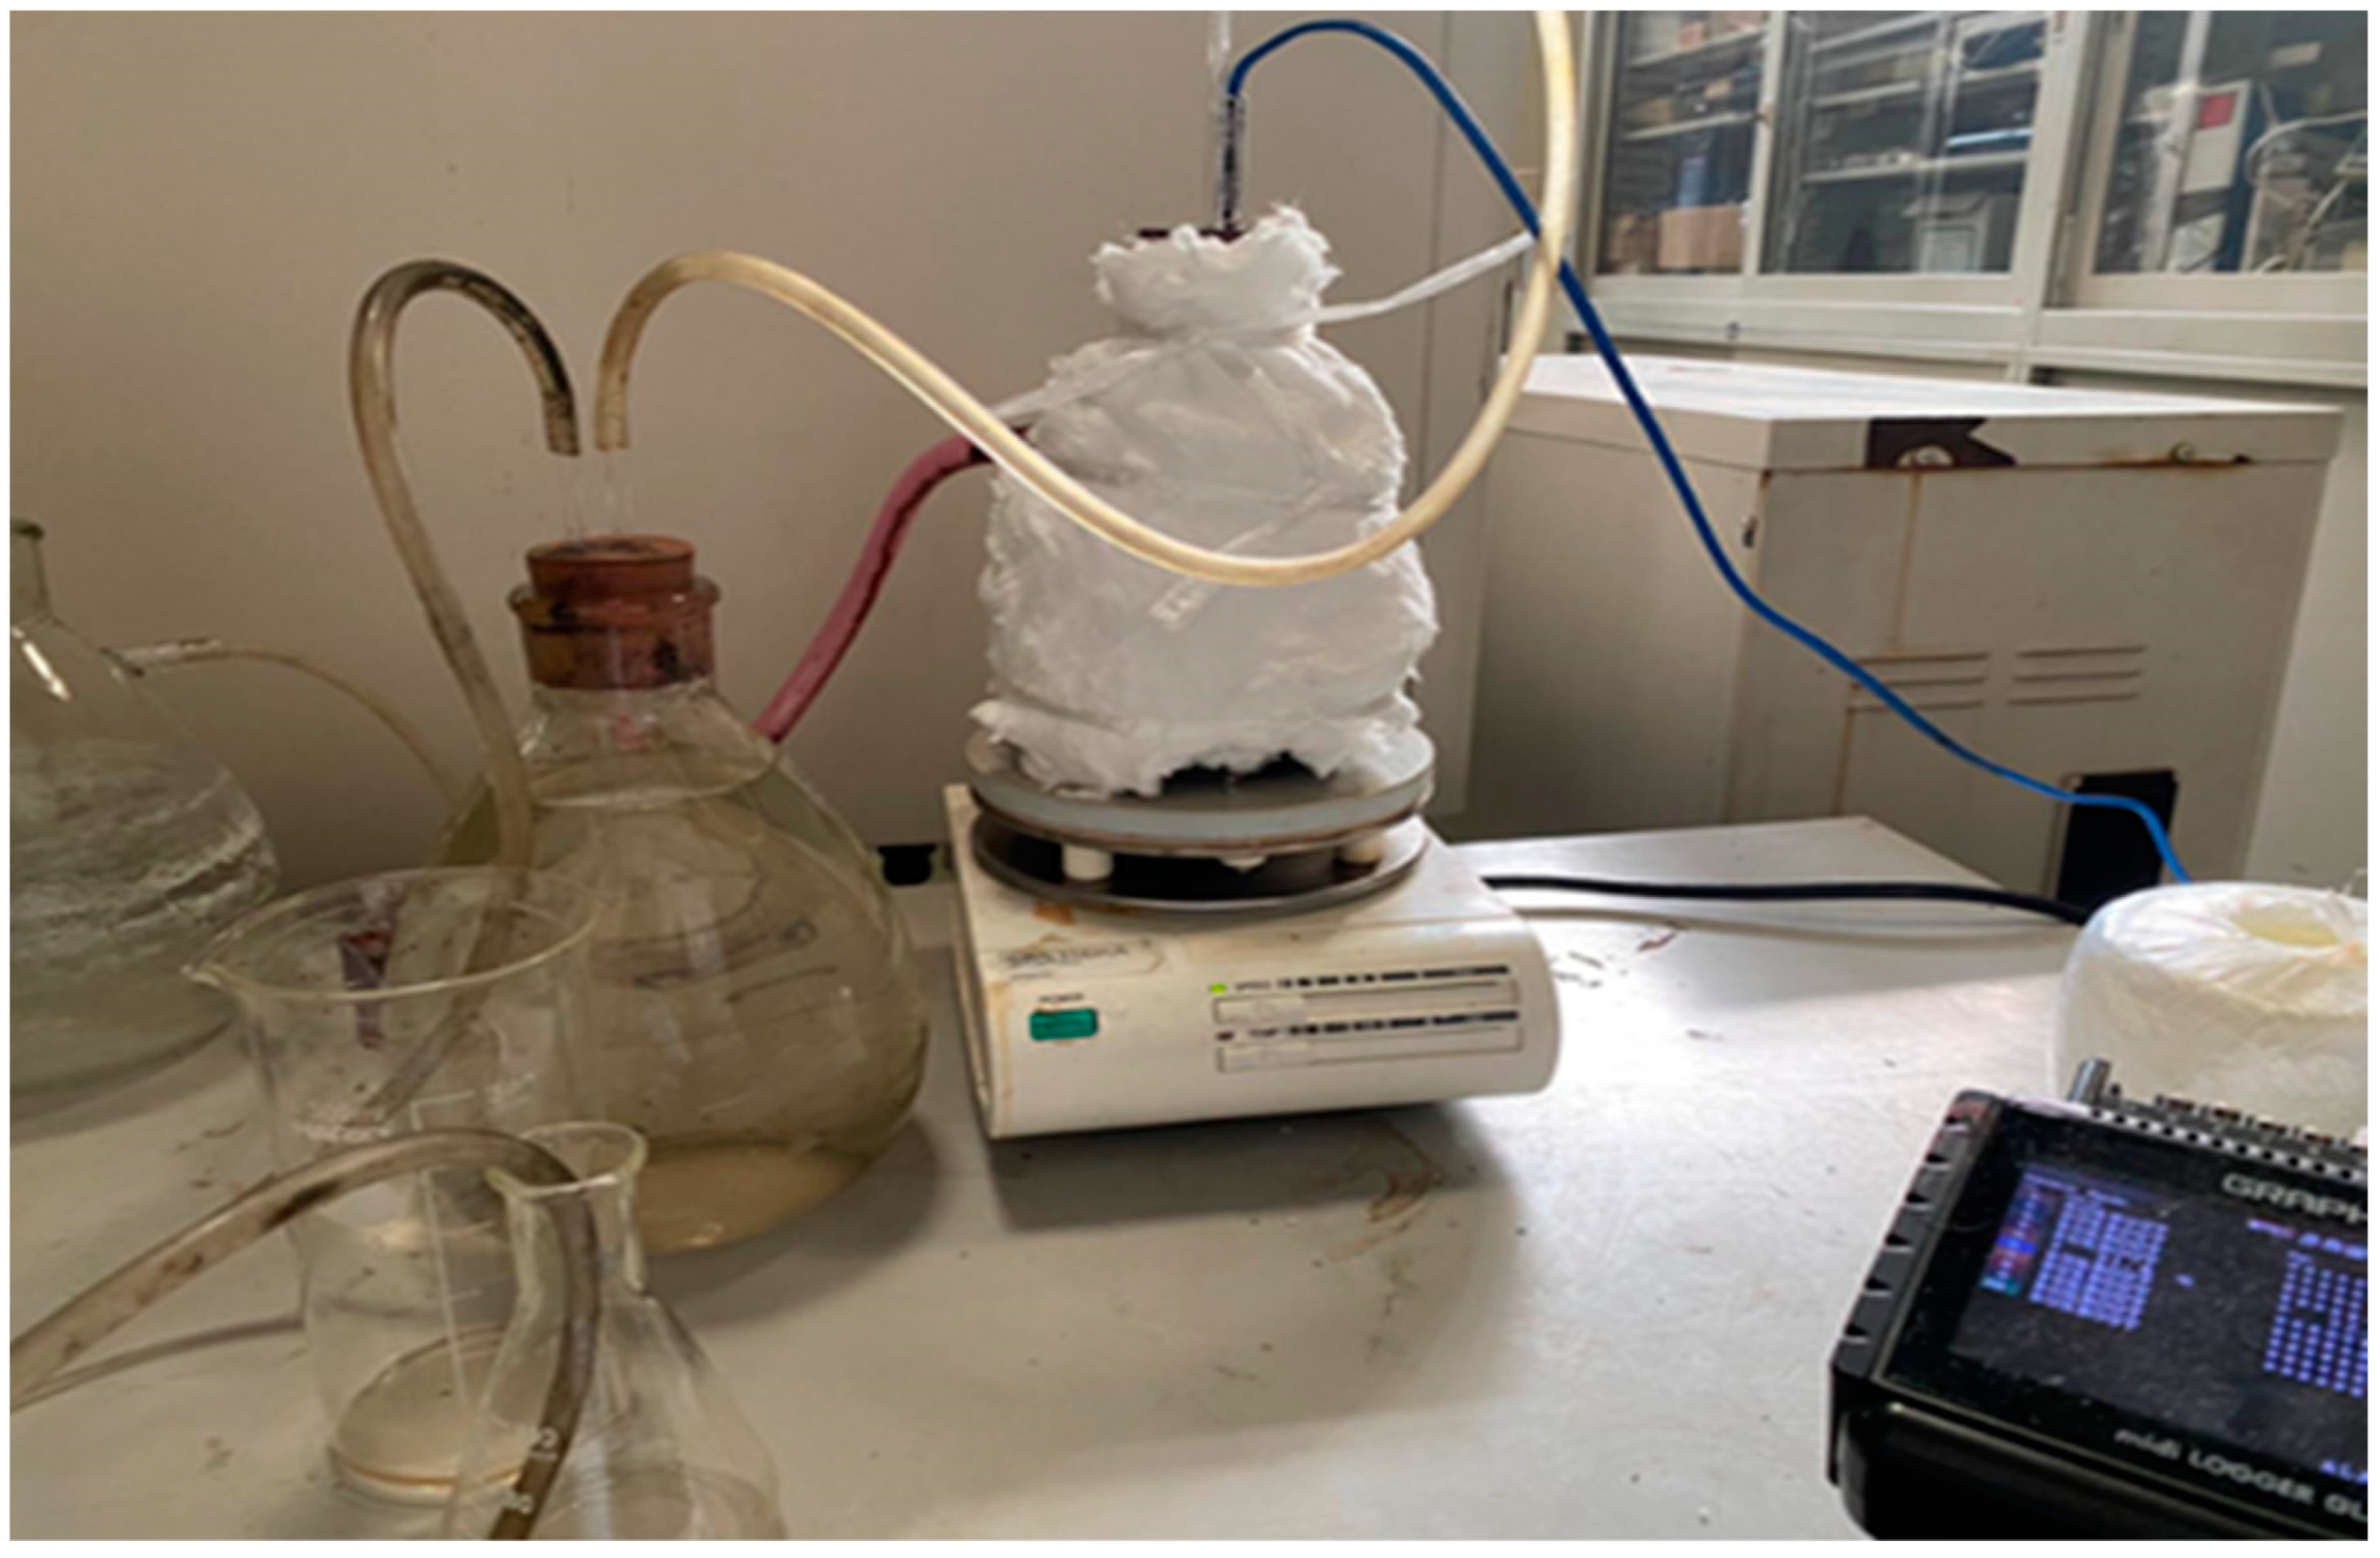
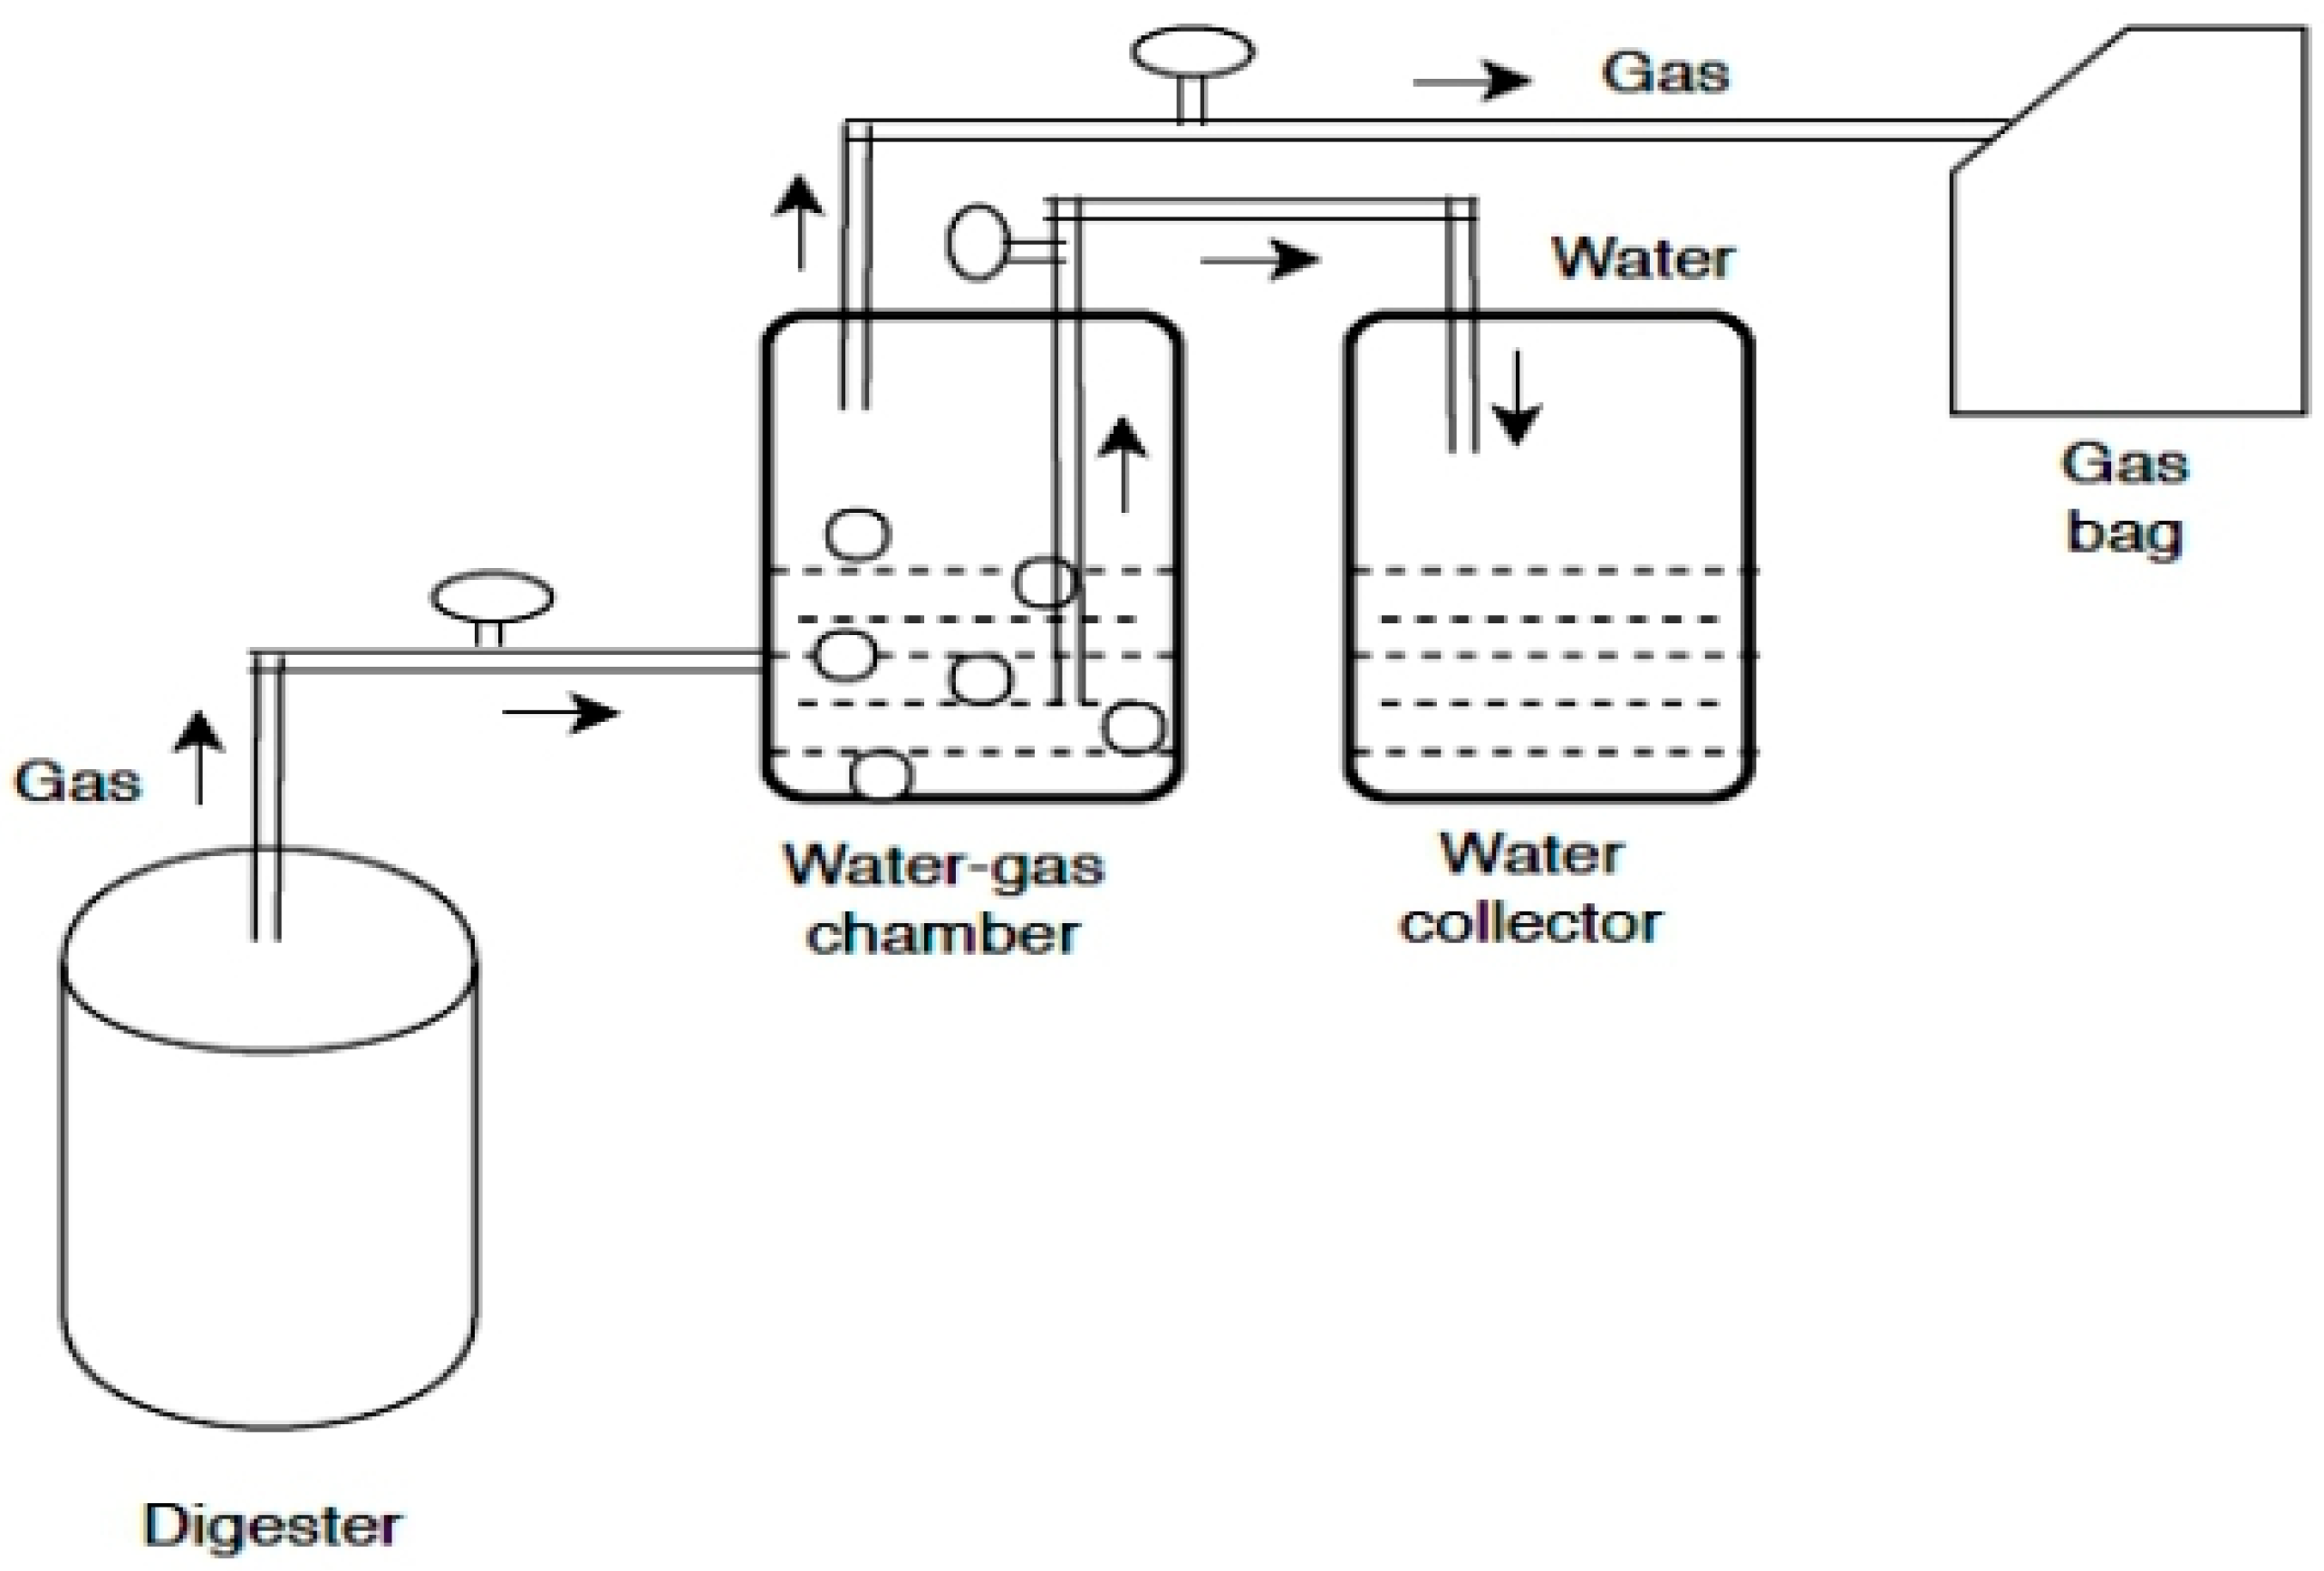
This study analyzed the effect of the temperature and pH during the anaerobic digestion of cow manure alone. The temperature, pH and mixing ratio are optimized during the anaerobic co-digestion of cow manure (CM) and food waste (FW). Cow dung was collected from near the farm and treated at Kumamoto University. A clean container with a lid was used for obtaining the cow manure. The sample obtained was dried for five days and then, using a mortar and a pestle, it was pulverized in a 2000 mL pot. After pulverization, the cow dung waste was filtered and dried for two more days. A total of 100 g of the dried and screened cow dung was weighed and added into a 2000 mL pot and then stirred with 300 mL of distilled water, in the ratio of 1:3. The mixture was mixed thoroughly, using a stirrer, to ensure a homogeneous solution. Three sets of reactors (A, B and C) were used for experimental studies. These reactors were connected with a water displacement method for gas volume measurement. The reactor A, reactor B and reactor C were maintained at temperatures of 28 °C, 35 °C and 50 °C, respectively. Each set of experimental test set-ups contained a 500 mL reactor and a 1000 mL collection flask. The 2000 mL pot was used for pulverization. The ends of all delivery tubes were well sealed to ensure that there was no leakage. Sodium bicarbonate solution was used to maintain the desired pH. Heaters and insulation were used to control temperature. Temperatures were read regularly using Graphtec model GL240 thermocouples. The gas produced in each reactor was collected over water. The experimental test set-up of the reactor is shown in Figure 2. The diagram of the experimental test set-up is shown in Figure 3. The prepared substrates were fed into the reactors and left to undergo anaerobic digestion for 28 days of retention period, and the gas yields were measured on a weekly basis. Food waste which contains cooked rice and vegetables was collected from the canteen of Kumamoto University and blended, with a kitchen blender.

3.2. Analysis of Methanogenic Performance

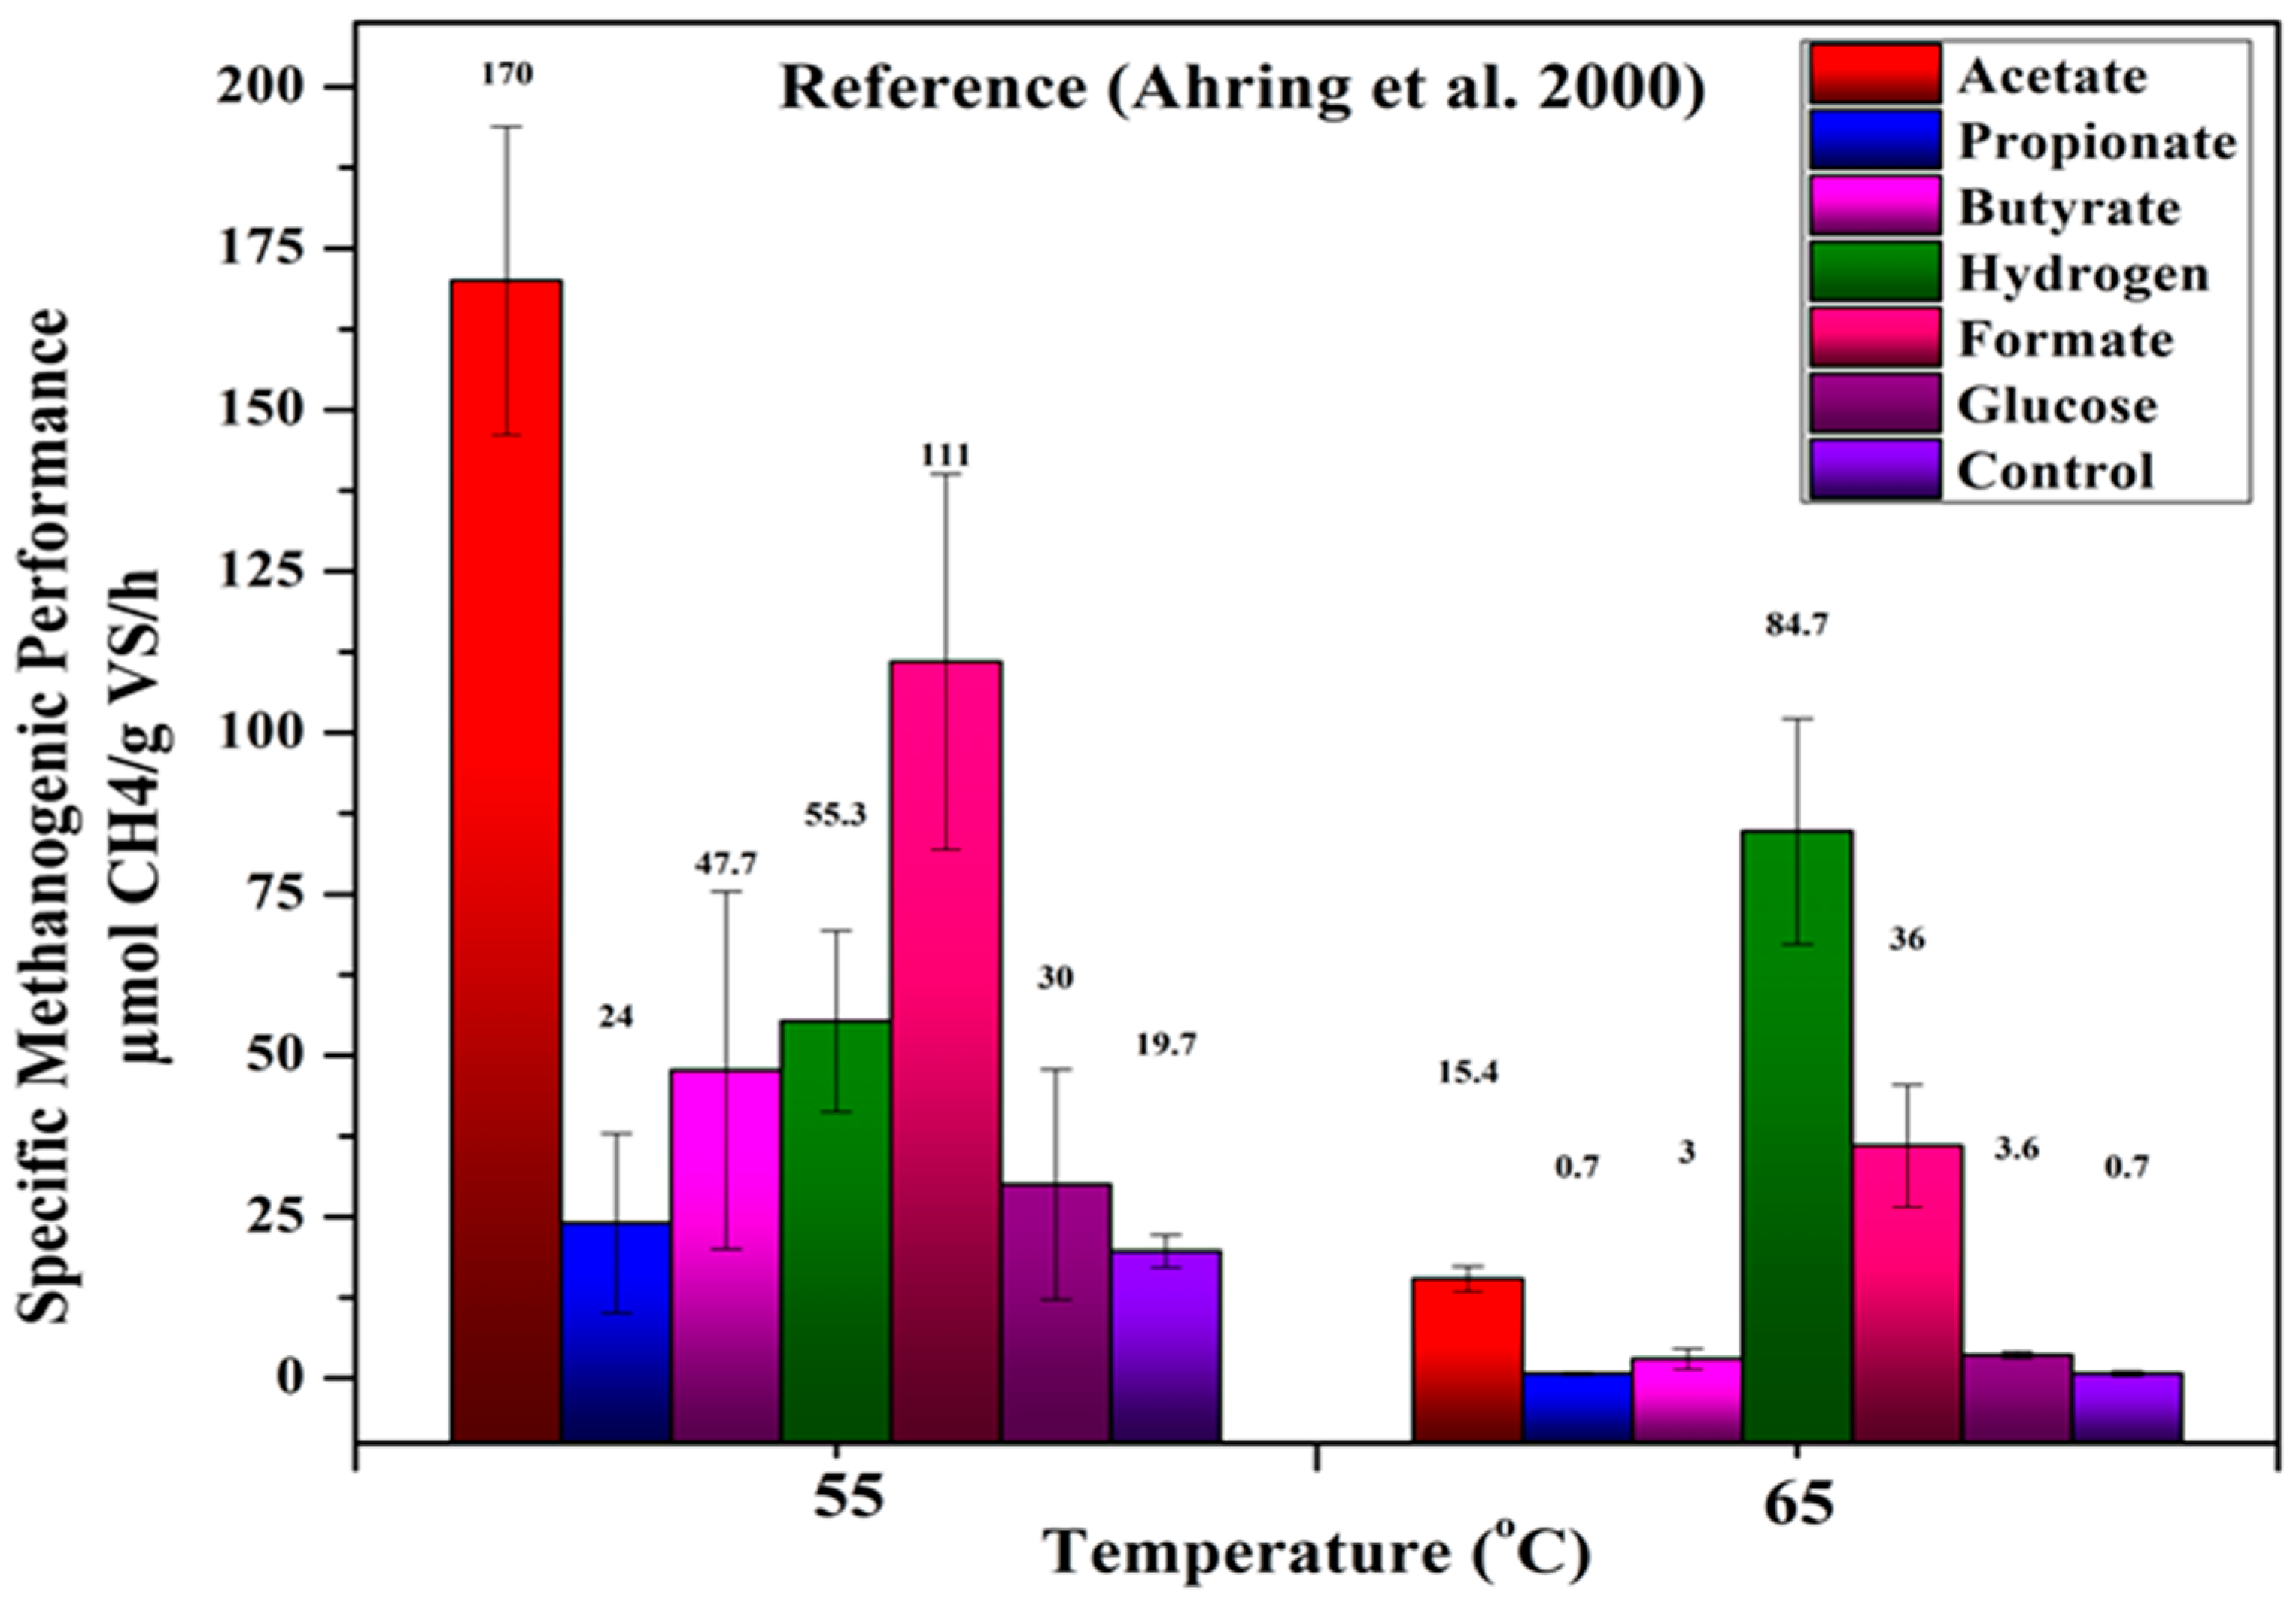
The main microbial populations of the reactor belong to the domains of Bacteria, Archaea and Eucarya [38]. The specific methanogenic performance (SMP) of microorganisms during anaerobic digestion in the reactor at high temperatures was analyzed and verified by the experiments of Ahring et al. [38]. During anaerobic digestion, complex organic matter is hydrolyzed and fermented into short-chain volatile fatty acids (VFAs) (i.e., acetate, isobutyrate, propionate, butyrate, etc.), H, CO2, and alcohols, which are subsequently reduced to CH4 and CO2 [39]. The previous literature [40] showed that the fastest conversion temperature for propionate to methane was 55 °C, while the fastest conversion temperature for acetate, butyrate, or formate was 60 °C. In tests on these substrates, methane production ceased when the temperature was raised above 60 °C [41]. In terms of the difference, the formation of methane from hydrogen is fastest, at 65 °C.
Cow dung slurry was collected from a biodigester near Kumamoto University, Japan. It was then mixed with distilled water and stored in a frozen environment at −20 °C. Then raw cow dung and treated cow dung slurry (1:4) were fed into the reactor. The reactor was temperature-controlled at 55 °C for 93 days, raised to 63 °C until day 98, and then maintained at 65 °C till day 186. The specific methanogenic performance (SMP) of different microorganisms in reactors was tested three times in a laboratory-scale test at days 68 and 167, following the published methods [40]. The 18 mL medium was added in a 60 mL bottle, and feed substrates were included in the following final concentrations: 50 mM sodium acetate, 24 mM butyrate, 2 g/L glucose, 24 mM formate, and 25 mM sodium propionate, at a pressure of 101 kPa H2/CO2 (80%:20%). In the control series, the substrates were removed. Then 2 mL of biodigester slurry was put into bottles and placed in an incubator, maintained at 55 °C and 65 °C in stirred water [40].

3.3. Pre-Treatment Methods Used

The substrates were collected with the same procedure as explained in Section 3.1. Then, these substrates were pretreated with three different pre-treatment methods, i.e., ultrasonication, autoclaving and microwaving. The gas volume production from the digestion of these pretreated substrates was compared with the untreated substrate. The ultrasonic testing tool used in this study was the Vibra Cell ultrasonic processor. The device uses a titanium alloy capsule-tube probe with an operating frequency of 20 kHz and an output power of 130 W. The sample was thereby sonicated for 30 min. Heat treatment of autoclave thermal systems was carried out with the assistance of a Zipper clave (Autoclave France. Temperature control was accomplished using a PID controller. Cow dung was pre-treated in the autoclave maintained at a pressure of 10 bar and temperature of 120 °C for 30 min. The microwave pre-treatment was carried out by using a microwave oven equipped with a rotating arm. The treatment of the cow dung prior to hydrothermal carbonization was carried out inside a 2 L polypropylene pot. The rotating tray changes the way the container rotates, in this way allowing each part to have more than a modest viewpoint. The samples of cow dung were injected at ambient temperature and kept at 20 °C prior to feeding.

3.4. Taguchi Design of Experiments

The selection of process parameters and their values depended on the earlier experimental test and studies in the literature. Substrates were collected as per the procedure given in Section 3.1. The experimental test set up procedure is also explained in Section 3.1. The mixture of food waste and cow dung was taken as a total of 400 mL and fed into the reactor as per the mixing ratio in the design. The present study selected three control factors which affect the anaerobic co-digestion of food waste and cow dung, i.e., temperature, pH and mixing ratio, which varied over three levels, as shown in Table 1. While considering the control parameters and their levels, the number of analyses required for the optimization study was very high. It was highly complicated and time consuming. Taguchi experimental design was used to optimize the above parameters, with a minimum number of experiments. Minitab 21.1 was used to design the Taguchi L9 orthogonal array, according to the parameters given in Table 1. Signal-to-Noise (S/N) ratio is utilized in the Taguchi design of experiments to evaluate an output of the provided group with respect to input variables. Three different terms in S/N ratios are the following: ‘‘smaller the better”, ‘‘nominal the better” and ‘‘larger the better”, which are reliant on output variables. The signal/noise ratios are determined from the response and then the optimal condition is calculated from each of the responses.
The formulas utilized to calculate the S/N ratios are given below:
  • For the larger-the-better instant
    S N = 10 l o g 1 n i = 1 n 1 y i 2
For the smaller-the-better instant
S N = 10 l o g 1 n i = 1 n y i 2
where y i is the responses for the given factor–level combination and n is the number of responses in the factor–level combination.

3.5. Analysis of Variance (ANOVA)

Analysis of Variance (ANOVA) is used for studying the influence of considered parameters (temperature, pH and mixing ratio) on the biogas production. ANOVA spans deviation of output (biogas production) among the considered parameters. This analysis helps to find the factors that influence the biogas production, within a wide variation. It is used for analyzing the variations on the output responses and can also find the contribution of each parameter with respect to the selected parameters. It also helps to identify the contribution of each parameter to the result variables.

4. Results and Discussions

4.1. Effect of Temperature

The biogas volume from the anaerobic digestion of the three sets of reactors was recorded. Reactor B was maintained at 35 °C, and showed the highest biogas production, of 156 mL, while Reactor A, which was maintained at a lower temperature (28 °C), produced the lower volume of biogas (48 mL). Due to lower temperatures in the digestive system, microbial growth, feedstock degradation rates, and biogas yield were reduced [20,21]. In addition, cellular energy consumption and intracellular substance leakage may also be affected by low temperature [22]. In the results from Figure 4, it is seen that the higher quantity of biogas yield was reported at the 28th day (week 4). As the time increases, the methanogenic activity increases, thereby increasing the biogas yield. The amount of biogas produced is low in the first few weeks because the cow manure has not yet decomposed, so the growth rate of the methanogens is quite low, and they are unable to produce biogas. This response is due to the fact that cattle dung mainly contains fibrous materials, and it takes a long time to completely degrade. This response is why the highest biogas production was recorded at the 28th day. Retention time depends on the operating parameters of the anaerobic reactor, i.e., pH level, feed rate, temperature, particle size, total solids, alkalinity, and carbon-to-nitrogen ratio.
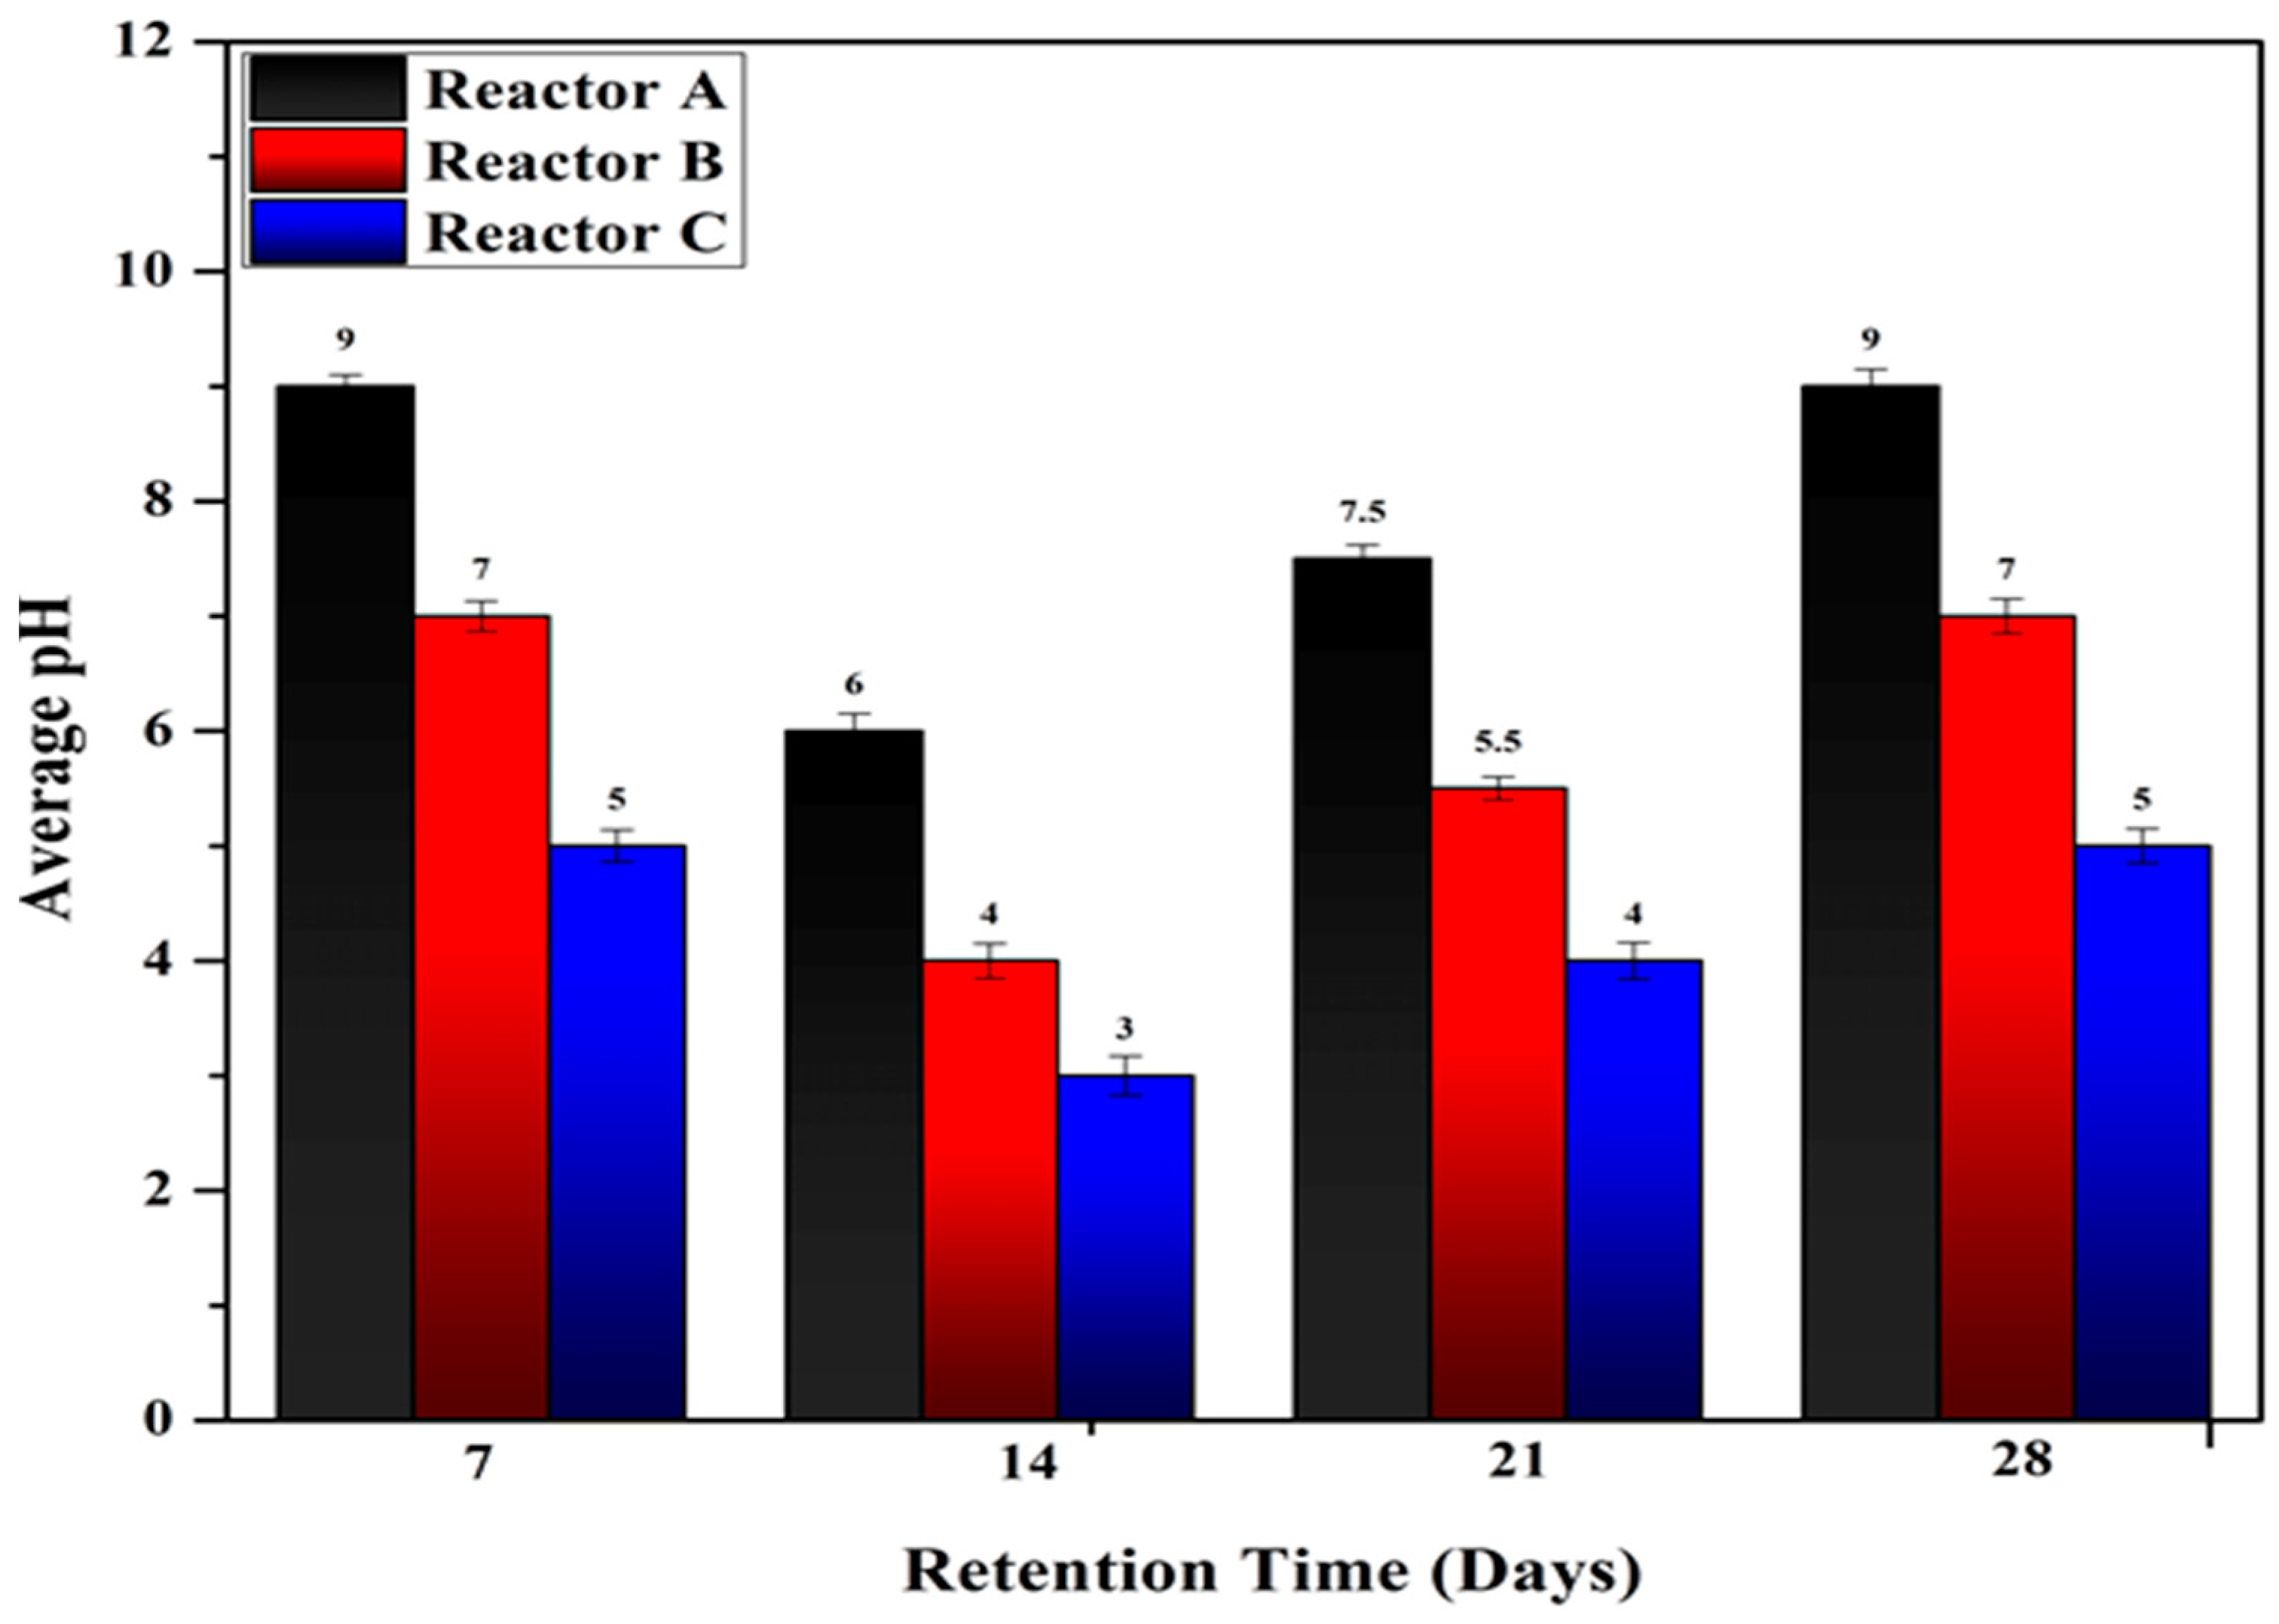
From day 7 to day 14, the pH of the substrate was observed to be between 9 and 3, and from day 14 to the remainder of the retention period, a slow increase in substrate pH was observed, as shown in Figure 5. Reactor A was maintained at 28 °C and a pH between 6 and 9. Reactor B was maintained at 35 °C, and shows a pH between 4 and 7. Reactor C was maintained at 50 °C, and shows a pH between 3 and 5. The pH values recorded during the initial week were consistently high. However, as time increased, the pH value first decreased and then increased. According to the analysis, the drop in pH was due to the presence of highly volatile fatty acids. The sudden decrease in pH illustrates a sudden transition in the various steps of biogas production, whereby the mixture becomes acidic and thus produces the substrate that will produce biogas, from the hydrolysis stage to the acidogenesis stage.
Experimental results show that when the temperature increased from 28 °C to 35 °C, the biogas production increased by 69.23% and the pH value decreased by 22.22%. The further increase is due to the presence of abundant easily biodegradable materials in the matrix. When the temperature increased from 35 °C to 50 °C, the biogas production decreased by 64.1% and the pH value decreased by 28.57%. This output shows that the methanogenic bacteria cannot grow as effectively under high-temperature conditions of 50 °C as under medium-temperature conditions. The results exhibit the fact that pH also influences biogas yield, as it controls the activity of microorganisms included in bio digestion, especially with methanogenic bacteria.

4.2. Effect of Microorganisms at Thermophilic Condition

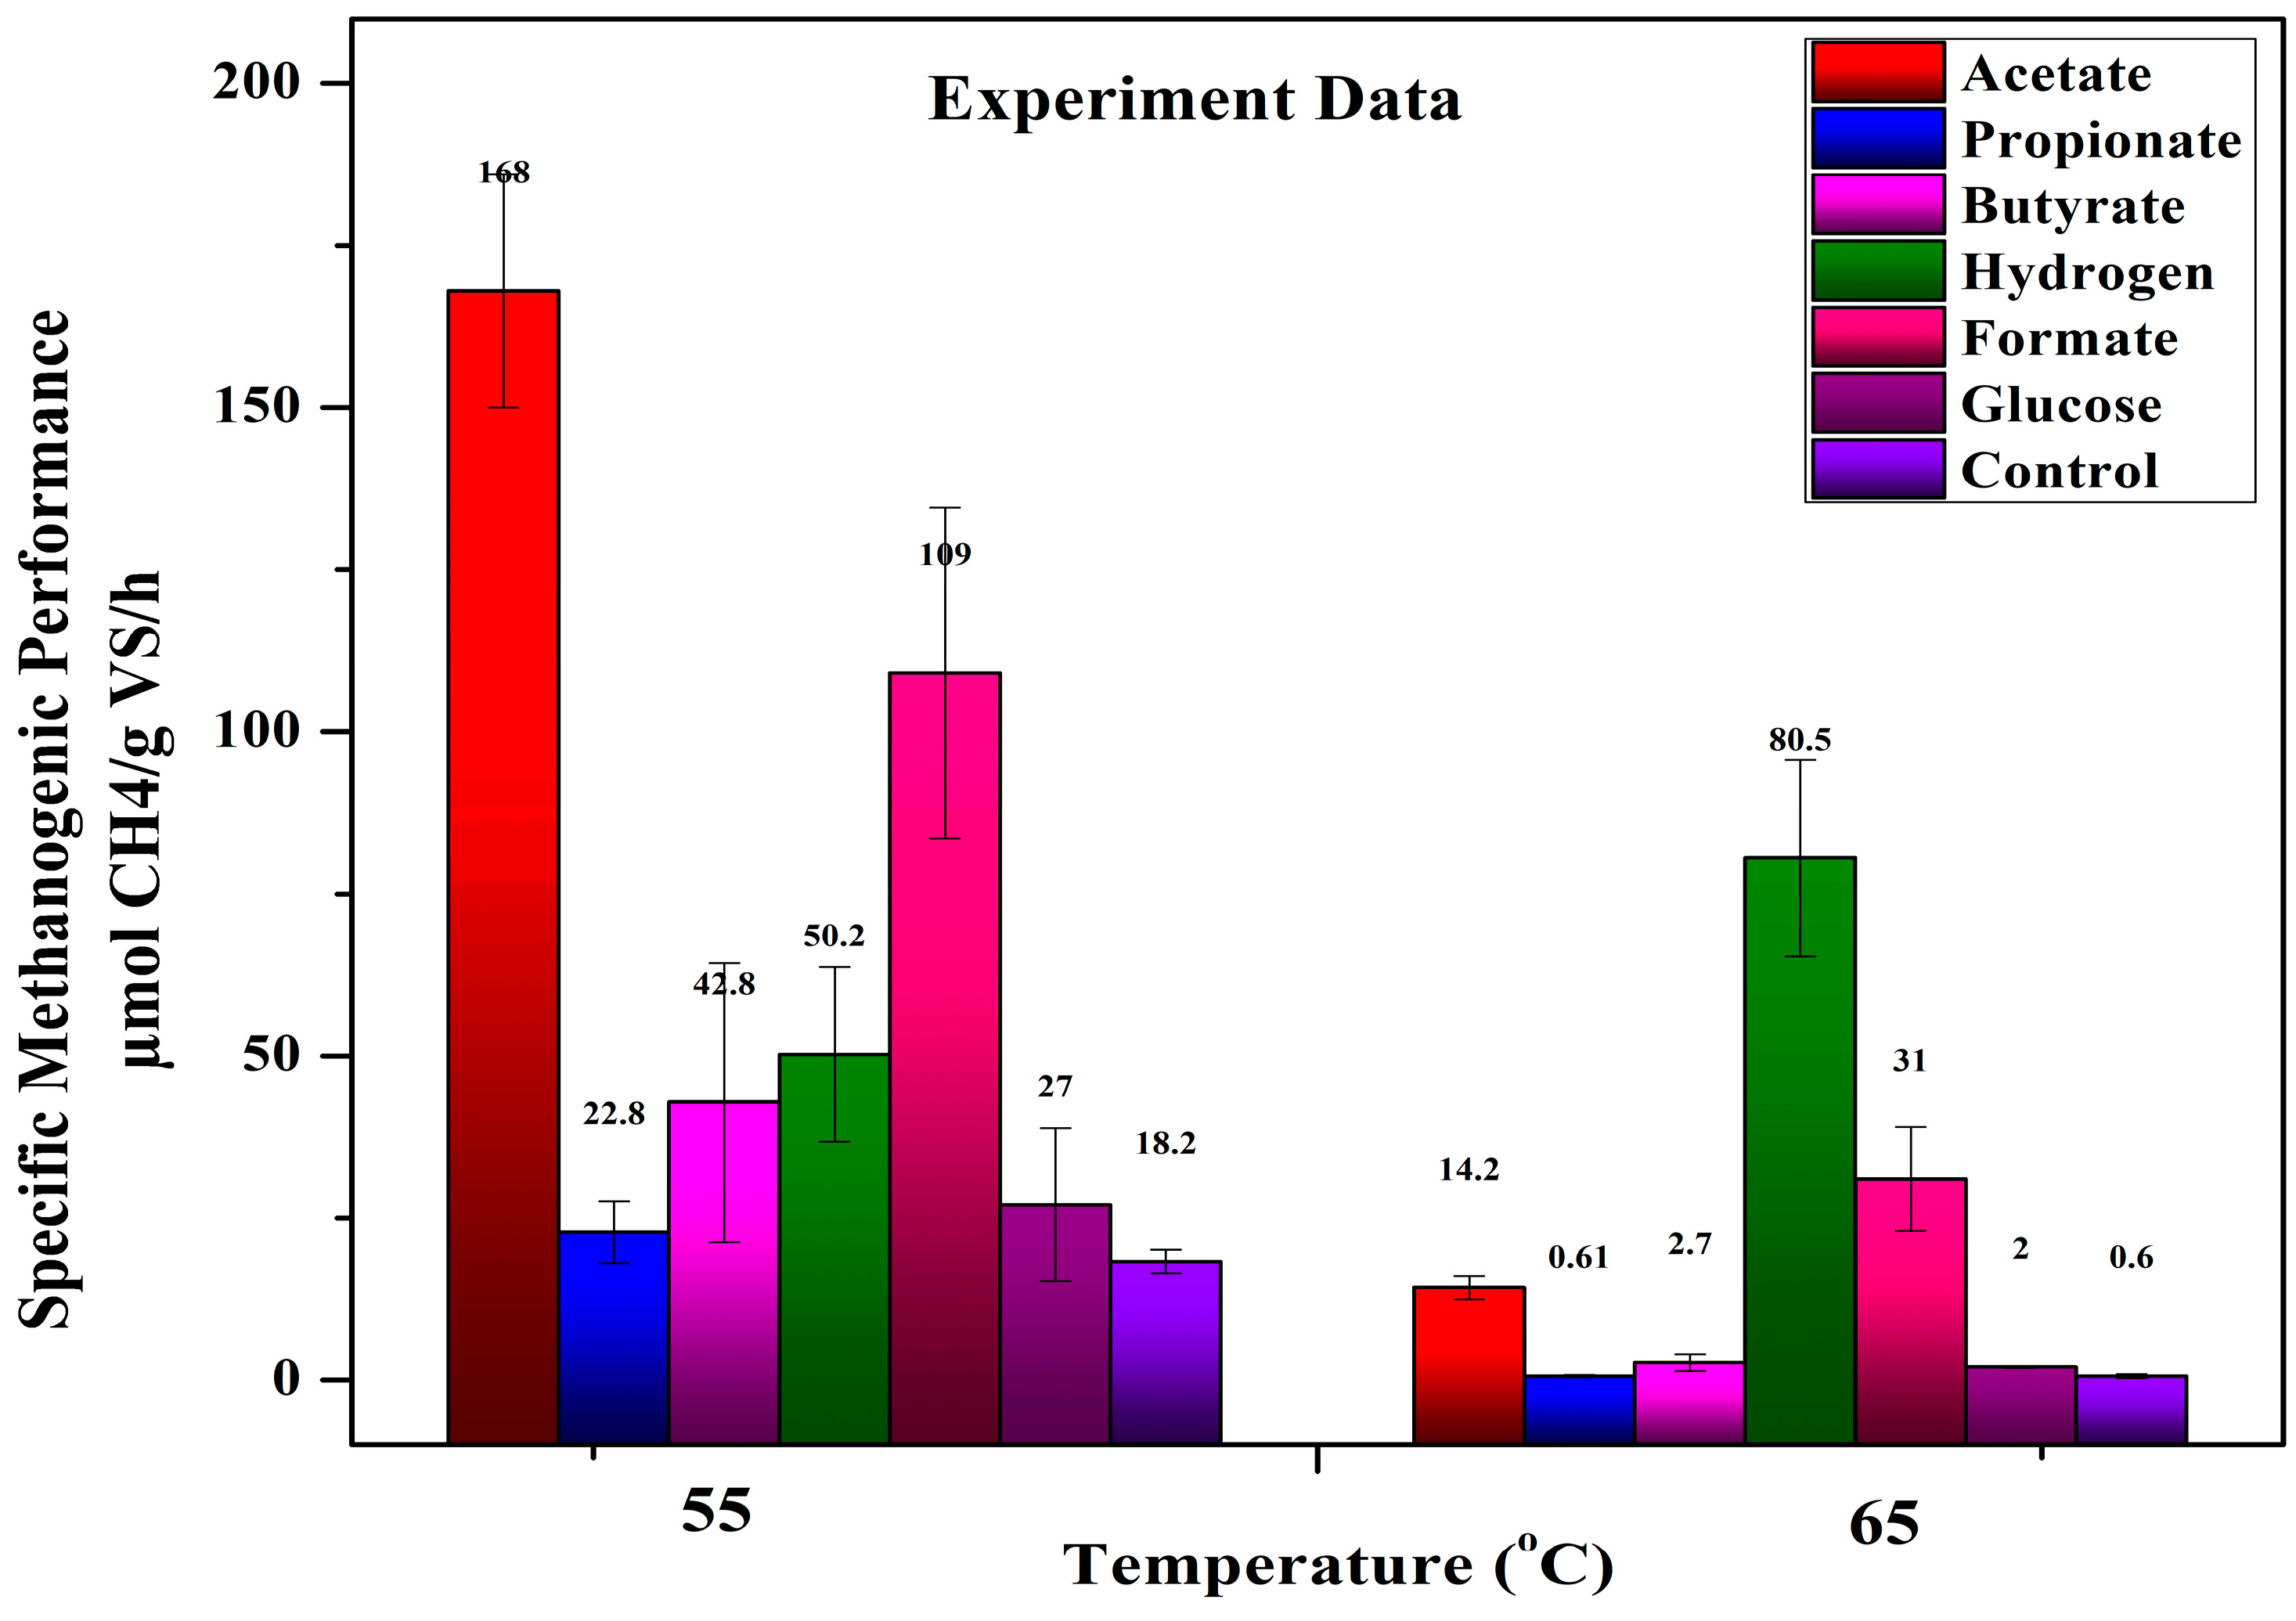
The analysis of the specific methanogenic performance (SMP) (µmol CH4/g VS/h) showed that when the temperature increased from 55 °C to 60 °C the activities of methanogens, which utilize the formate, acetate, glucose, and butyrate, decreased. But the activity of the hydrogen using methanogens increased. Figure 6 shows the specific methanogenic performance at operating temperatures 55 °C and 65 °C. The substrate in the reactor maintained at 65 °C did not display any microbial activity with the propionate. When the control group was subtracted, the SMP of glucose-degrading and formate-utilizing bacteria was assessed to be 3-fold lower, whereas the SMP of acetate-consuming and butyrate decomposing bacteria was about 10-fold lower. The SMP of the hydrogen-consuming methanogens increased by more than twice the amount. The biomass in the digestor operated at 65 °C did not show any substantial propionate-related methanogenic performance, as shown in Figure 6. Also, propionate was not utilized from serum vials in the experiment, even after 4 months of incubation at 65 °C. The same results are reported in the literature [38], as shown in Figure 7.
However, increased temperature had a negative impact on digester performance and microbial activity and led to changes in the structure of the microorganisms in the bio digestor. Increasing the operating temperature of the bio digestor means a sudden disorder in the balance between the fermenting, acid-producing microbials and the acid-consuming microbials entangled in methanogenesis. At first, growth and a persistent higher level of VFA, with an immediate lower biogas yield, showed that the VFA degrading and methanogenic microorganisms are rigorously effected by the increase in temperature and that these inhabitants are unable to balance the activity of the fermenting inhabitants. Therefore, the study selected a temperature below 55 °C for the optimization study. The results also validated the performance of the reactor at different temperature conditions.

4.3. Effect of Pre-Treatment on Biogas Production

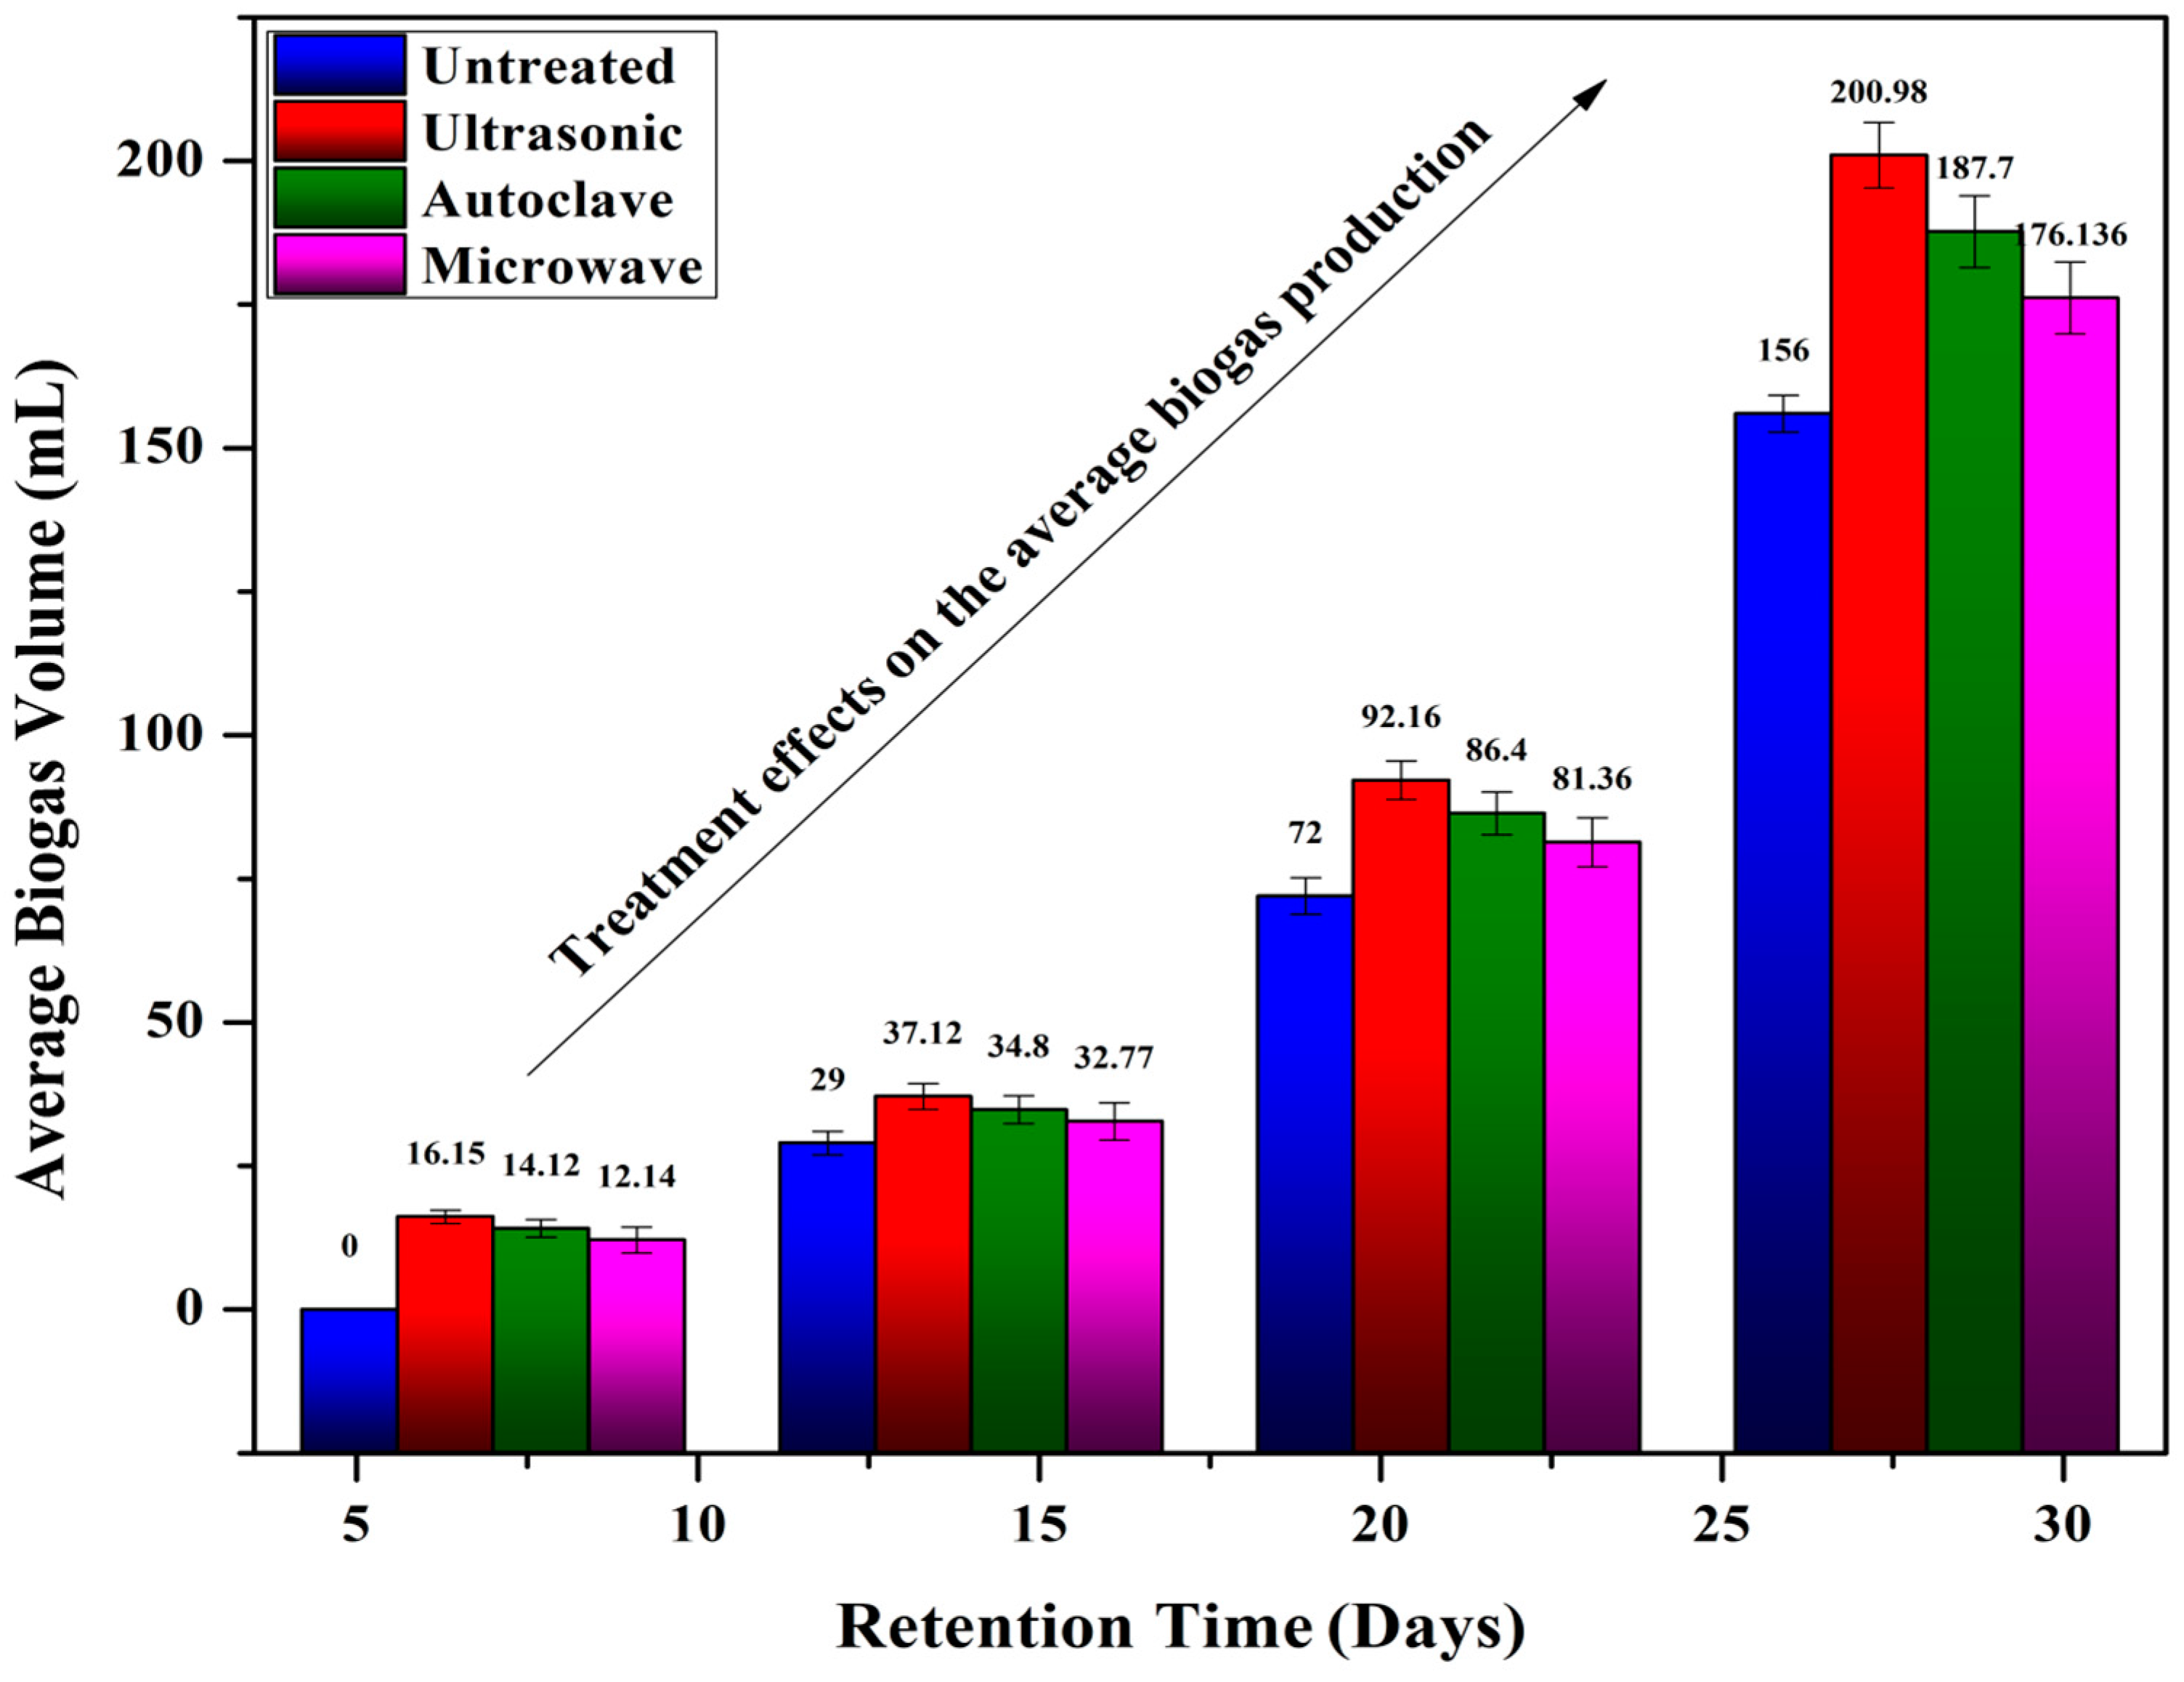
This study compared the anaerobic digestion of cattle manure under different pre-treatment conditions. The comparison of biogas productivity of substrates after different pre-treatment methods is shown in Figure 8. The biogas yields increased by 28.1%, 20.23%, and 13.27% for ultrasound, autoclave, and microwave treatments, respectively, compared to the untreated substrate. Deepan Raj et al. [12] studied the effects of different pre-treatments on biogas production from the anaerobic digestion of food waste, and observed similar trends.

4.4. Optimization of the Parameters Using Taguchi Design of Experiments

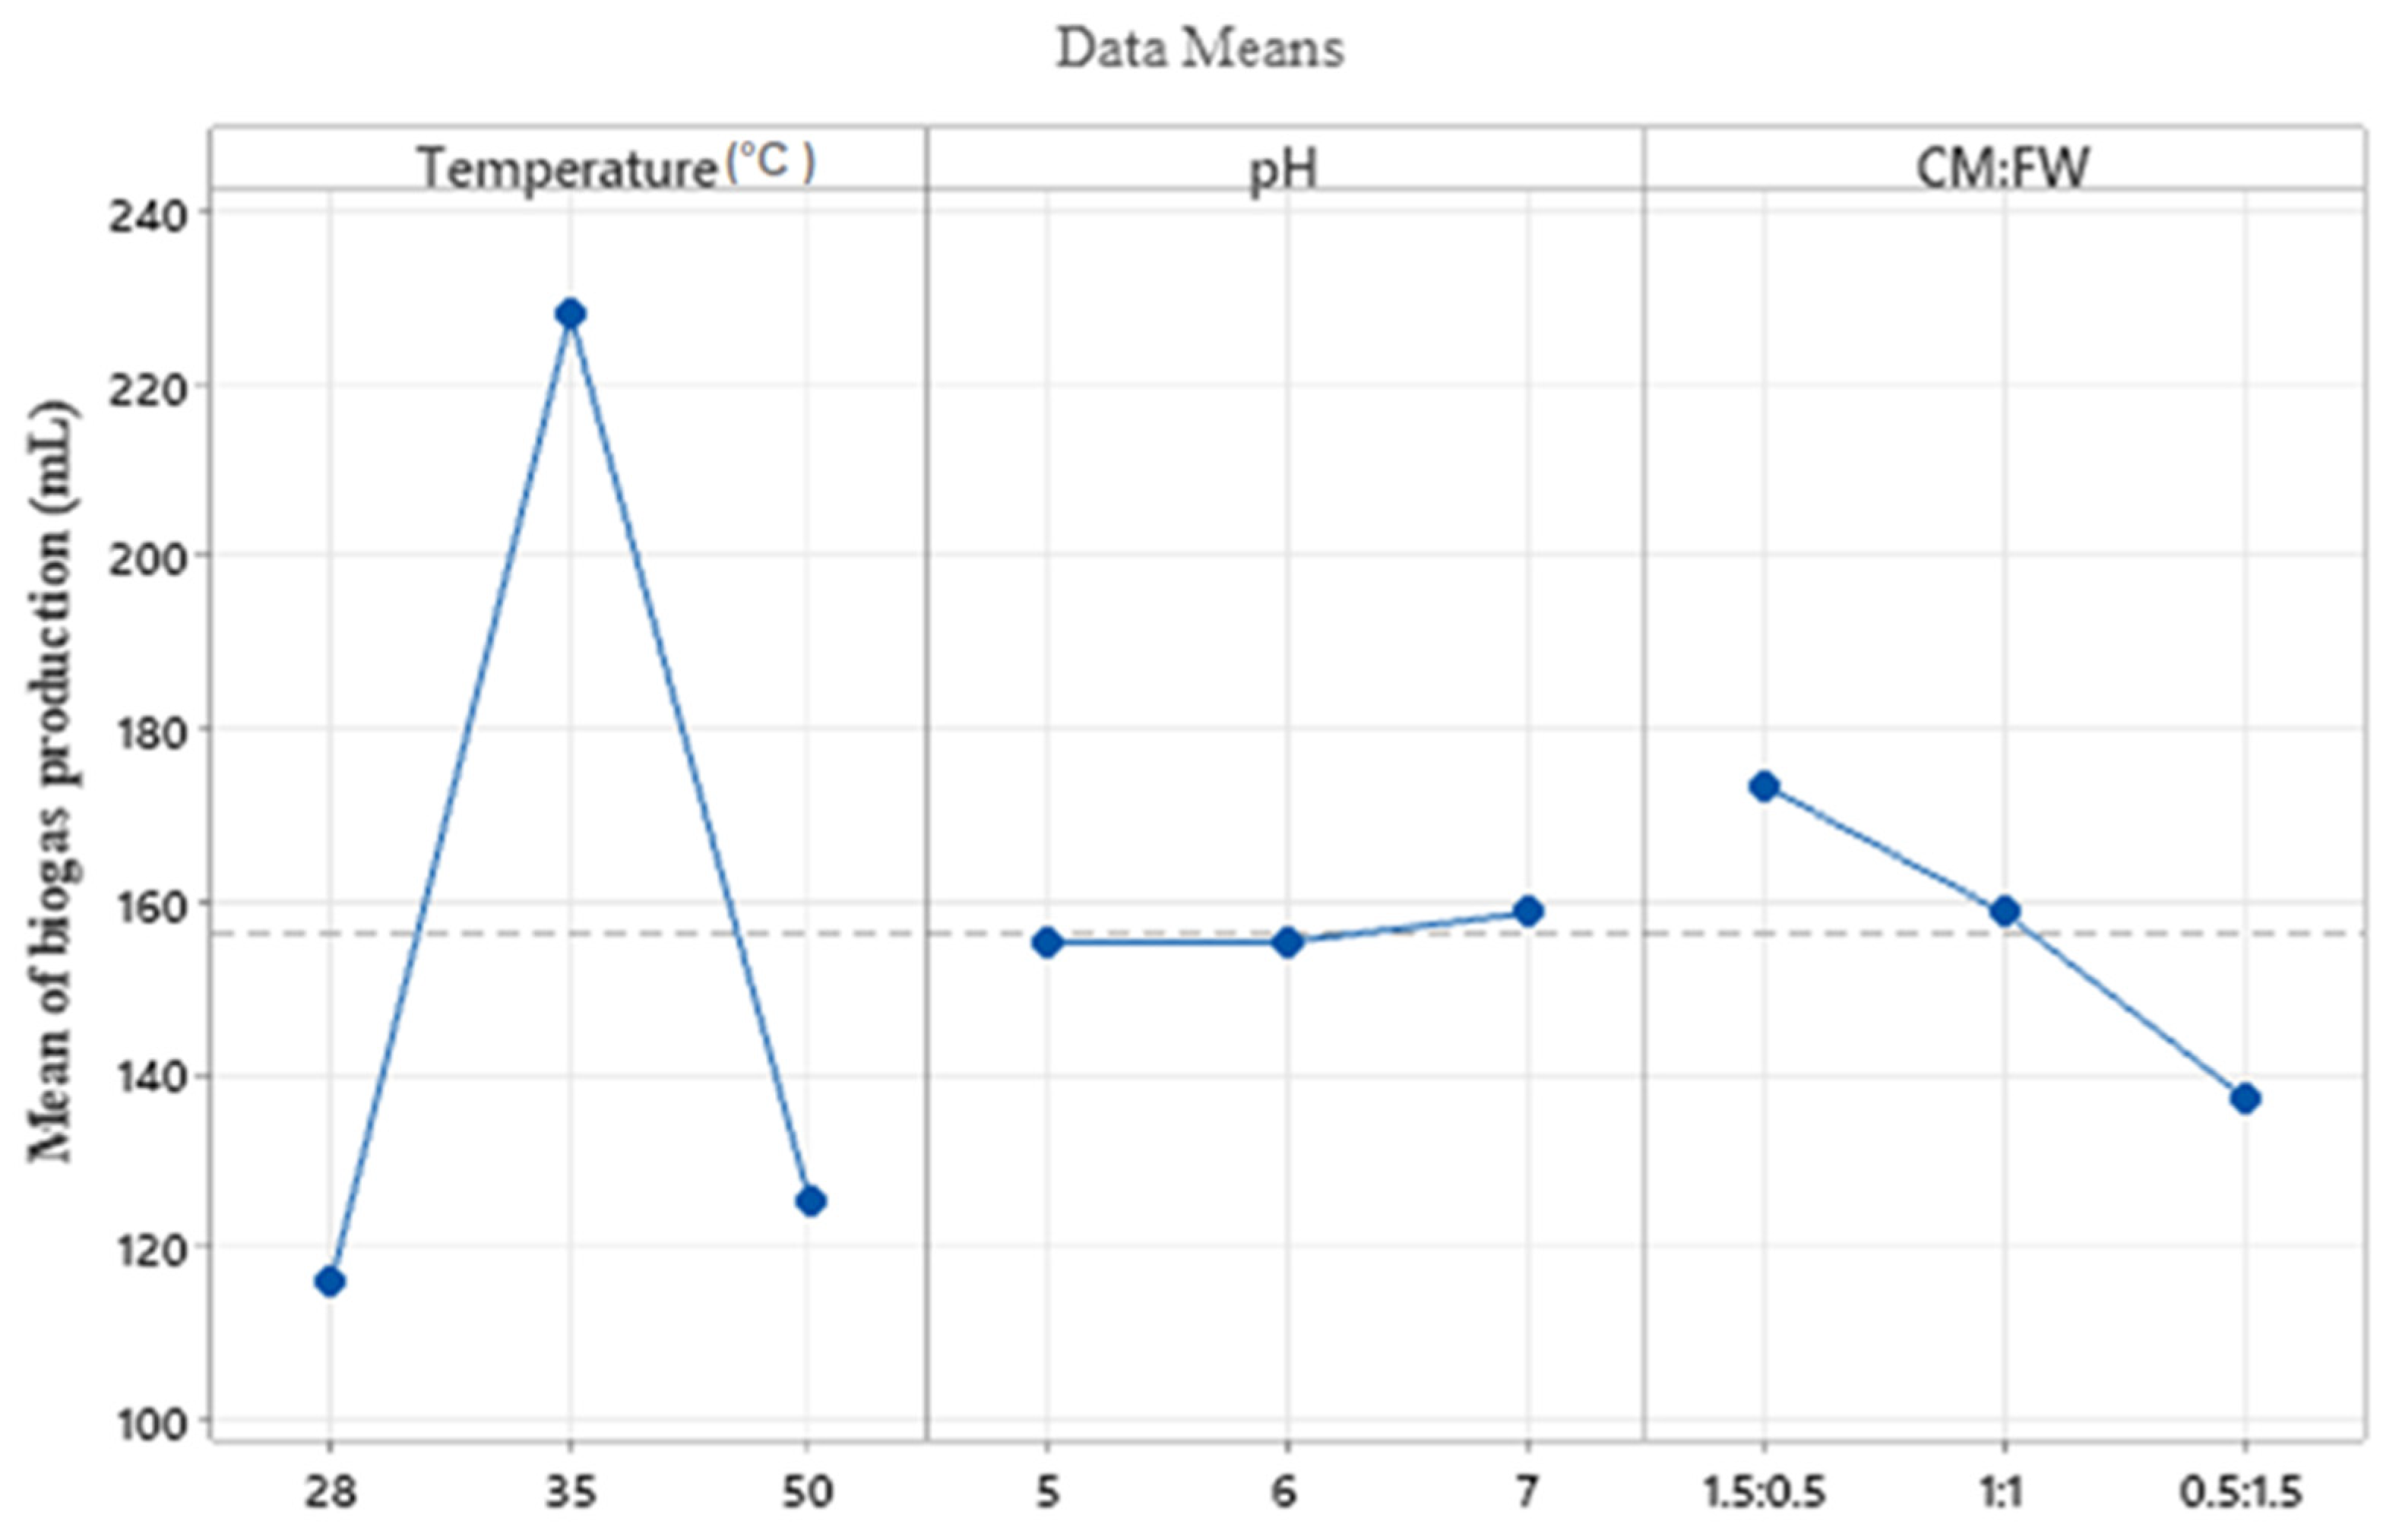
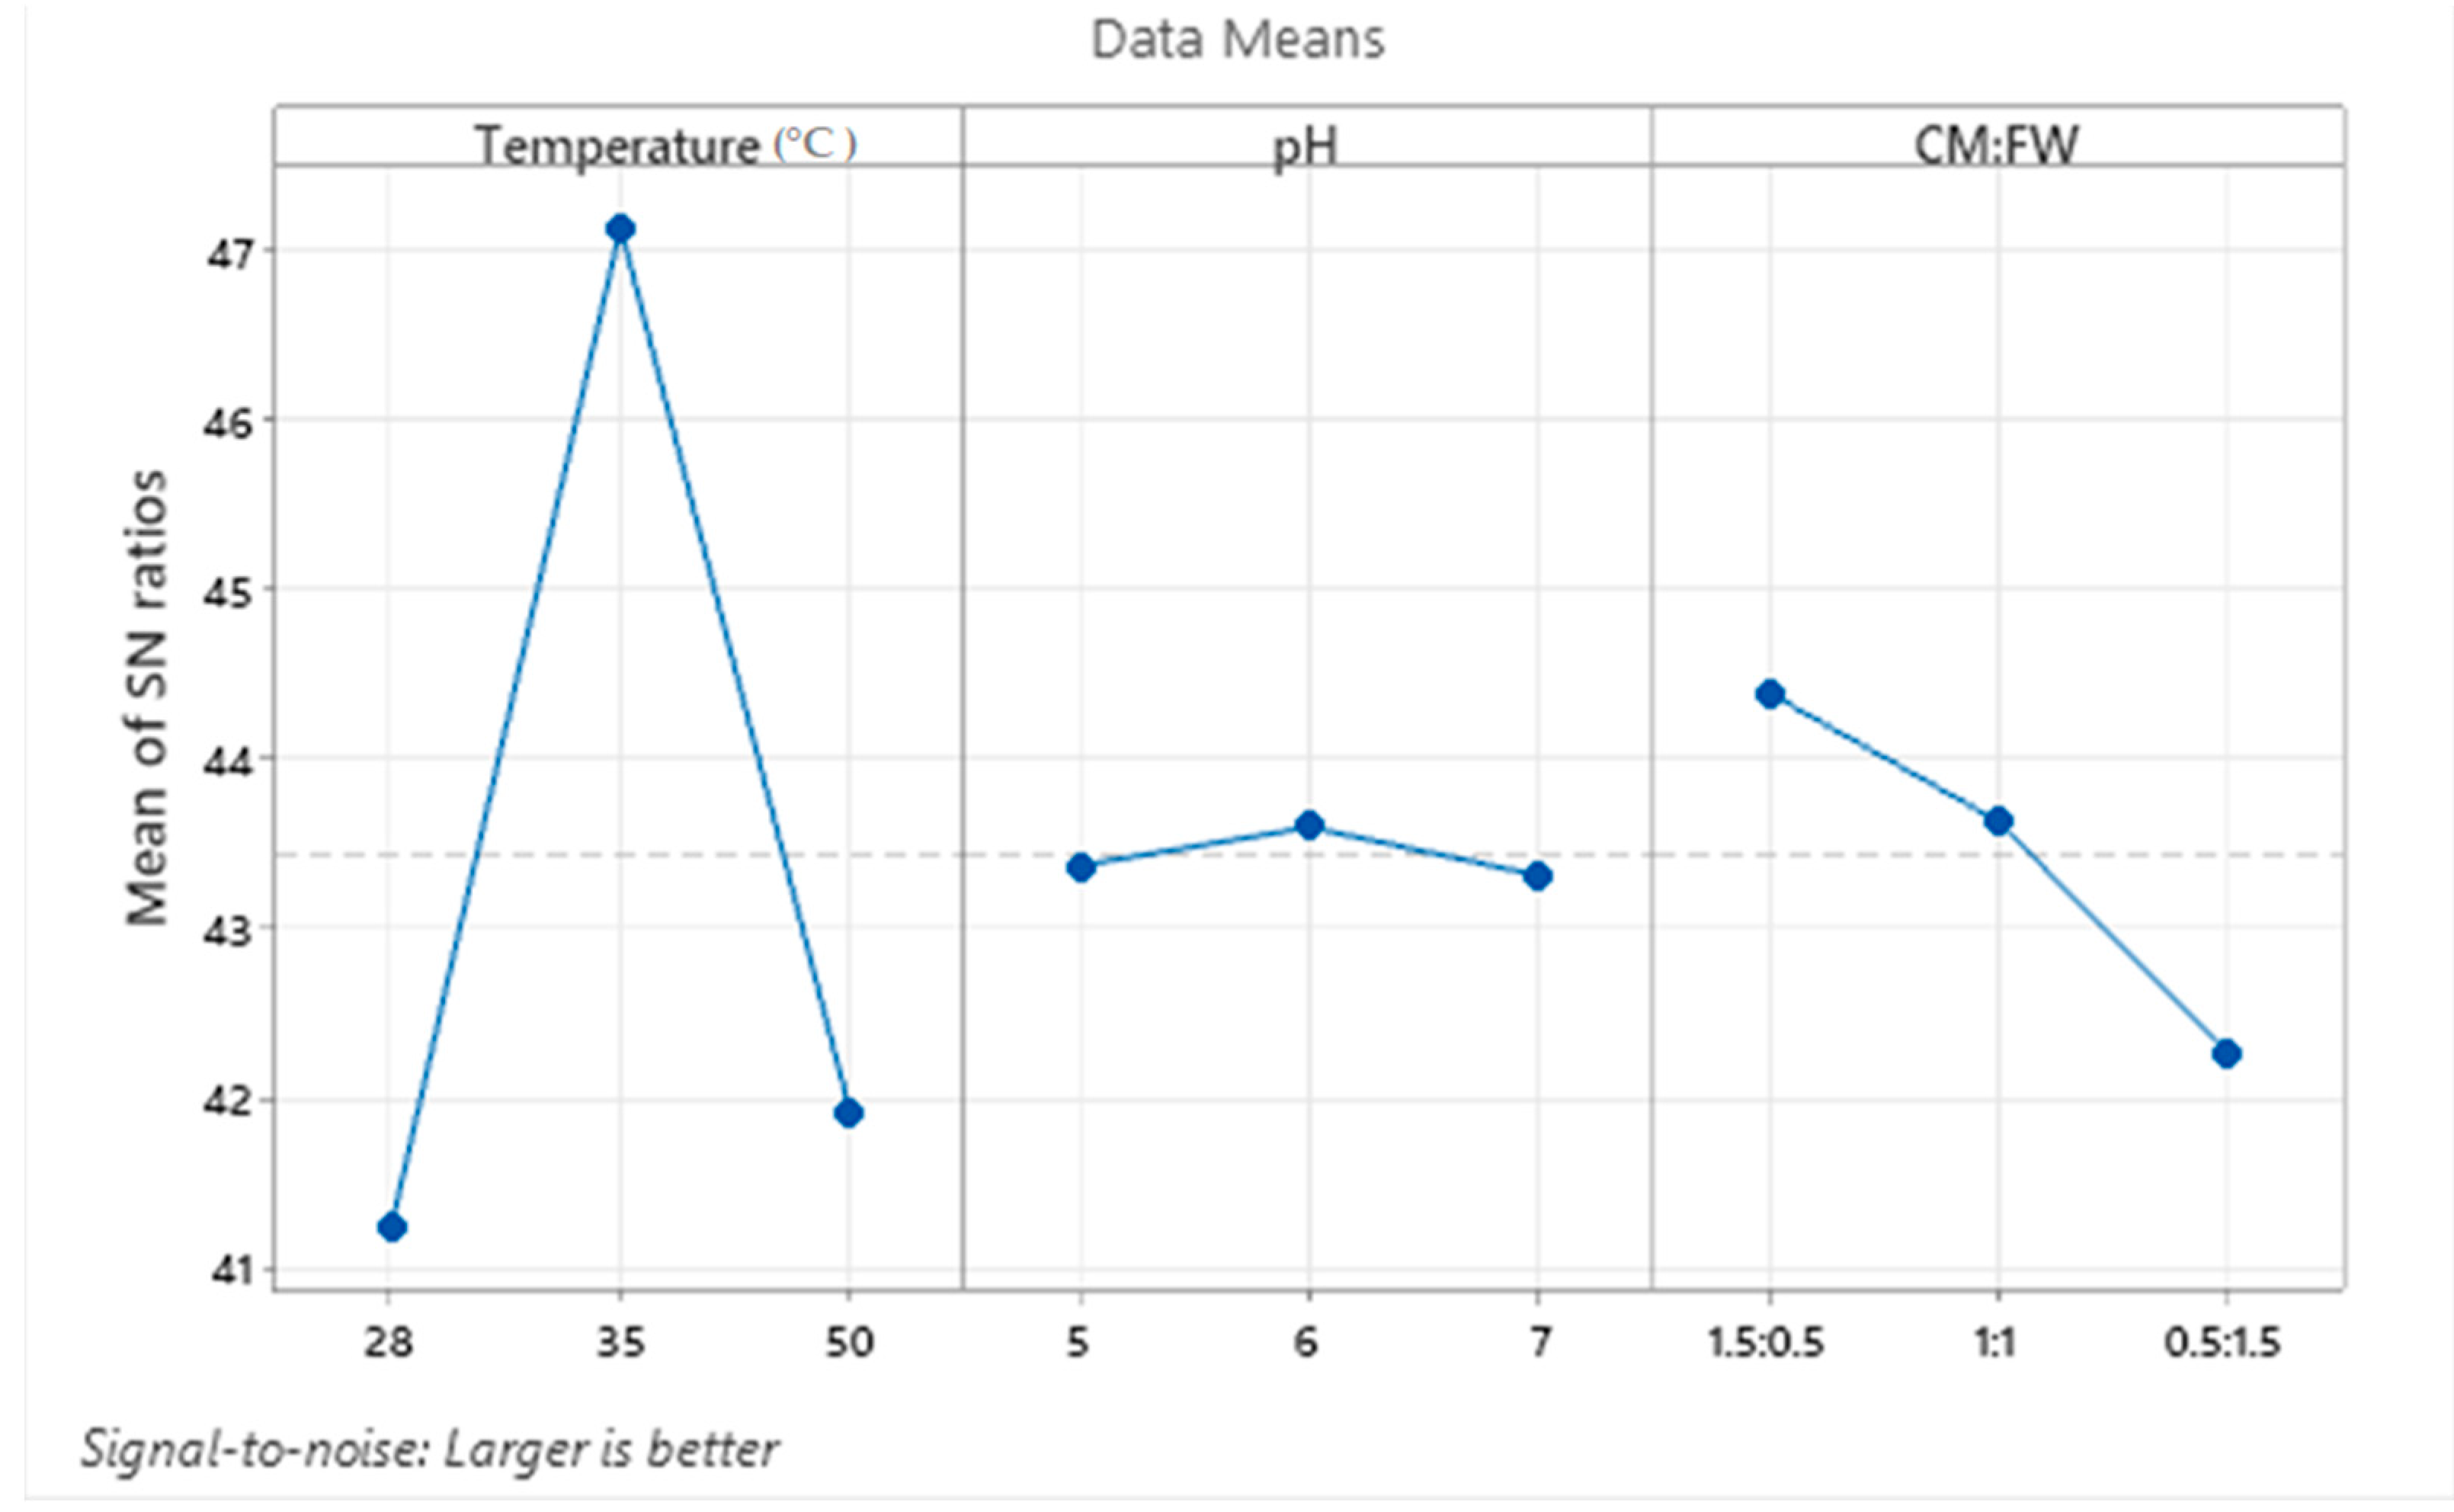
Experimental tests were carried out at different temperature, mixing ratio and pH values. The control factors and their levels were determined based on the experimental results and planned according to the Taguchi L9 orthogonal array design, as shown in Table 2. The biogas produced at each level of the experiments is shown in Table 2. The optimum condition of parameters is obtained by analyzing the effect of different parameters on the mean values of biogas production, as shown in Table 3. Table 3 shows the mean biogas production at different levels of each control factor. The influence of each parameter was also analyzed, based on the deviation (delta) of the biogas yield at each level. Figure 9 shows that temperature is the most influencing parameter with respect to biogas production during anaerobic digestion of cow dung and food waste, as it shows larger deviations from the mean biogas production. Observations from the experimental results show that when the temperature increased from 28 °C to 35 °C, average biogas yield increased by 49.1%. When the temperature was 28 °C to 35 °C, microorganisms grew and the degradation rate of raw materials increased, thereby increasing biogas production. When the temperature increased from 35 °C to 50 °C, an average decrease of 45% biogas yield was observed, as shown in Table 3. Volatile CH4 gases are produced at high temperatures, inhibiting methanogenesis activities and leading to a decrease in biogas production. Normalized S/N ratio for biogas production with different factors is determined with Equation (1), by considering that the larger value is better, as shown in Table 4. The S/N ratio curve (Figure 10) and Table 4 show that the most important influencing parameter controlling biogas production is temperature. The optimum temperature for achieving maximum biogas production is 35 °C. Mixing ratio is the second most-influencing parameter, as 75% cow dung co-digested with 25% food waste produced the higher biogas. Cow dung contains more microorganisms, so the biogas production in the substrate containing a higher amount of cow dung is improved. pH is the parameter with the least influence on biogas production. When the pH of the substrate changed from 5 to 6, there was no change in biogas production; when pH changed from 6 to 7, a small variation in biogas production was observed. Changes at higher pH values have a significant impact on biogas production, because pH affects the digestion of microbial bacteria, especially methanogenic bacteria [42]. When food waste increases, biogas production decreases. From the results in Table 3, it can be seen that the conditions of a temperature of 35 °C, pH of 7, and CW: FW ratio of 1.5:0.5 showed the highest biogas production of 250 mL.
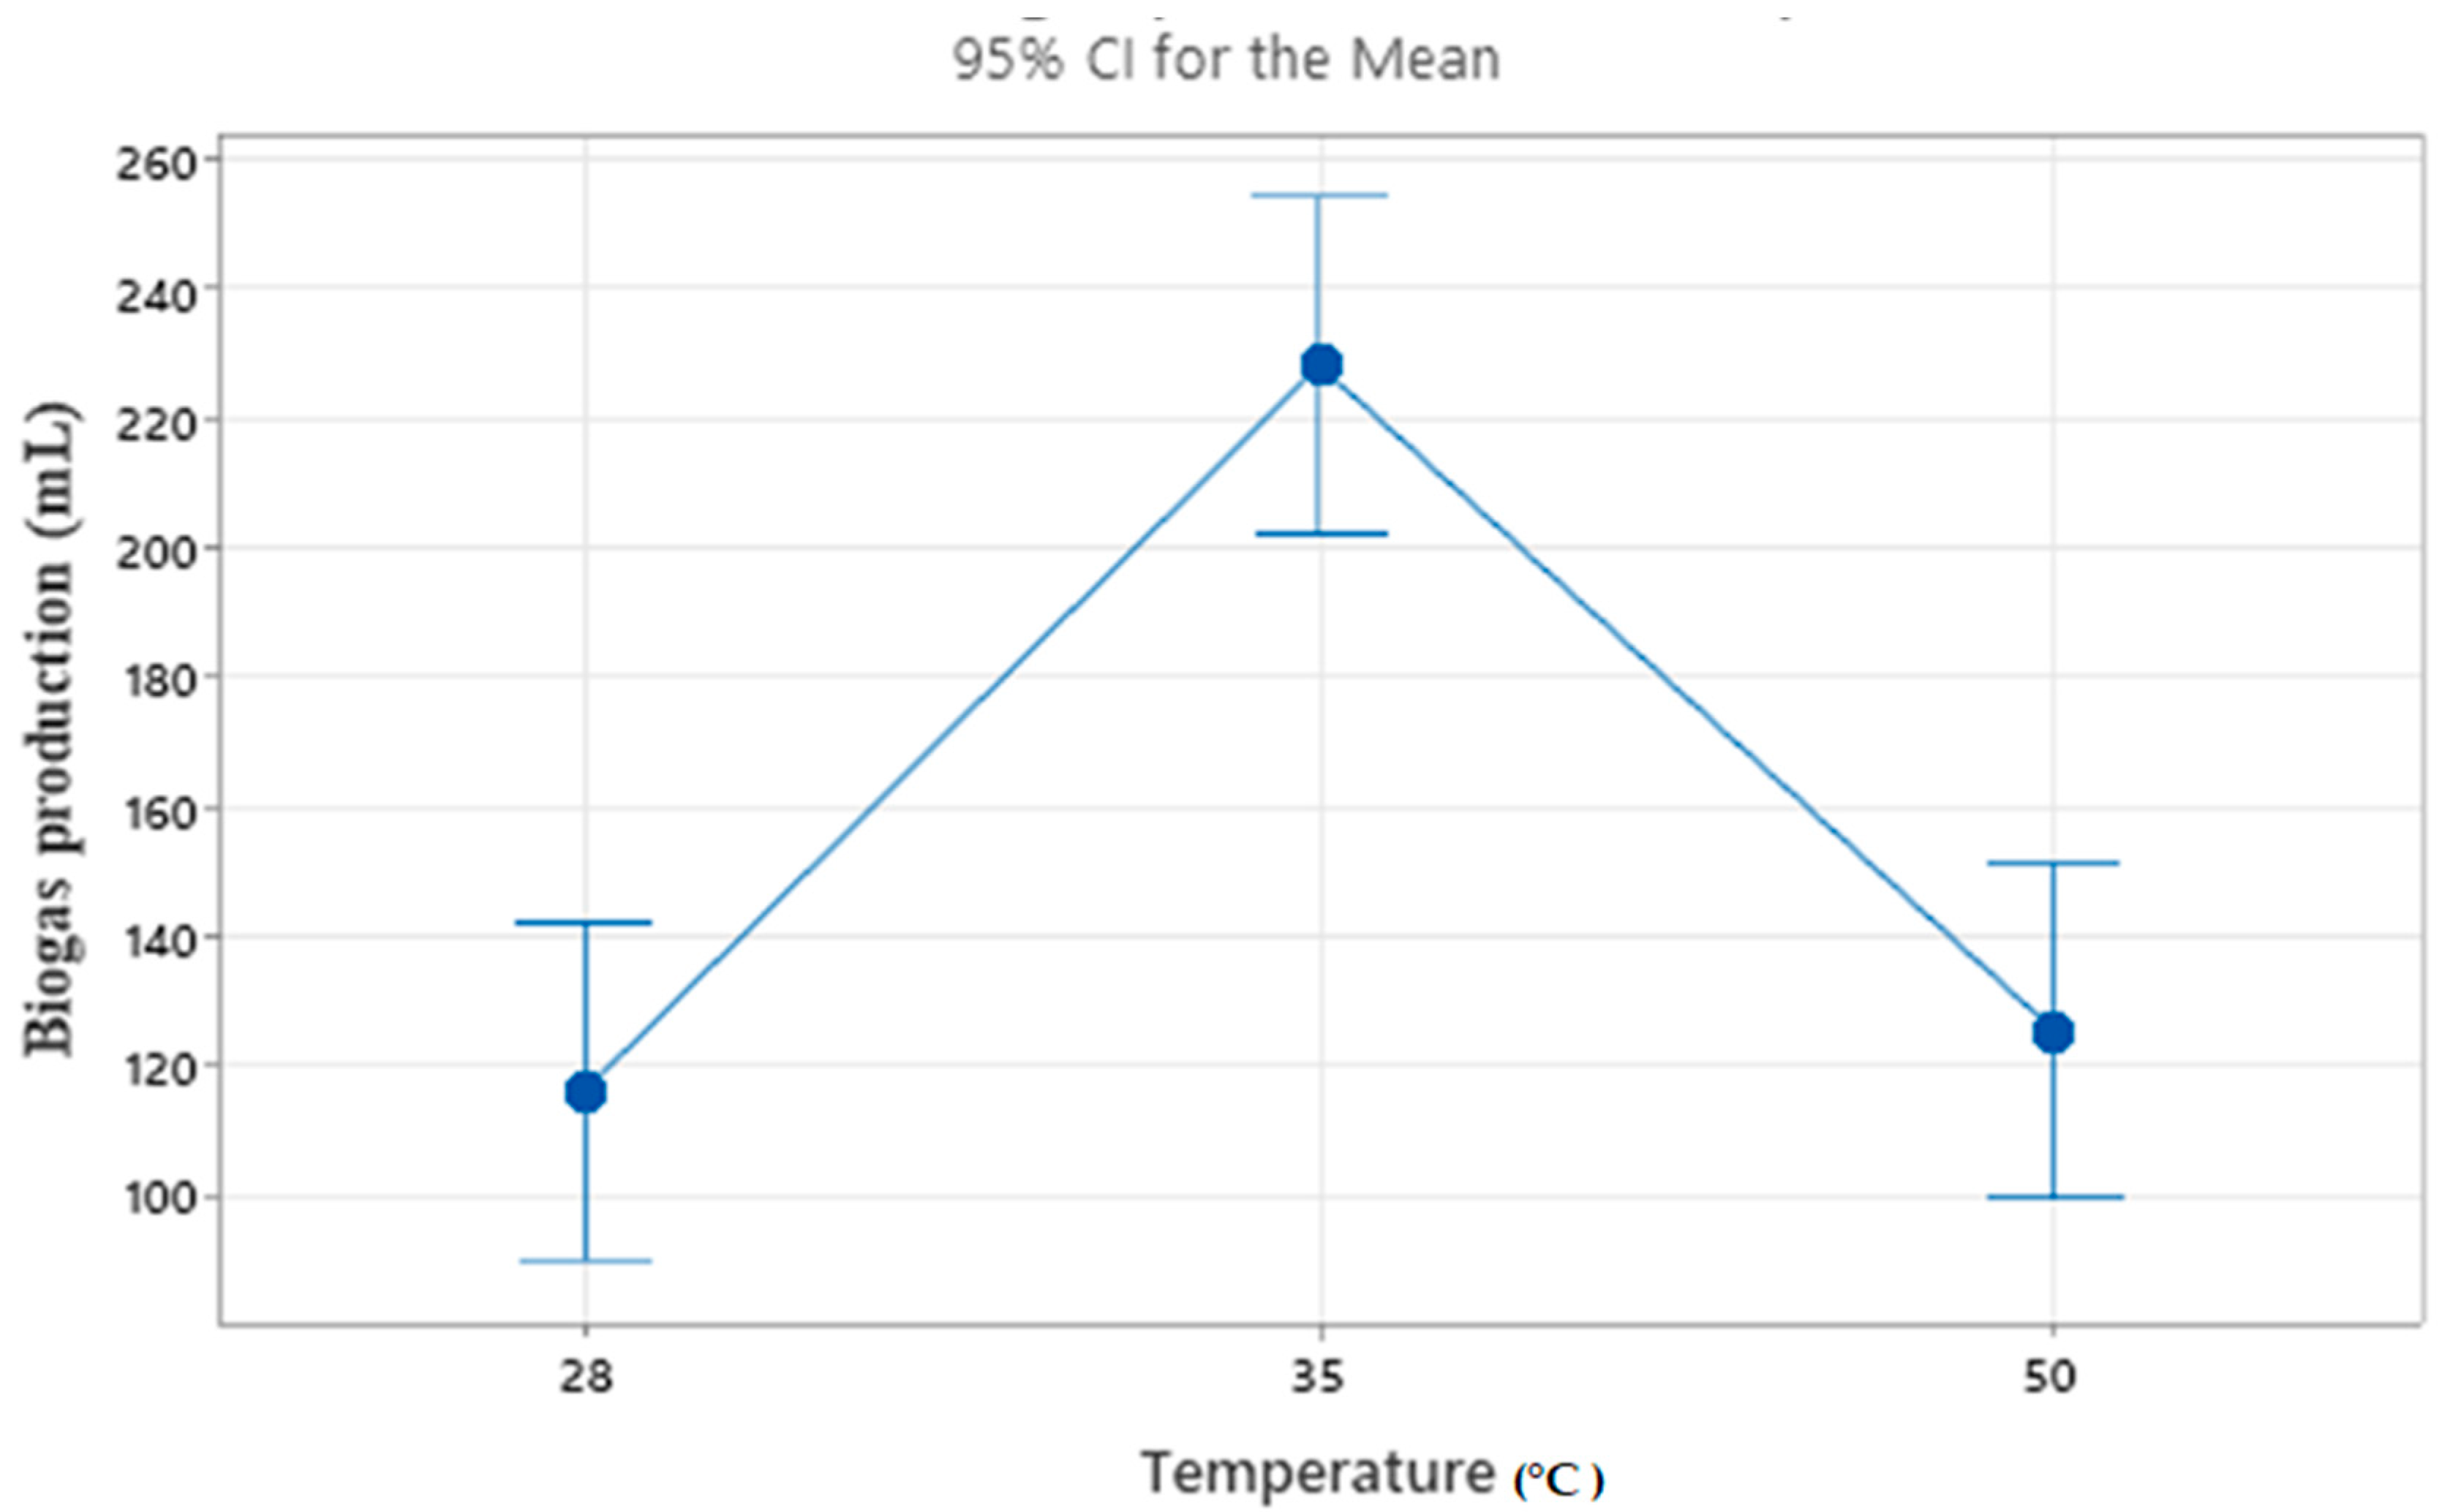
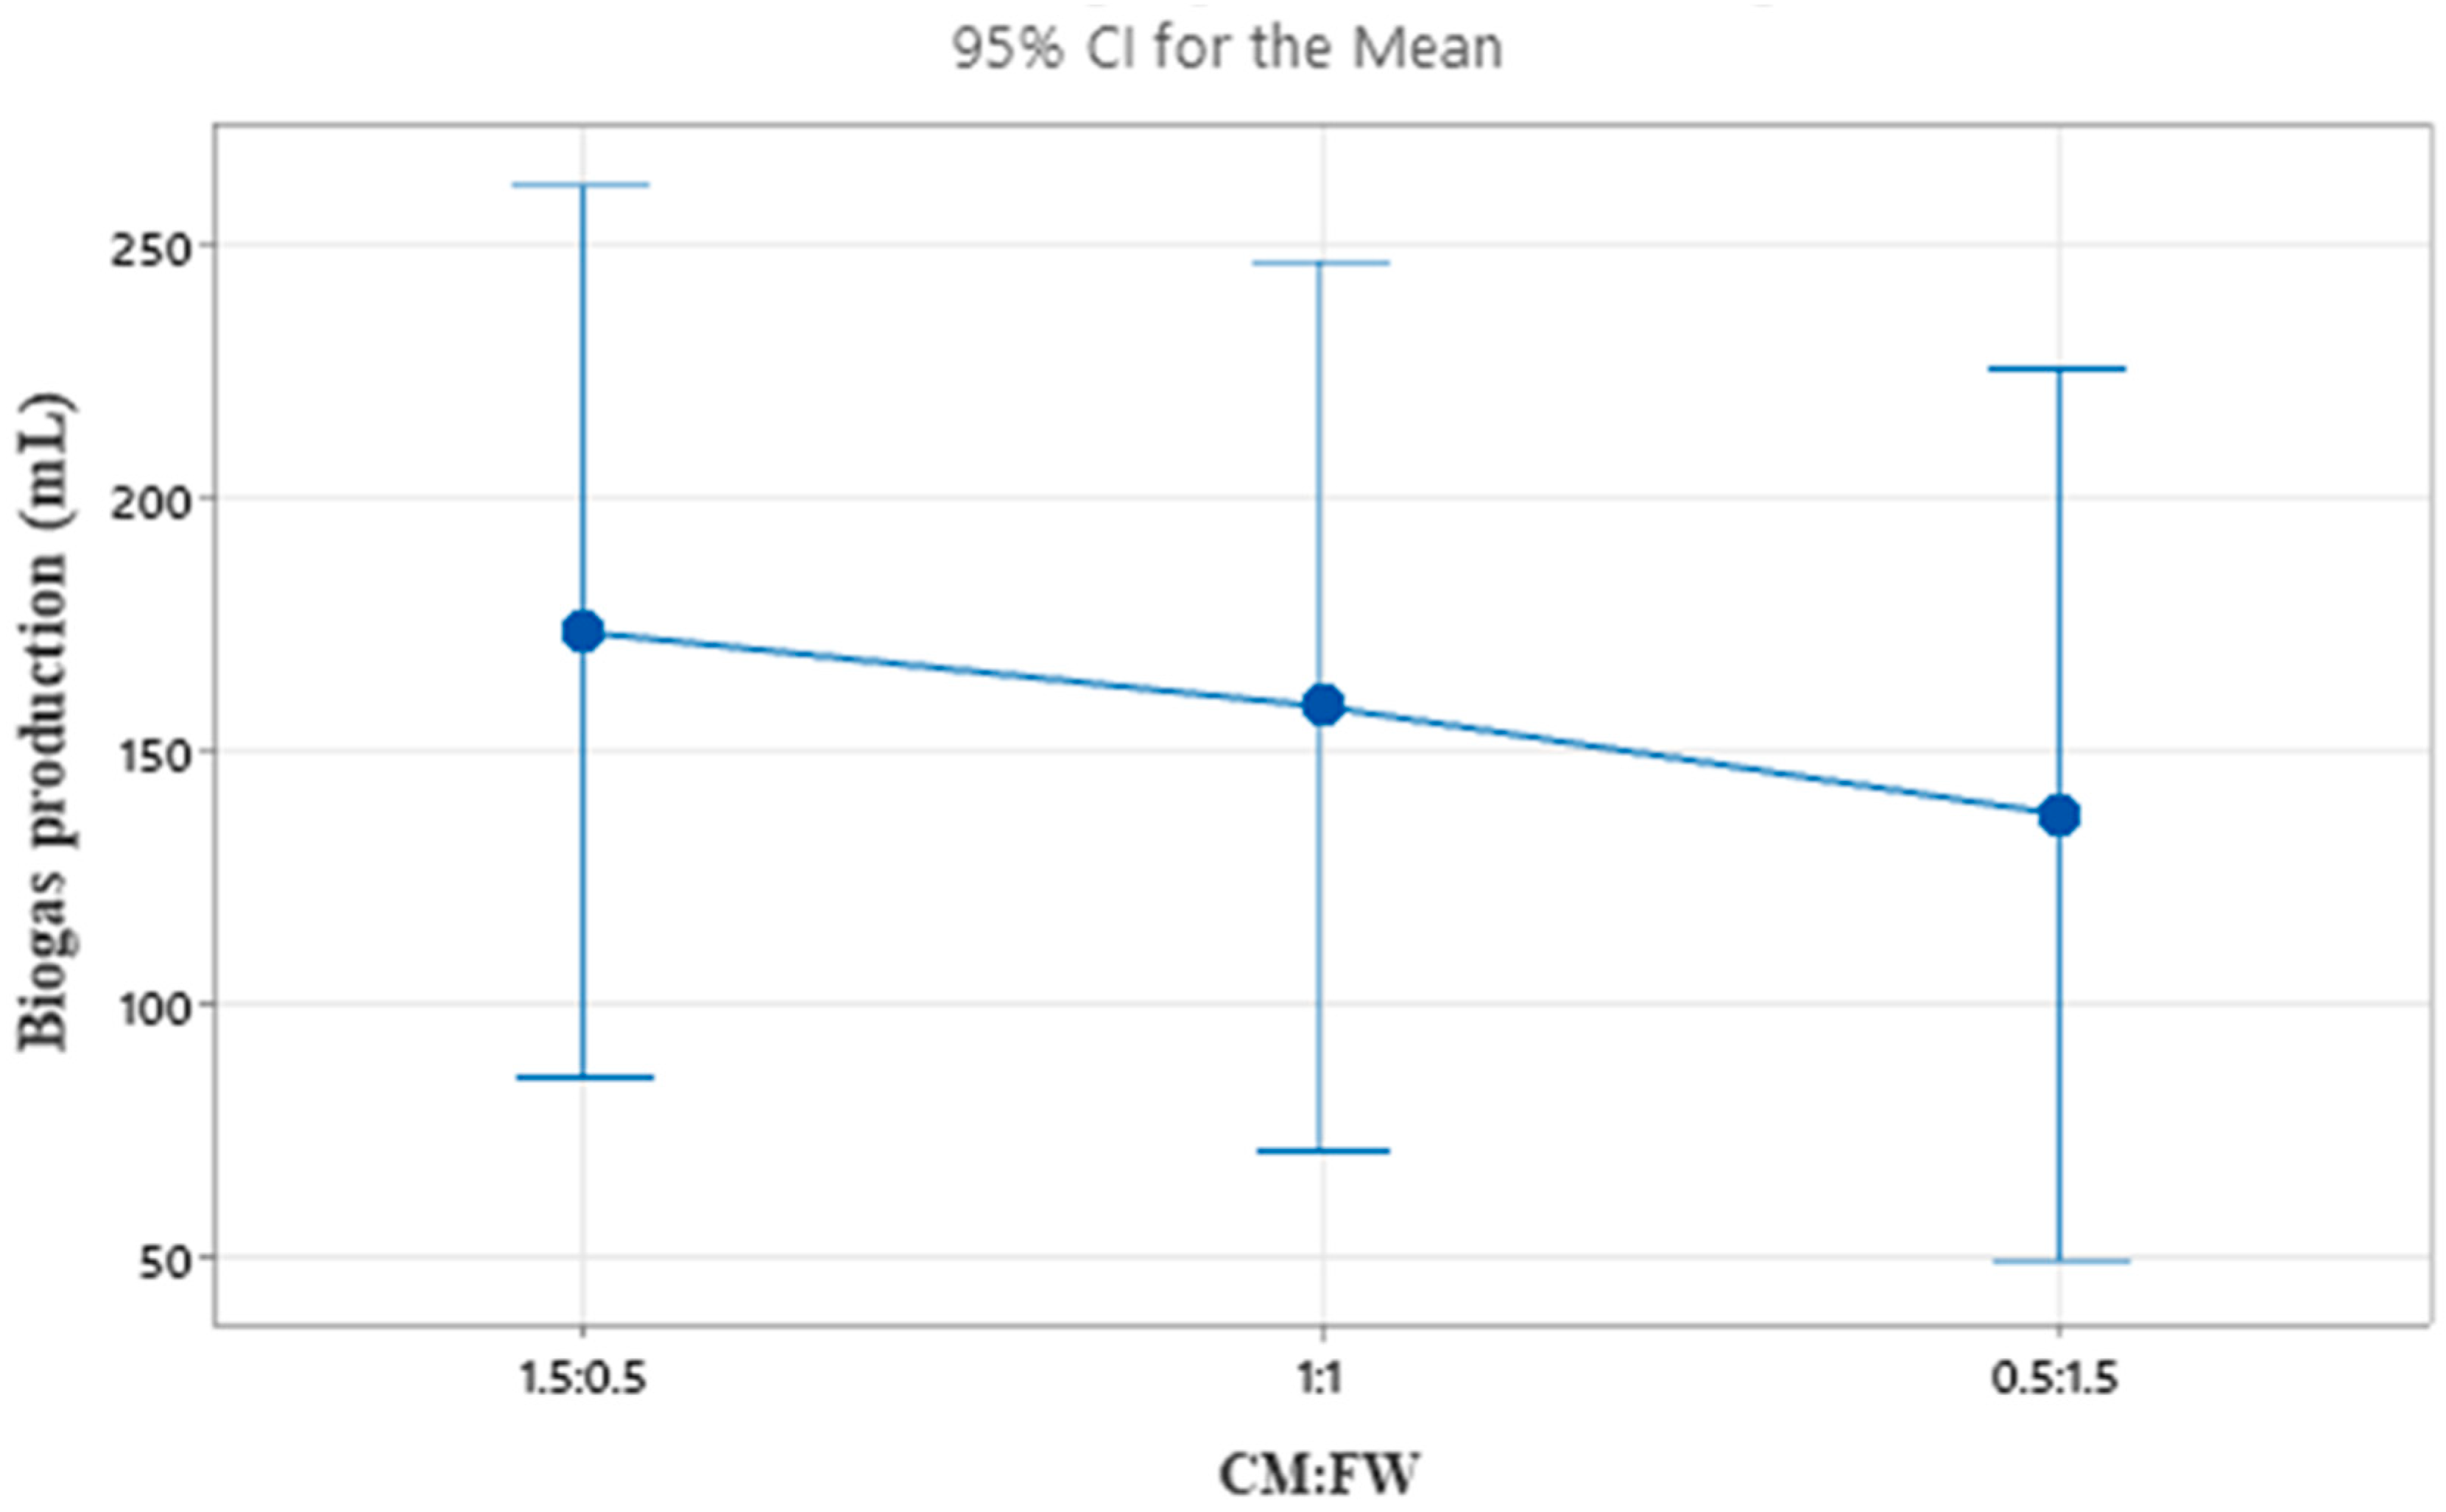
Variance analysis was performed to find the parameters that have the greatest impact on biogas production. The ANOVA in Table 5 indicates that temperature is the most important factor, due to its high impact among the control factors, followed by mixing ratio. But the F value for pH is zero, and thus pH is an unimportant parameter for biogas production. In this study, the selected pH has little variance (5–6). Literature studies showed that higher a variation in pH values has an influence on biogas production [33]. The significance of each parameter, i.e., temperature, pH and mixing ratio, and their values, are shown in Figure 11, Figure 12 and Figure 13, respectively. The ANOVA indicates that temperature is the most important factor due to its high impact (91.96%) among the control factors, followed by a mixing ratio of 7.8%, and a pH of 0.09%.

5. Conclusions

The analysis concluded that the reactor operating at 35 °C provided higher biogas production during the 28-day digestion period. The biogas production rate decreased when temperature varied from 35 °C to 50 °C. A change in digestion temperature from mesophilic to thermophilic caused a sudden decrease in biogas production, due to the decrease in growth of a sufficient number of microbial populations. The analysis of the specific methanogenic performance (SMP) showed that when the temperature increased from 55 °C to 65 °C the activities of methanogens, which utilize the formate, acetate, glucose, and butyrate, decreased. Therefore, in cold-climate areas, the temperature inside the digester must be maintained at around 35 °C. The highest biogas production was reported when the operating pH for the anaerobic digestion process ranged between 5 and 7. Levels of volatile fatty acids and carbon dioxide can change pH. To control the changing pH, acid or alkali can be added to the feedstock in the digester. The results also concluded that the substrates which had undergone ultrasonic pre-treatment showed higher biogas output compared to the untreated, autoclave-treated and microwave-treated substrates. The optimized condition for the highest biogas production during anaerobic co-digestion of food waste and cow manure is a temperature of 35 °C, a pH of 7 and a mixing ratio (CM: FW = 1.5:0.5). ANOVA showed that temperature is the most important input parameter affecting biogas production, followed by mixing ratio.

Author Contributions

The formal analysis, investigation, resources, data curation, writing—original draft preparation, writing—review and editing, and visualization were conducted by S.S.H. and K.M.S.; supervision was conducted by S.T. and A.C.A.N. All authors have read and agreed to the published version of the manuscript.

Funding

The authors are very thankful for funding provided by Kumamoto University, Japan.

Institutional Review Board Statement

Not applicable.

Informed Consent Statement

Not applicable.

Data Availability Statement

The research data can be provided on request.

Acknowledgments

The authors thank the staff of the Department of Mechanical Engineering, Kumamoto University, Japan, for their technical support.

Conflicts of Interest

The authors declare no conflicts of interest.

References

  1. Abdeshahian, P.; Lim, J.S.; Ho, W.S.; Hashim, H.; Lee, C.T. Potential of Biogas Production from Farm Animal Waste in Malaysia. Renew. Sustain. Energy Rev. 2016, 60, 714–723. [Google Scholar] [CrossRef]
  2. Mohammad, N.; Mohamad Ishak, W.W.; Mustapa, S.I.; Ayodele, B.V. Natural Gas as a Key Alternative Energy Source in Sustainable Renewable Energy Transition: A Mini Review. Front. Energy Res. 2021, 9, 625023. [Google Scholar] [CrossRef]
  3. Gürsan, C.; de Gooyert, V. The Systemic Impact of a Transition Fuel: Does Natural Gas Help or Hinder the Energy Transition? Renew. Sustain. Energy Rev. 2021, 138, 110552. [Google Scholar] [CrossRef]
  4. Kabeyi, M.J.; Olanrewaju, O.A. Sustainable Energy Transition for Renewable and Low Carbon Grid Electricity Generation and Supply. Front. Energy Res. 2022, 9, 743114. [Google Scholar] [CrossRef]
  5. Habib, S.S.; Torii, S. Biogas as Alternative to Liquefied Petroleum Gas in Mauritania: An Integrated Future Approach for Energy Sustainability and Socio-Economic Development. Clean Technol. 2024, 6, 453–470. [Google Scholar]
  6. Ryckebosch, E.; Drouillon, M.; Vervaeren, H. Techniques for transformation of biogas to biomethane. J. Biomass Bioenergy 2011, 35, 1633–1645. [Google Scholar] [CrossRef]
  7. Xu, W.; Long, F.; Zhao, H.; Zhang, Y.; Liang, D.; Wang, L.; Lesnik, K.L.; Cao, H.; Zhang, Y.; Liu, H. Performance Prediction of Zvi-Based Anaerobic Digestion Reactor Using Machine Learning Algorithms. Waste Manag. 2021, 121, 59–66. [Google Scholar] [CrossRef] [PubMed]
  8. Sahota, S.; Shah, G.; Ghosh, P.; Kapoor, R.; Sengupta, S.; Singh, P.; Vijay, V.; Sahay, A.; Vijay, V.K.; Thakur, I.S. Review of Trends in Biogas Upgradation Technologies and Future Perspectives. Bioresour. Technol. Rep. 2018, 1, 79–88. [Google Scholar] [CrossRef]
  9. Ma, C.; Liu, J.; Ye, M.; Zou, L.; Qian, G.; Li, Y.-Y. Towards Utmost Bioenergy Conversion Efficiency of Food Waste: Pretreatment, Co-Digestion, and Reactor Type. Renew. Sustain. Energy Rev. 2018, 90, 700–709. [Google Scholar] [CrossRef]
  10. Aboudi, K.; Álvarez-Gallego, C.J.; Romero-García, L.I. Semi-Continuous Anaerobic Co-Digestion of Sugar Beet Byproduct and Pig Manure: Effect of the Organic Loading Rate (OLR) on Process Performance. Bioresour. Technol. 2015, 194, 283–290. [Google Scholar] [CrossRef]
  11. Dhar, H.; Kumar, P.; Kumar, S.; Mukherjee, S.; Vaidya, A.N. Effect of Organic Loading Rate during Anaerobic Digestion of Municipal Solid Waste. Bioresour. Technol. 2016, 217, 56–61. [Google Scholar] [CrossRef]
  12. Deepanraj, B.; Sivasubramanian, V.; Jayaraj, S. Effect of Substrate Pretreatment on Biogas Production through Anaerobic Digestion of Food Waste. Int. J. Hydrogen Energy 2017, 42, 26522–26528. [Google Scholar] [CrossRef]
  13. Ajiboye, O.K.; Ochiegbu, C.V.; Ofosu, E.A.; Gyamfi, S. A Review of Hybrid Renewable Energies Optimisation: Design, Methodologies, and Criteria. Int. J. Sustain. Energy 2023, 42, 648–684. [Google Scholar] [CrossRef]
  14. Yuan, Y.; Bian, A.; Zhang, L.; Chen, T.; Pan, M.; He, L.; Wang, A.; Ding, C. A combined process for efficient biomethane production from corn straw and cattle manure: Optimizing C/N ratio of mixed hydrolysates. BioResources 2019, 14, 1347–1363. [Google Scholar] [CrossRef]
  15. Stroot, P.G.; McMohan, K.D.; Mackie, R.I.; Raskin, L. Anaerobic co-digestion of solid wastes and biosolids under various mixing conditions. Water Res. 2001, 35, 1804–1816. [Google Scholar] [CrossRef]
  16. Mol, S.K.; Sadiq, A. Material Parametric Optimisation of Wing Leading Edge Profile against Soft Body Impact. Int. J. Crashworthiness 2020, 27, 677–687. [Google Scholar] [CrossRef]
  17. Kavitha Mol, S.; Salem, S.C.; Sadiq, A. Crashworthiness enhancement of aluminum alloy used for leading edges of wing and empennage structures. J. Aerosp. Eng. 2022, 35. [Google Scholar] [CrossRef]
  18. Demollari, E. Temperature and Stirring Effect of Biogas Production from Two Different Systems. Am. J. Energy Eng. 2017, 5, 6. [Google Scholar] [CrossRef]
  19. El-Mashad, H.M.; van Loon, W.K.P.; Zeeman, G. A Model of Solar Energy Utilisation in the Anaerobic Digestion of Cattle Manure. Biosyst. Eng. 2003, 84, 231–238. [Google Scholar] [CrossRef]
  20. Trzcinski, A.P.; Stuckey, D.C. Treatment of Municipal Solid Waste Leachate Using a Submerged Anaerobic Membrane Bioreactor at Mesophilic and Psychrophilic Temperatures: Analysis of Recalcitrants in the Permeate Using GC-MS. Water Res. 2010, 44, 671–680. [Google Scholar] [CrossRef]
  21. Kim, J.K.; Oh, B.R.; Chun, Y.N.; Kim, S.W. Effects of Temperature and Hydraulic Retention Time on Anaerobic Digestion of Food Waste. J. Biosci. Bioeng. 2006, 102, 328–332. [Google Scholar] [CrossRef]
  22. Kashyap, D.R.; Dadhich, K.S.; Sharma, S.K. Biomethanation under Psychrophilic Conditions: A Review. Bioresour. Technol. 2003, 87, 147–153. [Google Scholar] [CrossRef] [PubMed]
  23. Fezzani, B.; Ben Cheikh, R. Two-Phase Anaerobic Co-Digestion of Olive Mill Wastes in Semi-Continuous Digesters at Mesophilic Temperature. Bioresour. Technol. 2010, 101, 1628–1634. [Google Scholar] [CrossRef]
  24. Briški, F.; Vuković, M.; Papa, K.; Gomzi, Z.; Domanovac, T. Modelling of Composting of Food Waste in a Column Reactor. Chem. Pap. 2007, 61, 24–29. [Google Scholar] [CrossRef]
  25. Zhu, B.; Gikas, P.; Zhang, R.; Lord, J.; Jenkins, B.; Li, X. Characteristics and Biogas Production Potential of Municipal Solid Wastes Pretreated with a Rotary Drum Reactor. Bioresour. Technol. 2009, 100, 1122–1129. [Google Scholar] [CrossRef] [PubMed]
  26. Molnar, L.; Bartha, I. High Solids Anaerobic Fermentation for Biogas and Compost Production. Biomass 1988, 16, 173–182. [Google Scholar] [CrossRef]
  27. Anand, R.C.; Singh, R. A Simple Technique, Charcoal Coating around the Digester, Improves Biogas Production in Winter. Bioresour. Technol. 1993, 45, 151–152. [Google Scholar] [CrossRef]
  28. Desai, M.; Madamwar, D. Anaerobic Digestion of a Mixture of Cheese Whey, Poultry Waste and Cattle Dung: A Study of the Use of Adsorbents to Improve Digester Performance. Environ. Pollut. 1994, 86, 337–340. [Google Scholar] [CrossRef]
  29. Hren, R.; Petrovič, A.; Čuček, L.; Simonič, M. Determination of Various Parameters during Thermal and Biological Pretreatment of Waste Materials. Energies 2020, 13, 2262. [Google Scholar] [CrossRef]
  30. Hamdi, M. Effects of Agitation and Pretreatment on the Batch Anaerobic Digestion of Olive Mil. Bioresour. Technol. 1991, 36, 173–178. [Google Scholar] [CrossRef]
  31. Lin, Y.; Wang, D.; Wu, S.; Wang, C. Alkali Pretreatment Enhances Biogas Production in the Anaerobic Digestion of Pulp and Paper Sludge. J. Hazard. Mater. 2009, 170, 366–373. [Google Scholar] [CrossRef]
  32. Mata-Alvarez, J.; Macé, S.; Llabrés, P. Anaerobic Digestion of Organic Solid Wastes. an Overview of Research Achievements and Perspectives. Bioresour. Technol. 2000, 74, 3–16. [Google Scholar] [CrossRef]
  33. Khalid, A.; Arshad, M.; Anjum, M.; Mahmood, T.; Dawson, L. The Anaerobic Digestion of Solid Organic Waste. Waste Manag. 2011, 31, 1737–1744. [Google Scholar] [CrossRef] [PubMed]
  34. Ward, A.J.; Hobbs, P.J.; Holliman, P.J.; Jones, D.L. Optimisation of the Anaerobic Digestion of Agricultural Resources. Bioresour. Technol. 2008, 99, 7928–7940. [Google Scholar] [CrossRef] [PubMed]
  35. Lee, D.H.; Behera, S.K.; Kim, J.W.; Park, H.-S. Methane Production Potential of Leachate Generated from Korean Food Waste Recycling Facilities: A Lab-Scale Study. Waste Manag. 2009, 29, 876–882. [Google Scholar] [CrossRef] [PubMed]
  36. Wang, X.; Li, Z.; Bai, X.; Zhou, X.; Cheng, S.; Gao, R.; Sun, J. Study on Improving Anaerobic Co-Digestion of Cow Manure and Corn Straw by Fruit and Vegetable Waste: Methane Production and Microbial Community in CSTR Process. Bioresour. Technol. 2018, 249, 290–297. [Google Scholar] [CrossRef] [PubMed]
  37. Hills, D.J. Effects of Carbon: Nitrogen Ratio on Anaerobic Digestion of Dairy Manure. Agric. Wastes 1979, 1, 267–278. [Google Scholar] [CrossRef]
  38. Ahring, B.K.; Ibrahim, A.A.; Mladenovska, Z. Effect of temperature increase from 55 to 65 °C on performance and microbial population dynamics of an anaerobic reactor treating cattle manure. Water Res. 2001, 35, 2446–2452. [Google Scholar] [CrossRef]
  39. Stams, A.J. Metabolic interactions between anaerobic bacteria in methanogenic environments. Antonie Leeuwenhoek 1994, 66, 271–294. [Google Scholar] [CrossRef]
  40. Ahring, B.K. Status on science and application of thermophilic anaerobic digestion. Water Sci. Technol. 1994, 30, 241–249. [Google Scholar] [CrossRef]
  41. Sorensen, A.; Sørensen, A.H. Measurements of the specific methanogenic activity of anaerobic digestor biomass. Appl. Microbiol. Biotechnol. 1993, 40, 427–431. [Google Scholar] [CrossRef]
  42. Deepanraj, B.; Sivasubramanian, V.; Jayaraj, S. Experimental and kinetic study on anaerobic digestion of food waste: The effect of total solids and ph. J. Renew. Sustain. Energy 2015, 7, 063104. [Google Scholar] [CrossRef]
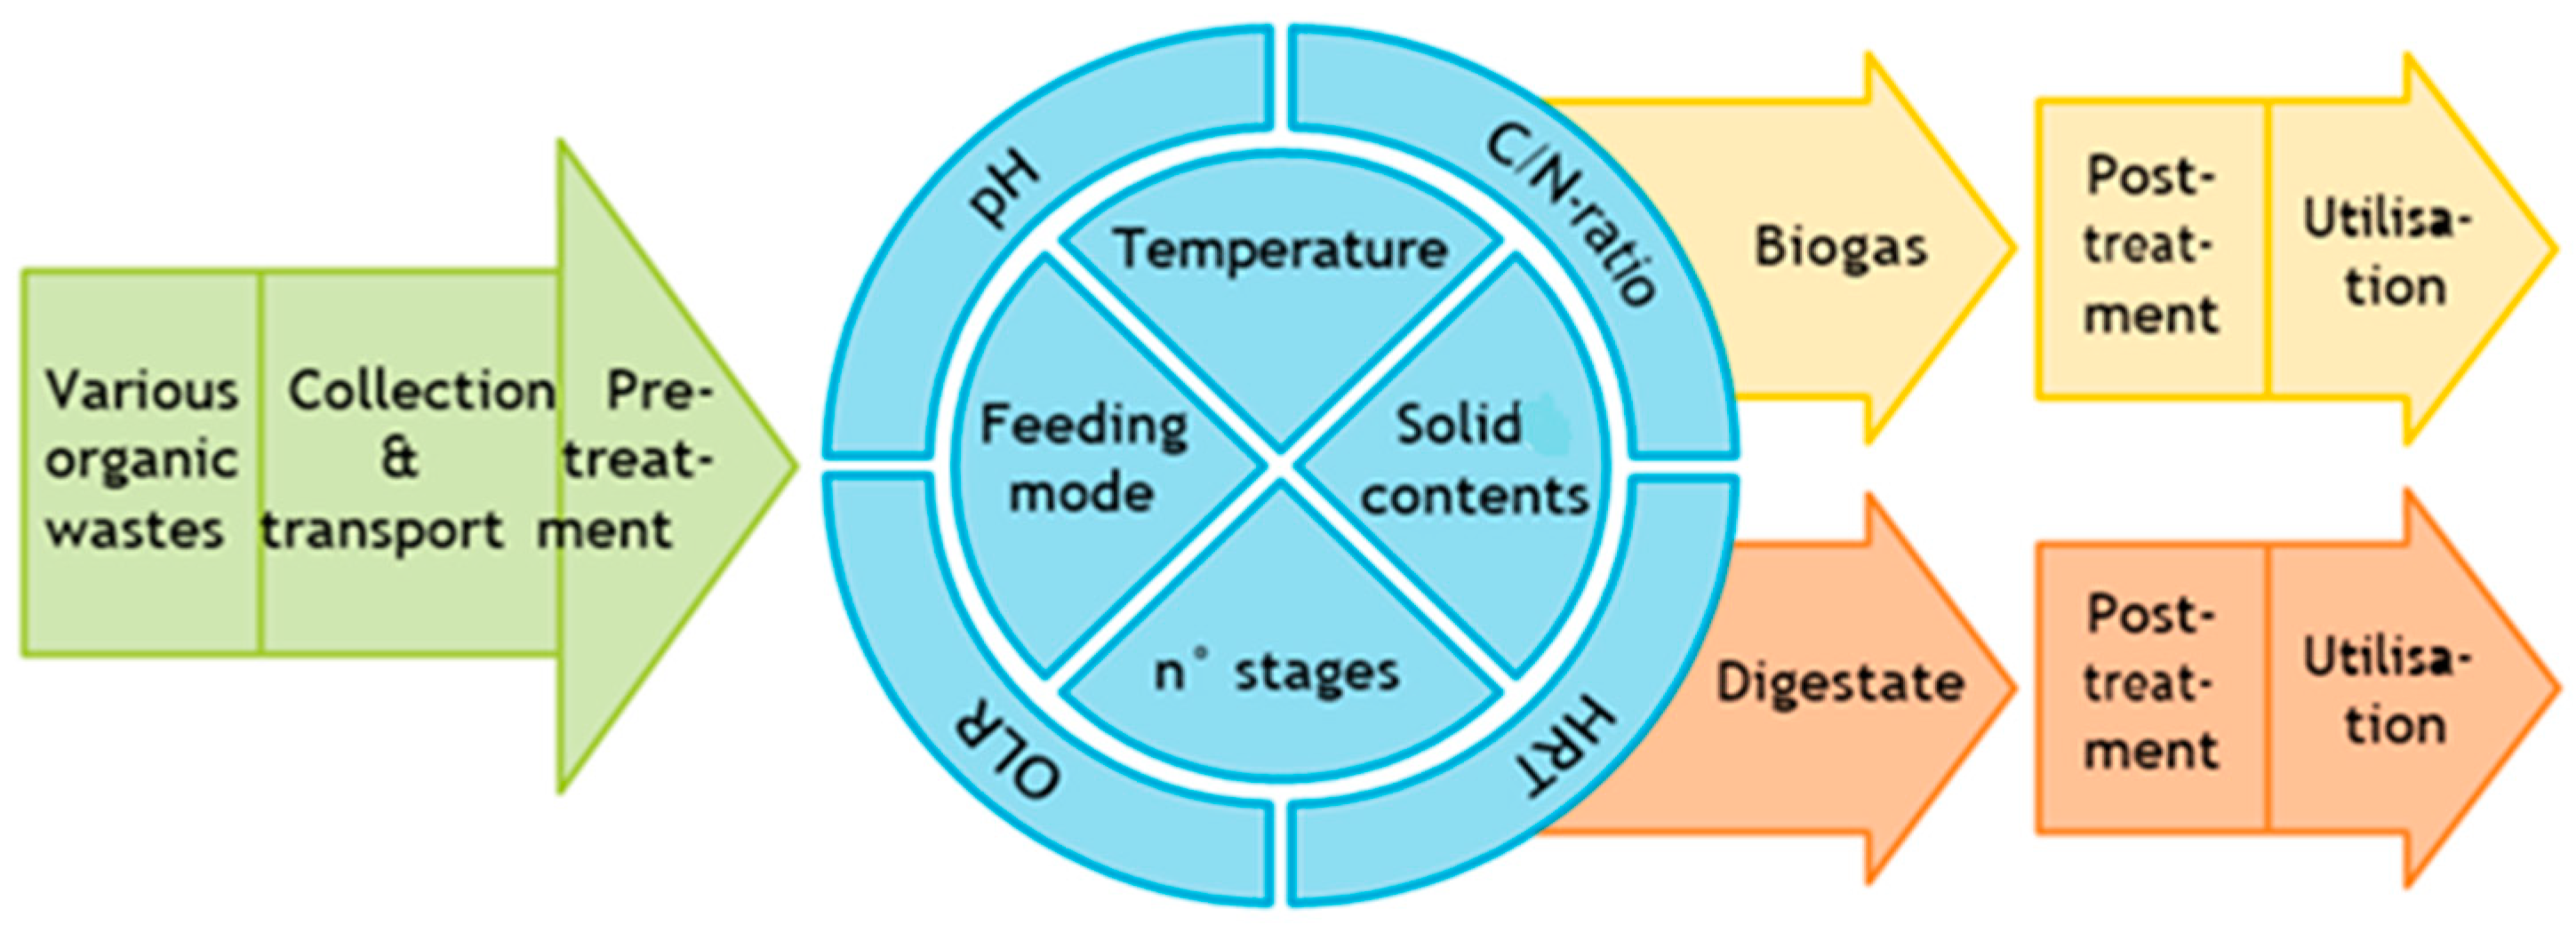
Figure 1. Biogas production process [3].
Biomass 04 00038 g001
Figure 2. Experiment test set-up for anaerobic digestion.
Biomass 04 00038 g002
Figure 3. The diagram of experimental test set-up for anaerobic digestion.
Biomass 04 00038 g003
Figure 4. Biogas volume from different reactors kept at different temperatures.
Biomass 04 00038 g004
Figure 5. pH of the slurry of different reactors kept at different temperatures.
Biomass 04 00038 g005
Figure 6. Specific methanogenic performance (SMP) in (µmol CH4/g VS/h) at temperatures of 55 °C and 65 °C.
Biomass 04 00038 g006
Figure 7. Specific methanogenic performance (SMP) in (µmol CH4/g VS/h) at temperatures of 55 °C and 65 °C [38].
Biomass 04 00038 g007
Figure 8. Comparison of biogas volume obtained from cow dung which has undergone different pre-treatments.
Biomass 04 00038 g008
Figure 9. Effect of different parameters on mean biogas production.
Biomass 04 00038 g009
Figure 10. Effect of different factors on mean S/N ratio of biogas production.
Biomass 04 00038 g010
Figure 11. Analysis-of-variance interval plot of biogas production vs. temperature.
Biomass 04 00038 g011
Figure 12. Analysis-of-variance interval plot of biogas production vs. pH.
Biomass 04 00038 g012
Figure 13. Analysis-of-variance interval plot of biogas production vs. mixing ratio.
Biomass 04 00038 g013
Table 1. Control factors and their levels.
Control ParametersLevel 1Level 2Level 3
Temperature (°C)283550
pH567
Mixing ratio (CM:FW)1.5:0.51:10.5:1.5
Table 2. Biogas production from experiments conducted as per the Taguchi L9 orthogonal array design.
Factors Affecting Anaerobic DigestionResults
Exp. No.Temperature (°C)pHMixing RatioBiogas Production (mL)S/N Ratio
12851.5:0.513042.2789
22861:112041.5836
328705:1:59839.8245
43551:122847.1587
53560.5:1.520646.2773
63571.5:0.525047.9588
75050.5:1.510840.6685
85061.5:0.514042.9226
95071:112842.1442
Table 3. Response Table for Means.
LevelTemperature (°C)pHMixing Ratio (CM:FW)
1116.0155.3173.3
2228.0155.3158.7
3125.3158.7137.3
Delta112.03.336.0
Rank132
Table 4. Response Table for Signal-to-Noise Ratios (Larger is better).
LevelTemperature (°C)pHMixing Ratio (CM:FW)
141.2343.3744.39
247.1343.5943.63
341.9143.3142.26
Delta5.900.292.13
Rank132
Table 5. ANOVA table.
SourceDFAdj SSAdj MSF-Valuep-ValueR2
Temperature223,171.611,585.834.30.00191.96
pH222.211.100.9970.09
CM:FW21966.2983.10.250.7847.8
Disclaimer/Publisher’s Note: The statements, opinions and data contained in all publications are solely those of the individual author(s) and contributor(s) and not of MDPI and/or the editor(s). MDPI and/or the editor(s) disclaim responsibility for any injury to people or property resulting from any ideas, methods, instructions or products referred to in the content.