Article

Optimizing the Extraction Process of Bioactive Compounds for Sustainable Utilization of Vitis vinifera and Citrus sinensis Byproducts

by
Nestor Everardo Aranda-Ledesma
1,
Israel Aguilar-Quintero
1,
Claudia Lizeth Robledo-Jiménez
1,
Pedro Aguilar-Zárate
2,
Romeo Rojas
1 and
Guillermo Cristian Guadalupe Martínez-Ávila
1,*
1
Laboratory of Chemistry and Biochemistry, School of Agronomy, Autonomous University of Nuevo Leon, Francisco Villa S/N, Ex Hacienda El Canadá, General Escobedo 66050, Nuevo Leon, Mexico
2
Laboratorio Nacional CONAHCYT para la Evaluación de Productos Bióticos-LaNAEPBi, Unidad de Servicio Tecnológico Nacional de México, Instituto Tecnológico de Ciudad Valles, Ciudad Valles 79010, San Luis Potosí, Mexico
*
Author to whom correspondence should be addressed.
Biomass 2024, 4(3), 826-842; https://doi.org/10.3390/biomass4030046
Submission received: 12 June 2024 / Revised: 3 July 2024 / Accepted: 22 July 2024 / Published: 2 August 2024

Abstract

:
The objective of this work was to optimize the ultrasound-assisted extraction process of bioactive compounds from byproducts of V. vinifera and C. sinensis using the Taguchi methodology. Moreover, the flavonoid content and the subsequent evaluation of the antioxidant potential through three different assays (ABTS∙+ radical inhibition, ferric-reducing power (FRAP), and OH radical inhibition) were determined. Furthermore, the potential of these metabolites to inhibit the α-amylase enzyme and their protective effect to inhibit the hemolysis due to oxidative processes was assessed. In addition, functional group analysis was performed using Fourier transform infrared spectroscopy. The Taguchi L9 statistical model enabled the increase in bioactive compound yields by evaluating factors such as particle size, temperature, time, and solvent concentration. The samples were found to contain flavonoid-type compounds, which translated into their ability to inhibit free radicals (ABTS∙+ and OH) and act as reducing agents (FRAP). They exhibited inhibitory effects on the α-amylase enzyme involved in the assimilation of starch and its derivatives, along with providing over 50% protection to erythrocytes in the presence of free radicals generated by AAPH. Furthermore, FTIR analysis facilitated the identification of characteristic functional groups of phenolic compounds (O–H, C–H, C=C, C–C, C=O). These findings suggest that the analyzed byproducts can effectively serve as sources of bioactive compounds with potential applications in the formulation of functional foods and medicines. However, it is necessary to conduct compound identification and toxicity analysis to ensure the safety of these bioactive compounds.

Graphical Abstract

1. Introduction

Fruit byproducts such as seeds, peels, stems, bark, and leaves are often discarded into the environment, causing serious disposal problems in the agri-food industry. Consequently, research is currently being conducted worldwide to minimize these effects [1].
In this sense, grapes (Vitis sp.) are among the most highly produced fruits worldwide, with an annual production exceeding 75 million tons. These fruits are rich in carbohydrates, organic acids, minerals, vitamins, and polyphenolic compounds [2]. Grapes are primarily used for wine production and its derivatives, with approximately 80% of the total production destined for this purpose. Consequently, large amounts of byproducts are generated each year [3]. Grape pomace is the solid residue resulting from grape pressing, and it consists of the peel, pulp, seeds, and stems of the fruit. These residues have traditionally been used as fodder, fertilizer, or to make fuel. However, their application in alternative processes has been limited and inefficient due to inadequate management of the residues post-grape processing [4].
On the other hand, oranges (C. sinensis), along with other citrus fruits, play an important role in the agro-industrial industry. Together, they are the most-produced fruit crop in the world with more than 100 million tons, and about 30% is destined for industrial processing. After this processing, the residues can account for between 50% and 70% of the total weight, generating large amounts of biomass with promising potential due to its content of bioactive compounds. Moreover, these wastes have been used to produce bioethanol, biogas, and value-added products [5]. On the other hand, bioactive compounds show potential for use as food additives in the cosmetic and pharmaceutical industries.
In this sense, the lack of effective methods and techniques to process agro-industrial wastes to obtain a quality raw material suitable for new products is one of the main reasons why these bioactive compound matrices are not exploited within the industry. Furthermore, the low efficiency and environmental toxicity caused by the organic solvents used in conventional extraction techniques have encouraged the need to apply the concept of ‘green chemistry’ to develop methods that are environmentally friendly and allow obtaining a high yield in the extraction of bioactive compounds while reducing time and costs. One of the most widely used techniques in non-conventional extraction is ultrasound-assisted extraction (UAE) [6]. UAE produces sufficiently high frequencies, which leads to cavitation through the formation of bubbles that grow and then collapse due to high pressure and temperature. When applied on plant material, cavitation facilitates matrix leaching by increasing mass and energy transfer, as well as solvent diffusion [7]. Although UAE increases the yields of bioactive compounds obtained concerning other conventional methods, the combination of this system with a statistical design such as Taguchi L9 allows the evaluation of multiple variables that influence a process at different levels and with a small number of experiments. This design not only reduces costs but also improves the quality of the final product and provides solid experimental solutions. Therefore, the Taguchi design can determine the experimental conditions that have the most significant impact on the desired characteristics of a specific process [8].
For the aforementioned, the objective of the research was to optimize the extraction process of bioactive compounds from agro-industrial byproducts of V. vinifera and C. sinensis and subsequently evaluate their antioxidant properties, enzymatic activity, and anti-hemolytic effect.

2. Materials and Methods

2.1. Reagents

Ethanol, Trolox (6-hydroxy-2,5,7,8-tetramethylchroman-2-carboxylic acid), catechin, gallic acid, linoleic acid, gallic acid, dibasic potassium phosphate (K2HPO4), ABTS∙+ (2,2′-azino-bis(3-ethylbenzothiazoline-6-sulfonic acid), Amberlite XAD-16, ferrous chloride (FeCl2), ferric chloride (FeCl3), monobasic potassium phosphate (KH2PO4), anhydrous sodium carbonate (Na2CO3), potassium ferricyanide (K3[Fe(CN)6]), sodium chloride (NaCl), potassium chloride (KCl), aluminum chloride (AlCl3), acetic acid (CH3COOH), sodium acetate (CH3COONa), hydrogen peroxide (H2O2), salicylic acid (C7H6O3), 2,2′-Azobis(2-amidinopropane) dihydrochloride (AAPH), iron(II) sulfate (FeSO4), sodium hydroxide (NaOH), porcine pancreatic α-amylase, starch, dinitrosalicylic acid (C7H4N2O7), sodium nitrite (NaNO2), phenol (C6H6O) and sodium sulfite (Na2SO3), were purchased from Sigma-Aldrich (Burlington, MA, USA).

2.2. Sample Collection

The agro-industrial byproducts were obtained from commercial companies: orange pomace (Citrus sinensis) from Jugos y Concentrados Regios Co., Monterrey, Nuevo Leon, Mexico, collected in August 2022. Grape pomace (Vitis vinifera L.) from Bodega Cedros, Arteaga, Coahuila, Mexico collected in August 2021.

2.3. Taguchi L9 Design

The Taguchi methodology was used to optimize the extraction process of bioactive compounds. Four factors, each with three levels, were evaluated, generating an L9 array (34). The experimental data were analyzed using Statistica 7 software.
In the present investigation, the quality characteristic “bigger is better” was utilized, as described by the loss function L(y) = k ∗ (1/y2), which is represented by the following equation:
E [ L ( y ) ] = 10 log 10 [ ( 1 n ) Σ ( 1 y i 2 ) ]
where the factor −10 measures the ratio of the inverse of ‘‘poor quality’’, and n represents the number of samples. Once the analysis of variance (ANOVA) was performed (ESI2 and ESI4), their percentage contribution was determined using the following equation:
P = S S i S S T 100   % = S S i M S i d f i S S T × 100 %
where P represents the contribution percentage, SSi denotes the individual sum of squares, SST represents the total sum of squares, MSi indicates the initial mean square, and dfi signifies degrees of individual freedom.

2.4. Extraction and Purification of Polyphenolic Compounds

For the extraction process, particle size, temperature, solvent concentration (ethanol), and extraction time were modified according to Table 1. Five g of sample (pre-set to the particle size) were placed in amber-colored vials, and 120 mL of the corresponding solvent concentration (ethanol) was added. The mixture was then subjected to treatment in Digital Ultrasonic Cleaner CO-Z (360 W) (Shanghai, China) ultrasound bath at 40 kHz ultrasonic frequency with corresponding times and temperatures. Thereafter, the plant material was filtrated using Whatman #41 filter paper, and ethanol was removed using a Yamato RE200 rotary evaporator to continue with the purification process. The purification of polyphenolic compounds was conducted using an Amberlite XAD-16 column as the stationary phase and ethanol as the mobile phase. A total of 20 mL of the aqueous extract was loaded onto the amberlite column, and distilled water was used as a wash solution to remove unwanted substances. Ethanol was subsequently added to elute the purified polyphenolic compounds. The ethanol was evaporated at 50 °C for 24 h, and the polyphenolic compounds were recovered as a fine powder. They were stored in amber Eppendorf tubes until use.

2.5. Preparation of Samples

Polyphenolic compounds extracted from V. vinifera and C. sinensis were dissolved in a 50% water–ethanol mixture. The IC50 values for ABTS∙+ radical inhibition were determined through serial dilutions of the same sample. Thereafter, the concentrations of flavonoids, ferric-reducing power (FRAP), hydroxyl radical (OH) inhibition, and α-amylase inhibition were determined based on the IC50 concentration. Furthermore, the anti-hemolytic activity was determined at a concentration of 500 µg∙mL−1.

2.6. Determination of Total Flavonoids

Flavonoid content was determined according to the methodology reported by Aranda-Ledesma et al. [9]. Thirty-one μL of each sample were mixed with 9.3 μL of 5% sodium nitrite and 9.3 μL of distilled water. The solution was mixed and incubated for 3 min at 40 °C. Next, 9.3 μL of 10% aluminum chloride was added and incubated again for 3 min at 40 °C. Finally, 125 μL of sodium hydroxide was added at (0.5 mol∙L−1) and kept in the dark for 30 min. The absorbance was recorded at 510 nm using a Synergy HTX MULTI-MODE READER microplate reader (Avenue, Santa Clara, CA, USA). Results were expressed as Quercetin Equivalents (QE µg∙mL−1) using a curve of the same standard with a coefficient of determination (R2 = 0.9960).

2.7. Antioxidant Activity

The antioxidant activity of the polyphenolic compounds was evaluated by the ABTS∙+ radical inhibition and ferric-reducing power assays, according to the previous methodologies reported by Aranda-Ledesma et al. [9]. Moreover, the hydroxyl radical inhibition was determined based on the methodology reported by Ge et al. [10] as follows:

2.7.1. ABTS∙+ Radical Scavenging Assay

The ABTS∙+ radical cation was generated by mixing an aqueous solution of ABTS∙+ (7 mmol∙L−1) with potassium persulfate (2.45 mmol∙L−1) in a 2:1 ratio. This mixture was then kept in the dark at room temperature for 12 h before use. The absorbance of the ABTS∙+ solution was adjusted with ethanol to 0.700 ± 0.002 at 734 nm. A sample of 5 μL was mixed with 95 μL of ABTS∙+ solution, and the absorbance was measured at 734 nm after 1 min of reaction using a Synergy HTX MULTI-MODE READER microplate (Avenue, Santa Clara, CA, USA). The results were expressed as Trolox Equivalents (TE µg∙mL−1) using a curve of the same standard with a coefficient of determination of R2 = 0.9989 for V. vinifera and R2 = 0.9922 for C. sinensis.

2.7.2. Ferric-Reducing Power (FRAP)

A volume of 5 μL of each sample was mixed with 12 μL of phosphate buffer (1 mol∙L−1, pH 7). Then, 22 μL of 1% potassium ferricyanide was added to the reaction mixture, homogenized, and incubated at 50 °C for 20 min. Afterward, 12 μL of 10% trichloroacetic acid, 45 μL of distilled H2O, and 10 μL of 0.1% ferric chloride were added, and the absorbance was recorded at 700 nm. The results were expressed as Gallic Acid Equivalents (GAE µg∙mL−1) from a curve of the same standard with a coefficient of determination (R2 = 0.9973).

2.7.3. Hydroxyl Radical (OH) Scavenging Activity

The hydroxyl radical was generated by the Fenton reaction, which consists of mixing 200 µL of FeSO4 (6 mmol∙L−1) and 200 µL of H2O2 (24 mmol∙L−1). Thereafter, 400 µL of each sample was added, and the reaction was brought to a final volume of 2.5 mL with salicylic acid (8 mmol∙L−1). Finally, the mixture was incubated for 30 min at 37 °C, and the absorbance was measured at 510 nm. The results were expressed as the percentage of inhibition (%) using the following equation:
I n h i b i t i o n   % = A 1 A 0 A 2 × 100
where A1 is the absorbance of the sample, A0 is the absorbance of the control, and A2 is the absorbance of the reagent bank in the absence of salicylic acid.

2.8. In Vitro and Ex Vivo Assays

2.8.1. Inhibition of α-Amylase

Inhibition of α-amylase was determined based on the methodology reported by Aranda-Ledesma et al. [9]. A total of 50 µL of each sample was mixed with 50 µL of the enzyme solution (1 mg∙mL−1) previously dissolved in saline phosphate buffer. The mixture was incubated at 37 °C for 10 min. Then, 50 µL of a starch solution (1%) was added and incubated at the same temperature for 10 min. Thereafter, a DNS solution (prepared with 1% dinitrosalicylic acid, 0.2% phenol, 0.05% sodium sulfite, and 1% sodium hydroxide) was added. The mixture was then heated in a water bath at 100 °C for 5 min. Furthermore, 1.5 mL of distilled water was added to the dilute sample. The absorbance was recorded at 540 nm using a Synergy HTX MULTI-MODE READER microplate (Avenue, Santa Clara, CA, USA). The results were expressed as the percentage of inhibition (%) using the following equation:
I n h i b i t i o n   % = A c A s A c × 100
where Ac represents the absorbance value of the control, and As is the reaction value according to each sample.

2.8.2. Inhibition of Hemolysis

The anti-hemolytic activity was determined using the methodology reported by Monroy-Garcia et al. [11] with slight modifications. A volume of 5 mL of blood was collected from a healthy male donor via venipuncture into purple tubes containing EDTA. The blood was centrifuged at 1500 rpm and 25 °C for 12 min to separate erythrocytes from plasma and washed three times with 10 mL of PBS (containing sodium chloride (137 mmol∙L−1), potassium chloride (2.7 mmol∙L−1), disodium phosphate (10 mmol∙L−1), and monobasic potassium phosphate (1.8 mmol∙L−1) at pH 7.4). The erythrocyte concentration was adjusted to a density of 8 × 10⁹ cells/mL, using PBS as diluent. AAPH (2,2-Azobis (2-amidinopropane dihydrochloride) was used to generate peroxyl radicals and induce red blood cell oxidation. A 100 µL suspension of erythrocytes was mixed with 100 µL of the samples previously dissolved in PBS and 100 µL of AAPH (300 mmol∙L−1). The mixture was incubated at 37 °C for 1.5 h with constant shaking. Finally, the mixture was diluted with 800 µL of PBS and centrifuged at 3000 rpm for 10 min. The absorbance of the supernatant was recorded at 540 nm. The results were expressed as the percentage inhibition (%)using the following equation:
I n h i b i t i o n   % = A P P H A s A P P H × 100
where APPH is the absorbance of APPH, and As is the absorbance of each sample.

2.9. Analysis of Functional Groups by FTIR

The FITR analysis coupled with the ATR (attenuated total reflectance) accessory with zinc selenide (ZnSe) crystal was performed using an Agilent Cary 630. The samples were analyzed in a spectral range from 4000 to 650 cm−1, with a cycle of 32 scans and a resolution of 2 cm−1 using Agilent licensed software (Santa Clara, Ca, USA) (MicroLab PC v5.7). Graph construction was performed using OriginPro 8 software.

3. Results and Discussion

3.1. Optimization of the Extraction Process Using the Taguchi L9 Design

Table 2 summarizes the experimental matrix L9 (34) in random order, including the variable response (yield mg∙mL−1) for each sample used in the Taguchi statistical analysis. This analysis enabled the generation of variance analysis and the subsequent calculation of the percentage contribution and effect of each factor and their respective levels. Finally, it facilitated the determination of the optimal conditions to maximize the yields of polyphenolic compounds.

3.1.1. Effect of Temperature

In the case of temperature, it has been reported that it is possible to obtain stable bioactive compounds at high temperatures but in short periods of time. This can be attributed to the barrier properties of the sample as it diffuses through the solvent. This coincides with the findings of the present investigation, where the best performance was obtained at temperatures between 50 and 60 °C in periods between 15 and 30 min. However, for thermosensitive bioactive compounds, increasing temperature has negative effects that can result in the degradation or loss of phenolic compounds, especially flavonoids. It has also been reported that yields begin to fall at temperatures above 100 °C [12]. Given that the metabolites of interest to be obtained are phenolic, it is an important factor to consider not using such high temperatures. On the other hand, increasing the temperature may enhance the interaction between the sample and the solvent. Given that temperature was identified as having a significant impact on the extraction process for both samples evaluated, it can be considered a critical factor [12]. This finding is also supported by the results of the Taguchi statistical analysis of variance (ANOVA), which identified temperature as the most contributive factor (Table 3 and Table 4) for both samples.

3.1.2. Effect of Time

In the case of C. sinensis, time emerged as the second most influential factor in the optimization process, while for V. vinifera, its individual impact was less than 10%. However, when considering its interaction with solvent concentration, it exerted an effect of more than 40%, therefore becoming the second most crucial factor in the extraction process for both samples. In this sense, using the correct ratio of temperature and solvent concentration for a given time allows the solubilization of polyphenolic compounds. This process occurs through interactions with the weakened plant cell wall, enhancing the transfer of phenolic compounds into the extraction medium. It has previously been reported that for orange residue extracts, the extraction times can extend up to 120 min [13]. This agrees with the findings reported by Tien-Le et al. [14], who indicate that extraction time can be extended between 60 and 150 min. However, they reported that the content of phenolic compounds did not have a significant change during that time frame, cautioning against extending extraction time beyond 60 min. While a longer extraction time may be favorable for orange byproducts, where the yield of bioactive compounds increases with time, it is essential to consider the goal of optimization, which is cost and time reduction. Therefore, using extended extraction times would contradict this objective.

3.1.3. Effect of Solvent Concentration

Regarding solvent concentration, its influence on the extraction process for both samples was less than 5%. However, its interaction with other factors, such as time for V. vinifera and temperature for C. sinensis, increased its contribution to the process by 20 to 42.43%, respectively. Consequently, this factor ranks third in importance within the optimization process. Successful extraction of phenolic compounds is closely related to the polarity of the solvent, which increases as follows: methanol > ethanol > ethyl acetate > acetone > n-butanol > water. However, the potential toxicity associated with some of these solvents (methanol, ethyl acetate, acetone) must be considered [15]. Consequently, environmentally friendly solvents, such as water, ethanol, and their mixtures, are preferred for the extraction process. It has been observed that the use of pure water or water–ethanol mixtures, specifically within the range of 20% and 60% ethanol concentration, increases the extraction yields of bioactive compounds obtained. The combination of water and ethanol creates a polar environment that facilitates access to plant cells, therefore increasing the extraction of phenolic compounds. It is important to note that high concentrations of ethanol are discouraged due to the risk of protein denaturation, which can impede the dissolution and diffusion of polyphenols, adversely influencing the extraction process [16]. Although the present study did not evaluate pure solvents individually, it was observed that the greatest yields were obtained with ethanol-water mixtures at concentrations ranging from 30% to 50%. This confirmed that the use of binary solvents allows obtaining higher yields of bioactive compounds.

3.1.4. Effect of Particle Size

Subtle changes in particle size have been reported to significantly influence the extraction of polyphenolic compounds. Usually, smaller particle size implies heightened diffusivity, facilitating more efficient mass and energy transfer. Moreover, the breakdown of the cell becomes easier with smaller particle sizes. Previous studies have indicated that smaller particle sizes lead to higher concentrations of polyphenolic compounds and tannins [15]. However, excessively small particle sizes (<0.15 mm) can result in low yields due to the tendency of fine particles to form agglomerates. Even with agitation, these agglomerates can form precipitates and reduce diffusion transport between the sample and solvent [17]. In our study, particle sizes of 0.25 mm for C. sinensis and 0.30 mm for V. vinifera were the ideal parameters for maximizing phenolic compound yields, consistent with the findings reported in the literature. Despite the literature suggesting that particle size is among the most influential factors, in the current study, it emerged as the least influential factor in the process. Therefore, for future research, it may be beneficial to modify the particle size used, and with a view to future industrial scale-up, a larger particle size could be more efficient. This is because it has been shown that the dimension of the particles tends to decrease during UAE processing due to the cavitation process to which the sample is subjected. This allows for increased yields without the need for additional investment in time and costs [18].
Table 2 and Table 3 show the percentage contribution of each factor to the extraction process. For V. vinifera, the individual contribution of the factors was as follows: temperature (34.46%) > particle size (7.97%) > extraction time (6.12%) > solvent concentration (1.17%). Furthermore, in the case of concentration and time, although its individual contribution was less than 10%, the interaction of these factors showed a contribution of 44.43%. Therefore, it is not recommended to eliminate factors from the model. For C. sinensis, the individual contribution of the factors was as follows: temperature (52.75%) > time (19.07%) > concentration (4.21%) > particle size (1.66%). In addition, in the case of concentration, this factor has a low contribution individually, but in interaction with temperature, it has a contribution of 20.74%. Therefore, it is not recommended to eliminate this factor from the model.
As mentioned above, during the optimization process, it was observed that particle size had the least impact on both samples. Therefore, a possible future research avenue for scaling up and industrial application could be to increase the particle size. In large quantities, small particle size can remain on the surface of the extractor, and the difficulty of filtration would reduce the yield of the obtained compounds [19]. Alternatively, one could replace this factor with others since the solid–solvent ratio is one of the most viable options. It has been reported that a high solid–solvent ratio can increase yields. This is because the concentration gradient is increased, which in turn increases the diffusion rate, allowing for greater extraction of solids by the solvent [20]. This adjustment aims to enhance the yields of polyphenolic compounds obtained. The residual sum of squares (SS) residual/error was 7.84% for V. vinifera and 1.56% for C. sinensis, respectively. The error within a Taguchi analysis is not only interpreted as the error of the experiment itself but also encompasses the influence of two types of factors: those not included or contemplated in the experiment and uncontrollable factors, so that obtaining high error values is not an indication of poor quality. In this sense, it is necessary to consider that the process of elimination of the solvent, as well as the process of purification, could affect the value of error obtained [21,22].
Figure 1A shows the effects of the factor levels on the extraction of polyphenolic compounds from grape pomace (V. vinifera). For particle size, level 1 (0.42 mm) and level 3 (0.25 mm) were above the mean. Since the yield difference between the two particle sizes was only one unit and particle size had the least impact on the process, the 0.42 mm size could be used to save time in the crushing and sieving process. The temperature at level 2 (50 °C) also showed a significant effect compared to levels 1 and 3. As it represents the factor with the greatest contribution to the extraction process, it is not advisable to modify this factor. For solvent concentration, the best performance was observed at level 1 (water–ethanol 30%). Given that the best results were obtained at this concentration and the cost of using reagents (ethanol) is reduced, the objectives of the Taguchi design would be fulfilled. For a time, an increase in yields was observed as experimental levels increased, suggesting that a longer extraction time could further increase yields, which could be implemented in future research at the laboratory level. However, at an industrial level, to achieve a reduction in processing times, it may be necessary to modify other factors such as the power of the ultrasound, reducing the moisture of the sample for greater solid–solvent interaction, and optimizing the temperature [18]. Additionally, a possible reduction in time will depend on the specific conditions of the sample, its nature, the structure of the cell wall, the resistance to mass transfer, the diffusion of the solvent into the interior of the material, and the penetration rate of the solvent into the plant material [23]. Figure 1B presents the factor performances at different levels for the extraction of polyphenols from orange pomace (C. sinensis). Significant differences above the mean were observed for particle size, solvent concentration (water–ethanol), and extraction time observed at level 2 (particle size of 0.30 mm, water–ethanol concentration of 50%, and extraction time of 15 min, respectively) compared to levels 1 and 3. For temperature, it is observed that level 1 (40 °C) and level 3 (60 °C) were above the mean. However, the latter allows for yields of up to six more units. Since temperature is the factor that has the greatest influence on the process, it is not recommended to reduce it. However, with the aim of achieving optimization not only to achieve higher yields but also to fully optimize the process and reduce energy investment, it is suggested in future endeavors to lower the temperature in conjunction with other factors (multivariate optimization) such as the applied ultrasonic power and solvent quantity to achieve the optimal temperature value. This approach would enable maximizing process efficiency to its fullest potential [24].
After the statistical analysis using the Taguchi method and the experimental matrix L9 (34), the conditions for maximizing the yields of bioactive compounds were determined (Table 5). The similarity between the theoretical and real yields is very close, indicating that the optimization of the extraction process was successful and allowed the increase of the yields of phenolic compounds. Additionally, the standard deviation values indicate that the process is reproducible for both samples.
While the results demonstrate that the optimization process using the Taguchi L9 design combined with unconventional extraction techniques (UAE) allows for increased yields of bioactive compounds, scaling up to an industrial or pilot plant level is not always straightforward. This is because certain mass transfer phenomena inevitably change. However, it is possible to reliably predict behavior by preserving some intensive extraction parameters, such as temperature, and increasing extensive parameters like solvent flow rate and solid feed [23]. It is also important to consider that scaling up to an industrial level represents a higher initial economic investment compared to traditional methods (agitation). However, it significantly reduces the solvent-to-feed mass ratio, resulting in lower costs. Given that solvents are one of the most significant inputs in this process, potential scaling can compete with other conventional methods [25].
Although scaling up the extraction optimization process to a pilot plant level may present technical challenges, the results obtained lay the foundation for future research using the principle of ultrasound systems, specifically cavitation. In this context, hydrothermal cavitation is one of the most promising green technologies for extracting high-value bioactive compounds from waste, enabling the recovery of pectin and volatile compounds [26].

3.2. Determination of Total Flavonoids

The determination of total flavonoids did not show a significant difference (p < 0.05) between the analyzed samples. It can, therefore, be deduced that the flavonoid content is similar in both samples. Polyphenolic compounds from V. vinifera byproducts showed the highest presence of flavonoids, with a concentration of 77.23 QE µg∙mL−1, whereas orange waste showed the lowest at 54.50 QE µg∙mL−1 (Table 6). Grape pomace extracts have been reported to contain flavonoids in concentrations from 127.2 to 146.8 (EQ µ∙gmL−1) in methanolic extracts (soxhlet method and maceration method, respectively) [27]. It has been reported that both species possess a diversity of flavonoids. In the case of V. vifiniera flavonoids, this byproduct includes anthocyanins, quercetin, D-catechin, and epicatechin [28]. On the other hand, flavonoid content in orange residues has been reported to be in concentrations of 10.20, 15.70, and 22.20 QE mg∙g−1 using ethanol, methanol, and water as extracting agents, respectively [29]. Moreover, the diversity of flavonoid content in orange byproducts, including flavanones, flavanone glycosides, and polyethoxylated flavones, are the most abundant in the skin, characterized by high antioxidant capacity [30,31]. In this regard, flavonoids present in orange residues have been shown to induce apoptosis in cancer cells, suggesting their potential application in anticancer therapy [1]. Usually, pomace resulting from fruit processing in the food industry is rich in phenolic compounds, especially flavonoids, organic acids, and tertiary acids. Flavonoids, due to their antioxidant properties, find applications in healthcare as eco-friendly reducing agents, as well as for the inhibition of metal corrosion and in the formulation of nutraceuticals and dietary supplements [32].

3.3. Antioxidant Activity Profile

Since bioactive compounds can exhibit different mechanisms of action, including single electron transfer, hydrogen atom transfer, and metal chelating ability, it is important to assess the antioxidant capacity using different methods [33]. In this context, in the present study, the antioxidant activity of the polyphenolic compounds obtained was evaluated using three different assays, as described below.

3.3.1. Inhibition of ABTS∙+ Radicals and IC50 Determination

A significant difference (p < 0.05) was observed in the determination of IC50 of ABTS∙+ radical inhibition, with the samples from V. vinifera byproducts exhibiting a lower IC50 value of 53.69 TE µg∙mL−1. It has been reported that grape pomaces (red and white) possess the ability to inhibit free radicals, with IC50 values fluctuating from 16.32 to 56.22 µg∙mL−1 for red grape pomace depending on the solvent used for the extraction and from 37.31 to 78.47 µg∙mL−1 for the case of white grape pomace [34]. Citrus pomace extracts are known for their high antioxidant potential. In this sense, it has been observed that various species of the genus Citrus have the capacity to inhibit free radicals with IC50 values ranging from 100.8 to 417.2 µg∙mL−1. These free radical-inhibiting properties in citrus are mainly attributed to flavanones, which also possess anti-inflammatory, antimutagenic, vasorelaxant, and vasoprotective activities [35]. Thus, it was observed that red grape pomace had a greater capacity to inhibit free radicals compared to citrus residues, which agrees with the findings of the present investigation. The capacity of bioactive compounds to inhibit free radicals is crucial, as reactive oxygen species can damage macromolecules, leading to the deterioration of proteins, lipids, and DNA. This damage is associated with cellular aging and diseases caused by oxidative stress. Furthermore, the presence of free radicals in food could compromise its quality and reduce its shelf life [36,37].

3.3.2. Ferric-Reducing Power (FRAP)

The evaluation of the reducing power showed a significant difference (p < 0.05), with C. sinensis byproducts exhibiting the highest reducing potential at 18.23 GAE µg∙mL−1. The reducing power of phytochemical compounds depends on their ability to transfer electrons, so it is an essential assay of their antioxidant activity [34]. Notably, phenolic compounds from orange byproducts showed a greater reducing capacity despite their lower flavonoid content is lower and higher IC50 values for ABTS∙+ radical inhibition compared to those obtained from grape pomace residues. This enhancement may be attributed to other types of phenolic compounds that are not flavonoids. Furthermore, the efficacy of these compound-reducing reactions is closely related to the availability and number of OH groups that can participate in the electron transfer [38]. This quality is influenced by the structural characteristics of the molecules in the samples. Citrus byproducts, especially for those orange (C. sinensis) and sweet lemon (Citrus medica var. Limetta), have been reported to exhibit similar reducing power [39]. Moreover, extracts of the variety C. sinensis Osbeck cv. Newhall (navel orange) has shown reducing potentials ranging from 5.23 to 81.16 Vitamin C equivalents per gram) [40]. Conversely, red and white grape pomace has demonstrated a higher reducing capacity than other pomaces (lemon and pineapple). Furthermore, this indicates that despite the processing of the fruit for juice extraction within the industry, the resulting residues are an important source of bioactive compounds with a reducing potential [34,39]. Polyphenolic compounds contribute to reducing oxidative stress by donating a hydrogen atom or an electron, neutralizing reactive oxygen species (ROS), and reducing transition metals responsible for the Fenton reaction [41].

3.3.3. Inhibition of Hydroxyl Radicals (OH)

The inhibition of hydroxyl radicals did not show a significant difference (p < 0.05), indicating that both samples possess radical inhibition activity. This is consistent with the findings reported by Zhu et al. [42], who indicated that the ability to inhibit the hydroxyl radical might be attributed to different types of phenolic compounds rather than the quantity so that this inhibition potential could be related to the iron chelation ability of specific phenolic compounds and the number and position of carboxyl and carbonyl groups. Members of the Citrus genus have been reported to inhibit hydroxyl radicals; for instance, extracts of C. sinensis inhibited the radicals by more than 70% at 200 ppm (extracts obtained using different solvents) [43]. Likewise, extracts of Citrus macroptera residues had an inhibition higher than 50% at the same concentration [44]. Such activity was attributed to the presence of phenols, flavonoids, and alkaloids. In contrast, grape pomace hydro-alcoholic extracts showed lower inhibit rates (3.8%) at 2.5 mg∙mL, which is over ten-fold higher than that used in the present study [42]. Moreover, Chidambara Murthy et al. [45] reported 73.60% radical inhibition in methanolic extracts at 200 ppm, significantly higher than those observed in this research but at a concentration four-fold higher than what we used. These discrepancies could be due to variations in byproduct characteristics, which are influenced by environmental factors, fruit ripening stages, or genetic factors [29]. During normal metabolic processes, cells produce reactive oxygen species (ROS) such as hydroxyl radicals (OH), superoxide radicals (O2), and hydrogen peroxide (H2O2). At low levels, these ROS are indispensable for cell development, growth, signaling processes, and activation. However, excessive ROS can trigger oxidative stress, leading to cell death, tissue damage, and the onset of degenerative diseases [46]. Therefore, leveraging bioactive compounds from byproduct sources may be essential to detoxify free radicals and prevent tissue damage by decreasing oxidative stress.

3.4. In Vitro and Ex Vivo Analysis

3.4.1. Inhibition of α-Amylase

The inhibition of α-amylase (Table 7) did not show a significant difference (p < 0.05) between samples. Therefore, it is concluded that polyphenolic compounds from both V. vinifera (26.69%) and C. sinensis (23.47%) present similar activity on the enzyme. This biological effect on the enzyme is associated with certain types of phenolic compounds, such as catechins, whose activity is mainly determined by the number of galloyl groups and the degree of polymerization, both of which have a high affinity for the α-amylase enzyme. In general, it has been suggested that tannins have better activity on α-amylase, while other smaller phenolic compounds have better potential to inhibit α-glucosidase [47]. In this context, it has been reported that orange residues in dry matter possess up to 8 mg∙g−1 of tannin content [48], while grape pomace contains between 2.45 mg∙g−1 and 5.79 mg∙g−1 in white and red grape pomace samples, respectively [34]. Regarding grape pomace extracts, an inhibition of up to 56% at 1000 ppm of hydro-alcoholic extracts with activity similar to acarbose has been reported [49]; however, this concentration is almost 20-fold higher than the one presented in this research. Although all grape species destined for wine production share the same genotype, there are differences in the production of bioactive compounds due to variety and climatic changes. It has been reported that variations in temperature and water availability affect the production of bioactive compounds in grape pomace [50]. Therefore, these factors may influence the content of bioactive compounds in grape pomace. Concerning orange residue extracts (C. sinensis) reported an inhibition higher than 70% at 500 ppm in fresh fermented pomace [51]. This inhibition is three-fold higher than that found in this research. However, these differences may be influenced by the fermentation process, which results in the biotransformation of the present metabolites. Given that acarbose, although it exerts a postprandial antihyperglycemic effect, also presents a variety of side effects such as diarrhea and stomach inflammation, abdominal pain, and low nutrient absorption [49], the implementation of these bioactive compounds in the formulation of nutraceutical agents could help to improve the living conditions of people with diabetes without the side effects of synthetic drugs.

3.4.2. Inhibition of Hemolysis

The use of physiological models to assess antioxidant properties is relevant for many pharmacological applications. In this regard, the evaluation of the oxidative process in erythrocyte membranes represents a valuable model for studying antioxidant and prooxidant compounds [27]. This assay is one of the pivotal criteria for the prospective implementation of bioactive compounds in living organisms [52].
The inhibition of hemolysis (Table 7) show a significant difference (p < 0.05). Similar to the α-amylase inhibition assay, the comparable potential to inhibit hemolysis in both samples could be due to similar conditions linked to the presence of tannins. It has been reported that catechins and their oligomers can decrease the susceptibility of human erythrocytes to oxidative hemolysis induced by AAPH. Moreover, proanthocyanidins (proanthocyanidin-1 and proanthocyanidin-2) from grape seeds have also been shown to reduce changes in erythrocytes due to oxidative stress and protect against oxidation by ultraviolet B rays [53]. Previously, García-Becerra et al. [27] reported hemolysis inhibition of up to 95% 100 µg∙mL−1 with methanolic extracts of grape pomace. Furthermore, they also reported that these extracts did not induce hemolysis, suggesting their potential as a safe option to prevent this oxidative process without harming red blood cells. Azantsa et al. [54] reported inhibition of 87.6% with aqueous extracts of whole orange fruit, indicating that a portion of this inhibition could come from the inedible part of the fruit (peel, seeds, bagasse), which constitute a major part of the fruit. In this context, this evidence suggests that bioactive compounds associated with the protection of red blood cells can be found in orange and grape byproducts, potentially offering dietary benefits in mitigating the effects of oxidative stress on red blood cells.
Although some reports indicate that tannins are the main compounds influencing both α-amylase inhibition and hemolysis inhibition, we cannot dismiss the possibility that other phenolic compounds also affect these processes. For instance, phenolic compounds have been reported to present synergistic effects, thus enhancing their antioxidant potential and biological activity [55]. Further analysis is needed to identify the phenolic compounds present in the samples and thus associate the biological effects reported in this study with the identified metabolites.

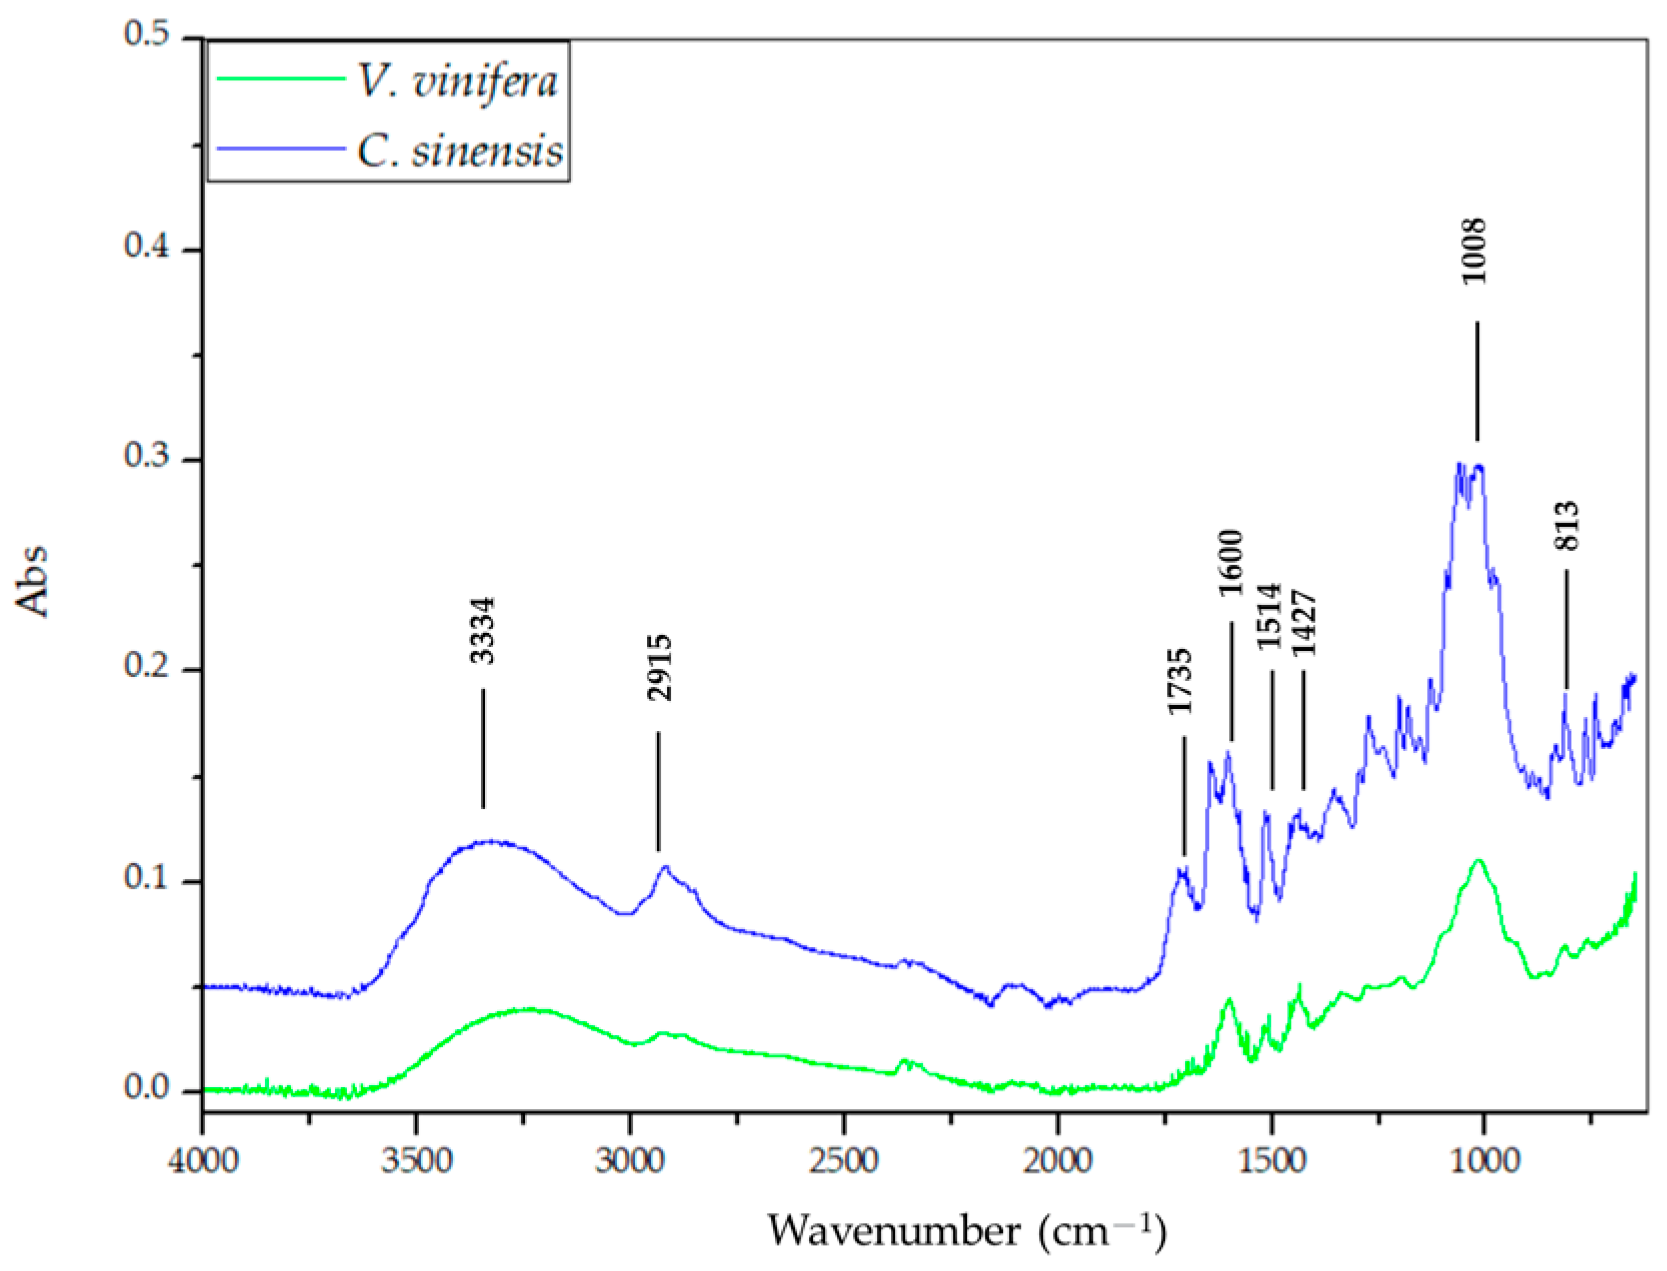
3.5. Analysis of Functional Groups by FTIR

In Figure 2, the signal at 3334 cm−1 indicates the presence of hydroxyl groups (O–H), while the presence of C–H bonds, corresponding to CH2 groups, can be observed at 2915 cm−1. On the other hand, the signal at 1735 cm−1 is due to the stretching of C=O bonds. The signal at 1600 cm−1 is associated with the presence of C=C bonds in aromatic rings. Moreover, the signals at 1514 and 1427 cm−1 indicate the presence of single C–C bonds of aromatic rings of phenolic compounds. Furthermore, the signal near 1008–1006 cm−1 is attributed to the stretching of C-O bonds in aromatic alcohols. Previous studies have identified signals of O–H, C–H, C=C, and C–C as characteristics of phenolic compounds, as reported in phenolic profiles of different grape seeds [56]. Similarly, Rajhard et al. [57] indicated that signals (O–H, C–H) in the region between 3500 and 2800 cm−1 and signals (C–C, C=O) in the region between 1750 and 100 cm−1 are characteristic of different flavonoids abundant in nature. This is also consistent with the findings reported by Hussain et al. [38], who observed similar signals in residues from orange peel, banana, and date stone, suggesting that polyphenolic compounds obtained from plant residues share infrared signals. However, to precisely identify these molecules, further analysis, such as ultra-performance liquid chromatography, is necessary.

4. Conclusions

The application of the Taguchi L9 statistical model allowed the optimization of conditions to increase the yields of bioactive compounds obtained from wine and juice industry byproducts. Grape and orange residues contain flavonoid-type compounds that not only exhibited antioxidant activity but also showed potential to inhibit α-amylase enzyme, involved in starch assimilation. Moreover, these compounds offer protection against oxidative stress in red cells to peroxyl radicals. FITR analysis facilitated the identification of characteristic functional groups associated with phenolic compounds. However, it is essential to determine the chemical profile of compounds present in both samples, as well as conduct a thorough evaluation of their toxicity to ensure their safety and innocuousness. Thus, these value-added byproducts are good sources of bioactive compounds with promising applications in the food and pharmaceutical industries, supporting the principles of the circular economy model.

Author Contributions

Conceptualization, N.E.A.-L. and G.C.G.M.-Á.; Data curation, N.E.A.-L. and I.A.-Q.; Formal analysis, N.E.A.-L. and P.A.-Z.; Funding acquisition, G.C.G.M.-Á.; Investigation, I.A.-Q., G.C.G.M.-Á., C.L.R.-J. and R.R.; Methodology, N.E.A.-L., I.A.-Q. and G.C.G.M.-Á.; Project administration, N.E.A.-L. and G.C.G.M.-Á.; Resources, G.C.G.M.-Á. and R.R.; Validation, N.E.A.-L. and I.A.-Q.; Supervision, G.C.G.M.-Á., P.A.-Z. and R.R.; Writing—original draft preparation, N.E.A.-L., G.C.G.M.-Á. and C.L.R.-J.; writing—review and editing, N.E.A.-L., G.C.G.M.-Á., C.L.R.-J., P.A.-Z. and R.R. All authors have read and agreed to the published version of the manuscript.

Funding

This work was funded by the Program for Support of Science, Technology, and Innovation UANL-ProACTI 2023 (funding number: 13-BQ-2023) and partially funded by the Tecnológico Nacional de México through the project Evaluation of extracts from the citrus waxy residue as a natural insecticide against Tribolium molitor, a model organism (funding number: IT17A895).

Informed Consent Statement

Informed consent was obtained from all subjects involved in the study.

Data Availability Statement

The data presented in this study are available on request from the corresponding author. The data are not publicly available due to the student thesis being in the finishing process.

Acknowledgments

Aranda-Ledesma thanks the National Council of Humanities, Science and Technology (CONAHCyT) of Mexico for his postgraduate scholarship.

Conflicts of Interest

The authors declare no conflicts of interest.

References

  1. Shirisha, G.; Mandava, K.; Batchu, U.R.; Thammana, K.R.; Turpu, V. Antitumor and antioxidant effects of flavonoid fraction of Citrus sinensis peel extract. Pharmacogn. J. 2019, 11, 57–63. [Google Scholar] [CrossRef]
  2. Chedea, V.S.; Macovei, Ș.O.; Bocsan, I.C.; Măgureanu, D.C.; Levai, A.M.; Buzoianu, A.D.; Pop, R.M. Grape pomace polyphenols as a source of compounds for management of oxidative stress and inflammation—A possible alternative for non-steroidal anti-inflammatory drugs? Molecules 2022, 27, 6826. [Google Scholar] [CrossRef] [PubMed]
  3. Bolson-Moro, K.I.; Beutinger-Bender, A.B.; de Freitas Ferreira, D.; Speroni, C.S.; Barin, J.S.; da Silva, L.P.; Penna, N.G. Recovery of phenolic compounds from grape pomace (Vitis vinifera L.) by microwave hydrodiffusion and gravity. LWT 2021, 150, 112066. [Google Scholar] [CrossRef]
  4. Mollica, A.; Scioli, G.; Della-Valle, A.; Cichelli, A.; Novellino, E.; Bauer, M.; Stefanucci, A. Phenolic analysis and in vitro biological activity of red wine, pomace and grape seeds oil derived from Vitis vinifera L. cv. Montepulciano d’Abruzzo. Antioxidants 2021, 10, 1704. [Google Scholar] [CrossRef] [PubMed]
  5. Martínez, V.; Michaelson, D.J.; Cortez, M.V.; Leite, J.L.; da Silva, G.S. A high-yield process for extraction of hesperidin from orange (Citrus sinensis L. osbeck) peels waste, and its transformation to diosmetin, A valuable and bioactive flavonoid. Wast Biomass Valorization 2021, 12, 313–320. [Google Scholar] [CrossRef]
  6. Montero-Calderon, A.; Cortes, C.; Zulueta, A.; Frigola, A.; Esteve, M.J. Green solvents and Ultrasound-Assisted Extraction of bioactive orange (Citrus sinensis) peel compounds. Sci. Rep. 2019, 9, 16120. [Google Scholar] [CrossRef] [PubMed]
  7. Pagano, I.; Campone, L.; Celano, R.; Piccinelli, A.L.; Rastrelli, L. Green non-conventional techniques for the extraction of polyphenols from agricultural food by-products: A review. J. Chromatogr. A 2021, 1651, 462295. [Google Scholar] [CrossRef] [PubMed]
  8. Navidad-Murrieta, M.S.; Pérez-Larios, A.; Sanchéz-Burgos, J.A.; Ragazzo-Sánchez, J.A.; Luna-Bárcenas, G.; Sáyago-Ayerdi, S.G. Use of a taguchi design in Hibiscus sabdariffa extracts encapsulated by spray-drying. Foods 2020, 9, 128. [Google Scholar] [CrossRef]
  9. Aranda-Ledesma, N.E.; González-Hernández, M.D.; Rojas, R.; Paz-González, A.D.; Rivera, G.; Luna-Sosa, B.; Martínez-Ávila, G.C.G. Oil and polyphenolic compounds of Flourensia cernua leaves: Chemical profiling and functional properties. Agronomy 2022, 12, 2274. [Google Scholar] [CrossRef]
  10. Ge, X.; Jing, L.; Zhao, K.; Su, C.; Zhang, B.; Zhang, Q.; Li, W. The phenolic compounds profile, quantitative analysis and antioxidant activity of four naked barley grains with different color. Food Chem. 2021, 335, 127655. [Google Scholar] [CrossRef]
  11. Monroy-García, I.N.; Carranza-Torres, I.E.; Carranza-Rosales, P.; Oyón-Ardoiz, M.; García-Estévez, I.; Ayala-Zavala, J.F.; Viveros-Valdez, E. Phenolic profiles and biological activities of extracts from edible wild fruits Ehretia tinifolia and Sideroxylon lanuginosum. Foods 2021, 10, 2710. [Google Scholar] [CrossRef] [PubMed]
  12. Antony, A.; Farid, M. Effect of temperatures on polyphenols during extraction. Appl. Sci. 2022, 12, 2107. [Google Scholar] [CrossRef]
  13. Iglesias-Carres, L.; Mas-Capdevila, A.; Bravo, F.I.; Aragonès, G.; Muguerza, B.; Arola-Arnal, A. Optimization of a polyphenol extraction method for sweet orange pulp (Citrus sinensis L.) to identify phenolic compounds consumed from sweet oranges. PLoS ONE 2019, 14, e0211267. [Google Scholar] [CrossRef] [PubMed]
  14. Tien-Le, X.; Vi-Luu, V.L.; Quac-Toan, T.; Bach, L.G.; Truc, T.T.; Hai-Ha, P.T. Extraction process of polyphenols from soybean (Glycine max L.) sprouts: Optimization and evaluation of antioxidant activity. Processes 2019, 7, 489. [Google Scholar] [CrossRef]
  15. Sridhar, A.; Ponnuchamy, M.; Senthil-Kumar, P.; Kapoor, A.; Vo, D.V.N.; Prabhakar, S. Techniques and modeling of polyphenol extraction from food: A review. Environ. Chem. Lett. 2021, 19, 3409–3443. [Google Scholar] [CrossRef]
  16. Alonso-Riaño, P.; Sanz-Diez, M.T.; Blanco, B.; Beltrán, S.; Trigueros, E.; Benito-Román, O. Water ultrasound-assisted extraction of polyphenol compounds from brewer’s spent grain: Kinetic study, extract characterization, and concentration. Antioxidants 2020, 9, 265. [Google Scholar] [CrossRef] [PubMed]
  17. Maciel-Bindes, M.M.; Luiz-Cardoso, V.; Miranda-Reis, M.H.; Boffito, D.C. Maximization of the polyphenols extraction yield from green tea leaves and sequential clarification. J. Food Eng. 2019, 241, 97–104. [Google Scholar] [CrossRef]
  18. Chemat, F.; Rombaut, N.; Sicaire, A.G.; Meullemiestre, A.; Fabiano-Tixier, A.S.; Abert-Vian, M. Ultrasound assisted extraction of food and natural products. Mechanisms, techniques, combinations, protocols and applications. A review. Ultrason. Sonochemistry 2017, 34, 540–560. [Google Scholar] [CrossRef] [PubMed]
  19. Pătrăuanu, O.A.; Lazăr, L.; Popa, V.I.; Volf, I. Influence Of Particle Size And Size Distribution On Kinetic Mechanism Of Spruce Bark Polyphenols Extraction. Development 2019, 8, 11. [Google Scholar] [CrossRef]
  20. Norshazila, S.; Koy, C.N.; Rashidi, O.; Ho, L.H.; Azrina, I.; Zaizuliana, N.R.; Zarinah, Z. The effect of time, temperature and solid to solvent ratio on pumpkin carotenoids extracted using food grade solvents. Sains Malays. 2017, 46, 231–237. [Google Scholar] [CrossRef]
  21. Ávila-Hernández, J.G.; Aguilar-Zárate, P.; Carrillo-Inungaray, M.; Michel, M.R.; Wong-Paz, J.E.; Muñiz-Márquez, D.B.; Martínez-Ávila, G.C.G. The secondary metabolites from Beauveria bassiana PQ2 inhibit the growth and spore germination of Gibberella moniliformis LIA. Braz. J. Microbiol. 2022, 53, 143–152. [Google Scholar] [CrossRef]
  22. Roy, R.K. Design of Experiments Using the Taguchi Approach: 16 Steps to Product and Process Improvement; John Wiley & Sons: Hoboken, NJ, USA, 2011. [Google Scholar]
  23. Prado, J.M.; Veggi, P.C.; Meireles, M.A.A. Scale-Up Issues and Cost of Manufacturing Bioactive Compounds by Supercritical Fluid Extraction and Ultrasound Assisted Extraction. In Global Food Security and Wellness; Barbosa-Cánovas, G.V., Guevara, M.L., Cano, P., Palou, E., Eds.; Springer: Cham, Switzerland, 2017; Volume 8, pp. 377–433. [Google Scholar] [CrossRef]
  24. Esclapez, M.D.; García-Pérez, J.V.; Mulet, A.; Cárcel, J.A. Ultrasound-assisted extraction of natural products. Food Eng. Rev. 2011, 3, 108–120. [Google Scholar] [CrossRef]
  25. Medina-Torres, N.; Ayora-Talavera, T.; Espinosa-Andrews, H.; Sánchez-Contreras, A.; Pacheco, N. Ultrasound assisted extraction for the recovery of phenolic compounds from vegetable sources. Agronomy 2017, 7, 47. [Google Scholar] [CrossRef]
  26. Scurria, A.; Sciortino, M.; Garcia, A.R.; Pagliaro, M.; Avellone, G.; Fidalgo, A.; Ilharco, L.M. Red Orange and Bitter Orange IntegroPectin: Structure and Main Functional Compounds. Molecules 2022, 27, 3243. [Google Scholar] [CrossRef] [PubMed]
  27. García-Becerra, L.; Mitjans, M.; Rivas-Morales, C.; Verde-Star, J.; Oranday-Cárdenas, A.; María, P.V. Antioxidant comparative effects of two grape pomace Mexican extracts from vineyards on erythrocytes. Food Chem. 2016, 194, 1081–1088. [Google Scholar] [CrossRef]
  28. Ageyeva, N.M.; Tikhonova, A.N.; Biryukova, S.A.; Biryukova, S.A.; Globa, E.V. Grape pomace treatment methods and their effects on storage. Foods Raw Mater. 2021, 9, 215–223. Available online: https://jfrm.ru/en/issues/1879/1885/ (accessed on 19 June 2024). [CrossRef]
  29. El-Beltagi, H.S.; Eshak, N.S.; Mohamed, H.I.; Bendary, E.S.; Danial, A.W. Physical characteristics, mineral content, and antioxidant and antibacterial activities of Punica granatum or Citrus sinensis Peel extracts and their applications to improve cake quality. Plants 2022, 11, 1740. [Google Scholar] [CrossRef]
  30. Singh, B.; Pal-Singh, J.; Kaur, A.; Singh, N. Phenolic composition, antioxidant potential and health benefits of citrus peel. Int. Food Res. 2020, 132, 109114. [Google Scholar] [CrossRef] [PubMed]
  31. Long, X.; Zeng, X.; Yan, H.; Xu, M.; Zeng, Q.; Xu, C.; Zhang, J. Composition and antioxidant potential assessment of extracts from Gannanzao Navel Orange (Citrus sinensis Osbeck Cv. Gannanzao) peel. Nat. Prod. Res. 2021, 35, 702–706. [Google Scholar] [CrossRef]
  32. Vasyliev, G.S.; Vorobyova, V.I.; Linyucheva, O.V. Evaluation of reducing ability and antioxidant activity of fruit pomace extracts by spectrophotometric and electrochemical methods. J. Anal. Chem. 2020, 2020, 8869436. [Google Scholar] [CrossRef]
  33. Kabbas-Junior, T.; de Moura, C.; Mendanha-Cruz, T.; Marques, M.B.; Carmo, M.A.V.D.; Deolindo, C.T.P.; Granato, D. Optimization of the Green Chemistry-like Extraction of Phenolic Compounds from Grape (Vitis labrusca L.) and Blackberry (Rubus fruticosus L.) Seeds with Concomitant Biological and Antioxidant Activity Assessments. Plants 2023, 12, 2618. [Google Scholar] [CrossRef] [PubMed]
  34. Gaafar, A.A.; Asker, M.S.; Ali, M.A.; Salama, Z.A. The effectiveness of the functional components of grape (Vitis vinifera) pomace as antioxidant, antimicrobial, and antiviral agents. Jordan J. Biol. Sci. 2019, 12, 625–635. [Google Scholar]
  35. Luque-Alcaraz, A.G.; Velazquez-Antillón, M.; Hernández-Téllez, C.N.; Graciano-Verdugo, A.Z.; García-Flores, N.; Iriqui-Razcón, J.L.; Hernández-Abril, P.A. Antioxidant Effect of Nanoparticles Composed of Zein and Orange (Citrus sinensis) Extract Obtained by Ultrasound-Assisted Extraction. Materials 2022, 15, 4838. [Google Scholar] [CrossRef] [PubMed]
  36. Xiao, F.; Xu, T.; Lu, B.; Liu, R. Guidelines for antioxidant assays for food components. Food Front. 2020, 1, 60–69. [Google Scholar] [CrossRef]
  37. Wen, C.; Zhang, J.; Feng, Y.; Duan, Y.; Ma, H.; Zhang, H. Purification and identification of novel antioxidant peptides from watermelon seed protein hydrolysates and their cytoprotective effects on H2O2-induced oxidative stress. Food Chem. 2020, 327, 127059. [Google Scholar] [CrossRef]
  38. Hussain, O.A.; Abdel-Rahim, E.A.; Badr, A.N.; Hathout, A.S.; Rashed, M.M.; Fouzy, A.S. Total phenolics, flavonoids, and antioxidant activity of agricultural wastes, and their ability to remove some pesticide residues. Toxicol. Rep. 2022, 9, 628–635. [Google Scholar] [CrossRef]
  39. Bellur-Nagarajaiah, S.; Prakash, J. Chemical composition, and bioactivity of pomace from selected fruits. Int. J. Fruit Sci. 2016, 16, 423–443. [Google Scholar] [CrossRef]
  40. Guo, C.; Shan, Y.; Yang, Z.; Zhang, L.; Ling, W.; Liang, Y.; Zhang, J. Chemical composition, antioxidant, antibacterial, and tyrosinase inhibition activity of extracts from Newhall navel orange (Citrus sinensis Osbeck cv. Newhall) peel. J. Sci. Food Agric. 2020, 100, 2664–2674. [Google Scholar] [CrossRef]
  41. Spiegel, M.; Kapusta, K.; Kołodziejczyk, W.; Saloni, J.; Żbikowska, B.; Hill, G.A.; Sroka, Z. Antioxidant activity of selected phenolic acids–ferric reducing antioxidant power assay and QSAR analysis of the structural features. Molecules 2020, 25, 3088. [Google Scholar] [CrossRef]
  42. Zhu, A.; Guo, Y.; Liu, G.; Song, M.; Liang, Y.; Cai, Y.; Yin, Y. Hydroxyl radical formation upon dark oxidation of reduced iron minerals: Effects of iron species and environmental factors. Chin. Chem. Lett. 2019, 30, 2241–2244. [Google Scholar] [CrossRef]
  43. Senthamil Selvi, R.; Anish-Kumar, R.Z.; Bhaskar, A. Phytochemical investigation, and in vitro antioxidant activity of Citrus sinensis peel extract. Pharm. Lett. 2016, 8, 159–165. [Google Scholar]
  44. Lala, M.; Modak, D.; Paul, S.; Sarkar, I.; Dutta, A.; Kumar, A.; Sen, A. Potent bioactive methanolic extract of wild orange (Citrus macroptera Mont.) shows antioxidative, anti-inflammatory, and antimicrobial properties in vitro, in vivo, and in silico studies. Bull. Natl. Res. Cent. 2020, 44, 1–15. [Google Scholar] [CrossRef]
  45. Chidambara-Murthy, K.N.; Singh, R.P.; Jayaprakasha, G.K. Antioxidant activities of grape (Vitis vinifera) pomace extracts. J. Agric. Food Chem. 2002, 50, 5909–5914. [Google Scholar] [CrossRef]
  46. Ould-Yerou, K.; Ibri, K.; Bouhadi, D.; Hariri, A.; Meddah, B.; Touil, A.T. The use of orange (Citrus sinensis) peel as antimicrobial and anti-oxidant agents. J. Fundam. Appl. Sci. 2017, 9, 1351–1357. [Google Scholar] [CrossRef]
  47. Cisneros-Yupanqui, M.; Lante, A.; Mihaylova, D.; Krastanov, A.I.; Rizzi, C. The α-amylase and α-glucosidase inhibition capacity of grape pomace: A review. Food Bioprocess Technol. 2023, 16, 691–703. [Google Scholar] [CrossRef] [PubMed]
  48. Oikeh, E.I.; Oviasogie, F.E.; Omoregie, E.S. Quantitative phytochemical analysis and antimicrobial activities of fresh and dry ethanol extracts of Citrus sinensis (L.) Osbeck (sweet Orange) peels. Clin. Phytosci. 2020, 6, 1–6. [Google Scholar] [CrossRef]
  49. Huamán-Castilla, N.L.; Campos, D.; García-Ríos, D.; Parada, J.; Martínez-Cifuentes, M.; Mariotti-Celis, M.S.; Pérez-Correa, J.R. Chemical properties of Vitis vinifera carménère pomace extracts obtained by hot pressurized liquid extraction, and their inhibitory effect on type 2 diabetes mellitus related enzymes. Antioxidants 2021, 10, 472. [Google Scholar] [CrossRef] [PubMed]
  50. Negro, C.; Aprile, A.; Luvisi, A.; De Bellis, L.; Miceli, A. Antioxidant activity and polyphenols characterization of four monovarietal grape pomaces from Salento (Apulia, Italy). Antioxidants 2021, 10, 1406. [Google Scholar] [CrossRef]
  51. Asabi, O.A.; Oisemuzeimen, J.O.; Abiodun, O.O.; Kubiat, B.E. Antioxidant and In-vitro Antidiabetic Activities of Fermented Peels of Citrus x Sinensis (L.) Osbeck (Rutaceae). Prog. Chem. Biochem. Res. 2021, 4, 414–425. Available online: https://ir.unilag.edu.ng/handle/123456789/11212 (accessed on 28 June 2024).
  52. Woźniak, M.; Mrówczyńska, L.; Kwaśniewska-Sip, P.; Waśkiewicz, A.; Nowak, P.; Ratajczak, I. Effect of the solvent on propolis phenolic profile and its antifungal, antioxidant, and in vitro cytoprotective activity in human erythrocytes under oxidative stress. Molecules 2020, 25, 4266. [Google Scholar] [CrossRef]
  53. Olchowik-Grabarek, E.; Swiecicka, I.; Andreeva-Kovaleskaya, Z.; Solonin, A.; Bonarska-Kujawa, D.; Kleszczyńska, H.; Zamaraeva, M. Role of structural changes induced in biological membranes by hydrolysable tannins from sumac leaves (Rhus typhina L.) in their antihemolytic and antibacterial effects. J. Membr. Biol. 2014, 247, 533–540. [Google Scholar] [CrossRef] [PubMed]
  54. Azantsa, B.G.; Mbong, M.A.A.; Takuissu, G.R.; Matsinkou, R.S.; Djuikoo, I.L.; Youovop, J.F.; Oben, J.E. Anti-hemolytic, anti-lipid peroxidation and antioxidant properties of three plants locally used to treat metabolic disorders: Allium sativum, Persea americana and Citrus sinensis. J. Food Res. 2019, 8, 89–100. [Google Scholar] [CrossRef]
  55. Hajimehdipoor, H.; Shahrestani, R.; Shekarchi, M. Investigating the synergistic antioxidant effects of some flavonoid and phenolic compounds. Res. J. Pharmacogn. 2014, 1, 35–40. Available online: https://www.rjpharmacognosy.ir/article_5776.html (accessed on 20 May 2024).
  56. Nogales-Bueno, J.; Baca-Bocanegra, B.; Rooney, A.; Hernández-Hierro, J.M.; Byrne, H.J.; Heredia, F.J. Study of phenolic extractability in grape seeds by means of ATR-FTIR and Raman spectroscopy. Food Chem. 2017, 232, 602–609. [Google Scholar] [CrossRef] [PubMed]
  57. Rajhard, S.; Hladnik, L.; Vicente, F.A.; Srčič, S.; Grilc, M.; Likozar, B. Solubility of luteolin and other polyphenolic compounds in water, nonpolar, polar aprotic and protic solvents by applying FTIR/HPLC. Processes 2021, 9, 1952. [Google Scholar] [CrossRef]
Figure 1. Performance of individual factors and their respective levels: (A) V. vinifera, (B) C. sinensis. The green lines correspond to the means, and the red dots represent the behavior of the levels within each factor.
Biomass 04 00046 g001
Figure 2. Functional group analysis by FITR.
Biomass 04 00046 g002
Table 1. Factors and levels used in Taguchi L9 design.
FactorsLevels
123
Particle size (mm)0.420.300.25
Temperature (°C)405060
Solvent concentration (ethanol %)305070
Extraction time (min)51530
Table 2. L9 (34) Taguchi design experimental matrix for ultrasound-assisted extraction of phenolic compounds from C. sinensis and V. vinifera.
RunFactorsResponse
(Yield mg∙g−1)
from C. sinensis
Response
(Yield mg∙g−1)
from V. vinifera
ParticleTemperatureConcentrationTime
8321319.49 ± 1.4660.76 ± 1.96
5223116.40 ± 4.5249.65 ± 6.85
6231244.71 ± 3.7545.18 ± 1.42
1111127.10 ± 3.2844.26 ± 10.78
2122228.73 ± 8.8555.59 ± 1.32
9332134.98 ± 7.9345.60 ± 1.08
7313235.50 ± 2.6746.63 ± 10.46
4212336.89 ± 1.4742.81 ± 11.31
3133334.53 ± 8.7150.19 ± 3.05
The analyses were conducted in triplicate.
Table 3. Analysis of variance (ANOVA) from V. vinifera.
FactorsSSdfMSFpPercentage (%)
Particle132.98266.497.110.007.97
Temperature574.302287.1530.720.0034.47
Concentration19.5429.771.040.371.17
Time102.02251.015.450.016.12
Concentration by Time707.284176.8218.910.0042.43
Error130.84149.34 7.84
Total1666.9926 100.00
Table 4. Analysis of variance (ANOVA) from C. sinensis.
FactorsSSdfMSFpPercentage (%)
Particle40.93220.467.450.001.66
Temperature1297.522648.76236.300.0052.75
Concentration103.69251.8418.880.004.21
Time469.332234.6685.470.0019.07
Temperature by Concentration510.274127.5646.460.0020.74
Error38.43142.74 1.56
Total2460.2026 100.00
Table 5. Conditions for maximizing extraction yields of bioactive compounds.
FactorsSample
V. viniferaC. sinensis
Particle (mm)0.250.30
Temperature (°C)5060
Concentration (%)3050
Time (min)3015
Theoretical yield (mg∙g−1)60.7647.81
Actual yield (mg∙g−1)64.03 ± 2.7345.94 ± 4.69
Table 6. Flavonoids total content and antioxidant activity profile.
SampleFlavonoidsABTS∙+ IC50FRAPHydroxyl Radicals (OH)
(QE µg∙mL−1)(TE µg∙mL−1)(GAE µg∙mL−1)Inhibition (%)
V. vinifera77.23 ± 25.3153.69 ± 3.1410.00 ± 1.8338.70 ± 4.67
C. sinensis54.50 ± 5.19455.49 ± 20.21 *18.23 ± 1.98 *46.88 ± 8.02
* Significant difference (T student test, p < 0.05). The analyses were conducted in triplicate.
Table 7. In vitro and ex vivo assays.
SampleIn VitroEx Vivo
α-Amylase
Inhibition (%)
Hemolysis
Inhibition (%)
V. vinifera20.69 ± 1.3873.12 ± 0.79
C. sinensis23.47 ± 2.1776.61 ± 0.79 *
* Significant difference (T student test, p < 0.05). The analyses were conducted in triplicate.
Disclaimer/Publisher’s Note: The statements, opinions and data contained in all publications are solely those of the individual author(s) and contributor(s) and not of MDPI and/or the editor(s). MDPI and/or the editor(s) disclaim responsibility for any injury to people or property resulting from any ideas, methods, instructions or products referred to in the content.

