Article

Assessment of Mathematical Approaches for the Estimation and Comparison of Efficiency in qPCR Assays for a Prokaryotic Model

by
Jose Arturo Molina-Mora
1,*,
Meriyeins Sibaja-Amador
1,
Luis Rivera-Montero
2,
Daniel Chacón-Arguedas
3,
Caterina Guzmán
4 and
Fernando García
1
1
Centro de investigación en Enfermedades Tropicales & Facultad de Microbiología, Universidad de Costa Rica, San José P.O. Box 2060, Costa Rica
2
Instituto de Investigaciones en Salud (INISA), Universidad de Costa Rica, San José P.O. Box 2060, Costa Rica
3
Departmento de Inmunología, Facultad de Medicina, Universidad Complutense de Madrid, 28040 Madrid, Spain
4
Programa de Investigación en Enfermedades Tropicales, Escuela de Medicina Veterinaria, Universidad Nacional, Heredia 40104, Costa Rica
*
Author to whom correspondence should be addressed.
DNA 2024, 4(3), 189-200; https://doi.org/10.3390/dna4030012
Submission received: 8 April 2024 / Revised: 18 June 2024 / Accepted: 19 June 2024 / Published: 21 June 2024

Abstract

:
Quantitative PCR is a molecular technique for DNA quantification that depends on reaction efficiency and the Ct value (“cycle threshold”). However, the results are dependent on laboratory conditions and mathematical approaches. Thus, the data of 16 genes from Pseudomonas aeruginosa strain AG1 were generated using qPCR to assess the effect of DNA concentration and three mathematical methods (a standard curve and two individual-curve-based approaches called exponential and sigmoidal models) on efficiency and DNA quantification. Differences in efficiency were revealed depending on the mathematical method used; the values were 100% in three out of the four standard curves, but estimations of the expected fold change in DNA serial dilutions were not achieved, indicating the possible overestimation of efficiency. Moreover, when efficiency was compared to DNA concentration, a decreasing trend in efficiency as DNA concentration increased in the reaction was observed in most cases, which is probably related to PCR inhibitors. For all 16 genes at a single DNA concentration, the efficiencies for the exponential model were found in the range of 1.5–2.79 (50–79%), and for the sigmoidal approach, the range was 1.52–1.75 (52–75%), with similar impact on normalized expression values, as indicated by the genes for standard curves. Jointly, DNA concentration and mathematical model choice were demonstrated to impact the estimation of reaction efficiency and, subsequently, DNA quantification when using qPCR.

1. Introduction

Quantitative polymerase chain reaction (qPCR) is a technique that amplifies and estimates the concentration of a DNA amplicon after each amplification cycle [1]. qPCR is considered the gold standard in the field of relative nucleic acid measurements [2]. This highly sensitive method is frequently used as an analytical tool with biological and clinical applications. Despite the use of qPCR for more than 30 years since it was invented [3], there are different mathematical approaches to model amplification curves, efficiency, and DNA concentration estimation [2,4]. Many methods exist and have already been benchmarked in a previous work [5], but classic approaches based on standard curve, exponential, and sigmoidal models are frequently used in several applications.
As shown in Figure 1A, a classical model of DNA amplification by PCR is represented by a curve after plotting the number of reaction cycles (x-axis) versus fluorescence signal (Rn) accumulation (y-axis) [6]. During the first amplification cycles, the low amounts of produced amplicon cannot be detected (the fluorescence signal is below the limit of detection). This is called the baseline phase. Then, an exponential increase is observed, in which a maximum production rate is achieved. Finally, a post-exponential (also known as the plateau) phase is established when the product is no longer produced [4].
The efficiency (E) of a PCR is defined as the fraction of target molecules that are copied in one PCR cycle [7]. After the assay is finished, calculations of the Ct values (“cycle threshold” is the number of cycles required to reach the arbitrary threshold of the fluorescence signal) are performed at the beginning of the exponential phase and are subsequently used for quantitation purposes, either absolute or relative [6].
Classically, an efficiency value (theoretically ranged from 0–100% or equivalently ranged from 1–2 for form 1 + E) can be estimated from a standard curve, in which serial dilutions of known concentrations of DNA are used to estimate Ct values [2].
Then, a plot of the logarithm of concentrations (x-axis) and Ct values (y-axis) is established to perform a linear regression (Figure 1B), and by using the slope of the regression, the efficiency is then estimated as in [8]:
E = 10−1/slope − 1
Alternatively, a specific efficiency for each amplification curve can be obtained individually (from now on, we refer to this as “individual-curve-based” approaches) by considering exponential or sigmoidal methods [9]. For the first case, the exponential phase of the amplification curve (signal Rn) can be represented as an exponential function of the initial DNA quantity (baseline signal R0), amplification cycle, n, and the efficiency, E, to produce an Rn signal:
R n = R o   ·   1 + E n
In contrast, under the sigmoidal method, the entire amplification curve (all phases) can be modeled. In this case, the function requires maximum, Rmax, and minimum, Rmin, signals, a cycle, n1/2, in which half of Rmax is achieved, and the slope, k, in a quasi-linear part of the amplification [9,10]:
R n = ( R m a x R m i n ) 1 + e x n 1 2 k   + R m i n
For individual curves, modelling can be carried out by optimizing parameters to reduce the differences between the observed values (Rn signal in each cycle) and the modeled values. Then, for specific cycles a and b, efficiency can also be calculated [11]:
E = R n , a R n , b 1 C a C b
For normalization, a fold change or ratio is established between two experimental conditions, as detailed mathematically in several studies by Pfaffl et al. [8,12,13]. In this context, the use of a reference gene with “stable expression” (biologically known as a housekeeping gene) is critical to normalizing the values of a gene of interest (target). In this case, the initial values for target and reference genes are divided to estimate the ratio, r = R 0 , T / R 0 , R , or normalized values. After the isolation of value R0 in Equation (2), and considering that the threshold value is obtained for Rn when n = Ct with specific efficiencies for each gene, the normalization is
r n o r m a l i z e d = R 0 , T R 0 , R = R t h r e s h o l d   ·   1 + E T a r g e t C t T a r g e t R t h r e s h o l d   ·   1 + E R e f e r e n c e C t R e f e r e n c e = 1 + E T C t T   1 + E R C t R
This normalization can be applied to two different conditions, such as experimental and control, and subsequently, the fold change (FC) as the ratio between normalized values, FC = rexperiment/rcontrol, can be obtained.
From Equation (5), when an efficiency of 100% is assumed, the normalization corresponds to the classical 2-delta-Ct for differential expression analysis [14]. Theoretically, in this later case of E = 1, the DNA quantity will double in each cycle. Nonetheless, PCR efficiency usually reaches 65–90% due to, for example, differences in reaction inhibitors, enzymes, primers, and probes [2,6,15]. Thus, this scenario shows that efficiency calculation is not straightforward, and different parameters and mathematical models can impact the results of the gene expression estimations. In this sense, this is particularly critical due to the exponential nature of PCR, in which the reaction efficiency can have dramatic effects on quantitative determinations [2].
Here, we benchmarked different conditions to estimate efficiency for qPCR, including DNA concentration, amplicon length and mathematical models based on the standard curve and exponential and sigmoidal methods, as well as the ideal case 2-delta-Ct for normalizations. For this, qPCR data from a biological model were used. A total of 16 genes were selected from Pseudomonas aeruginosa AG1 [16]. These genes are related to the response to perturbations and are part of previous and further studies to gain biological insights into their regulation at the transcriptomic level [17,18,19].
Jointly, the study aimed to assess the effect of mathematical methods (in silico conditions) and experimental conditions on the quantification of qPCR efficiency using data from a prokaryotic model.

2. Materials and Methods

2.1. Biological Model and Experimental Analyses

The prokaryotic model Pseudomonas aeruginosa AG1 was used to generate qPCR data. A total of 16 genes found in the assembled genome [20] were considered for primer design and DNA quantification. The primers were designed using Primer-BLAST (https://www.ncbi.nlm.nih.gov/tools/primer-blast/, accessed on 14 January 2020) and were synthesized by Macrogen Inc. (Seoul, Republic of Korea). Details of the primers and amplicon size are presented in Table 1.
The standardization of qPCR assays for three genes corresponding to two metallo-β-lactamases alleles (VIM-2 and IMP-18) and rpoD as a reference gene [21] are reported in a previous study [19]. For the other 13 genes (proC, gcdH, dhcA, braZ, PrtN, pyoS5, prtR, rpoS, lexA, recA, recN, sulA, and lpxA), a qPCR protocol was standardized at the experimental level. DNA was isolated from a bacterial culture using the QIAGEN DNeasy Kit (QIAGEN, UK). A single DNA extract was considered for all assays, including dilutions. The reactions were prepared with 12.5 μL of SYBR green Master Mix (Thermo Scientific™ Inc., Carlsbad, CA, USA), 10 μL of PCR-grade water, 0.25 μL of each primer (concentrations in Table 1), and 2 μL of DNA. A StepOnePlus Real-Time PCR System (Thermo Scientific™, Inc.) was used for thermocycling. The conditions were denaturation at 95 °C (5 min) and 35 amplification cycles of 95 °C (20 s), 60 °C (20 s), and 72 °C (30 s), with data acquisition at 72 °C. For the melting curve, the range of 60–95 °C (increment: 0.03%) was established to detect non-specific amplicons. After establishing the appropriate experimental conditions, definitive assays with all genes were performed. For all genes but VIM-2 and IMP-18, quantification was performed with a single DNA concentration of 10 ng/μL, including proC as a reference gene [21,22]. For genes VIM-2, IMP-18, rpoD, and proC, five DNA concentrations, with serial dilutions (diluent: PCR-grade water) from the highest concentration to obtain 0.01, 0.1, 1, 10, and 100 ng/μL, were used to generate calibration curves (Table 2). Three replicates were considered for each concentration. DNA quantification was performed using NanoDrop equipment (Thermo Scientific™ Inc.).

2.2. Estimation of qPCR Efficiency Using Different Mathematical Models

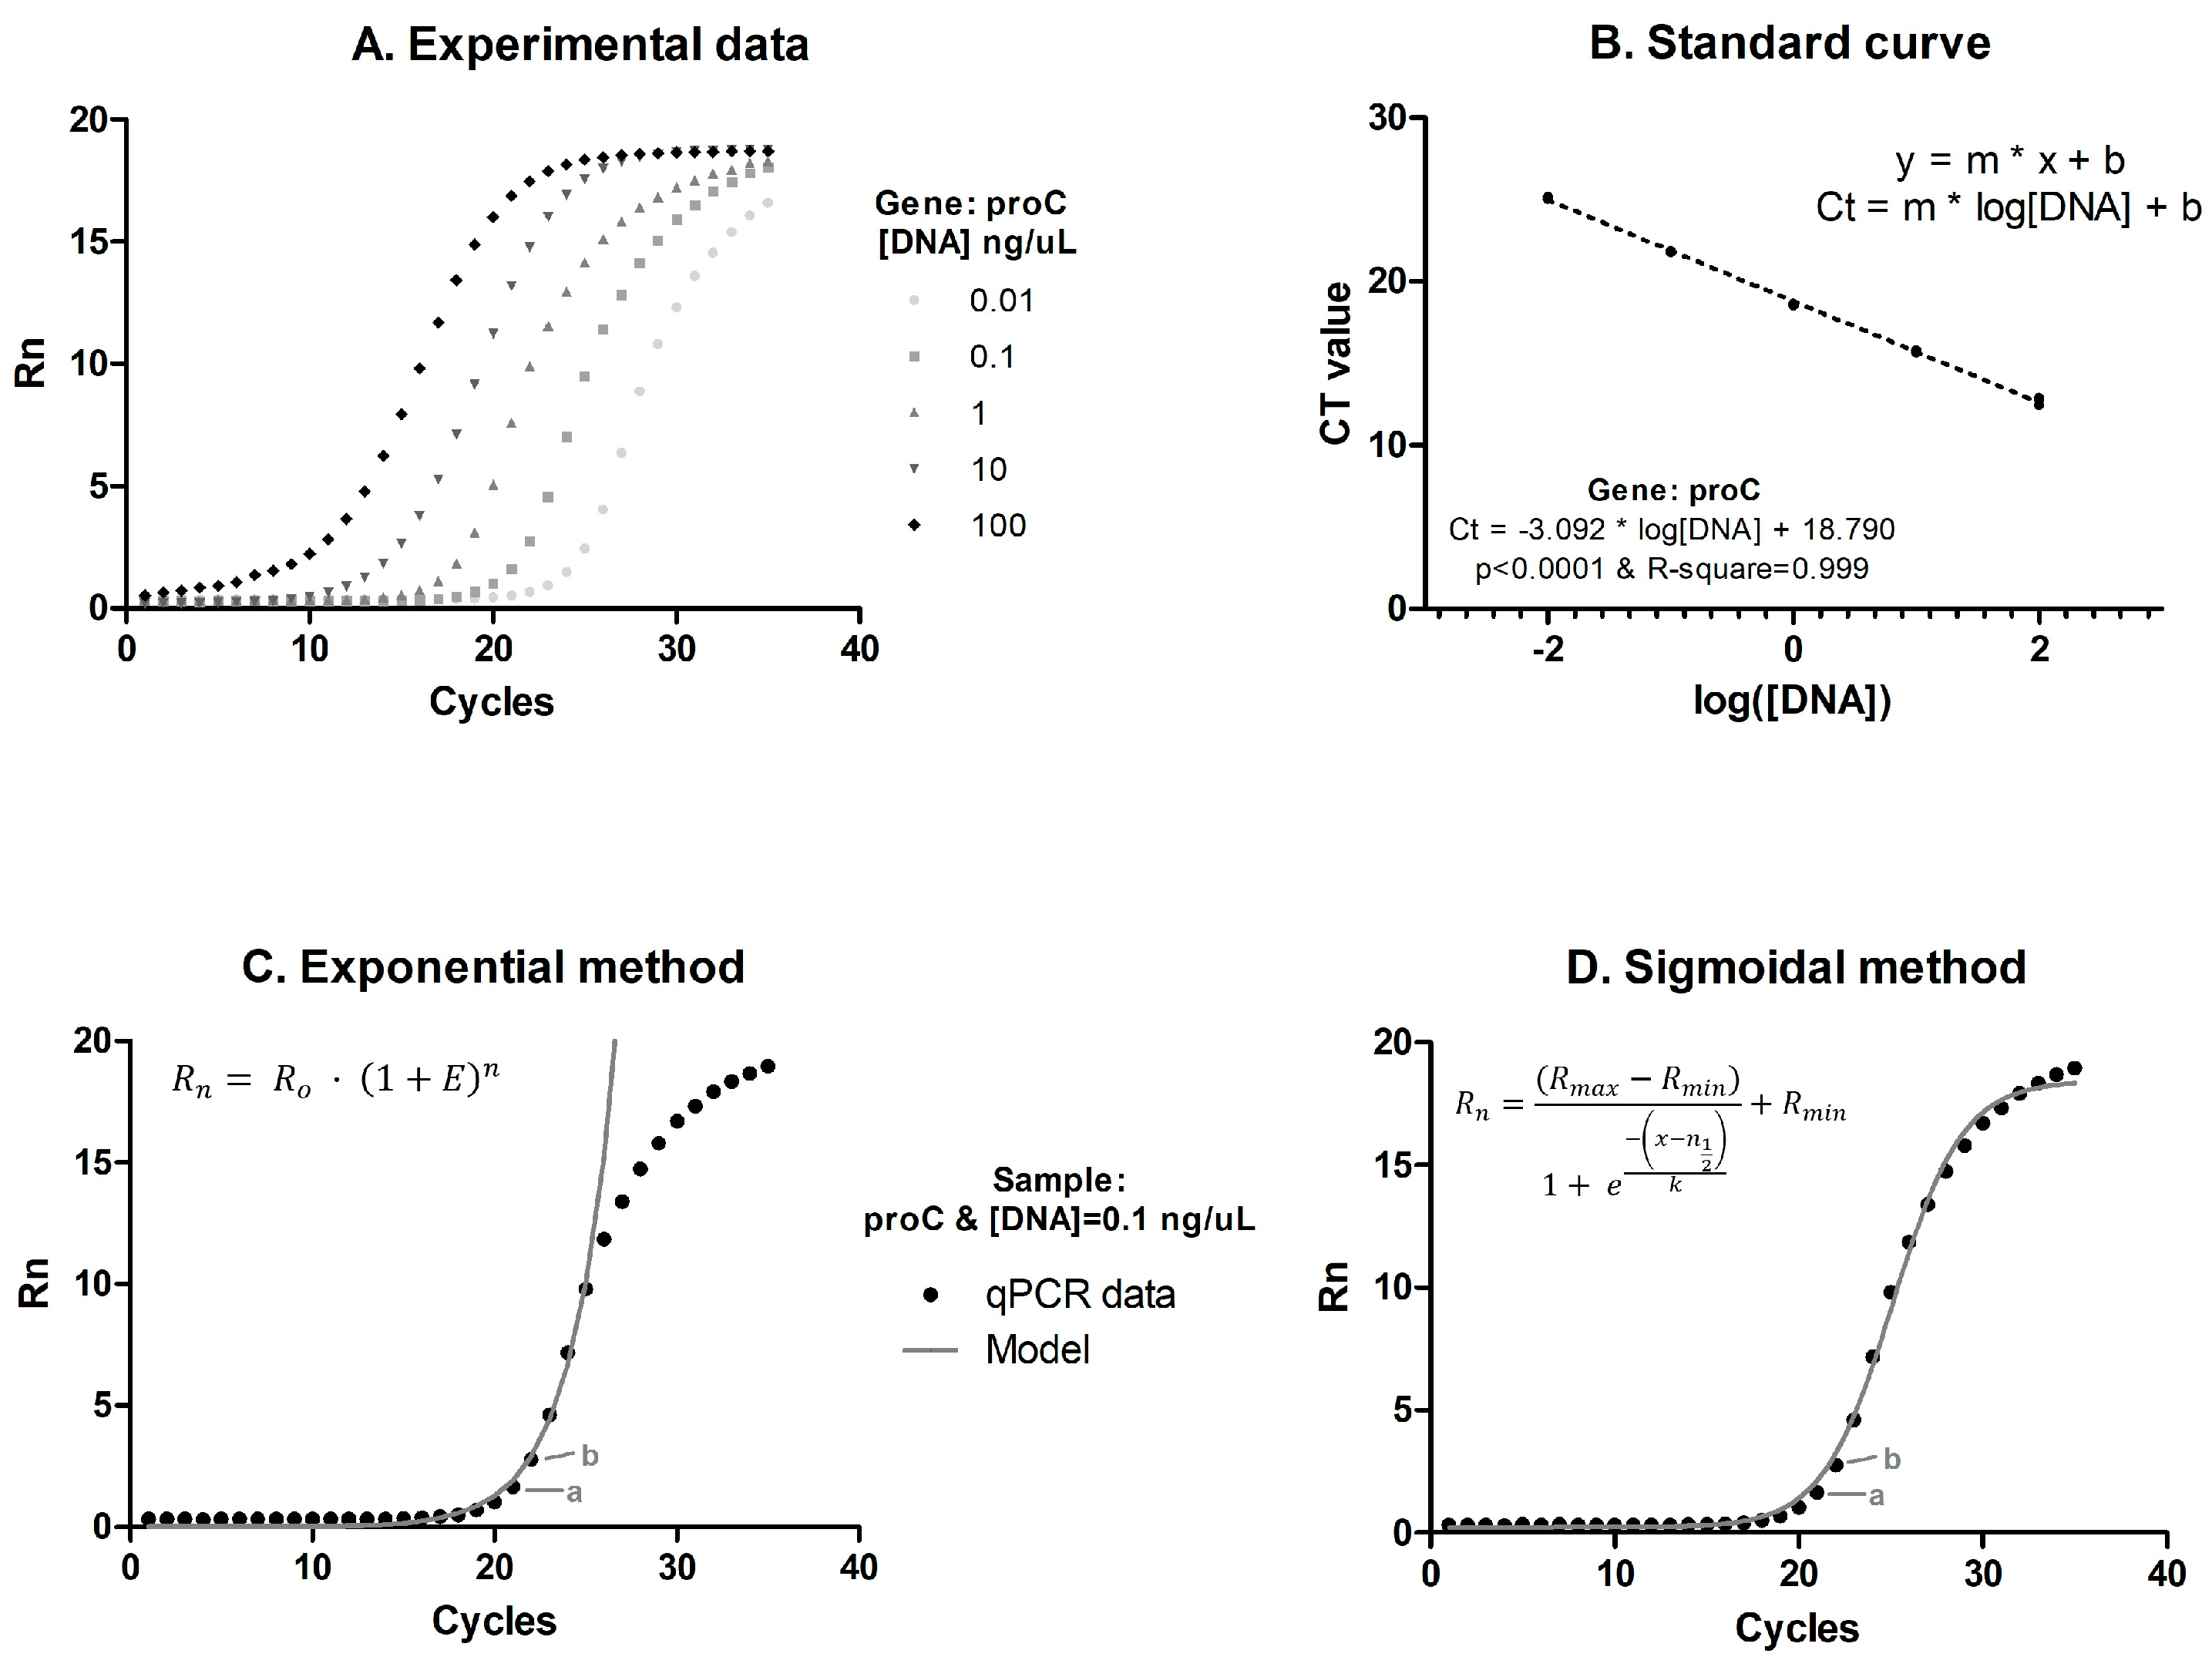
2.2.1. Calibration or Standard Curves

Four calibration curves were established for gene IMP-18, VIM-2, proC, and rpoD. Efficiency was estimated using Equation (1) (Figure 1B).

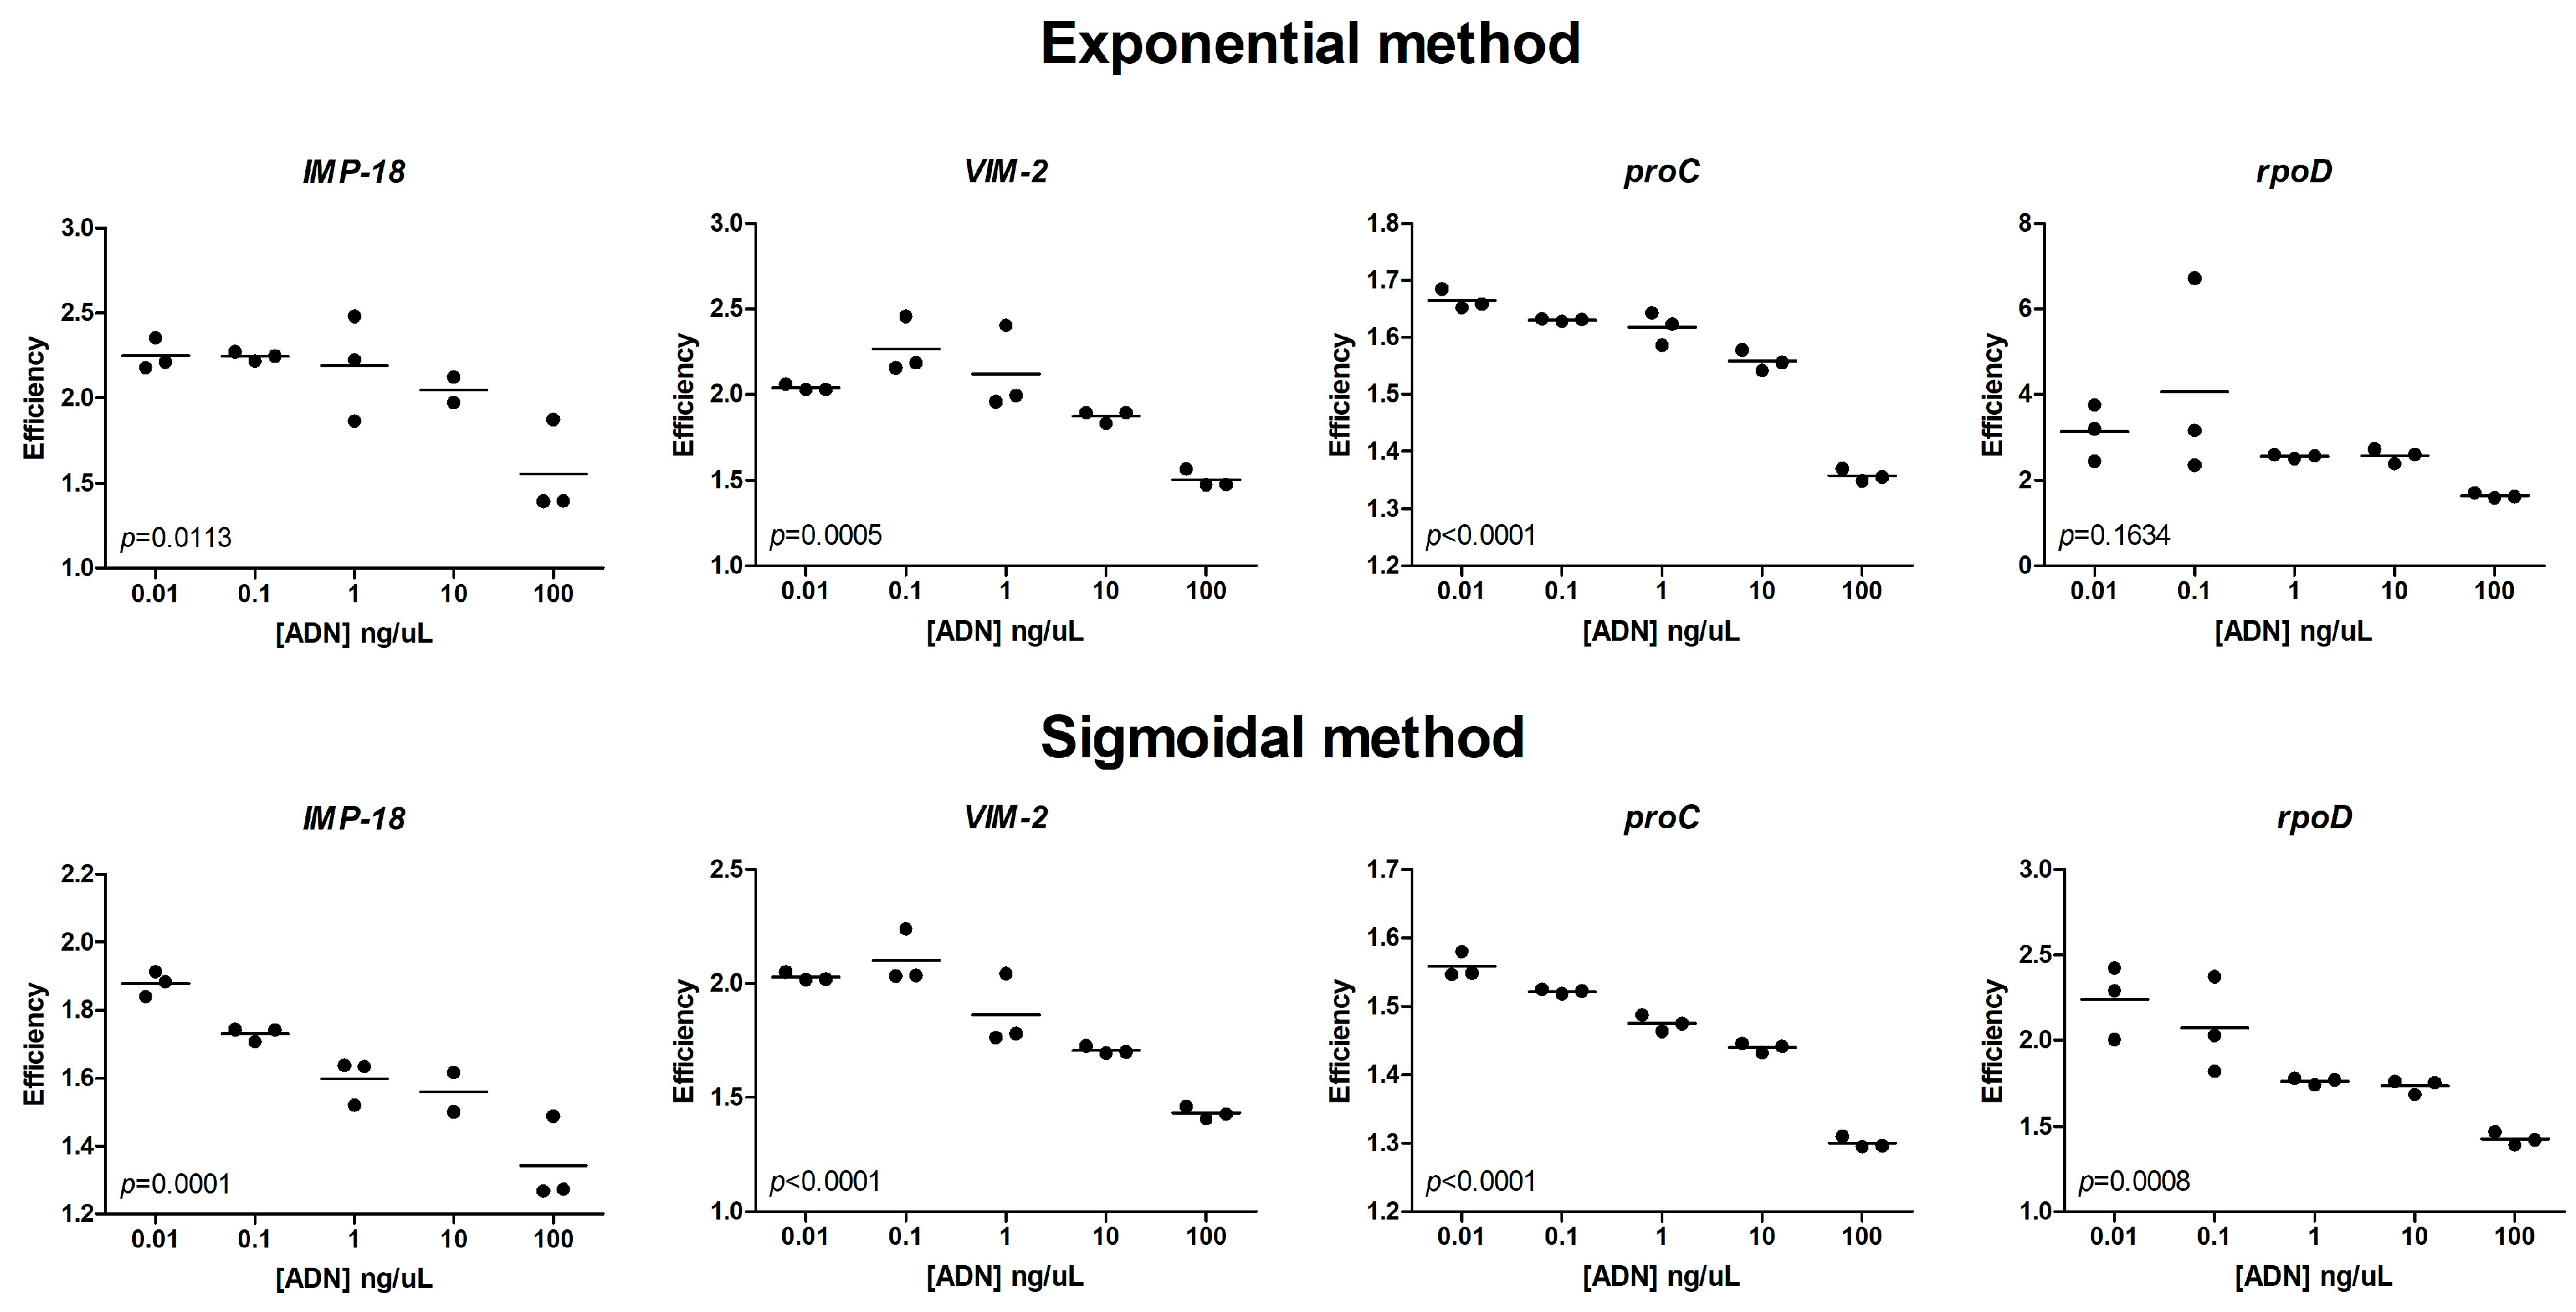
2.2.2. Individual-Curve-Based Approaches (Exponential and Sigmoidal Methods)

By using the Ct values obtained in each cycle for each assay, the efficiency values were obtained using the exponential and sigmoidal methods (Figure 1C,D). Equations (2) and (3) were used as mathematical models to fit the experimental curves using GraphPad Prism (version 5.03, GraphPad Software, San Diego, CA, USA), in which parameter optimization was implemented to minimize the error between the function and the actual data of the qPCR amplification curve (i.e., until the curve fit the experimental data). For example, Figure 1C,D show the actual parameter fitting for the proC gene when [DNA] = 0.1 ng/μL for the exponential and sigmoidal methods. Similarly, a total of 91 qPCR assays were individually fitted by using both individual-curve-based approaches. After parameter optimization, curves were used to estimate efficiency with the cycles around the Ct value of Equation (4) (for example, proC gene with [DNA] = 0.1 ng/μL had Ct = 21.84, so cycles a = 21 and b = 22 were used to estimate efficiency; see Figure 1C,D).

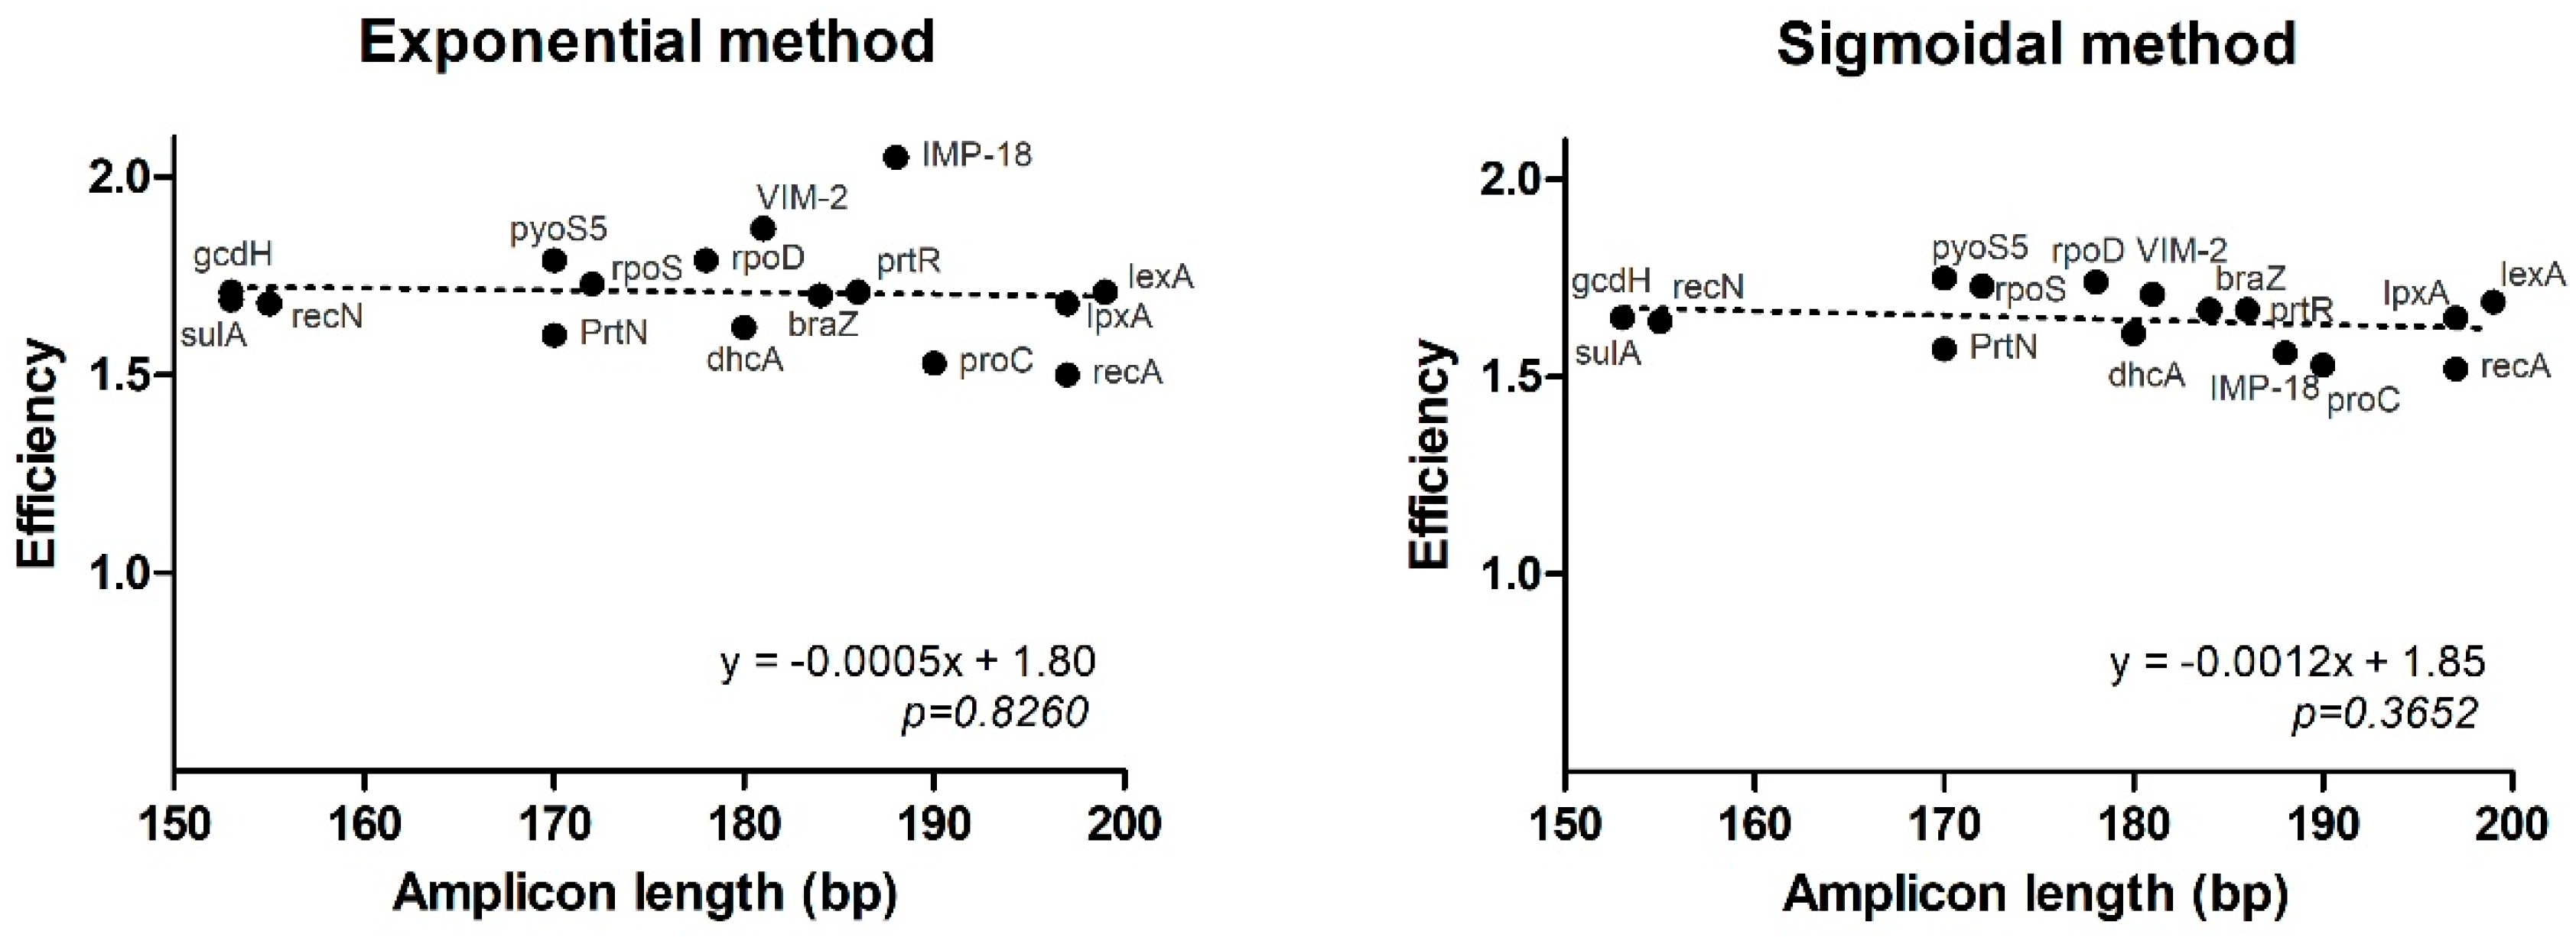
2.3. Comparison of Mathematical Approaches for the Estimation of qPCR Efficiency

Replicates used in the standard curves for each gene (IMP-18, VIM-2, proC, and rpoD) were used to assess the effect of DNA concentration on PCR efficiency. A Kruskal-Wallis test (95% confidence, after validation of assumptions) was implemented to determine if there was a significant difference between the template concentration and the efficiency among the different mathematical methods. In a second analysis, data for all the 16 genes (same DNA concentration) were used to compare amplicon size and PCR efficiency estimated by each individual-curve-based approach (95% confidence, using linear regression test).

2.4. Fold Change between Points of the Standard Curve

Finally, by using the Ct values obtained from the standard curves and efficiency values per DNA concentration, the fold was calculated against the lower concentration, 0.01 ng/μL. Due to the nature of the standard curve, in which decimal dilutions were made, expected folds of 1, 10, 100, 1000, and 10,000 were compared to the calculated values from the different approaches for estimating qPCR efficiency. The ideal theoretical case with 100% (E = 2) was included as part of the 2-delta-Ct approach. The calculations were derived from Equation (5), including a normalization using the reference gene proC at the same DNA concentration, as per Equation (5). Because rpoD was also used for normalization [21,22,23], a preliminary analysis demonstrated lower variability for proC compared to rpoD.

3. Results

In order to assess the effect of mathematical methods and other parameters on the quantification of the efficiency of qPCR reactions, data from P. aeruginosa AG1 were used.
For the calculation of qPCR efficiency using the standard curve method, standard curves with five 10-fold dilutions (triplicates) were obtained for each of the following genes: IMP-18, VIM-2, proC, and rpoD. Table 2 shows that a consensus E value was obtained for each gene (using Equation (1)). For three out of the four genes, the efficiency value was 2 (i.e., 100%, with R-square values of >98.7%), whereas for VIM-2, the value was 1.9 (90%; R-square: 99.5%). In the case of the individual-curve-based approaches using the same data as above, diverse E values were obtained. For the exponential method, the values ranged between 1.36 and 2.57, while a range of E = 1.30–2.24 was found for all cases using the sigmoidal method, with a relevant number of cases higher than the expected maximum value of 2 for both approaches.
For each assay (any row in Table 2), the efficiency and normalized data are dependent on the mathematical model. For example, for VIM-2 with [DNA] = 100 ng/μL, the efficiency values were 1.90 under the standard curve, 1.50 for the exponential method, and 1.43 for the sigmoidal method. When the expression is calculated and normalized according to proC at [DNA] = 100 ng/μL, the values resulted in a high variation, with a coefficient of variation (CV) of CV = 87.4 obtained from normalized expression values of 0.8606, 1.6678, 0.2515, and 0.2705 for the 2-delta-Ct, standard curve, exponential, and sigmoidal methods, respectively. Similar patterns were found for all other genes.
When efficiency is compared to DNA concentration (Figure 2), the pattern suggests that reaction efficiency is influenced by the concentration despite maintaining the same amplification conditions for the same gene. A decreasing trend in efficiency can be observed in most cases as DNA concentration increased in the reaction.
This phenomenon is observed for the four genes using specific-curve-based approaches when using either an exponential or sigmoidal method, with statistical support (p < 0.05) in all cases except for the rpoD gene in the exponential method. For the other qPCR data at a single DNA concentration, efficiencies for the exponential model were found in the range of 1.50–1.79, while the range was 1.52–1.75 for the sigmoidal approach. For these cases, we also compared efficiency and the amplicon size (Figure 3), in which a stability of efficiency is observed when size varies in the range of 150–200 bp (p > 0.05).
The estimated fold-change among samples with different DNA concentrations was computed with respect to the lower concentration (0.01 ng/μL). The expected values were compared to the predicted values according to the Ct and efficiency values for each mathematical approach. As shown in Table 3, in the theoretical case of 100% efficiency being assumed (2-delta-Ct) or predicted by the standard curve (for all genes but VIM-2), the calculations do not achieve the expected value of the fold and are critical to higher concentrations. For example, for the case of 100 ng/μL (10,000 times the concentration of 0.01 ng/μL), an efficiency of 100% predicts a 5000-fold change after calculations for genes IMP-18, proC, and rpoD. In contrast, when efficiency was 90% (1.9 for VIM-2), the same case provides a fold change of 9878×.
For the individual-curve-based approaches, both the exponential and sigmoidal methods are greatly impacted by calculations using non-ideal efficiencies. Very extreme values out of the expected folds are found mainly for samples in which the concentration is increased, including log variations. For example, for the case of 1 ng/μL (100 times the concentration of 0.01 ng/μL) for IMP-18, using specific efficiencies predicts a fold change of 400× under an exponential method, which is in contrast to 1343× using the sigmoidal approach. More extreme values are found for the rpoD gene at the same point, in which the exponential approach predicted ~151× in the exponential method and ~17,000× using the sigmoidal approach when 100× is expected.

4. Discussion

Amplification curves in qPCR can be modeled using mathematical approaches to estimate reaction efficiency [24]. In this study, the data of 16 genes from the strain P. aeruginosa AG1 were quantified using qPCR at specific DNA concentrations. Reaction efficiency was estimated using the standard curve and two individual-curve-based approaches: exponential and sigmoidal. The models showed differences in accuracy and reproducibility in efficiency estimation. This represents a critical issue due to a key point in qPCR: accurate quantitation requires that all samples have equal amplification efficiency [15] or when considering the limitations of specific assay and statistical parameters when interpreting results.
Notwithstanding the fact that an “ideal value” of 100% efficiency (E = 2) was achieved by almost all standard curves, the mathematical calculations demonstrated that it is not possible to obtain the expected folds of DNA concentrations (with respect to the lower concentration), as evidenced in Table 3. This indicates a possible overestimation of the efficiency using serial dilutions. This comparison was inspired by previous work [11], in which the theoretical foundations demonstrated the reliability of dilutions to predict folds. In our model, this was not achieved, but we used specific Ct data for each condition of the reference gene, which is different from previous work, which used a unique Ct for all dilutions.
For the case of the dilutions in the current study, due to the calculations being based only on efficiency and Ct values, where efficiency is assumed to be perfect, the critical parameter is the Ct value. More precisely, the delta-Ct value between samples (serial dilutions) alters the calculated fold. Thus, the real delta-Ct is affected by the kinetics of the qPCR assay [11]. This influences subsequent calculations of the fold and, more importantly, normalizations due to inaccurate Ct values when assuming perfect efficiency. These discordances are like those of other studies, in which up to 42.5% of uncertainty could be found for efficiency estimations using standard curves (in this case, using only one replicate) [7].
Regarding efficiency under individual-curve-based approaches, the efficiency values resulted in variable and lower-than-ideal values when using the sigmoidal method, with an average value of 1.67 (with scarce values with E > 2) for all genes. However, with an average efficiency of 1.85, several values with E > 2 were reported for the exponential model. In both cases, the mean values do not achieve the recommended values of 90% (E = 1.9) [7]. In practice, as in our study with the individual methods, the efficiencies obtained from experimental qPCR assays are often considerably less than 100% and are often not equal between individual samples [24]. In the case of the expected efficiency, dramatic values were obtained, with predictions that can be considered not theoretically reasonable. As studied before in [2], this is explained by the nature of an exponential model, in which small changes in the input imply a great impact on the calculations of the output. In another study, it was found that a difference of 4% in efficiency could translate into a 400% error in DNA quantification [25]. If assumptions of perfect efficiency are not satisfied, the reliability of quantitation is lost [24]. Some of the sources of variation in efficiency estimation are related to the number of replicates in standard curves (at least three replicates are recommended for concentration), the instruments, and the sample volumes [7].
In addition, because efficiency calculations are based on different mathematical models in particular contexts, interpretations can be quite different. For example, in the context of a standard curve, efficiency reflects an average value across various dilution levels. In contrast, within a specific curve-fitting model, efficiency represents a model-based estimate of the amplification rate over the PCR cycles. Another consideration concerns any differences in product size among the amplification curve and its effect on the mathematical approach, as was previously reported [26]. Long products dominate the first PCR cycles (where Ct is calculated), which is unlike short products that are found at the exponential phase. Thus, efficiency values for standard curves and individual approaches deal with experimental differences that affect their approximations.
Based on these results and mainly considering DNA concentration folds, it seems reasonable to follow the current instructions of the Minimum Information for publication of Quantitative real-time PCR Experiments (MIQE) guidelines, which has recommended the standard curve as the method of choice for the estimation of qPCR efficiency since 2009 [27]. Other methods, such as the individual-curve-based approaches, are suggested as complementary options to quantify DNA, although different authors have several opinions. The standard curve remains the most reliable and robust approach to estimating PCR assay efficiency and is broadly accepted by the scientific community according to current agreements [7,27]. However, the standard curve has the requirement of several replicates in each concentration to report confident results, including the subsequent drawbacks of being time-consuming and highly expensive [28]. Methods using individual amplification curves are reported to give more confidence in estimating efficiency in each reaction and require reduced workloads and costs; however, as was found in this study, the results can be greatly impacted by this method.
In addition, based on the appropriate selection of a specific mathematical method depending on the experimental design for particular contexts [29], some scenarios make sigmoidal and exponential methods candidates for implementation. For example, when an RNA source is scarce (by degradation or during the intracellular cycle of a pathogen, for example), transcript quantification can benefit from the use of the individual-curve methods without the need for large amounts of copy-DNA for building standard curves.
On the other hand, regarding DNA concentration, it was evidenced that efficiency is negatively related to DNA concentration. This phenomenon was also found in another study, in which efficiencies systematically tended to increase as DNA serial dilutions were made [25]. A plausible explanation of the dilutional effect is related to PCR inhibitors, which are also diluted with the DNA. PCR inhibitors may affect qPCR assays via different mechanisms, such as disturbing the annealing of primers, affecting DNA polymerase activity, or impairing fluorescence detection [30]. Inhibitors from source samples or contamination with chemical compounds (salts, phenol, chloroform, heparin, and/or ethanol) in previous steps, including DNA extraction in our case, result in a lower-than-expected efficiency [25]. The application of strategies to purify DNA and eliminate interferences is suggested (but not considered in the protocols presented here). In addition, other explanations of the occurrence of this pattern can be a product of enzyme kinetics—in which substrate concentration can have effects on qPCR efficiency—or the effect of reduced priming accuracy events from an excess of genomic DNA (for example, primer annealing at similar but not identical primer-binding sites along the genome) [31]. In the case of amplicon length, which ranged 150–200 bp for all 16 genes, the association was discarded between size and efficiency using individual-curve methods. This is in line with the previous recommendations in which amplicons length <200 bp are suggested [31].
Other experimental conditions can impact qPCR reactions and subsequent analyses, including primer design [32], template quality [25], enzymes (DNA polymerase types and conditions) [33], other reaction components [24], cycling conditions [34], sample handling and pipetting errors, reference genes for normalization [35], and others. Jointly, these parameters will be considered as part of further assays using bacterial models in a more biological context, including the quantification of determinants that we have previously found in the perturbome [17], the SOS response [36], or the response to ciprofloxacin [18] in P. aeruginosa AG1.

5. Conclusions

In conclusion, qPCR performance is dependent on experimental conditions and mathematical models, as we demonstrated by using 16 different genes for a prokaryotic model, comparing DNA concentration, amplicon length, and three mathematical approaches to assess reaction efficiency. This is critical because it can impact the estimation of DNA concentration and the confidence of qPCR results in different scientific and professional settings.

Author Contributions

J.A.M.-M., C.G. and F.G. participated in the conception and design of the study. M.S.-A., J.A.M.-M., L.R.-M. and D.C.-A. performed experimental assays. M.S.-A. and J.A.M.-M. participated in data analysis. J.A.M.-M. drafted the manuscript. All authors have read and agreed to the published version of the manuscript.

Funding

This work was funded by projects “C1163 pro-NGS 2.0: Protocolos operativos estandarizados de análisis de datos moleculares obtenidos por NGS o afines y de algoritmos de inteligencia artificial en modelos biológicos”, Vicerrectoría de Investigación, Universidad de Costa Rica (period 2021–2023) and “C4604 iPAT: Plataforma genómica, bioinformática y de inteligencia artificial para la vigilancia de patógenos”, Vicerrectoría de Investigación, Universidad de Costa Rica (period 2024–2026).

Institutional Review Board Statement

Not applicable.

Informed Consent Statement

Not applicable.

Data Availability Statement

Data available within the article. The original contributions presented in the study are included in the article, further inquiries can be directed to the corresponding author.

Acknowledgments

We thank Daniela Aguilar and Laura Acuña for the initial technical support to develop this work.

Conflicts of Interest

The authors declare no conflicts of interest.

References

  1. Dymond, J.S. Explanatory Chapter: Quantitative PCR. Methods Enzymol. 2013, 529, 279–289. [Google Scholar] [CrossRef] [PubMed]
  2. Panina, Y.; Germond, A.; David, B.G.; Watanabe, T.M. Pairwise efficiency: A new mathematical approach to qPCR data analysis increases the precision of the calibration curve assay. BMC Bioinform. 2019, 20, 295. [Google Scholar] [CrossRef]
  3. Porcher, C.; Malinge, M.C.; Picat, C.; Grandchamp, B. A simplified method for determination of specific DNA or RNA copy number using quantitative PCR and an automatic DNA sequencer. Biotechniques 1992, 13, 106–114. [Google Scholar] [PubMed]
  4. Patrone, P.N.; Romsos, E.L.; Cleveland, M.H.; Vallone, P.M.; Kearsley, A.J. Affine analysis for quantitative PCR measurements. Anal. Bioanal. Chem. 2020, 412, 7977–7988. [Google Scholar] [CrossRef] [PubMed]
  5. Ruijter, J.M.; Pfaffl, M.W.; Zhao, S.; Spiess, A.N.; Boggy, G.; Blom, J.; Rutledge, R.G.; Sisti, D.; Lievens, A.; De Preter, K.; et al. Evaluation of qPCR curve analysis methods for reliable biomarker discovery: Bias, resolution, precision, and implications. Methods 2013, 59, 32–46. [Google Scholar] [CrossRef] [PubMed]
  6. Zhang, Y.; Li, H.; Shang, S.; Meng, S.; Lin, T.; Zhang, Y.; Liu, H. Evaluation validation of a qPCR curve analysis method and conventional approaches. BMC Genom. 2021, 22, 680. [Google Scholar] [CrossRef] [PubMed]
  7. Svec, D.; Tichopad, A.; Novosadova, V.; Pfaffl, M.W.; Kubista, M. How good is a PCR efficiency estimate: Recommendations for precise and robust qPCR efficiency assessments. Biomol. Detect. Quantif. 2015, 3, 9. [Google Scholar] [CrossRef] [PubMed]
  8. Pfaffl, M.W. A new mathematical model for relative quantification in real-time RT-PCR. Nucleic Acids Res. 2001, 29, e45. [Google Scholar] [CrossRef] [PubMed]
  9. Rutledge, R.G. Sigmoidal curve-fitting redefines quantitative real-time PCR with the prospective of developing automated high-throughput applications. Nucleic Acids Res. 2004, 32, e178. [Google Scholar] [CrossRef] [PubMed]
  10. Gutiérrez Sánchez, P.A.; Rodríguez Fuerte, V.; Marín Montoya, M. A Sigmoidal Model for the interpretation of Quantitative PCR (QPCR) Experiments. Rev. Fac. De Cienc. Básicas 2012, 8, 244–253. [Google Scholar]
  11. Liu, W.; Saint, D.A. A new quantitative method of real time reverse transcription polymerase chain reaction assay based on simulation of polymerase chain reaction kinetics. Anal. Biochem. 2002, 302, 52–59. [Google Scholar] [CrossRef] [PubMed]
  12. Pfaffl, M.W. Relative quantification. In Real-Time PCR; Taylor & Francis: Abingdon, UK, 2006; pp. 63–82. [Google Scholar] [CrossRef]
  13. Pfaffl, M.W. Quantification strategies in real-time PCR. In Quantification Strategies in Real-Time PCR; Citeseer: Princetonm, HJ, USA, 2004; pp. 87–112. [Google Scholar]
  14. Rao, X.; Huang, X.; Zhou, Z.; Lin, X. An improvement of the 2^(-delta delta CT) method for quantitative real-time polymerase chain reaction data analysis. Biostat. Bioinform. Biomath. 2013, 3, 71–85. [Google Scholar]
  15. VanGuilder, H.D.; Vrana, K.E.; Freeman, W.M. Twenty-five years of quantitative PCR for gene expression analysis. Biotechniques 2008, 44, 619–626. [Google Scholar] [CrossRef] [PubMed]
  16. Molina-Mora, J.A.; García, F. Molecular Determinants of Antibiotic Resistance in the Costa Rican Pseudomonas aeruginosa AG1 by a Multi-omics Approach: A Review of 10 Years of Study. Phenomics 2021, 1, 3. [Google Scholar] [CrossRef] [PubMed]
  17. Molina Mora, J.A.; Montero-Manso, P.; García-Batán, R.; Campos-Sánchez, R.; Fernández, J.V.; García, F. A first perturbome of Pseudomonas aeruginosa: Identification of core genes related to multiple perturbations by a machine learning approach. Biosystems 2021, 205, 104411. [Google Scholar] [CrossRef]
  18. Molina-Mora, J.A.; Chinchilla, D.; Chavarría, M.; Ulloa, A.; Campos-Sanchez, R.; Mora-Rodríguez, R.A.; Shi, L.; García, F. Transcriptomic determinants of the response of ST-111 Pseudomonas aeruginosa AG1 to ciprofloxacin identified by a top-down systems biology approach. Sci. Rep. 2020, 10, 13717. [Google Scholar] [CrossRef] [PubMed]
  19. Molina-Mora, J.A.; Chinchilla-Montero, D.; García-Batán, R.; García, F. Genomic context of the two integrons of ST-111 Pseudomonas aeruginosa AG1: A VIM-2-carrying old-acquaintance and a novel IMP-18-carrying integron. Infect. Genet. Evol. 2021, 89, 104740. [Google Scholar] [CrossRef] [PubMed]
  20. Molina-Mora, J.-A.; Campos-Sánchez, R.; Rodríguez, C.; Shi, L.; García, F. High quality 3C de novo assembly and annotation of a multidrug resistant ST-111 Pseudomonas aeruginosa genome: Benchmark of hybrid and non-hybrid assemblers. Sci. Rep. 2020, 10, 1392. [Google Scholar] [CrossRef] [PubMed]
  21. Savli, H.; Karadenizli, A.; Kolayli, F.; Gundes, S.; Ozbek, U.; Vahaboglu, H. Expression stability of six housekeeping genes: A proposal for resistance gene quantification studies of Pseudomonas aeruginosa by real-time quantitative RT-PCR. J. Med. Microbiol. 2003, 52, 403–408. [Google Scholar] [CrossRef] [PubMed]
  22. Meng, L.; Cao, X.; Li, C.; Li, J.; Xie, H.; Shi, J.; Han, M.; Shen, H.; Liu, C. Housekeeping gene stability in Pesudomonas aeruginosa PAO1 under the pressure of commonly used antibiotics in molecular microbiology assays. Front. Microbiol. 2023, 14, 1140515. [Google Scholar] [CrossRef] [PubMed]
  23. Alqarni, B.; Colley, B.; Klebensberger, J.; McDougald, D.; Rice, S.A. Expression stability of 13 housekeeping genes during carbon starvation of Pseudomonas aeruginosa. J. Microbiol. Methods 2016, 127, 182–187. [Google Scholar] [CrossRef] [PubMed]
  24. Liu, W.; Saint, D.A. Validation of a quantitative method for real time PCR kinetics. Biochem. Biophys. Res. Commun. 2002, 294, 347–353. [Google Scholar] [CrossRef] [PubMed]
  25. Ramakers, C.; Ruijter, J.M.; Lekanne Deprez, R.H.; Moorman, A.F.M. Assumption-free analysis of quantitative real-time polymerase chain reaction (PCR) data. Neurosci. Lett. 2003, 339, 62–66. [Google Scholar] [CrossRef] [PubMed]
  26. Nogva, H.K.; Rudi, K. Potential influence of the first PCR cycles in real-time comparative gene quantifications. Biotechniques 2004, 37, 246–253. [Google Scholar] [CrossRef] [PubMed]
  27. Bustin, S.A.; Benes, V.; Garson, J.A.; Hellemans, J.; Huggett, J.; Kubista, M.; Mueller, R.; Nolan, T.; Pfaffl, M.W.; Shipley, G.L.; et al. The MIQE Guidelines: Minimum Information for Publication of Quantitative Real-Time PCR Experiments. Clin. Chem. 2009, 55, 611–622. [Google Scholar] [CrossRef] [PubMed]
  28. Conte, J.; Potoczniak, M.J.; Tobe, S.S. Using synthetic oligonucleotides as standards in probe-based qPCR. Biotechniques 2018, 64, 177–179. [Google Scholar] [CrossRef] [PubMed]
  29. Čikoš, Š.; Bukovská, A.; Koppel, J. Relative quantification of mRNA: Comparison of methods currently used for real-time PCR data analysis. BMC Mol. Biol. 2007, 8, 113. [Google Scholar] [CrossRef] [PubMed]
  30. Sidstedt, M.; Rådström, P.; Hedman, J. PCR inhibition in qPCR, dPCR and MPS—Mechanisms and solutions. Anal. Bioanal. Chem. 2020, 412, 2009–2023. [Google Scholar] [CrossRef] [PubMed]
  31. Booth, C.S.; Pienaar, E.; Termaat, J.R.; Whitney, S.E.; Louw, T.M.; Viljoen, H.J. Efficiency of the polymerase chain reaction. Chem. Eng. Sci. 2010, 65, 4996–5006. [Google Scholar] [CrossRef] [PubMed]
  32. Sreedharan, S.P.; Kumar, A.; Giridhar, P. Primer design and amplification efficiencies are crucial for reliability of quantitative PCR studies of caffeine biosynthetic N-methyltransferases in coffee. 3 Biotech 2018, 8, 467. [Google Scholar] [CrossRef] [PubMed]
  33. Pan, W.; Byrne-Steele, M.; Wang, C.; Lu, S.; Clemmons, S.; Zahorchak, R.J.; Han, J. DNA polymerase preference determines PCR priming efficiency. BMC Biotechnol. 2014, 14, 10. [Google Scholar] [CrossRef] [PubMed]
  34. Wu, D.Y.; Ugozzoli, L.; Pal, B.K.; Qian, J.; Wallace, R.B. The Effect of Temperature and Oligonucleotide Primer Length on the Specificity and Efficiency of Amplification by the Polymerase Chain Reaction. DNA Cell Biol. 2009, 10, 233–238. [Google Scholar] [CrossRef] [PubMed]
  35. Mar, J.; Kimura, Y.; Schroder, K.; Irvine, K.M.; Hayashizaki, Y.; Suzuki, H.; Hume, D.; Quackenbush, J. Data-driven normalization strategies for high-throughput quantitative RT-PCR. BMC Bioinform. 2009, 10, 110. [Google Scholar] [CrossRef] [PubMed]
  36. Molina-Mora, J.A.; Campos-Sanchez, R.; Garcia, F. Gene Expression Dynamics Induced by Ciprofloxacin and Loss of Lexa Function in Pseudomonas aeruginosa PAO1 Using Data Mining and Network Analysis. In Proceedings of the 2018 IEEE International Work Conference on Bioinspired Intelligence (IWOBI), San Carlos, Costa Rica, 18–20 July 2018; pp. 1–7. [Google Scholar]
Figure 1. Experimental qPCR data and mathematical methods to model amplification and reaction efficiency. Gene proC was used as an example including five DNA concentrations as templates (a single replicate is shown) for amplification (A), to establish calibration curve (B). Model fitting for a specific concentration by exponential (C) and sigmoidal (D) methods are shown, including the points (a) and (b) to determine efficiency (see text). Rn: fluorescence signal; Ct: cycle threshold.
Dna 04 00012 g001
Figure 2. Assessment of qPCR reaction efficiency with DNA concentration for four genes and two individual-curve-based mathematical models, for genes IMP-18, VIM-2, proC, and rpoD.
Dna 04 00012 g002
Figure 3. Assessment of efficiency of qPCR reaction based on amplicon size for 16 genes. Curve-specific models (exponential and sigmoidal methods) were used to estimate efficiency among all genes with the same DNA concentration as template.
Dna 04 00012 g003
Table 1. List of primers for qPCR assays of 16 genes in the bacterial model.
GeneConcentration
(uM)
Primer NameSequence 5′ → 3′Amplicon Size
IMP-18
Imipenemase MBL
1IMP-FGAATAG(A/G)(A/G)TGGCTTAA(C/T)TCTC188 bp
IMP-RCCAAAC(C/T)ACTA(G/C)GTTATC
VIM-2
Verona integron–encoded MBL
1VIM2-FCCGCGTCTATCATGGCTATT181 bp
VIM2-RATGAGACCATTGGACGGGTA
rpoD
RNA polymerase sigma factor
1rpoD-FGGGCGAAGAAGGAAATGGTC178 pb
rpoD-RCAGGTGGCGTAGGTGGAGAA
proC
Pyrroline-5-carboxylate reductase
1proC-FCAGGCCGGGCAGTTGCTGTC190 pb
proC-RGGTCAGGCGCGAGGCTGTCT
gcdH
Glutaryl-CoA dehydrogenase
1gcdH-FATGTGGATCACCAACAGCCC153 pb
gcdH-RTCTCTTCCGGAACGAACACG
dhcA
Dehydrocarnitine CoA transferase
1gcdH-FATTCCCGAGAACCTGATCGC180 pb
gcdH-RGTTCTCGCCGACATAGGAGG
braZ
branched-chain AA transporter
1braZ-FTGCCTACGTGCAACATACCT184 pb
braZ-RACGATGAAGGAGAACCCTGC
PrtN
Transcription regulatory protein
0.1PrtN-FGGAAAACTTCAGCAAGGCCC170 pb
PrtN-RTCAGGATGCGATGCTGTCA
pyoS5
Pyocin S5
0.1pyoS5-FGCCAGCCTGTACCAAGAGTT170 pb
pyoS5-RATTACCAGTGCGAACCCCAG
prtR
HTH-type transcriptional regulator
0.1prtR-FCCGCTGTACAAGGAAGTGGA186 pb
prtR-RATGATCAGCGGTTCCATGCT
rpoS
RNA polymerase sigma factor
1rpoS-FTGGTCAAGGAGCTCAACGTC172 pb
rpoS-RGACGTCTACCGAAGTCACCC
lexA
SOS repressor protein
0.1lexA-FTCCCGCCTTCTTCAATCCTC199 pb
lexA-RGAAGCGTTTCACCGTGACCT
recA
Recombinase A
1recA-FGAGATCGAAGGCGAGATGGG197 pb
recA-RAGGCGTAGAACTTCAGTGCG
recN
DNA repair protein RecN
0.1recN-FGTGGAAATGTGCAGCGAGAG155 pb
recN-RTTGGGATCGGCATCGAAGTG
sulA
Cell division inhibitor
1sulA-FGAGGAACCCGCTGCCTTTAG153 pb
sulA-RAGCCATTCATGGGTCAGGC
lpxA
Acetylglucosamine acyltransferase
1lpxA-FAAGCACAACCGCATCTACCA197 pb
lpxA-RATGTGCGCATAGGCCATGAT
Table 2. Comparison of different mathematical methods for efficiency estimation and normalization in qPCR assays.
GENE Conditions Efficiency by Approach
(Estimated by Amplification Rate)
Normalization by Mathematical Approach *
Gene TypeGene NameAmplicon Size (bp)[DNA] (ng/μL)CtStandard Curve **Exponential MethodSigmoidal MethodCondition for Normalization: Name and [DNA]Used Efficiency for NormalizationCV
2-delta-CtStandard CurveExponential MethodSigmoidal Method
Target genes (gene of interest) ***IMP-181880.0124.732.002.251.88proC-0.011.29241.29240.00070.0115114.4
0.121.262.251.73proC-0.11.49481.49480.00150.0832109.2
117.922.191.60proC-11.57641.57640.00600.310795.5
1015.012.051.56proC-101.63201.63200.02280.395490.8
10012.641.551.34proC-1001.03051.03050.18480.673154.9
VIM-21810.0126.171.902.042.03proC-0.010.47521.81910.00280.0006149.6
0.122.712.272.10proC-0.10.54591.75010.00040.0005143.7
119.022.121.86proC-10.73541.95090.00480.0100135.8
1015.701.871.71proC-101.01162.26340.05630.0700122.6
10012.901.501.43proC-1000.86061.66780.25150.270587.4
rpoD1780.0124.962.002.432.24proC-0.011.101.100.00010.0001115.45
0.121.892.342.08proC-0.10.970.970.00040.0011115.30
118.302.551.76proC-11.20861.20860.00030.0426111.5
1015.842.571.73proC-100.91810.91810.00030.0505109.3
10012.701.631.43proC-1000.99080.99080.09690.308177.6
braZ1841021.00-1.701.67proC-10 *0.0115-0.00700.011225.7
dhcA1801015.32-1.621.610.5905-0.31180.337437.3
gcdH1531017.00-1.711.650.1836-0.05230.097760.0
lpxA1971018.00-1.681.650.0918-0.04320.061537.5
lexA1991019.02-1.711.690.0454-0.01830.024048.9
PrtN1701023.03-1.601.570.0028-0.00930.015569.1
prtR1861014.96-1.711.670.7552-0.17020.229583.6
pyoS51701016.35-1.791.750.2888-0.03770.0555110.0
recA1971010.61-1.501.5215.4015-6.55675.956156.8
recN1551015.97-1.681.640.3750-0.12600.192755.8
rpoD1781014.69-1.791.740.9086-0.09830.1544116.9
rpoS1721017.52-1.731.730.1278-0.03360.035482.1
sulA1531015.97-1.691.650.3750-0.11930.168661.4
Reference geneproC1900.0125.102.001.661.56proC-0.0111110.0
0.121.841.631.52proC-0.111110.0
118.581.621.48proC-111110.0
1015.721.561.44proC-1011110.0
10012.681.361.30proC-10011110.0
proC *1901014.56-1.531.53proC-10 *1-110.0
Statistics by columnMin1530.0110.611.901.361.30-0.00280.91810.00010.00010.0
Max19910026.172.002.572.24-15.40152.26346.55675.9561149.6
Mean178.317.217.931.981.851.67-1.20581.33310.41800.457972.9
* Normalization was undertaken using gene proC by considering the same experiment, in which target genes were quantified at the same DNA concentration. Two independent assays for proC with [DNA] = 10 ng/μL were performed, one inside the standard curves and another with the other genes at a single concentration. ** Values with “-” indicate that no standard curve was available. *** For standard curves, a single replicate (median) is reported in the table, but all replicates were considered for the parameter estimation. Abbreviations: [DNA]: DNA concentration; CV: coefficient of variation (among values using different approaches).
Table 3. Comparison of the expected and predicted fold change among qPCR assays based on serial dilutions.
Gen[DNA] (ng/μL)Ct ValueEfficiency EstimationFold Respect to the Lower Concentration 0.01 ng/μL
Theoretical (Ideal)Standard CurveExponential MethodSigmoidal MethodExpected FoldIdeal EfficiencyStandard CurveExponential MethodSigmoidal Method
IMP-180.0124.72.002.002.251.8811111
0.121.32.002.251.731011111751
117.92.002.191.601001121124001343
1015.02.002.051.56100084184110,7547617
10012.62.001.551.3410,000435043501,927,012142,801
VIM-20.0126.22.001.902.042.0311111
0.122.72.002.272.101011915
119.02.002.121.861001429879807
1015.72.001.871.7110001418829666725,206
10012.92.001.501.4310,00098785001657,5801,072,315
proC0.0125.12.002.001.661.5611111
0.121.82.001.631.5210101087
118.62.001.621.4810092924750
1015.72.001.561.441000666666336222
10012.72.001.361.3010,0005455545574312449
rpoD0.0125.02.002.002.432.2411111
0.121.92.002.342.0810883564
118.32.002.551.7610010110115117,313
1015.82.002.571.731000556556137391,637
10012.72.001.631.4310,000491649168,432,7806,151,794
Disclaimer/Publisher’s Note: The statements, opinions and data contained in all publications are solely those of the individual author(s) and contributor(s) and not of MDPI and/or the editor(s). MDPI and/or the editor(s) disclaim responsibility for any injury to people or property resulting from any ideas, methods, instructions or products referred to in the content.

