Article

Global Chemical Characterization of Sargassum spp. Seaweeds from Different Locations on Caribbean Islands: A Screening of Organic Compounds and Heavy Metals Contents

by
Jérôme Bauta
1,†,
Elliot Calbrix
1,†,
Sophie Capblancq
1,
Christine Cecutti
1,
Jérôme Peydecastaing
1,
Christine Delgado Raynaud
1,2,
Antoine Rouilly
1,
Valérie Simon
1,*,
Guadalupe Vaca-Medina
1,
Virginie Vandenbossche
1,
Emeline Vedrenne
1 and
Pascale De Caro
1
1
Laboratoire de Chimie Agro-Industrielle (LCA), Université de Toulouse, INRAE, 4 allée Emile Monso, 31030 Toulouse, France
2
Centre d’Application et de Traitement des Agro-Ressources (CATAR), Toulouse-INP, 4 allée Emile Monso, 31030 Toulouse, France
*
Author to whom correspondence should be addressed.
These authors contributed equally to this work.
Phycology 2024, 4(2), 190-212; https://doi.org/10.3390/phycology4020011
Submission received: 8 March 2024 / Revised: 5 April 2024 / Accepted: 11 April 2024 / Published: 13 April 2024
(This article belongs to the Collection Sargassum Golden Tides, a Global Problem)

Abstract

:
Large-scale strandings of Sargassum spp. seaweeds occur annually on the beaches of the Caribbean islands and cause major environmental, health, and economic problems. In order to support an approach of valorisation of algae, an exhaustive characterisation of the composition of these seaweeds has been performed by analysing the contents in alginates, structural carbohydrates (fucans and glucans), minerals, proteins, lipids, mannitol, polyphenols, and heavy metals. Nine batches were collected at different harvesting sites over the years 2021 and 2022, to estimate the spatial and temporal variation in Sargassum composition. A batch of floats was harvested and analysed to estimate the differences in composition between floats and whole algae. Samples collected during the same year (floats or entire plant, freshly collected or stored) showed no significant differences in composition. However, slight differences were observed between batches collected in the two years. Some samples showed significant amounts of heavy metals, especially arsenic. A detailed structural carbohydrates analysis was carried out and discussed with literature data. As the nitrogen content of algae is an interesting parameter for food or agronomic uses, protein analysis enabled us to calculate a new nitrogen–protein conversion factor, specific to these algae species.

1. Introduction

Sargassum fluitans (Børgesen) Børgesen and natans (Linnaeus) Gaillon seaweeds were first observed in the 16th century by explorers during their journey to discover the “New world” [1]. These brown algae belong to the order Fucales and the family Sargassaceae. They are pelagic, meaning that these seaweeds are never bound to the seabed, but float on the ocean surface all along their life, and are displaced by ocean currents [2]. This particularity allows Sargassum to develop on the high seas, where few algae can grow. Initially living in the Sargasso sea off the American coast, circular marine currents probably held Sargassum algae in place [3]. However, since 2011, huge Sargassum strandings have been observed every year on the coasts of the Gulf of Mexico. They have especially been sighted off the coast of Brazil, where their growth is favoured by the ideal climatic conditions and the high concentration of micronutrients [4,5]. The global context of ocean acidification could also contribute to their development [6]. These seaweeds grow each year from April onwards and are then transported by ocean currents along the coast to the Caribbean Sea. Thus, massive amounts of pelagic Sargassum algae regularly invade the Caribbean coasts including Guadeloupe and the Dominican Republic. Unfortunately, there are no signs of this phenomenon abating anytime soon [7,8]. The agglomeration of these seaweeds on the coasts forms vast expanses several hundred meters long and a few tens of centimetres high. The presence of massive Sargassum mats on the Caribbean coasts has major environmental impacts, including the darkening of the coastal seabed and the death of seaweeds and coral reefs attached to it. Local economies, which are heavily dependent on revenues from tourism, shipping, and fishing [9,10,11], are greatly destabilised by such massive Sargassum strandings. A report from the French Agency for Food, Environmental, and Occupational Health & Safety (ANSES) estimates that fishing vessels are deprived of an average of 22 days of sea trips each year. As for tourism, hotels estimate a loss of 40% to 50% of their turnover since the stranding of the Sargassum [12]. Furthermore, because of the accumulation of thick beds of algae on the beaches, without contact with air, Sargassum seaweeds decompose mostly anaerobically releasing toxic gases such as hydrogen sulphide and ammonia. This leads to highly unpleasant smells, which in high concentrations, can result in health problems (fainting, nausea, headache) [13,14].
To deal with this invasion of seaweed strandings, local authorities have been forced to collect Sargassum every year and transport it to spreading zones where it can be fully decomposed and absorbed by soils. Actions have been taken to mitigate adverse effects and efforts have been made to develop forecasting models to predict seasonal Sargassum events in the tropical Atlantic [15], all of which have helped to better manage Sargassum deposits.
Since no solution has been found to avoid seaweed strandings, inhabitants have had to harvest Sargassum each year. This means that finding a way to exploit this freely available and abundant biomass is an important challenge to the local population in the Caribbean. Opportunities in this direction have been identified with the valorisation of Sargassum compounds: some examples are alginates and cellulose as texturing agents for the food industry [16,17]; fucoidans as an immunostimulant [18]; and mannitol and polyphenols in cosmetics for their hydrating and antioxidant properties [19]. Whole Sargassum has been used in animal feed, as bio-based materials, or in civil construction [17,20,21,22,23]. Some studies have shown that for other species of Sargassum (Sargassum linearifolium or fusiforme for example), extracts can have antimicrobial, antioxidant, or antitumor effects [24,25]. Hydrochars from Sargassum muticum could also be used for the recovery of water pollutants [26].
To realize these applications, it is necessary to precisely determine the chemical composition of the seaweeds before developing a local economy based on Sargassum biorefinery. Particular attention must be paid to the composition variation between different harvest zones and years to ensure the economic viability of any valorisation project in the long term. In this context, this study proposes a new analytical approach to investigate the spatial and inter-annual variability in the composition of stranded Sargassum. Several studies have already analysed some chemical compounds from Sargassum spp., usually harvested over a period of one to several years [27,28,29,30]. The originality of this work lies in the comprehensive analysis of all the main families of organic compounds and heavy metals in Sargassum spp. seaweeds. This study may help to identify future sustainable uses for the different molecules isolated from Sargassum.

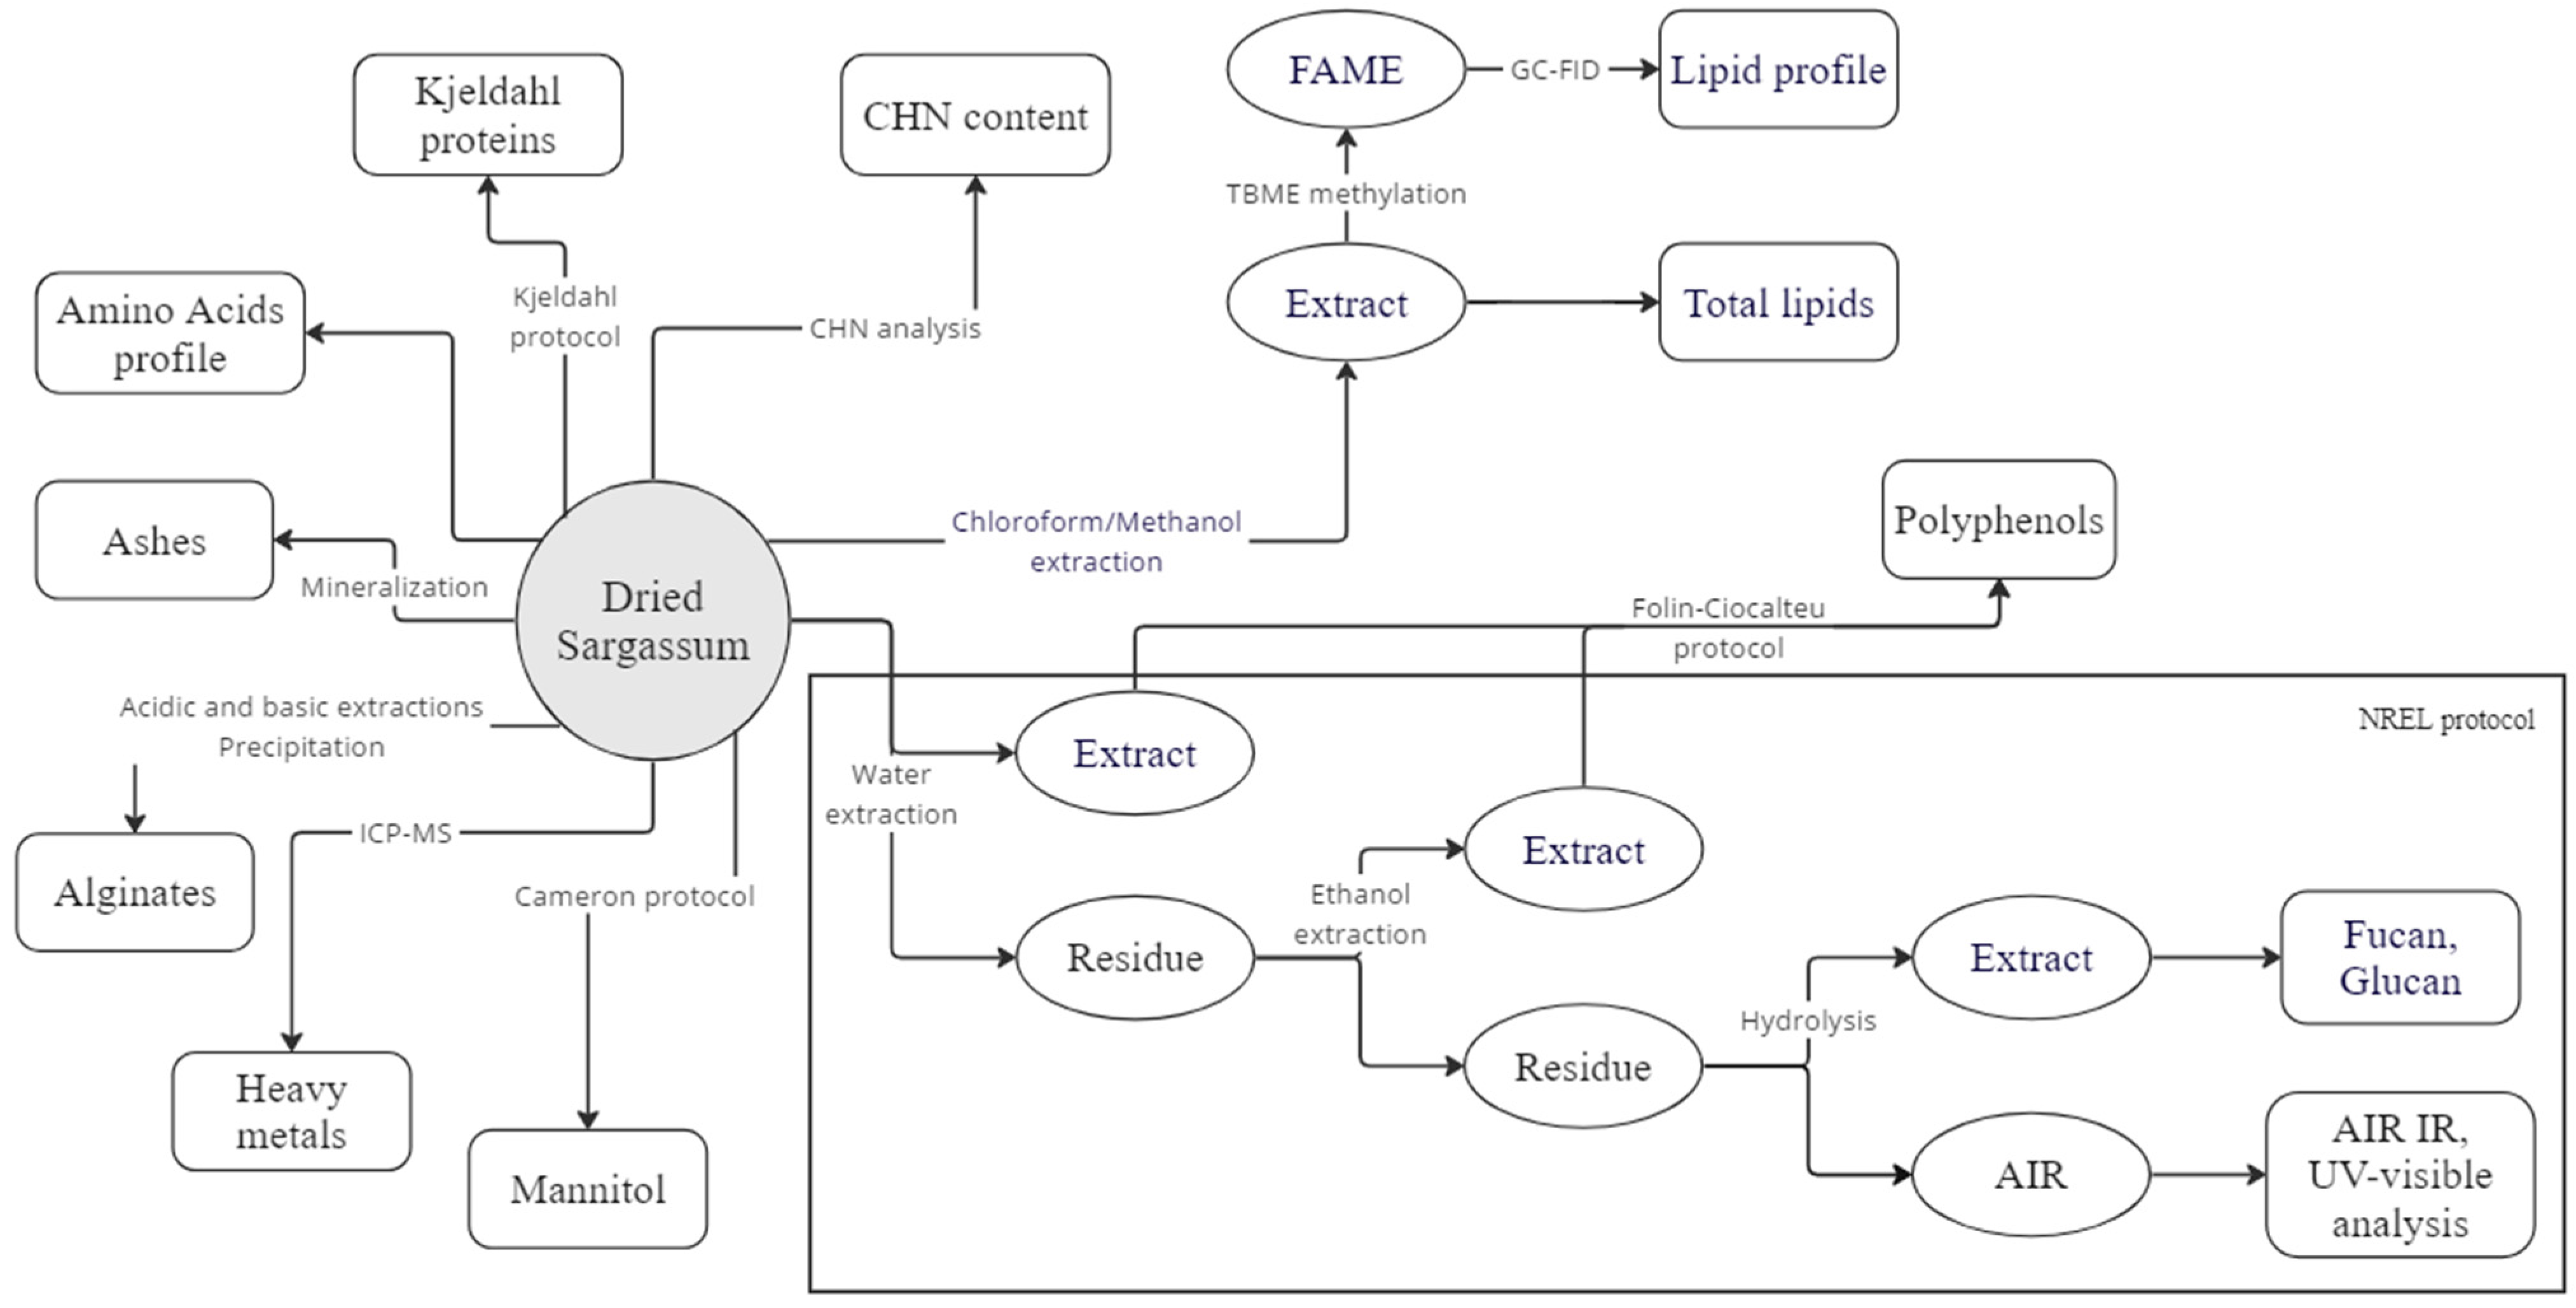
2. Materials and Methods

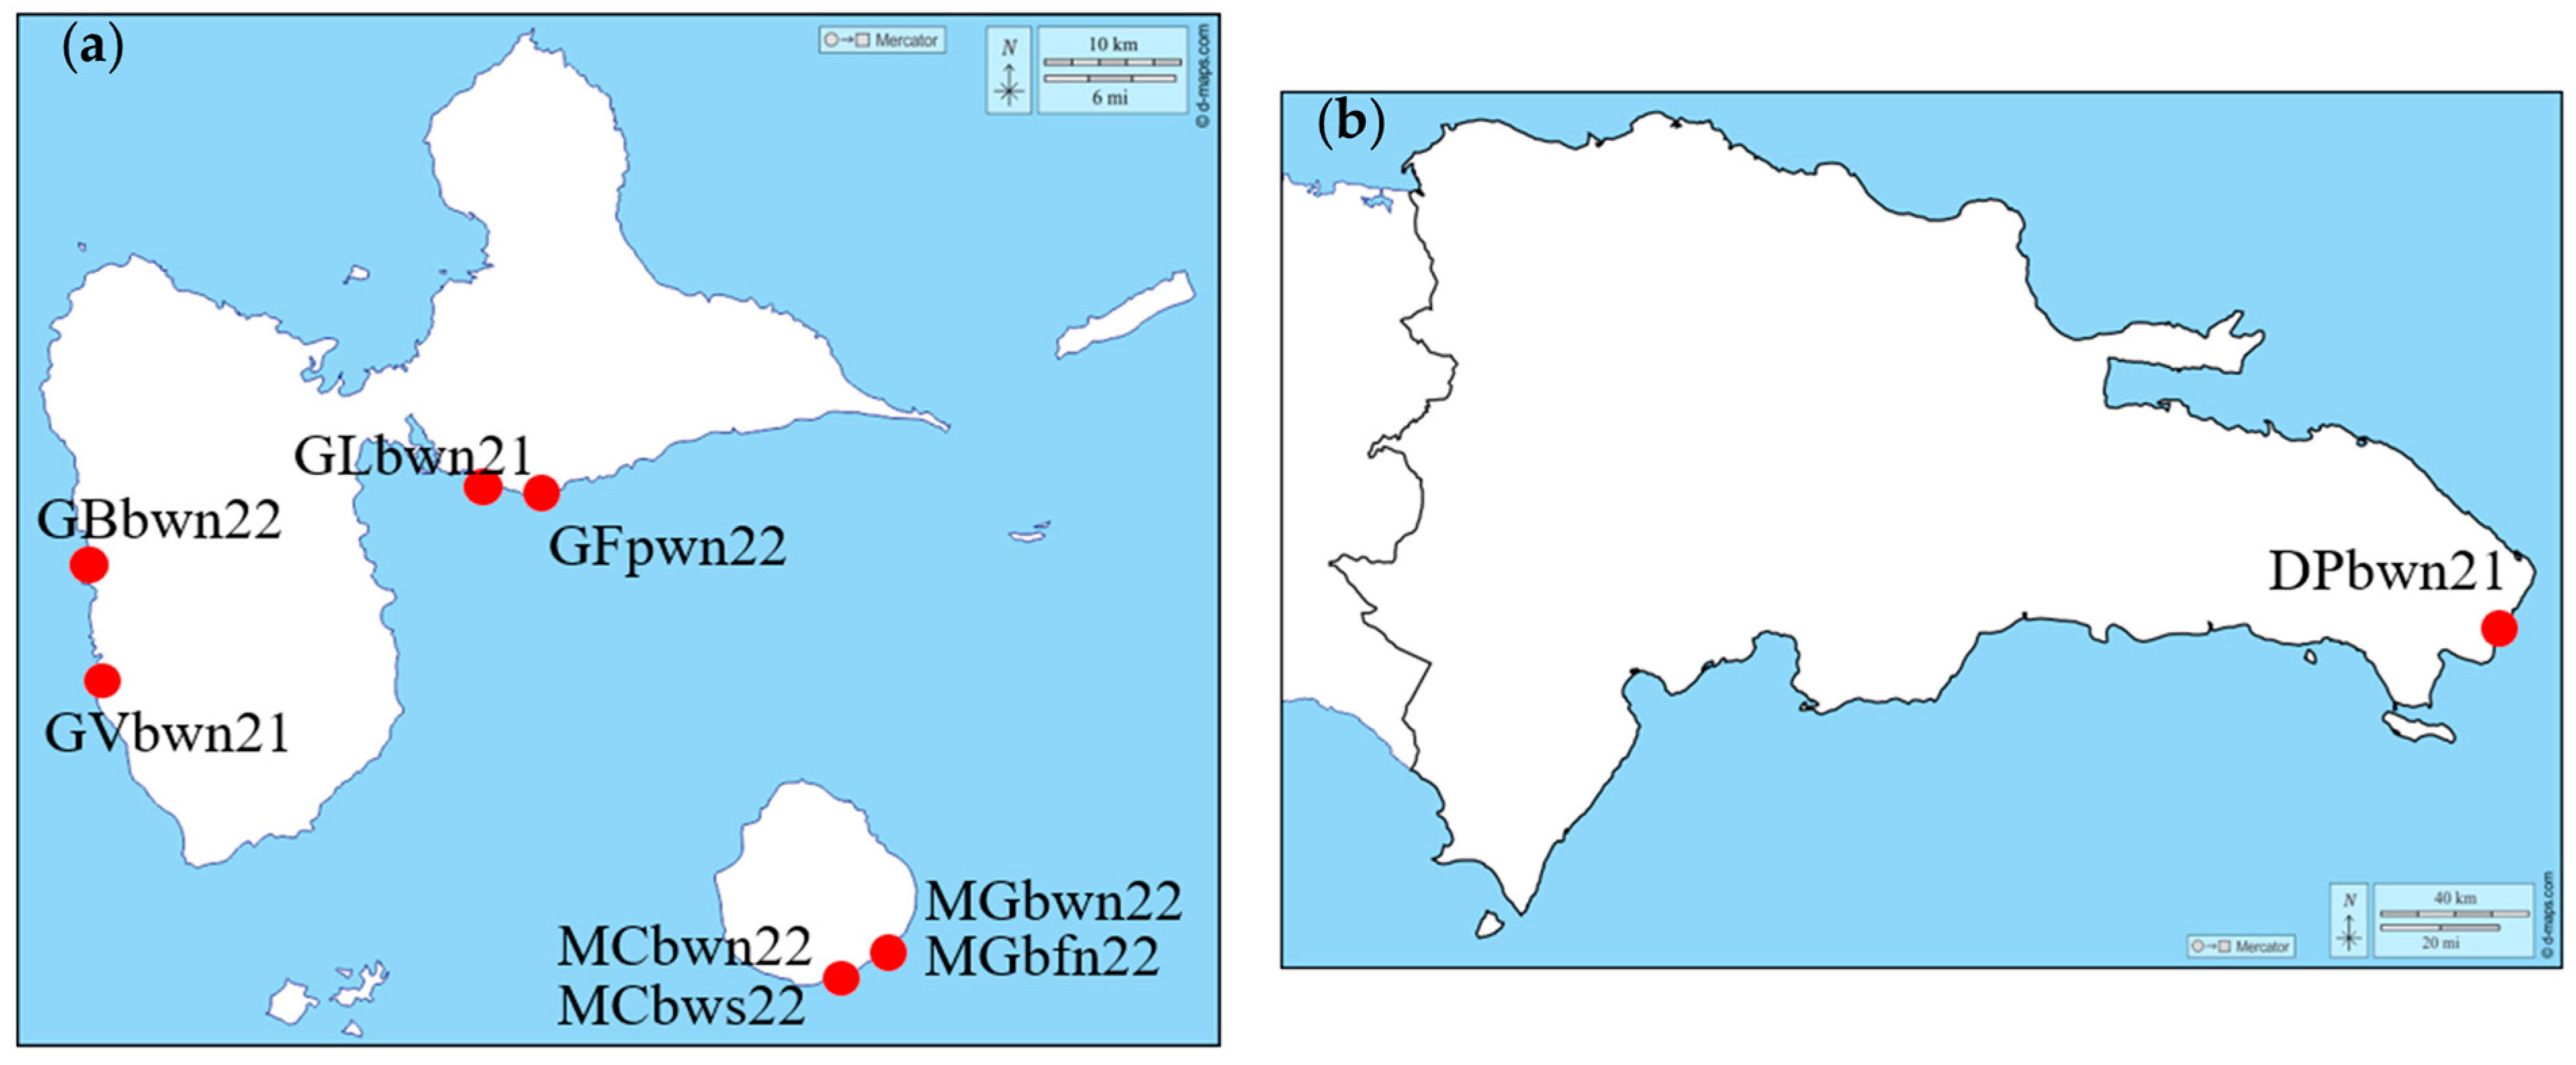
2.1. Sargassum Sampling

Nine batches of Sargassum harvested during two different years and in 7 different locations (6 beaches and one port) were studied. The samples were composed of a mix of the three morphotypes Sargassum natans I, natans VIII, and fluitans III, which were not separated due to the harvesting method [12]. Almost all the batches were collected during the summer, which is the period of high seaweed stranding. The different harvesting locations on the same or a nearby island allowed us to check the consistency in the algae composition of each of the samples from the same location. The batches of Sargassum spp. were collected at different sites in Guadeloupe (Figure 1a) or Dominican Republic (Figure 1b) from June 2021 to July 2022 during different seasons (Table 1).
The letters used to name the batches describe the harvest location and harvest conditions, the plant part studied and the conditions of storage, followed by the harvest year. Sargassum was collected on different beaches in Guadeloupe (Gosier, Vieux Habitants, Bouillante, Plage des galets, Capesterre) and in the Dominican Republic (Punta Cana) allowing us to investigate the impact of the geographical zone of stranding. A batch was collected in a seaport (Saint Felix) to investigate the impact of human pollution on Sargassum composition. The impact of Sargassum storage was explored by comparing fresh Sargassum to that stored for one month in an open area under sunlight in Capesterre. The composition of floats was also investigated by comparing the whole Sargassum to floats from the “Plage des galets”.
All the batches were washed with 30 times their volume of fresh water to remove sand, dirt, and sea salt. The samples were then roughly dried under sunlight to prevent decomposition during shipping. All further analyses were performed on these dry samples.
In this study, a general analysis scheme was developed. Figure 2 shows the different analysis protocols for the 9 batches of Sargassum covering a wide range of analytical techniques. This analysis protocol has been designed to answer a number of questions, such as the presence or absence of lignin, as reported in several previous studies, and the correct nitrogen/protein conversion factor to be used in the study of Sargassum.

2.2. Grinding/Screening

The raw biomass was ground using an MF 10 Basic grinder (4000 rpm, grid: 500 µm) (IKA-Werke, Staufen im Breisgau, Germany). The ground Sargassum samples were then sieved (AS 200 Basic sieve shaker, Retsch, Haan, Germany) for 10 min with two sieves with mesh sizes of 800 and 200 µm. The fraction between 200 and 800 µm was collected for further analysis, in accordance with the Sluiter procedure for carbohydrate analysis [31]. One part of the sample was ground again, sieved with a 100 µm mesh size sieve, and stored for mannitol analysis according to the protocol described by Cameron et al. and Zubia et al. [19,32].

2.3. Moisture

Moisture content was determined following the French Standards NF EN ISO 18134-2 procedure [33]. Sargassum samples were dried in an oven at 105 ± 2 °C in an air atmosphere to a constant weight and the percentage of moisture was calculated from the mass loss. Dried samples were stored in a desiccator for further analysis. All the results were adjusted for moisture content and most results are expressed in percentage of the dried weight (%DW).

2.4. Ash

Ash contents were determined following the French Standards NF EN ISO 18122 method [34]. Dried Sargassum samples were calcinated in an oven at 575 ± 10 °C for 8 h. The ash content was then calculated by subtracting the mass loss.

2.5. Carbon, Hydrogen and Nitrogen (CHN)Analysis

Carbon, hydrogen, and nitrogen contents of each Sargassum batch were determined at the Laboratoire de Chimie de Coordination (LCC, Toulouse, France) using a 2400 series II flash combustion analyser (Perkin Elmer, Waltham, MA, USA). Each analysis was performed in duplicate on 10 mg samples.

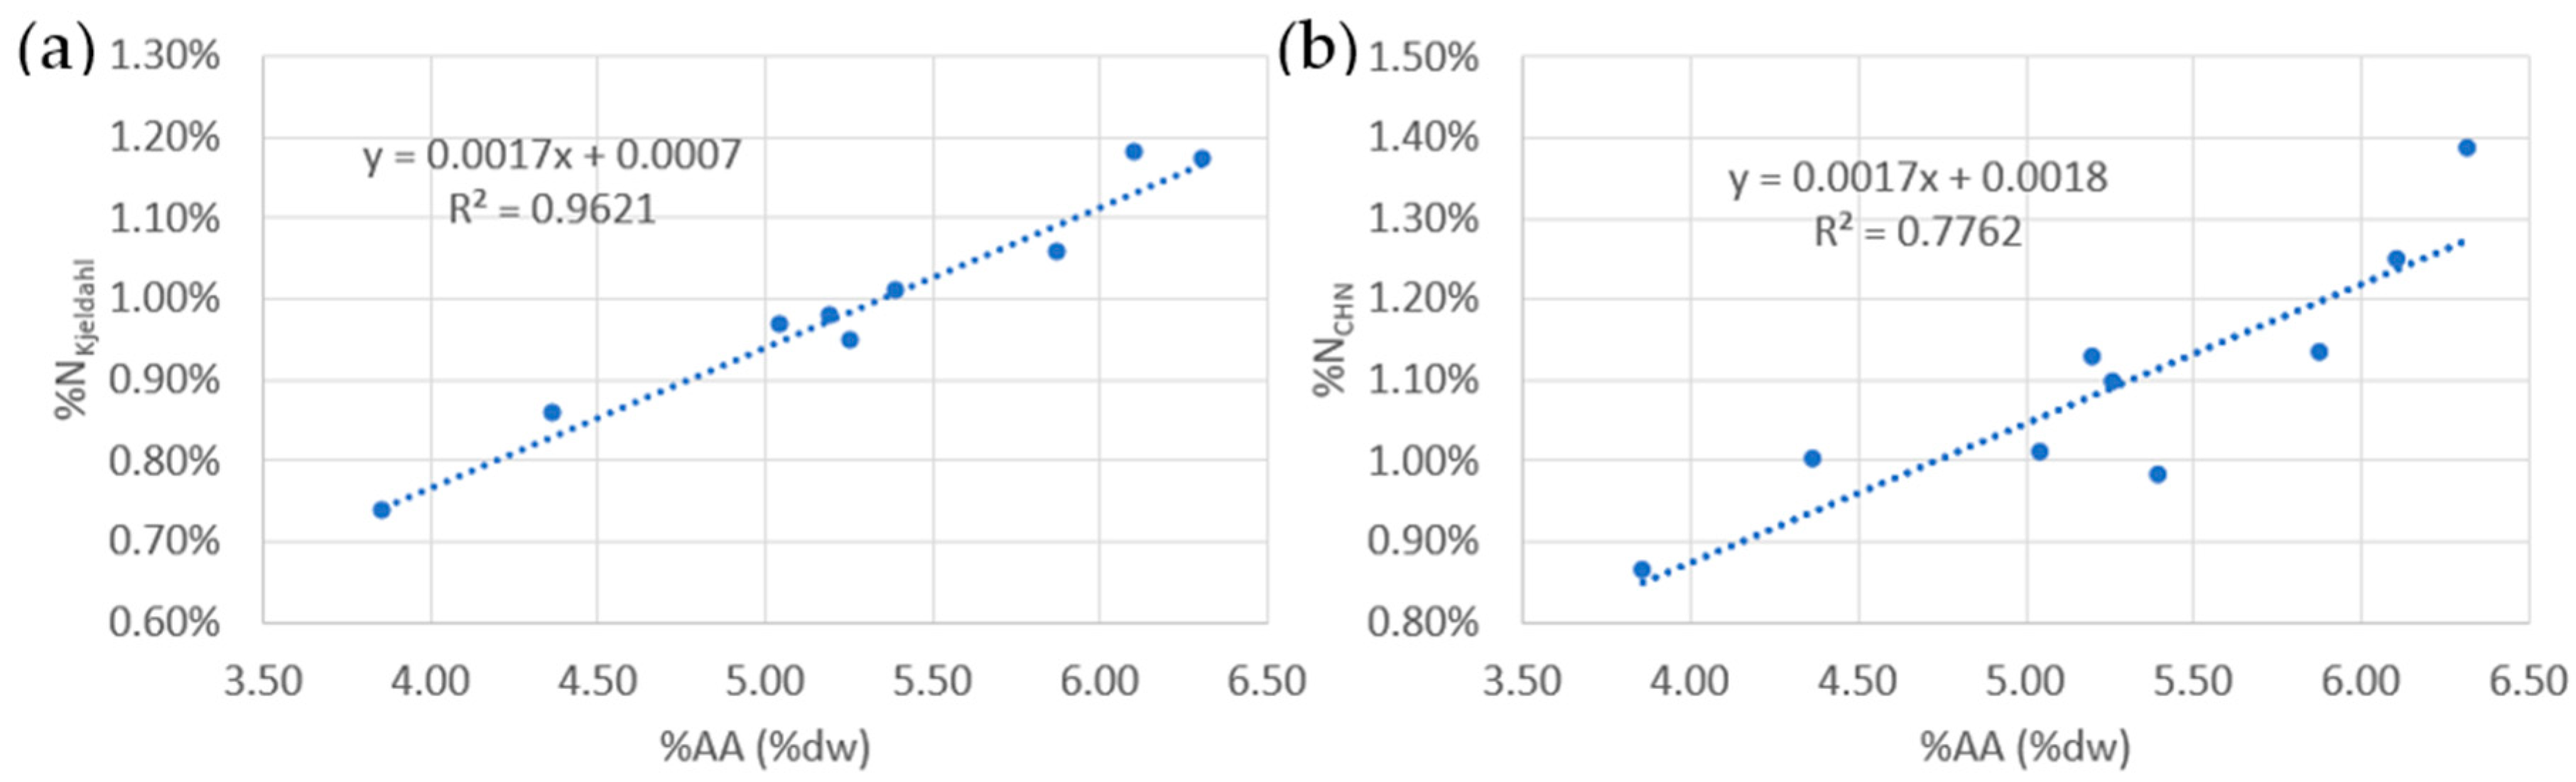
2.6. Proteins Analysis

2.6.1. Total Protein Content
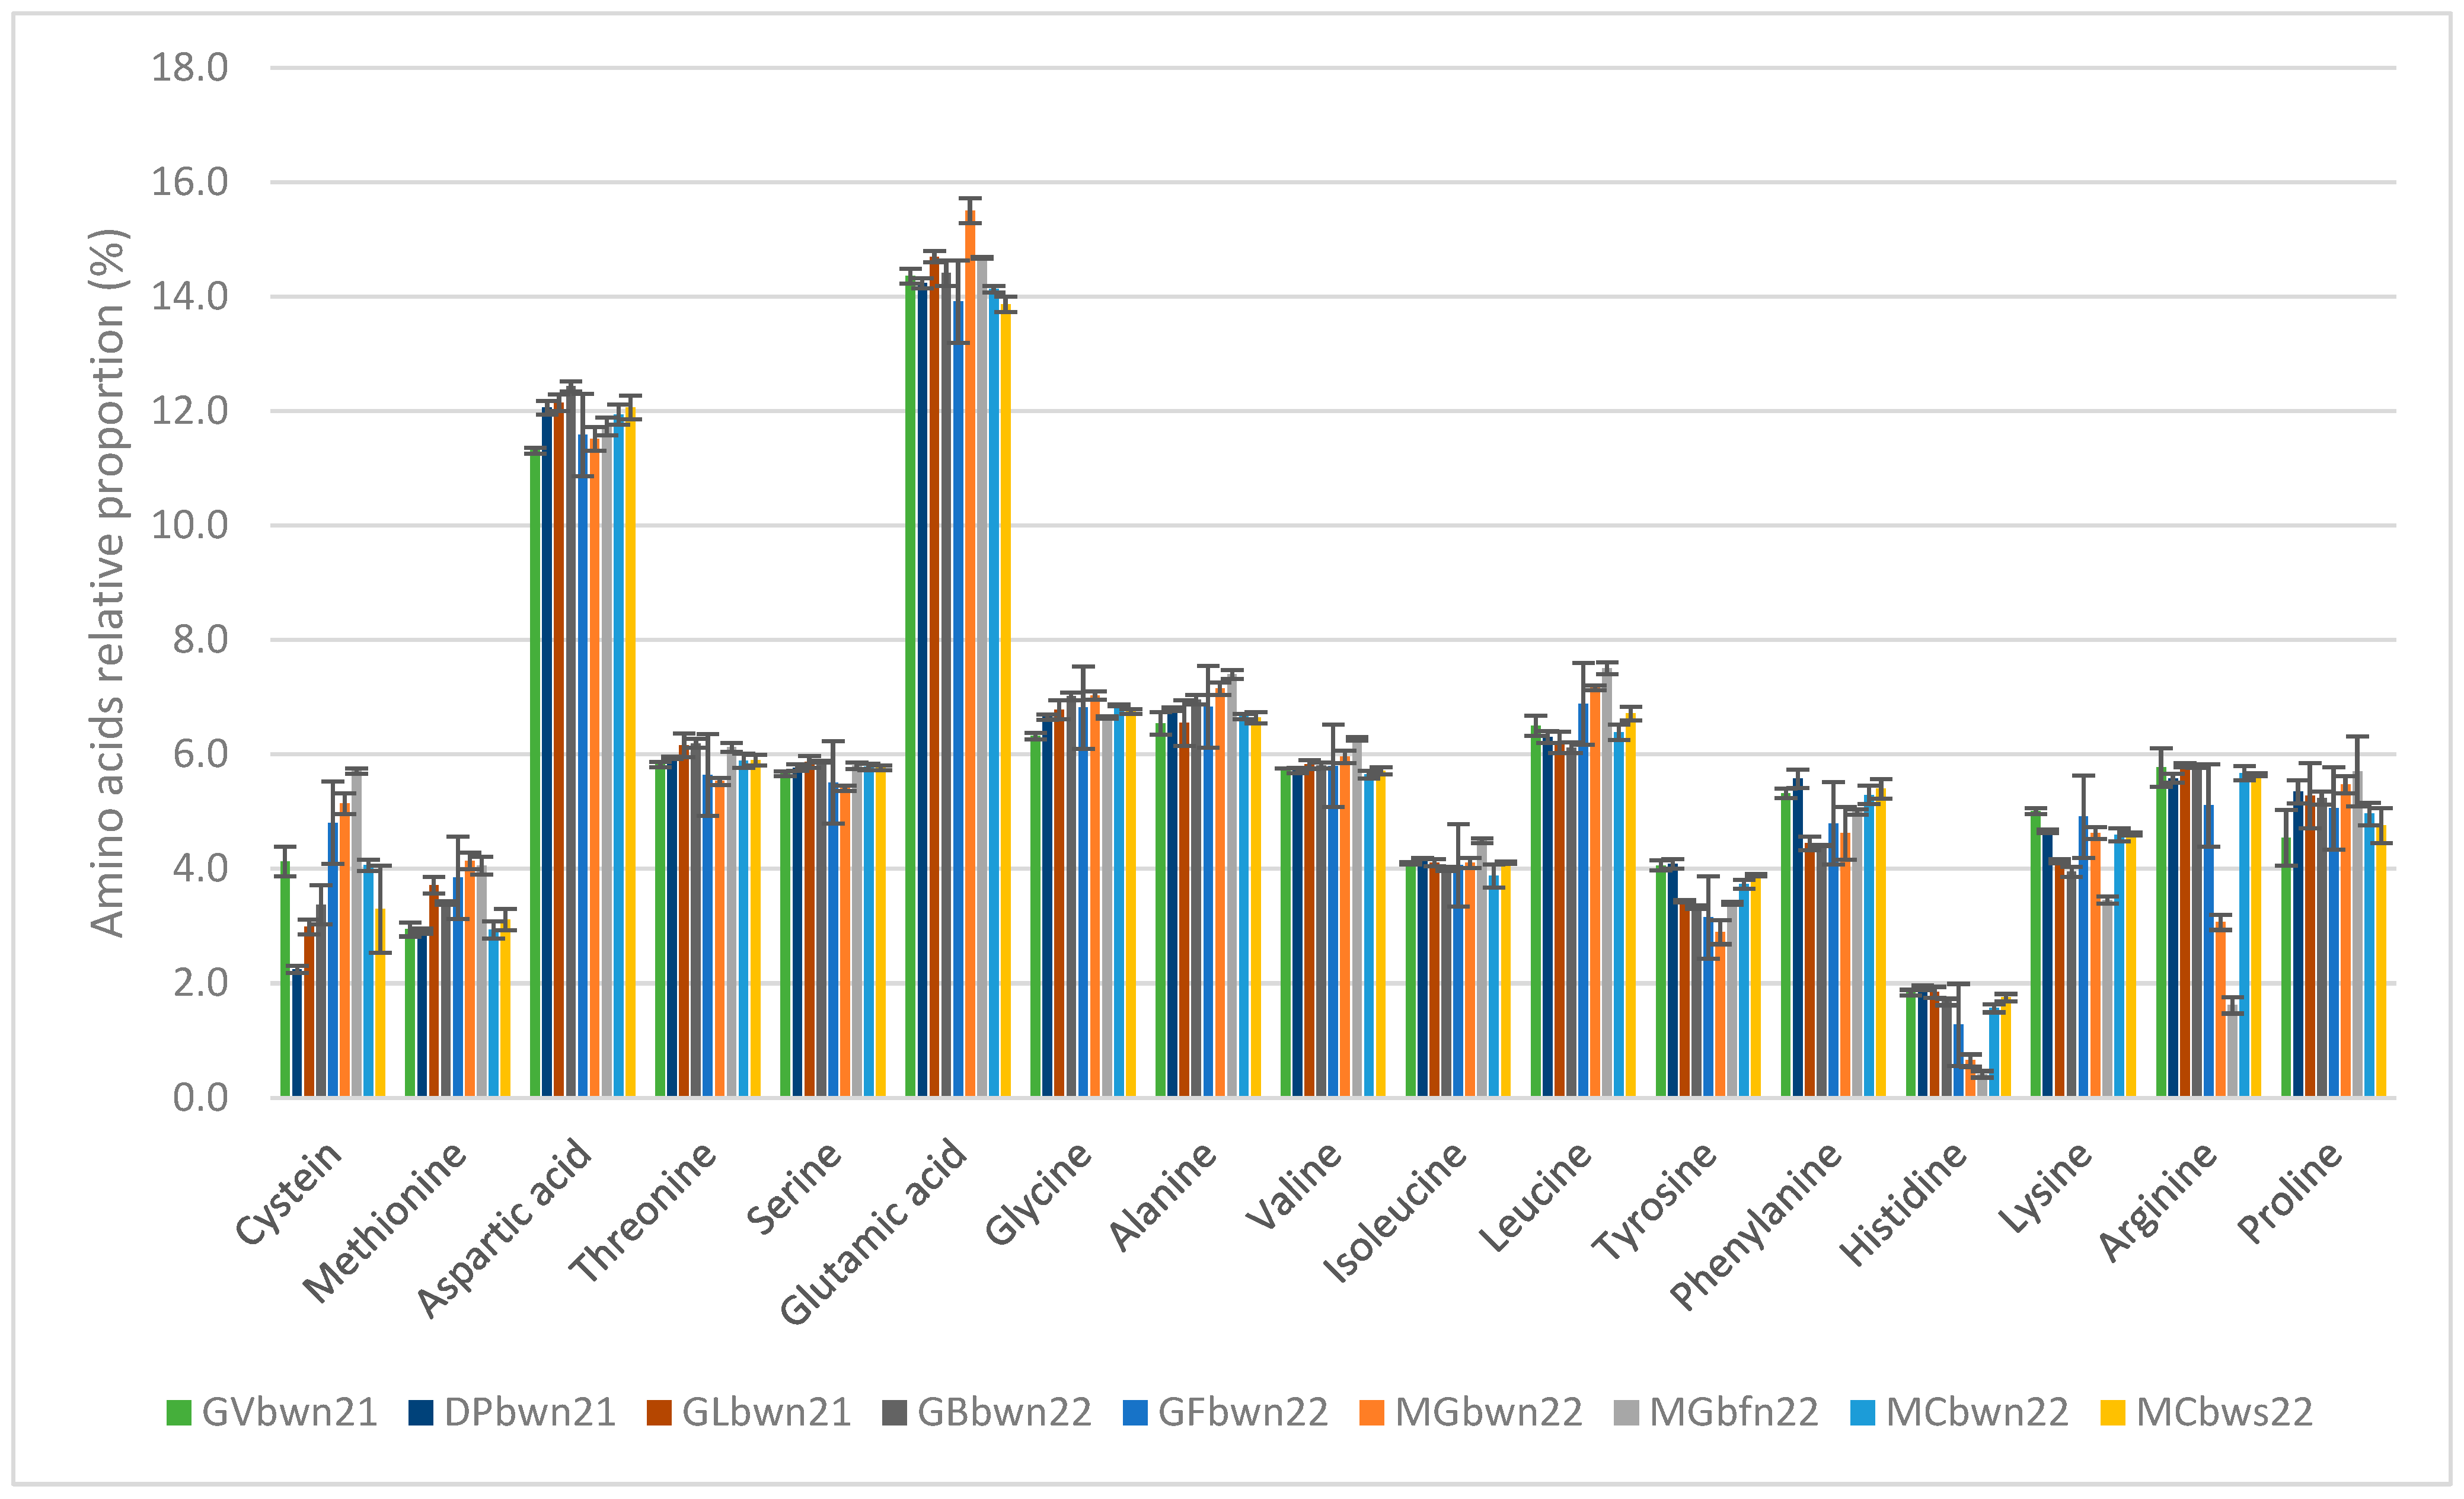
The protein content was determined by nitrogen titration, according to the French Standards NF EN ISO 3188 (Kjeldahl method) [35]. Ground and sieved Sargassum samples (1 g) were mineralised in 12.5 mL of sulfuric acid (96%) at 400 °C for 1 h in the presence of copper and potassium sulphate catalysts (K2SO4, CuSO4). The generated ammonium ions were titrated using a Kjeltec 8400 analyser unit (FOSS, Hillerød, Denmark) and converted into ammonia by adding NaOH (40%) solution. Ammonia was then distilled by steam distillation, collected in a boric acid solution (1%), and titrated against HCl (0.200 N) with methyl red and bromocresol green indicator. The Kjeldahl nitrogen content (%NKjeldahl) was calculated from the following formula (Equation (1)):
% N Kjeldahl = 100 × V HCl V Blank × C HCl × M N m sample ( 100 % moisture )
where VHCl is the equivalent volume of HCl injected during titration, CHCl is the concentration of HCl, MN is the molar mass of nitrogen, msample is the mass of the sample, and %moisture is the moisture content of each sample. The Kjeldahl protein content is obtained by multiplying the organic nitrogen content by the factor 6.54, as explained in Section 4.2.

2.6.2. Amino Acids

Total Amino acid contents were determined following the Commission Directive 9864EC of 3 September 1998 [36]. Crude Sargassum samples (msample = 0.250 g) were hydrolysed in an acidic solution (HCl, 6 N) of phenol (1 g·L−1) at 103 °C for 23 h. The pH of the solution was then adjusted to 2.20 by adding NaOH (1 M and 7 M) and the volume was made up to Vsample = 100 mL by adding a buffer. After filtration (PTFE filter; 0.45 μm), the sample was analysed by HPLC (Biochrom 20+ amino-acid analyser, Biochrom Ltd., Cambridge, UK) equipped with a PEEK 200 × 4.6 mm column (8–9 µm cationic sulphonated polystyrene beads) and a precolumn system (10 cm) packed with a sodium-based cation exchange resin. The different amino acids were titrated after reacting with ninhydrin and detected by photometry: at 440 nm for proline and 570 nm for the other amino acids.
Prior to hydrolysis, cystein and methionin were oxidised by an aqueous solution of phenol (1 g·L−1) and performic acid for 24 h at 0 °C to form cysteic acid and methionine sulphone. The unreacted oxidant was then decomposed by adding an excess of sodium metabisulphite. Then cysteic acid and methionine sulphone were hydrolysed and analysed as previously described.
The concentration of each amino acid (CAA) was determined for each using a standard range. The amino acid content was then calculated using the following formula (Equation (2)):
% A A = 100 × C A A × V s a m p l e M A A M H 2 O × m s a m p l e × ( 100 % m o i s t u r e )
where MAA is the molecular weight of the amino acid, MH2O is the molecular weight of water, and %moisture is the moisture content of the sample.
The molecular weight of water was subtracted from each amino acid’s molecular weight to compensate for the addition of water during hydrolysis.
The nitrogen content of the amino acid was calculated using the following formula (Equation (3)):
% N A A = 100 × i n i M N × % A A i ( M A A i M H 2 O ) % A A
where ni is the number of nitrogen atoms in the amino acid and MN is the atomic weight of nitrogen.

2.7. Lipids Analysis

2.7.1. Total Lipid Content

The total lipid content was determined by the Folch method [37]. Lipids from Sargassum samples were extracted twice with CHCl3/MeOH (seaweed/solvent ratio: 1/10 w/v) in 2:1 v/v. The extract was then de-mixed by adding NaCl (5%) solution (1:5 v/v) and the organic layer (lower phase) was collected. All the volatile molecules present were then removed by vacuum treatment to obtain the lipid extract. Lipid yields were determined gravimetrically. Extract samples were stored at 4 °C in sealed glass containers for further experiments.

2.7.2. Fatty Acids Profile

The fatty acid composition was determined from the obtained total lipid extract using the Folch method as described in Section 2.7.1. To each lipid extract sample, 50 µL of pentadecanoic acid (C = 10.05 mg·mL−1) was added as an internal standard for FAME (Fatty Acid Methyl Esters) quantification. The extract was then dissolved in methyl tert-butyl ether (MTBE) and derivatised following the French Standard NF EN ISO 12966-3 procedure [38]. Fatty acids were transformed into the corresponding methyl esters by trimethyl sulfonium hydroxide (TMSH, 2M) in methanol (MeOH). Samples were analysed using GC 3900 gas chromatography/flame ionisation detection (GC/FID) (Varian Medical Systems, Palo Alto, CA, USA) with a column (WCOT- silica fused CP-Select CB for FAME, Agilent, dimensions 50 m, 0.25 mm, 0.25 μm). The injector was maintained at 250 °C and the oven was programmed to 185 °C for 30 min, followed by heating to 250 °C at the heating rate of 15 °C·min−1 and held for 10 min. The carrier gas was helium with a flow rate of 1.2 mL·min−1 inside the column. The injected volume was 1 µL with a split mode of 1:100. FAME was identified by comparing with a mixture of standards (Supelco 37 Component FAME Mix, Sigma Aldrich, Saint-Louis, MO, USA). Results were expressed quantitatively as pentadecanoic acid equivalents, which were then used to calculate the fatty acid content in the dry seaweeds, as well as their proportion in the lipid extracts.

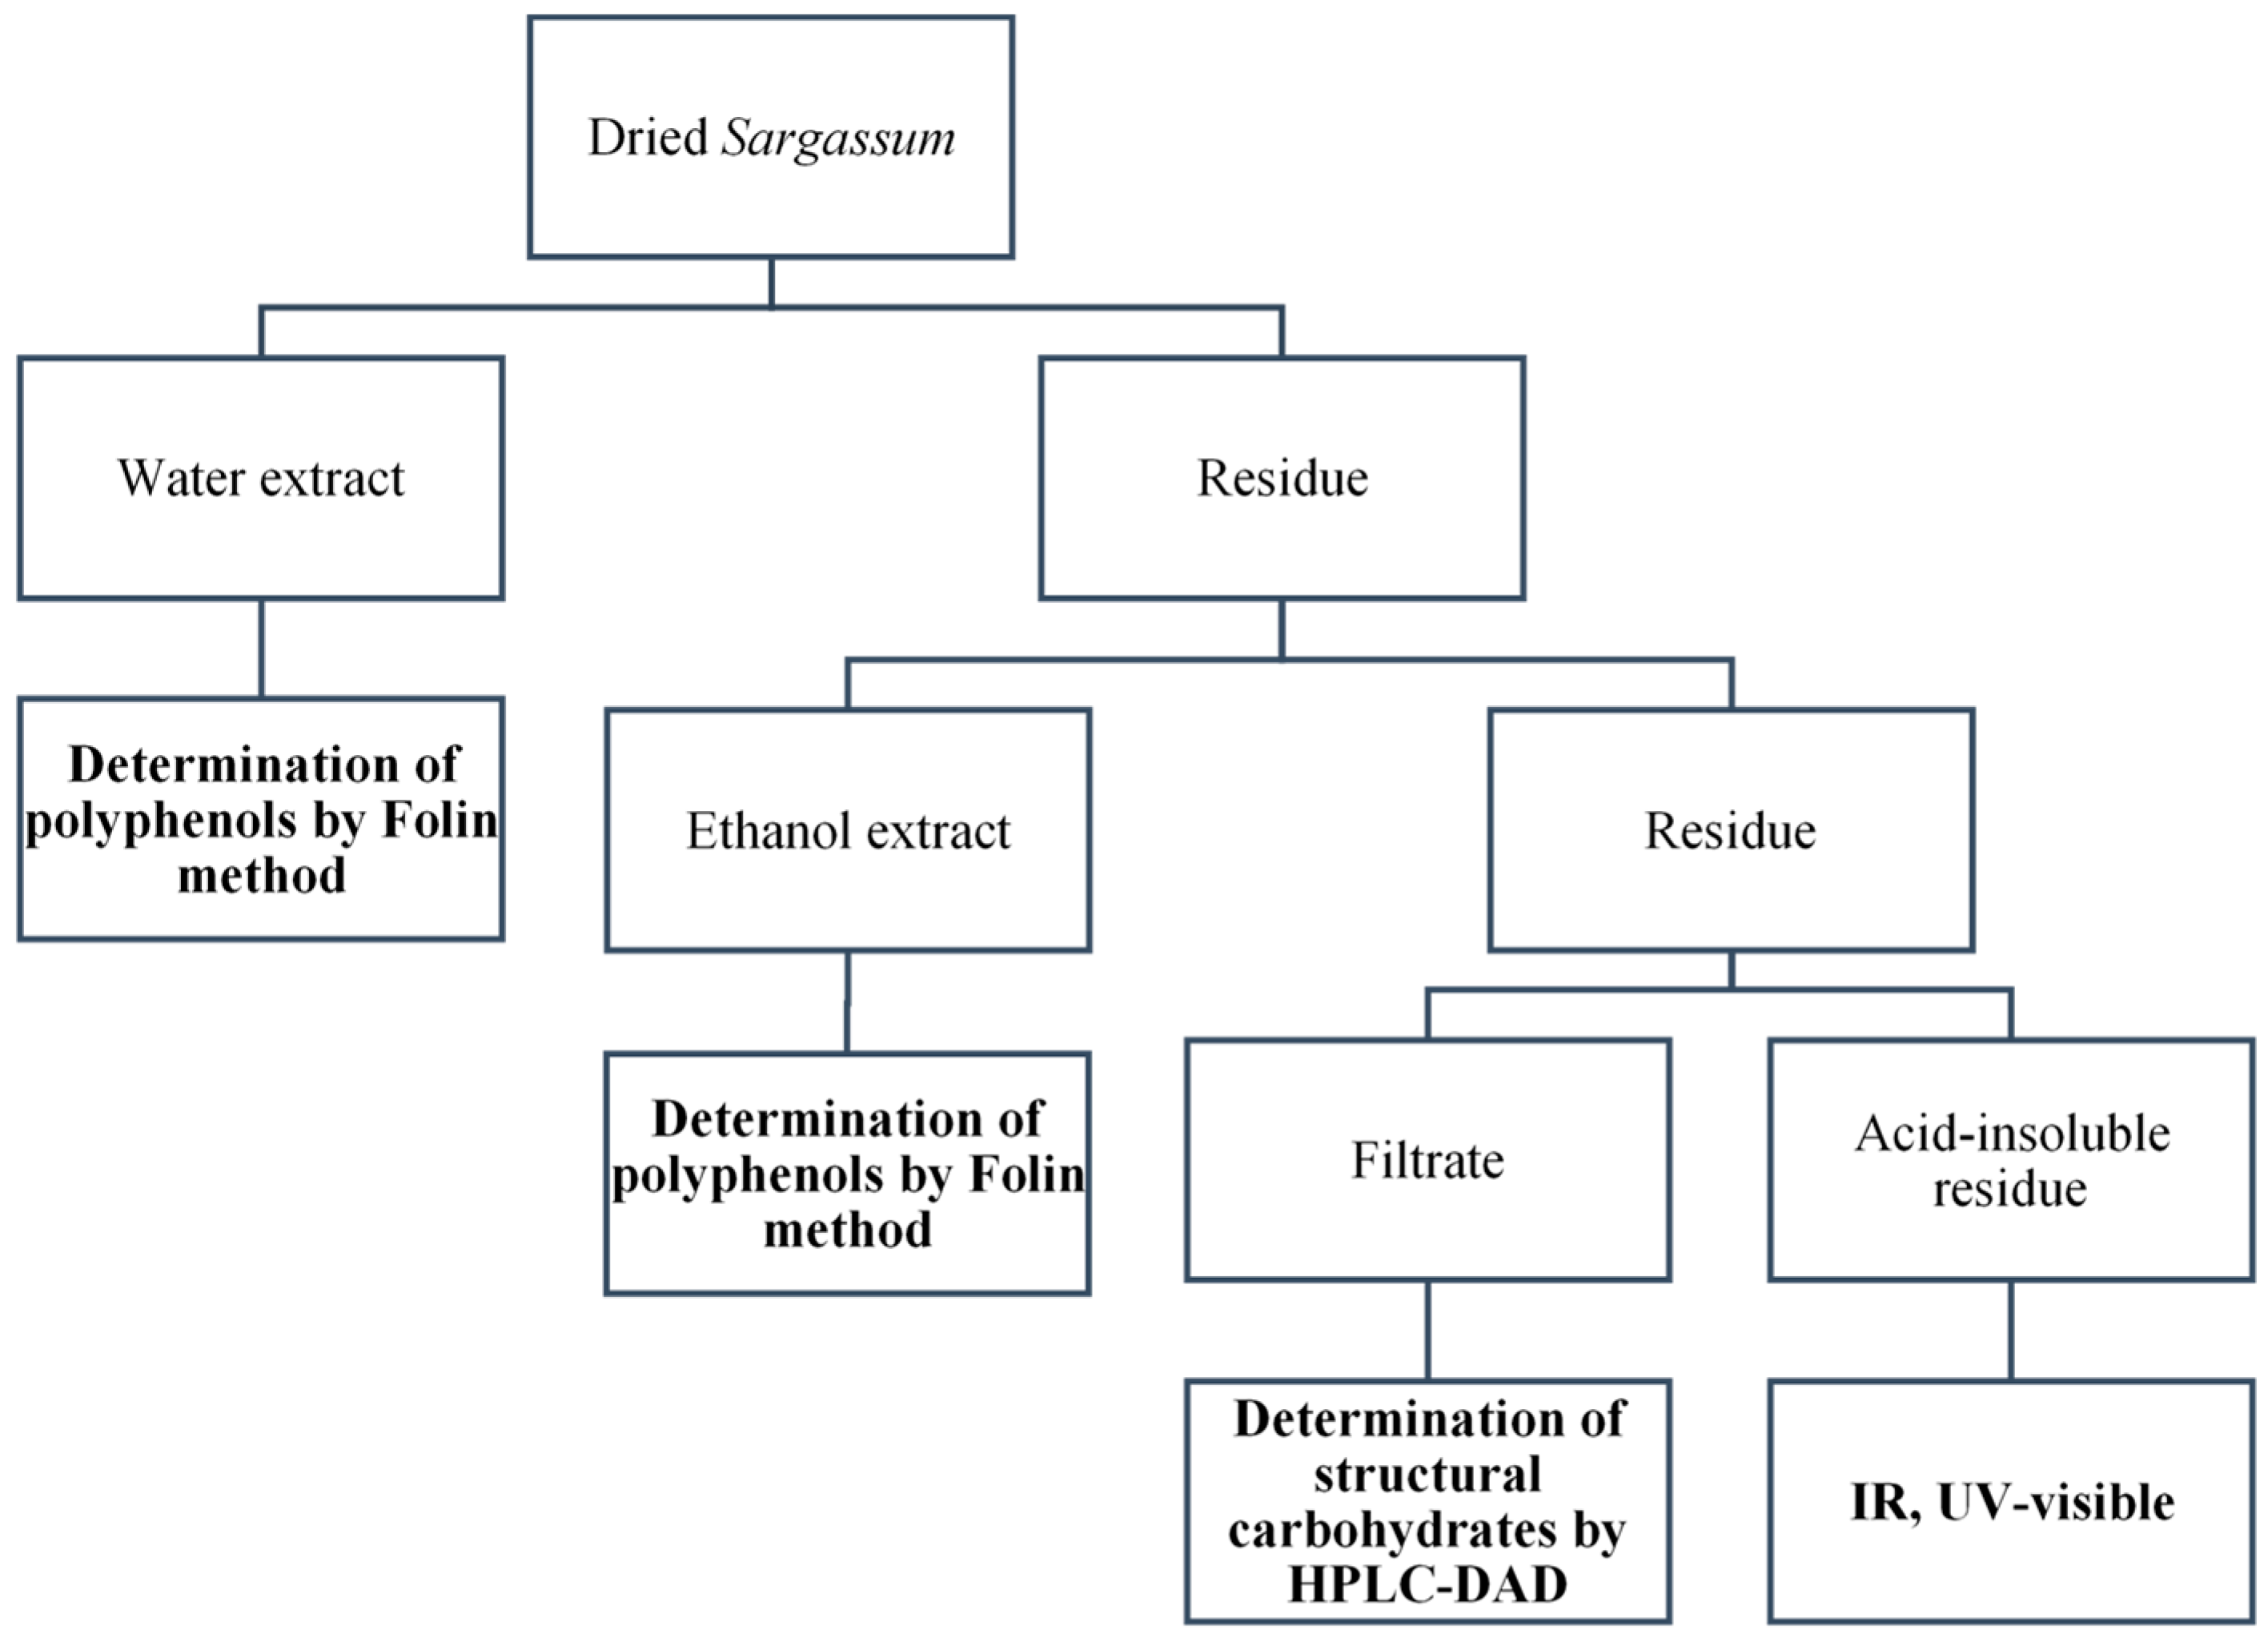
2.8. Structural Carbohydrates

2.8.1. Glucan, Fucan

Structural carbohydrate content was determined following the Sluiter procedure (or NREL (National Renewable Energy Laboratory) protocol) [31]. Starting from ground and sieved Sargassum, the extractable compounds were first removed using the Fibertech 1020 (FOSS A/S, Hillerød, Denmark) extraction system. Two extractions were performed, first with boiling deionised water and then with boiling ethanol (technical grade, 96%), both for 1 h (Figure 3). Extracts were stored at −20 °C for further analysis. The solid residue obtained at the end of the extraction was dried at 60 °C. A known weight (300 mg) of the solid residue was added into 4.92 g (3.00 mL) of H2SO4 (72%) at 30 °C and stirred manually every five minutes using a PTFE rod for 1 h. The concentration of H2SO4 was then lowered to 4% by adding 84.00 mL of water. The mixture was heated at 121 °C in an autoclave for 1 h. The resulting solution was filtered, whereupon, an acid-insoluble residue (AIR) and a filtrate were obtained. The latter was neutralised to pH 5–6 by adding solid CaCO3 followed by filtration through a 0.22 µm cellulose filter to remove CaSO4 precipitate. Structural carbohydrates were measured in the filtrate by HPIC: HPIC ICS 3000 Dionex chromatograph with a Carbopac PA1 column (D = 4 mm; L = 250 mm) and a Dionex PAD detector (Dionex Corporation, Sunnyvale, CA, USA). The mobile phase was an aqueous solution of NaOH (1 mM) and the flow rate was 1.0 mL·min−1. Standard curves for each carbohydrate were prepared using glucose–fucose mixture solutions in two concentration ranges of 0.10–1.00 g·L−1 and 0.50–5.00 g·L−1. The glucan and fucan contents were calculated by multiplying the glucose and fucose content by 0.90 and 0.89, respectively, to compensate for the addition of one molecule of water during the hydrolysis step [31].

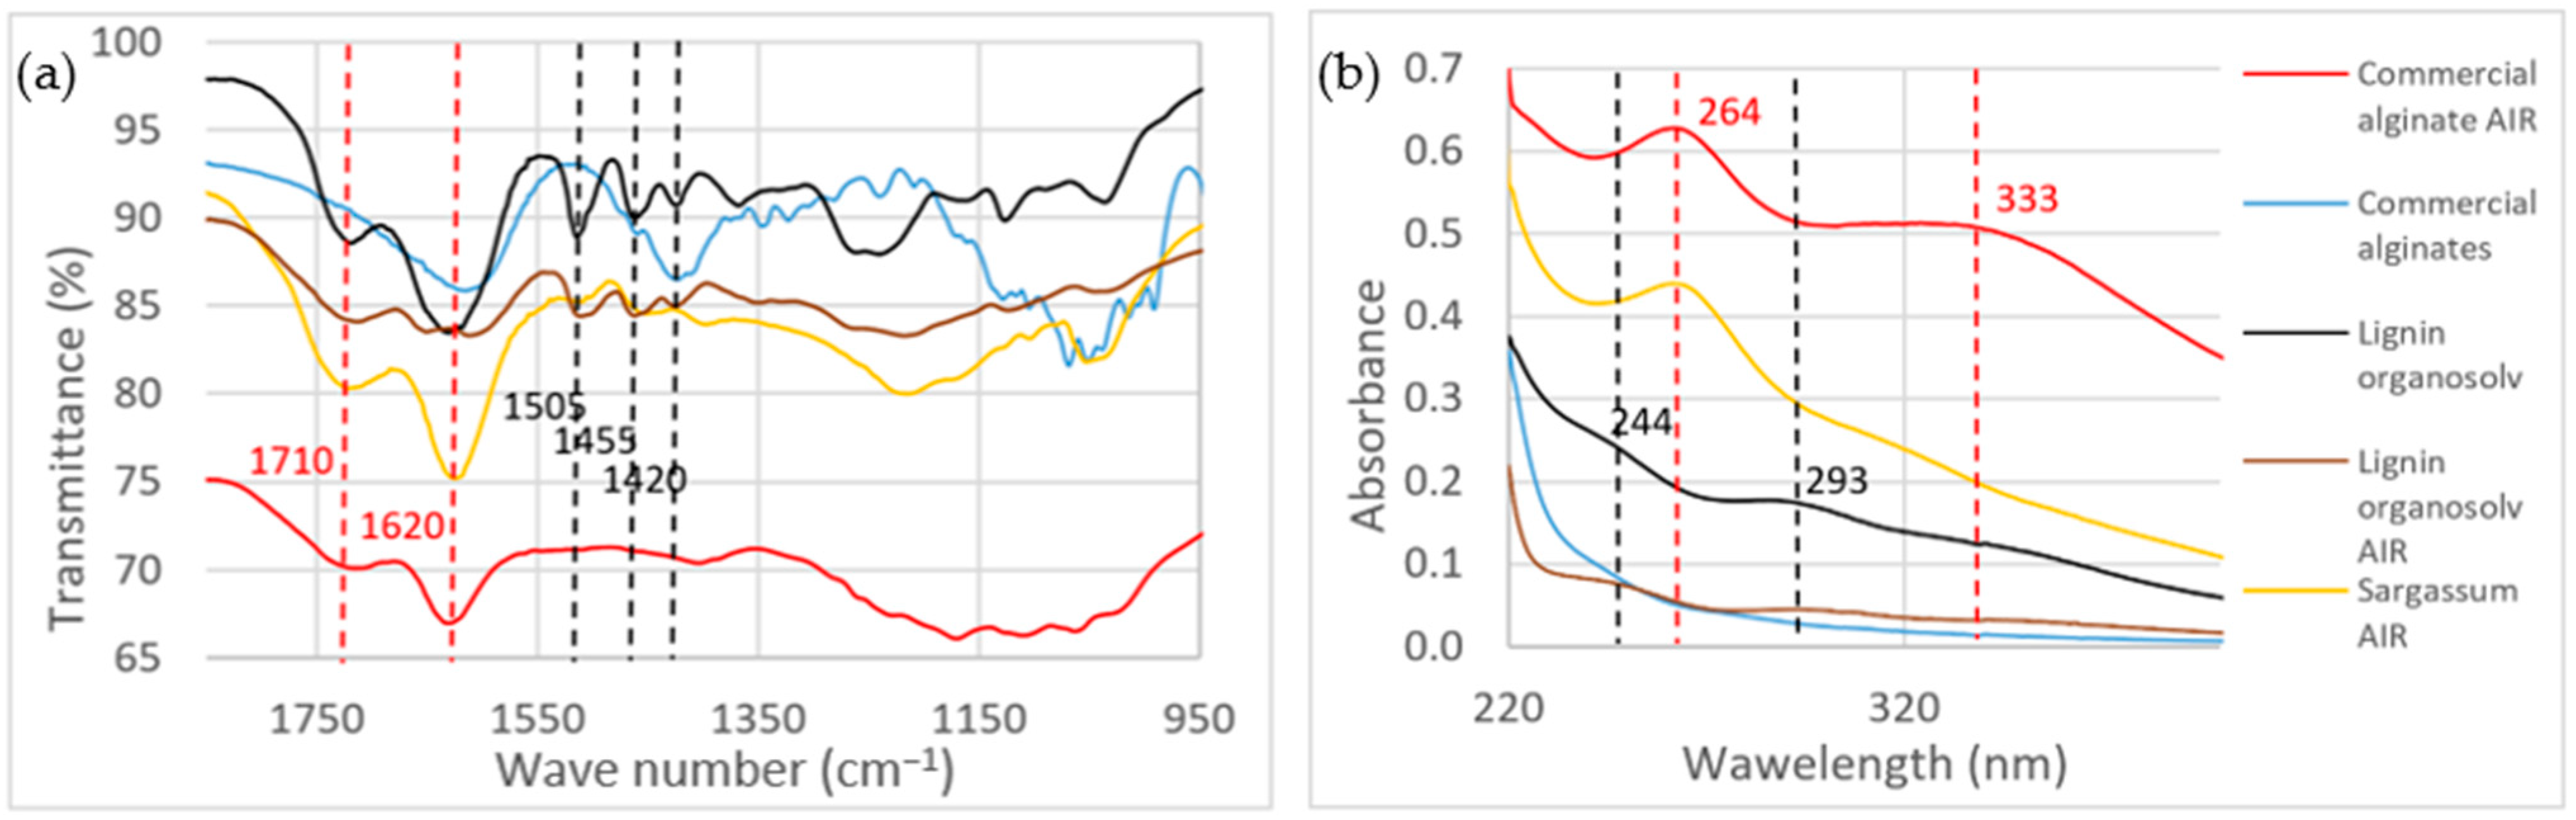
2.8.2. Spectroscopic Analysis of the Acid-Insoluble Residue

Solid samples of lignin, lignin AIR, sodium alginate, alginate AIR, and Sargassum AIR were analysed by IR spectroscopy using Perkin SPE 263 IR spectrometer (PerkinElmer, Waltham, MA, USA). To identify the composition of this residual matter, IR and UV spectroscopy were performed and the spectra of Sargassum AIRs were compared with those of different pure commercial products (sodium alginate and lignin Organosolv) and their AIRs. The samples were prepared by mixing them with KBr and pressing them into disks. Spectra were recorded with 64 scans in the wavenumber range from 4000–400 cm−1 with a resolution of 4 cm−1.
UV-visible spectroscopy was performed with a UV 1800 spectrophotometer (Shimadzu, Kyoto, Japan) in the wavelength range between 220 and 400 nm. Solutions of lignin, lignin AIR, sodium alginate, alginate AIR, and Sargassum AIR were prepared by dissolving the corresponding solids in 1 M NaOH for 1 h followed by filtration. A 1 M NaOH solution was used as the blank.

2.8.3. Alginates

The alginate content was determined following the protocol reported by Perez et al. [39]. A dried sample of Sargassum was washed (1:5 w/v) with 5% formaldehyde in water overnight at room temperature and stirred (1:50 w/v) three times with 2.0 N H2SO4 for 4 h at 30 °C. After a quick wash with deionised water, the sample was extracted (1:50 v/w) three times using 4% Na2CO3 for 2 h at 50 °C. The liquid phase was collected and the pH was adjusted to seven with 2 N HCl. Alginates were then precipitated by adding a 10% CaCl2 solution (1:1 v/v). After centrifugation at 10,000× g for 10 min at room temperature using a 6–16K refrigerated centrifuge (Sigma-Aldrich, Saint-Louis, MO, USA), the residues were collected and suspended in deionised water (1:20 w/v) and the pH of the solution was adjusted to two by adding 0.2–2.0 N HCl. The mixture was then stirred for 3 h at room temperature, after which it was centrifuged (10,000× g, 10 min). The residue was collected and suspended in deionised water (1:20 w/v) and solid NaOH was added to raise the pH to 10. Absolute ethanol (1:2 v/v) was then added to the resulting mixture, which was then stirred for 6 h in an ice bath. Finally, the solution was centrifuged (10,000× g, 10 min) and a white/brown solid was collected. The yield was calculated from the mass of the dried solid.

2.9. Mannitol

The mannitol content was determined following the protocol adapted from Cameron et al. [32]. 100 mg of crushed and sieved seaweed sample (<125 µm) was stirred in 5 mL of 0.1 N H2SO4, after which 5.00 mL of 0.100 N HIO4 was added. The resulting mixture was stirred for exactly 1 min and 20 mL of 4 N H2SO4 and 2.5 g of KI were added. The iodine formed was titrated with 0.250 M Na2SO3 solution.

2.10. Polyphenols

The Total Phenolic Contents (TPC) of the different Sargassum samples were determined by the Folin–Ciocalteu test in the aqueous or ethanolic extract obtained in NREL analysis. Briefly, in each well of a 96-well plate, 20 µL of a sample or Gallic Acid (GA) standard (10–80 mg·L−1) was added, followed by the addition of 10 µL of Folin–Ciocalteu reagent. After shaking for 10 s, 170 µL of 2.36% Na2CO3 was added and the absorbance was read at 760 nm after 45 min incubation at 45 °C. Readings were performed in eight wells for each sample, and four wells for each concentration of GA using a SPECTROstar nano (BMG Labtech, Ortenberg, Germany) spectrometer.

2.11. Elemental Analysis

As, Cd, Co, Cr, Cu, Hg, Ni, Pb, and Zn concentrations were determined by iCAP Q ICP-MS (Thermo Scientific, Waltham, MA, USA) at the AETE-ISO platform (OSU OREME/Université de Montpellier, France). A total of 100 mg of dried seaweed was mixed with 3 mL of 65% nitric acid and 1 mL of 35% H2O2. The samples were then heated in an open container at 150 °C for 2 h, followed by heating in a closed container overnight at the same temperature. After drying at 85 °C, the samples were resuspended in 10 mL of 1% (v/v) HNO3 in ultrapure water. The protocol was validated by analysing a certified reference sample.

2.12. Statistical Analysis

The compositions of the samples were statistically analysed for each of the components. All analyses were performed in triplicate (except for CHN analysis which was done in duplicate), and the mean and standard deviation (SD) values are reported. Significant variations between samples were analysed by one-way analysis of variance (ANOVA) except for heavy metal and CHN analyses. To check the normality of the residual data, the Shapiro–Wilk test with a significance level of alpha = 0.05 was employed. Additionally, homoscedasticity was assessed using Levene’s test on the median with alpha = 0.05. For multiple comparisons, Tukey’s HSD (Honestly Significant Difference) test was used. Statistical analysis was performed with XLSTAT 2014.5.03 software.

3. Results

The main results of the analyses are presented (Table 2) and discussed in detail in the following sections.

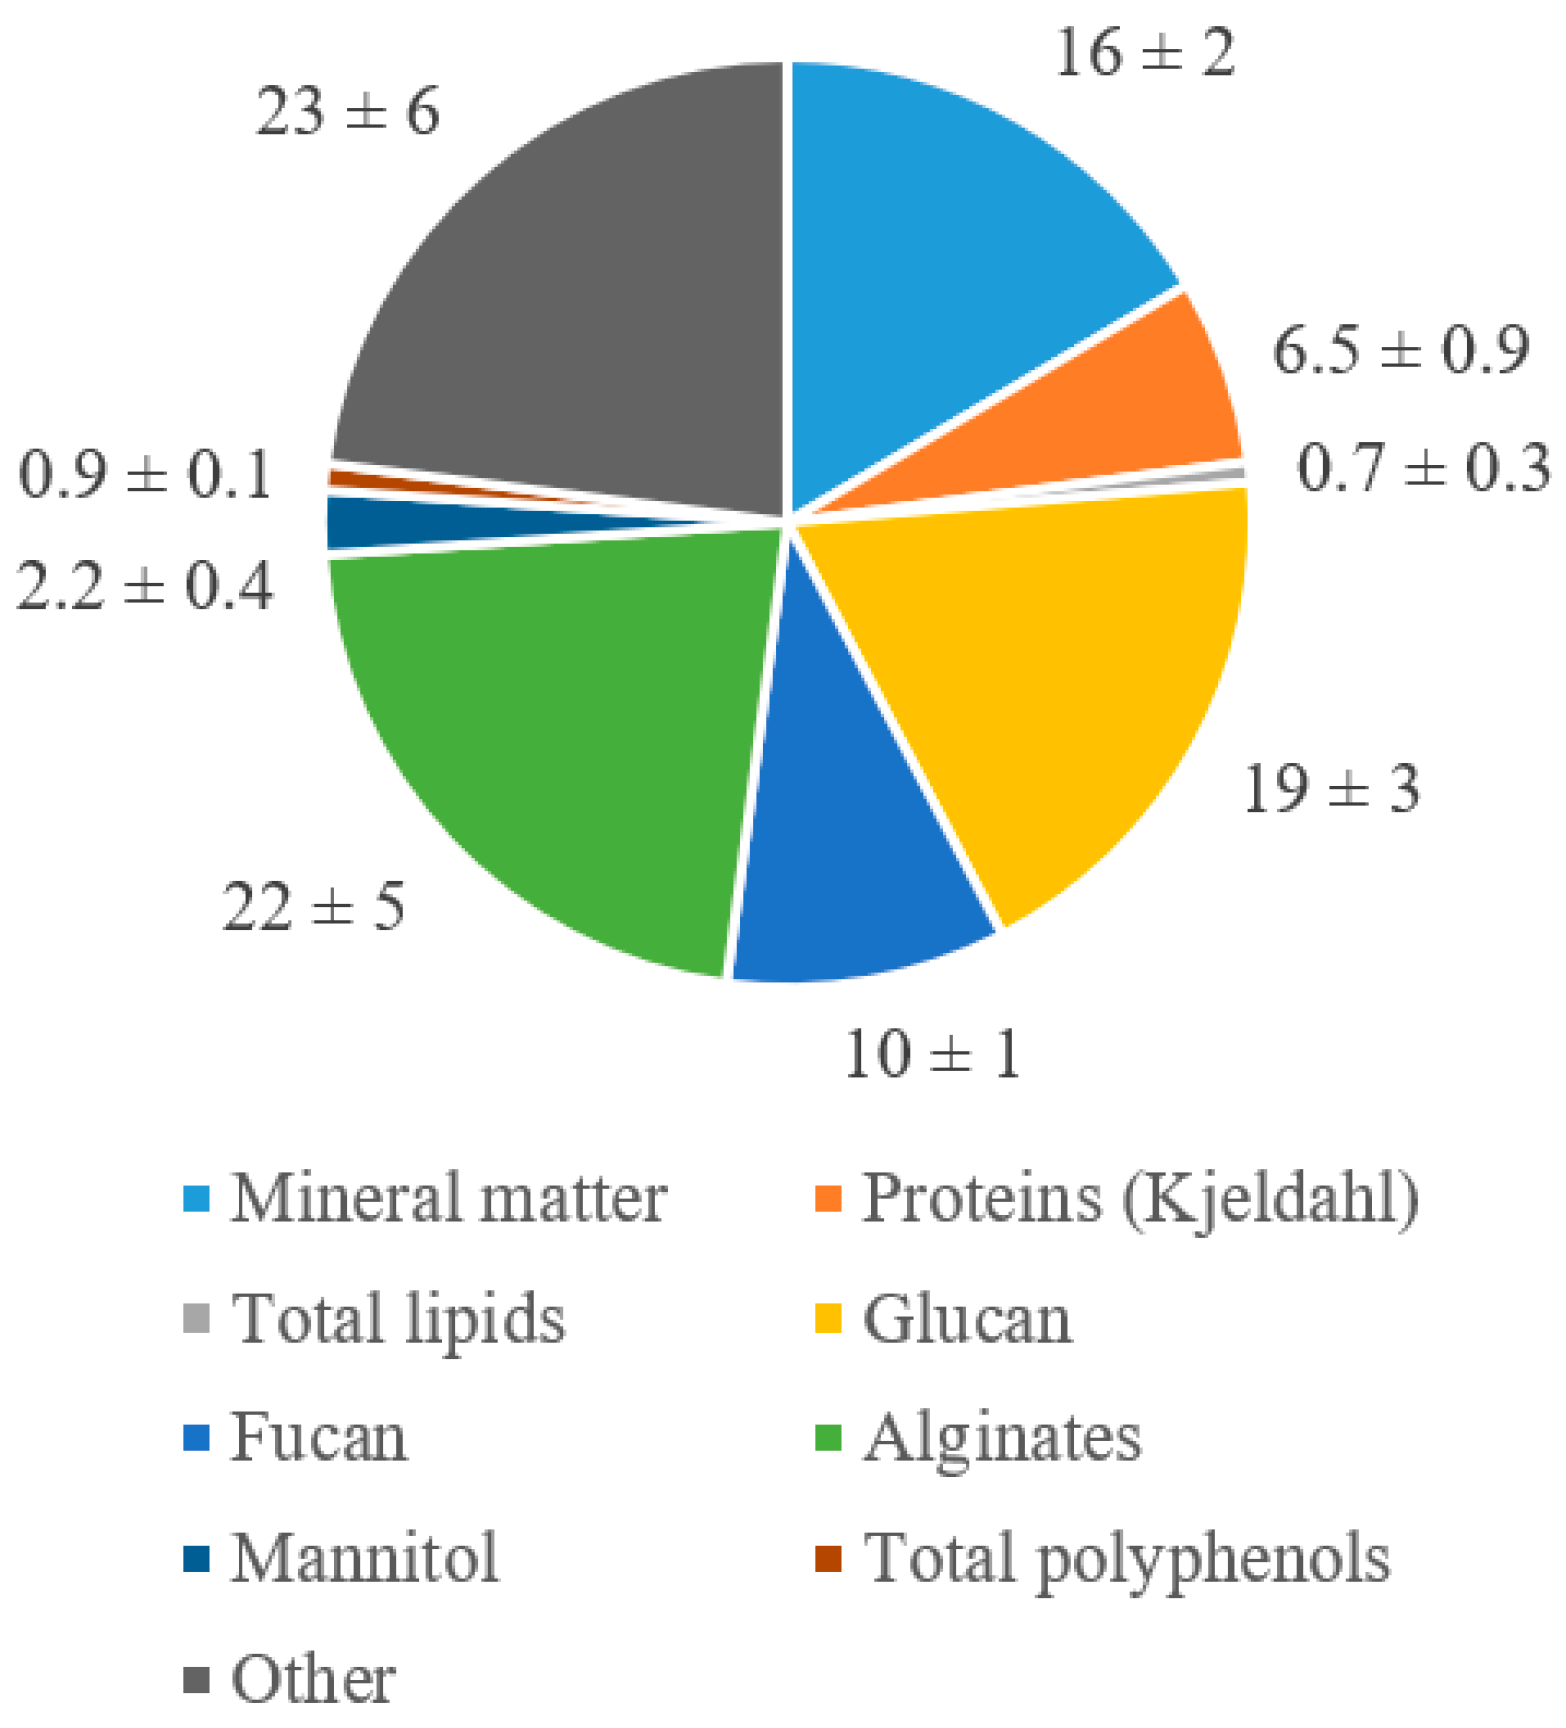
3.1. Proximate Analysis

The data in Table 2 show that there is little variation in the carbon and hydrogen contents between the different batches: the carbon contents varied from 36.82 to 38.89% for samples from Bouillante and Plage des Galets, respectively; for hydrogen, a variation from 5.39 to 6.59% was seen for samples from Le Gosier and Saint-Félix, respectively. However, nitrogen contents showed higher relative variations (0.86% for floats from Plage des Galets to 1.39% for stored Sargassum from Capesterre), which is mainly attributed to differences in protein content.

3.2. Proteins

The organic nitrogen content and protein content are reported in Table 2. The total amino acid (after removing the molar mass of one molecule of water from the molar mass of each free amino acid) for each batch of Sargassum is also included.
The variation in the total quantity of amino acids in the different batches is highlighted (Mean: 5.27%, SD: 0.79%). The floats (MGbfn22) had lower amino acid contents than the other batches. However, the amino acid profiles presented in Figure 4 indicate a similar amino acid composition in all batches including the float batch.
For all the batches, a similar variation was observed between total amino acid and Kjeldahl nitrogen contents (Table 2). A good correlation (Figure 5a) between total amino acid and Kjeldahl Nitrogen with a negligible intercept (b = 0.07%) compared to the amino acid titrated (between 3.86% and 6.32%) was indeed found (R2 = 0.9621). However, a poor correlation (Figure 5b) between total amino acid and total nitrogen from CHN analysis was observed (R2 = 0.7762).

3.3. Lipids

The total lipid content and the fatty acids profiles of the different batches are reported in Table 2 and Table 3. Gravimetric measurements showed that the total lipid content represents only a small proportion of the Sargassum (1.10% DW at most) and there is considerable variation in lipid content (Mean: 0.71%, SD: 0.30%) between the different batches. Lower lipid contents were observed for the late-season Sargassum batch (GBbwn22) and those in the floats (MGbfn22).
The percentage of free fatty acids and triglycerides in the dry matter of the Sargassum was seen to be very low (a FAME content of 0.03% to 0.34%). The majority of the fatty acids are saturated (49.42–74.93%), with the most present fatty acid being palmitic acid (35.11–57.33%).

3.4. Structural Carbohydrates

Structural carbohydrates were the principal components of Sargassum (24.84–30.42%) (Table 2). Glucan was the most important carbohydrate polymer (14.59–22.00%), followed by fucan (8.21–12.63%). The weight percentages of acid-insoluble residue after hydrolysis are given in Table 2. It is seen that AIR represents an important fraction of the Sargassum with little variation between the different batches (23.2–26.4%).
Infrared spectra in the range 1800 to 950 cm−1 are shown in Figure 6a for Sargassum AIR, commercial sodium alginate/lignin Organosolv, and their respective AIRs. A band at 1710 cm−1 indicating the presence of non-conjugated C=O bonds, and a band at 1620 cm−1 characteristic of conjugated C=O bonds, were present in all the studied products, except in commercial alginates. In commercial sodium alginate, a band at 1600 cm−1 corresponding to the asymmetric vibration of carboxylate groups was observed. This band was accompanied by another band at 1415 cm−1, corresponding to the symmetric vibration of carboxylate groups [40]. The three bands characteristic of lignin, at 1505 cm−1 (C=O stretching, conjugated with aromatic ring), 1450 cm−1 (C-H deformation in methyl and methylene groups), and 1420 cm−1 (aromatic C-H plane deformation) were observed both in commercial Organosolv lignin and lignin after hydrolysis [41].
UV-vis absorption spectra in the wavelength range from 220 to 400 nm of all the studied products are shown in Figure 6b. Commercial alginates did not present any absorption maximum in this wavelength range. Two absorption peaks at 244 nm and 293 nm were observed in Organosolv lignin and AIR Organosolv lignin samples. Alginates AIR and Sargassum AIR showed an absorption maximum of 264 nm. A peak at 333 nm was also detected in Sargassum AIR.
Alginate contents in the different Sargassum samples are summarised in Table 2. The highest alginate content of 30.19% DW is seen in seaweeds harvested at Bouillante in January 2022; this is significantly higher (p < 0.05) than those observed for the other samples from that year. No significant differences in alginate content were noted between the other samples. The storage duration and the part of the plant studied (floats or whole plant) seem to have had no effect on the alginate content.

3.5. Mannitol

The mannitol contents of the different Sargassum samples ranged from 1.60% to 2.80% DW (Table 2). No significant differences (p < 0.05) were found between the samples harvested from different locations and during different years, or between Sargassum freshly harvested (MCbwn22) or stored for a month (MCbws22). However, the floats (MGbfn22) contained significantly less mannitol than the whole plant (MGbwn22) (1.60 and 2.53%, respectively).

3.6. Polyphenols

The TPC values measured in the aqueous extracts prepared following the NREL protocol are presented in Table 2. TPCs ranged from 7.45 to 11.02 mg·g−1 GAE and showed significant differences (p < 0.05) within the same year. The floats had significantly fewer polyphenols than the whole plant. However, there were significant differences between the freshly harvested batch of algae and that which was stored for several weeks.

3.7. Elemental Analysis

Table 4 shows the concentrations in Na, Mg, S, and Ca and As, Cd, Co, Cr, Cu, Hg, Ni, Pb, and Zn in Sargassum samples. For Na, Mg, Ca, and S, the contents ranged from 1–12 g·kg−1 DW; the values did not vary much between batches. Concerning heavy metals, the samples showed similar elemental compositions. However, for some elements (Cr, Cu, Pb, Zn, As), one or more batches had concentrations that were 2 to 10 times higher than the others. For example, batches GFpwn22 and MGbwn22 had arsenic concentrations about four times higher (86 and 89 mg·kg−1, respectively) than the other batches (16–19 mg·kg−1), while GVbwn21 and GBbwn22 had concentrations of arsenic twice as high (48 and 53 mg·kg−1, respectively). The same trend was seen for zinc (48 and 59 mg·kg−1 for GLbwn21 and DPbwn21, up to 10 times higher), chromium (2 mg·kg−1 for GFpwn22, 3 to 4 times higher), or lead (1.5 mg·kg−1 for MGbfn22, 2 to 8 times higher). Mercury, on the other hand, was present in concentrations thirty times lower than the other metals.

4. Discussion

For the potential commercial exploitation of Sargassum seaweeds, it is important to know their composition and to check whether there are variations in composition depending on the area of collection or when they were collected. The average composition of the nine seaweed batches is shown in Figure 7. In accordance with previous studies [28,42], the main components of seaweed are carbohydrates, followed by ash. The high standard deviation reported for structural carbohydrates originates from an interannual variation; this aspect will be discussed in greater detail in the following sections.
Many of the variations observed between batches in this study can be attributed to differences in morphotype composition. Indeed, the batches of Sargassum spp. were made up of the natans I, natans VIII, and fluitans III morphotypes. The proportion of these three morphotypes can vary over time at the same stranding site and similarly over the same period at different sites [43,44,45,46]. Studies by Davis et al. and Ortega-Flores et al. have shown that differences in composition between these three morphotypes may occur in structural polysaccharides, mannitol, and heavy metals contents for example [47,48].

4.1. Proximate Analysis

The obtained nitrogen, carbon, and hydrogen contents in dried Sargassum are similar to those reported for batches analysed in the same year (C = 34.15%, H = 3.23%, N = 1.41%) [49] but very different from batches analysed in 2019 (C = 27.41%, H = 3.13%, N = 1.71%) [27]. These differences point to the significant yearly variation in the composition of algae.
In addition, the observed C/N ratios are very high (27–41) indicating low nitrogen content. This low nitrogen content could be a hindrance to the rapid degradation of the algae when they are spread [50].

4.2. Protein

In order to determine the protein content in the samples, three different methods were used and compared: amino acid determination, organic nitrogen by the Kjeldahl method, and total nitrogen by CHN analysis. Amino acid determination is a direct method to estimate the protein content and has been recommended by the Food and Agricultural Organisation of the United Nations [36]. The observed amino acid contents in this study (between 4.4% and 6.3%) were slightly higher than those reported by Milledge et al. (2020) (4.2%). Similarly to Milledge et al. in 2020, lower relative contents of histidine and tyrosine were measured in this study [27]. A very low tryptophan content (0.04% DW) has also been reported by Milledge et al. indicating that this amino acid is present in negligible amounts in Sargassum algae. Therefore, this amino acid has not been determined in this work. The amino acid determination method is long and expensive and tends to slightly underestimate the protein content due to the degradation of amino acids during hydrolysis [51]. Using this method, an estimated organic nitrogen %NAA content in the amino acids of the Sargassum was obtained to be in the range of 14.6% to 15.5% (excluding the float batch). The inverse of this nitrogen rate yields the nitrogen–protein conversion factor (Nprot) for Sargassum [52]. The Nprot value obtained in this study is 6.54, which is higher than the value of 4.56 reported by Angell et al. for brown algae [53].
The Nprot value of this study was subsequently used to determine the protein content from the total organic nitrogen determined by the Kjeldahl method. In this way, the protein content of Sargassum was estimated to be in the range of 5.6–7.7% and was lower (4.8%) only in the floats. The Kjeldahl method has many advantages over the amino acid method in that it is fast and affordable, extremely accurate, and does not underestimate the protein content as the amino acid method does. Indeed, in this method, all the organic nitrogen is converted into ammonium and then titrated. However, this method has two disadvantages: first, it requires prior knowledge of the protein–nitrogen conversion factor, which must be estimated by determining the amino acid profile of the sample. Secondly, in this method, all “Kjeldahl” nitrogen including proteic and non-proteic, and ammonium ions, are titrated. The high correlation found between the total amino acid rate and the organic nitrogen rate (Figure 5a; y = 0.0017x + 0.0007; R2 = 0.9621) confirmed that the estimated Kjeldahl nitrogen originated exclusively from proteins and not from a non-proteic source. Since the intercept of this correlation was negligible compared to the nitrogen rate in each batch (between 0.9% and 1.2%), we can estimate the nitrogen content using this method without risking significant bias due to a non-proteic nitrogen source. Using this method, Mohammed et al. [54] reported %NKjeldahl content of 0.75% and Gordillo Sierra et al. [55] reported 1.20%. These contents are comparable to the values proposed in this study (0.74–1.18%). Using the two methods described above, no clear inter-annual variation was detected in protein levels.
The third method to estimate the protein content of Sargassum is to use the total nitrogen value of Sargassum obtained in CHN analysis and multiply it by the previously determined nitrogen–protein conversion factor. However, unlike the Kjeldahl method, which only determines the organic nitrogen (excluding nitrogen bonded with oxygen such as nitrates/nitrites, or another nitrogen) [35], the CHN analysis includes the total nitrogen content, both organic and inorganic. Indeed, when using this method, a lack of correlation was observed between the rate of amino acid and total nitrogen (Figure 5b; y = 0.0017x + 0.0018, R2 = 0.7762); thus, the CHN analysis did not allow to estimate the protein content in Sargassum.
The implementation of three methods has brought complementary information for measuring protein content in Sargassum. The protein content of Sargassum is of the same order of magnitude as that of legumes [56]. These proteins can be valorised as high added-value compounds in the medical field [57].

4.3. Lipids

The total lipid content of the Sargassum was low; both floats (MGbfn22) and late season Sargassum (GBbwn22) had lower lipid contents than the other batches, while no difference was found in general between samples from 2021 and 2022. The total lipid contents found in this study were similar to those reported by Gordillo et al. in 2022 (1.33%) [55], on Sargassum harvested in the same year, and extracted using the same method (April 2021). Ginneken also reported similar rates for samples harvested in 2011, using the same method [58]. However, Milledge et al. have reported higher contents (3.58%) [27]. These differences may be due to the different extraction solvents MTBE/MeOH. In the same way, Mohammed et al. found a much lower lipid content (0.01%) when using petroleum ether as the extraction solvent [54]. Thus, it may be useful to share a common lipid extraction method between studies so that results can be compared.
In accordance with the previous reports of Milledge et al. [27] and Ginneken et al. [58], the majority of fatty acid found in all batches was palmitic acid. However, the contents of polyunsaturated fatty acids measured in this study (4.51–22.33%) were lower than those of Milledge et al. (29.3%) and Ginneken et al. (31%). Docosahexaenoic acid (DHA) was not found in any of the batches in this study, whereas this acid has been described in the lipid profiles reported by both Milledge et al. (6.44%) and Ginneken et al. (13%). Auto-oxidation of DHA during drying by direct exposure to sunlight could explain why no DHA was observed in the lipid fraction [59]. This phenomenon has already been observed with Porphyra umbilicalis and Ulva fenestrate seaweeds, which presented an important diminution of fatty acid content, especially PUFAs, when stored under light exposure compared to dark storage [60]. The effect of temperature could also involve the degradation of sensitive lipids, and it has been shown that the storage at ambient temperature of Laminaria digitata and Palmaria palmata seaweeds leads to the oxidation of PUFAs [61].
Quantification of the fatty acid contents by adding pentadecanoic acid as an internal standard allowed us to confirm that fatty chains represented only a small amount of the total lipids. Indeed, many metabolites may have been extracted along with the fatty chains by chloroform. It has been reported that chloroform maceration (50 °C, 24 h) on Sargassum muticum resulted in a low extraction yield (2.1%) and mainly resulted in the extraction of chlorophylls (426.8 µg·g−1 DW) and xanthophylls (1105.1 µg·g−1 DW) [62]. Chlorophylls were also extracted from Sargassum natans (chlorophyll a: 538 ng·mg−1 DW; chlorophyll c: 42 ng·mg−1 DW) and Sargassum fluitans (chlorophyll a: 439 ng·mg−1 DW; chlorophyll c: 37 ng·mg−1 DW) [63]. The presence of chlorophylls could also explain the green colour of the lipid extracts when using the Folch method.
Despite the low lipid content, it would be interesting to recover the lipidic fraction as part of a biorefinery. To preserve PUFAs, particularly DHA, it is essential to minimise any oxidation process that would alter their properties.

4.4. Structural Carbohydrates

Structural carbohydrates are major constituents of Sargassum [64]. Structural glucose content can be attributed to cellulose and laminarins, while structural fucose is associated with fucoidans. As was previously observed by Machado et al. [45], a low variability in structural carbohydrate content was found with respect to harvest site or storage. Furthermore, floats also showed the same structural carbohydrate content as the rest of the algae. However, a slight difference in glucan and fucan content was noted between Sargassum collected in 2021 and 2022. The 2021 batches showed a slightly lower glucan content but a somewhat higher fucan content than the 2022 batches. Other studies have reported lower contents of structural carbohydrates in Sargassum; Del Rio et al. reported 15.32% structural carbohydrates (10.18% glucan, 1.64% xylan, 2.69% galactan, 2.42% mannan, 6.00% fucan) in Sargassum muticum [65]. In 2021, Aparicio et al. reported similar contents in Sargassum spp. (Glucan 10.4%, Galactan 4.34%, Fucan 6.77%) [66], which was also confirmed by Bonilla Loaiza et al. in the following year (glucan 11.64%, galactan 0.99%, fucan 3.18%) [67].
Alginates also constitute a significant portion of structural carbohydrates and showed a similar trend to those observed for glucan and fucan carbohydrates. No difference was observed between the floats and whole algae. In addition, the harvesting site and the storage of the algae did not influence the alginate content. However, for all the batches, the alginate contents in 2021 were higher than in 2022, showing a significant annual variability in the alginate content of Sargassum algae. Values of alginate contents reported in this study are in-between those reported by Mohammed (17% for Sargassum spp., Trinidad island) [54] and Rhein–Knudsen (30%, for Sargassum natans, Ghana) [68].
As polysaccharides form the main fraction of Sargassum, they are the compounds of choice for adding value to this seaweed. Alginates can be easily extracted at a larger scale to be used as thickeners [69,70] and as an extracting agent for the depollution of water [71]. However, it is important to keep in mind that Sargassum alginates need to be treated to eliminate the heavy metals they contain.
Moreover, sulphated polysaccharides such as fucoidans have shown hepatoprotective and cytoprotective activities [72,73], while laminarins have anti-tumour, anti-inflammatory and anti-coagulant properties [74,75].

4.5. Acid-Insoluble Residue

Following the hydrolysis of the Sargassum, an acid-insoluble residue was recovered. This residue constitutes a significant mass fraction of the Sargassum, and has therefore, already been described by other authors; AIR contents ranging from 25 to 32% have been reported [49,65,66,67,76]. Alzate-Gavira et al. [76] and Olguin-Maciel et al. [49]. considered this fraction to be lignin or a “lignin-like” material. Indeed, based on the National Renewable Energy Laboratory (NREL) analytical procedure [31], the AIR is considered to be lignin, in the form of klason lignin [77]. However, it can be noted that this protocol was designed to analyse lignocellulosic materials, which is not the case of Sargassum. Therefore, it is not clear as to whether the AIR of Sargassum should be considered as lignin. Currently, no lignin has been found in brown algae, and the lignin-like compounds reported in the literature are controversial [78].
Before hydrolysis, infrared and UV-visible spectra of lignin samples showed characteristic bands (1520 cm−1, 1450 cm−1, 1420 cm−1; 293 nm; 244 nm). These bands have also been described in the literature and have reportedly been observed in hydrolysed lignin [41,79]. However, these bands were not observed in the spectra of Sargassum AIR. When comparing Sargassum AIR with alginate and alginate AIR samples, the infrared band at 1600 cm−1 that appeared in the spectrum of commercial alginates was not found in AIR alginates; this result is attributed to the acid treatment of the sample. However, the presence of a band at 1620 cm−1 in the spectra of both AIR alginates and Sargassum AIR indicates the possible presence of alpha-beta unsaturated ketone, a likely product of the degradation of alginates during hydrolysis. Furthermore, an absorbance peak at 264 nm was observed in the UV-Vis absorption spectrum of AIR alginates, which was not found in the spectrum of commercial alginates. This further confirms the hypothesis of alginate degradation. Previous works have reported similar degradation processes for alginates under different conditions (gamma irradiation) [80,81], where the observed absorption maximum at 265 nm was attributed to degraded alginate species. Finally, the similarities between the UV-Vis and IR spectra of AIR alginates and AIR Sargassum also indicate that the residue obtained after hydrolysis in the NREL protocol was not lignin, but constituted by degraded alginates.

4.6. Mannitol

The mannitol contents in the different batches were found to be lower than those reported by Davis et al. who reported values between 0.12 and 0.7% DW depending on species [47]. Borines et al. have noted a higher concentration (5.04% DW) [82]. Mannitol is one of the most abundant products of photosynthesis in brown algae and is mainly used in carbon storage as a soluble carbohydrate [83]. The observed difference in mannitol concentration between the floats and the other batches might be explained by its washing out of the cell tissues. Indeed, the floats batch was directly harvested in “Plage des Galets” and not separated from whole seaweeds; this means that the original plants were degraded enough to be separated from their floats [84]. It has been reported that the proportion of mannitol varied according to the time of year, with a maximum in winter during the growth phase of the algae [19]. However, in this study, no significant difference in mannitol was observed for the batch harvested in January (GBbwn22) as compared to the other batches.
It is worth noting that the method developed by Cameron et al. (1948) for mannitol determination [32] does not require prior extraction and is found to be efficient for the direct and rapid analysis of raw algae. Moreover, this method uses a correction coefficient to consider the co-oxidation of compounds other than mannitol. The mannitol content of Sargassum seaweed is relatively low; however, as mannitol is a sweetener that is frequently used in the medical and food sectors [85], in a biorefinery context it is possible to add value to a mannitol-containing fraction.

4.7. Polyphenols

Phlorotannins are secondary algae metabolites with interesting properties as antitumor and antioxidant activities [86]. The TPCs found in this study were generally higher than those reported in the literature: Saldarriaga-Hernandez et al. found a TPC in the range 0.2 to 3.11 mg·g−1 GAE depending on the extraction method, while Davis et al. reported 1.20 to 3.11 mg·g−1 PGE and Paredes-Camacho et al. 4.35 mg·g−1 GAE for washed algae [28,47,87]. Only Milledge et al. reported a higher value with 29.5 mg·g−1 PGE for a mixture of natans and fluitans [27]. Indeed, drying treatment of the biomass by sunlight could involve variability in the TPCs. On one hand, it has been reported higher TPCs content after freeze-drying than oven-drying or solar-drying treatment in Australian Sargassum, Sargassum fusiforme, and Sargassum muticum, explained by the degradation of polyphenols because of the irradiation and the temperature [88,89,90]. On another hand, Sargassum duplicatum seems to provide better TPC after a sun-drying and oven-drying than a freeze-drying treatment [91]. Moreover, no significant TPC variation was found in Durvillaea antarctica depending on the drying treatment [92]. Since no clear effect of the drying treatment of Sargassum on the TPCs has been established, the solar-drying method leads to TPCs comparable with previous studies.
In seaweeds, phlorotannins play several physiologic roles: studies have shown that in addition to their structural function at the beginning of algae growth, phlorotannins also have antimicrobial and defence properties against herbivores, UV and oxidative stress [86,93]. Thus, they are more present during the warmer seasons. However, several other physicochemical parameters in the growth of seaweeds could induce inter-annual and inter-species variations [93,94]. The higher TPC values in this study may be due to oxidative stress from partial dehydration of the algae on the beach before harvesting and during drying.

4.8. Elemental Analysis

In general, the contents of heavy metals measured in this study were within the same ranges as described by Ortega-Flores et al. (2022) who analysed results from 12 different studies [48]. However, the chromium concentration was higher than those found in other works [47,95].
Alginates are known to chelate heavy metals and other divalent or trivalent ions through their carboxylate groups, forming “egg boxes”. However, the capacity of absorption is modulated by the pH (the alginic acid formed has a much lower absorption coefficient), the presence of other metals, and the affinity of alginates for the different metal species present [96,97]. Another site for metal uptake could be sulphonate groups of fucoidans, which are present in large quantities in the cell walls of brown algae [48].
No link between pollution of the harvesting areas and the detected heavy metal contents in the batches was found. For example, the Saint-Felix harbour might be considered polluted due to anthropogenic discharges linked to fishing vessels [98]. However, it showed metal concentrations similar to other batches, except for arsenic or chromium. The batches from “Plage des Galets” also showed high contents of arsenic or lead despite lower levels of apparent pollution sources. This lack of correlation may be due to the absorption kinetics of seaweeds. Interestingly, work on Sargassum thunbergii showed that accumulation was visible only after three days of contact with a solution containing metal ions [99]. The variation in heavy metal content in the algae would therefore be due to pollution encountered by the floating mats during their growth and movement.
The high heavy metal content hinders the valorisation of the algae. In this regard, both national and international regulations have defined limits to the concentration of metals in algae for certain uses, such as fertiliser or animal feed. For example, European Commission Regulation (EU) 2019/1869 of 7 November 2019 sets limits of 10 mg·kg−1 for arsenic, 10 mg·kg−1 for lead, and 0.1 mg·kg−1 for mercury in complete feeds entirely from seaweed (%DW = 88%) in the European Union [100]. All the batches studied (Table 4) exhibit an arsenic content that is too high to be used as animal feed.
The implementation of a seaweed biorefinery process would make it possible to generate high added-value fractions free of heavy metals. Indeed, when alginates are extracted, their transformation into alginic acid and then into sodium alginate would enable toxic cations to be replaced by sodium ions.

5. Conclusions

This study was carried out to determine the variation in composition of various batches of Sargassum spp. seaweeds depending on the area and year of harvest. In accordance with previous works, it was shown here that the seaweeds are mainly composed of alginates (17.75–30.19% DW), glucan (14.59–22.00% DW), minerals (14.48–19.86% DW) and fucan (8.21–12.63% DW). They have low contents of lipid, mannitol, and polyphenol (0.40–1.10% DW, 1.95–2.80% DW, and 7.45–11.02 mg·g−1 GAE, respectively). Fatty acid profiles of the Sargassum lipid extracts showed that the major fatty acid is palmitic acid. In addition, there are great similarities between the different batches of algae. By using this analytical method, the nitrogen/protein conversion factor was determined to be 6.54, which is specific to Sargassum spp., and is quite different from values proposed in previous studies. It also has been identified that the acid-insoluble residue was not lignin but a degradation product of alginates. Finally, high contents of toxic heavy metals were found in the Sargassum, with some batches exceeding European standards for animal feed. The concentration of these metals does not seem to depend on the location of harvest (localised pollution).
This study has shown that structural carbohydrates (glucan, fucan, alginates) show little variation depending on where they are collected; although there was a greater difference depending on harvesting year. The other analytes, present in smaller quantities, show greater variability in their levels, which can vary up to a factor of four (lipids). Analysis of the floats showed a composition similar to that of the rest of the algae. Seaweed storage in the spreading zone did not seem to alter their composition. In summary, the variability in the composition of the algae does not appear to be a hindrance to their future exploitation but the presence of high levels of heavy metals can hinder their use in certain applications (materials, animal feed, fertilisers, etc.), except for energy recovery. A solution could lie in the choice of processes used in the biorefinery to separate them from the fractions of interest.

Author Contributions

J.B.: Conceptualization, Methodology, Formal analysis, Writing—Original Draft, Writing—Review & Editing. E.C.: Conceptualization, Methodology, Formal analysis, Writing—Original Draft, Writing—Review & Editing. S.C.: Methodology, Formal analysis, Writing—Review & Editing. C.C.: Conceptualization, Methodology, Writing—Review & Editing, Funding acquisition, Supervision. J.P.: Methodology, Writing—Review & Editing. C.D.R.: Methodology, Writing—Review & Editing, Funding acquisition. A.R.: Conceptualization, Methodology, Writing—Review & Editing, Supervision. V.S.: Conceptualization, Methodology, Writing—Review & Editing, Funding acquisition, Supervision. G.V.-M.: Conceptualization, Methodology, Writing—Review & Editing, Supervision. V.V.: Conceptualization, Methodology, Writing—Review & Editing, Supervision. E.V.: Conceptualization, Methodology, Writing—Review & Editing, Supervision. P.D.C.: Conceptualization, Methodology, Writing—Review & Editing, Funding acquisition, Supervision. All authors have read and agreed to the published version of the manuscript.

Funding

This research received no external funding.

Institutional Review Board Statement

Not applicable.

Informed Consent Statement

Not applicable.

Data Availability Statement

Data are contained within the article.

Acknowledgments

The authors gratefully thank the ANR Sargassum program for “Holistic approach for Sargassum valorization-SARGOOD” project supported by ANR (NºANR-19-SARG-0002-02), FAPESP, INTERREG Caraïbes, and for “SarTrib: Tribological and electrochemical recovery of Sargassum pyrolysis residues” (AAP SARGASSUM), supported by ADEME (20GAC0011) and Region Guadeloupe FEDER GP0026401 (2020-FED-15). The authors also thank COVACHIM and GTSI laboratories from the Université des Antilles, and the company Algeanova in the Dominican Republic, for the Sargassum harvest. This work certified EUR BioEco had benefited from the financial support of the French National Research Agency “Investissement d’avenir” Program (N°ANR-18-EURE-0021).

Conflicts of Interest

The authors declare no conflicts of interest.

References

  1. Kingsbury, J.M. Christopher Columbus as a Botanist. Arnoldia 1992, 52, 11–28. [Google Scholar]
  2. Wang, M.; Hu, C.; Barnes, B.B.; Mitchum, G.; Lapointe, B.; Montoya, J.P. The Great Atlantic Sargassum Belt. Science 2019, 365, 83–87. [Google Scholar] [CrossRef] [PubMed]
  3. Gavio, B.; Rincón-Díaz, M.N.; Santos-Martínez, A. Massive quantities of pelagic Sargassum on the shores of San Andres island, southwestern Caribbean. Acta Biol. Colomb. 2014, 20, 239–241. [Google Scholar] [CrossRef]
  4. Oviatt, C.A.; Huizenga, K.; Rogers, C.S.; Miller, W.J. What Nutrient Sources Support Anomalous Growth and the Recent Sargassum Mass Stranding on Caribbean Beaches? A Review. Mar. Pollut. Bull. 2019, 145, 517–525. [Google Scholar] [CrossRef] [PubMed]
  5. Milledge, J.; Harvey, P. Golden Tides: Problem or Golden Opportunity? The Valorisation of Sargassum from Beach Inundations. J. Mar. Sci. Eng. 2016, 4, 60. [Google Scholar] [CrossRef]
  6. Kumar, A.; Buia, M.C.; Palumbo, A.; Mohany, M.; Wadaan, M.A.M.; Hozzein, W.N.; Beemster, G.T.S.; AbdElgawad, H. Ocean Acidification Affects Biological Activities of Seaweeds: A Case Study of Sargassum vulgare from Ischia Volcanic CO2 Vents. Environ. Pollut. 2020, 259, 113765. [Google Scholar] [CrossRef] [PubMed]
  7. Louime, C.; Fortune, J.; Gervais, G. Sargassum Invasion of Coastal Environments: A Growing Concern. Am. J. Environ. Sci. 2017, 13, 58–64. [Google Scholar] [CrossRef]
  8. Johnson, D.R.; Ko, D.S.; Franks, J.S.; Moreno, P.; Sanchez-Rubio, G. The Sargassum Invasion of the Eastern Caribbean and Dynamics of the Equatorial North Atlantic, Conference Paper. 2012. Available online: https://www.researchgate.net/publication/324418761_The_Sargassum_Invasion_of_the_Eastern_Caribbean_and_Dynamics_of_the_Equatorial_North_Atlantic (accessed on 10 April 2024).
  9. Franks, J.S.; Johnson, D.R.; Ko, D.S.; Sanchez-Rubio, G.; Hendon, J.R.; Lay, M. Unprecedented Influx of Pelagic Sargassum along Caribbean Island Coastlines during Summer 2011; ResearchGate: Puerto Morelos, Mexico, 2011; pp. 6–8. [Google Scholar]
  10. García-Sánchez, M.; Graham, C.; Vera, E.; Escalante-Mancera, E.; Álvarez-Filip, L.; van Tussenbroek, B.I. Temporal Changes in the Composition and Biomass of Beached Pelagic Sargassum Species in the Mexican Caribbean. Aquat. Bot. 2020, 167, 103275. [Google Scholar] [CrossRef]
  11. Resiere, D.; Kallel, H.; Florentin, J.; Banydeen, R.; Compton, K.; Gueye, P.; Mehdaoui, H.; Neviere, R. Sargassum Seaweed in the Caribbean: A Major Public Health Problem Still Unsolved. J. Glob. Health 2023, 13, 03017. [Google Scholar] [CrossRef] [PubMed]
  12. Agence Nationale de Sécurité Sanitaire Alimentation, Environnement, Travail (ANSES). Expositions aux Émanations d’algues Sargasses en Décomposition au Antilles et en Guyane. 2017. Available online: https://www.anses.fr/fr/system/files/AIR2015SA0225Ra.pdf (accessed on 4 April 2024).
  13. Capron, A. Les Algues Sargasses, Cauchemar des Guadeloupéens. Available online: https://observers.france24.com/fr/20150819-algues-sargasses-cauchemar-guadeloupe-antilles (accessed on 2 July 2023).
  14. Resiere, D.; Mehdaoui, H.; Banydeen, R.; Florentin, J.; Kallel, H.; Nevière, R.; Mégarbane, B. Effets sanitaires de la décomposition des algues sargasses échouées sur les rivages des Antilles françaises. Toxicol. Anal. Clin. 2021, 33, 216–221. [Google Scholar] [CrossRef]
  15. Marsh, R.; Oxenford, H.A.; Cox, S.-A.L.; Johnson, D.R.; Bellamy, J. Forecasting Seasonal Sargassum Events across the Tropical Atlantic: Overview and Challenges. Front. Mar. Sci. 2022, 9, 914501. [Google Scholar] [CrossRef]
  16. Gao, H.; Duan, B.; Lu, A.; Deng, H.; Du, Y.; Shi, X.; Zhang, L. Fabrication of Cellulose Nanofibers from Waste Brown Algae and Their Potential Application as Milk Thickeners. Food Hydrocoll. 2018, 79, 473–481. [Google Scholar] [CrossRef]
  17. Amador-Castro, F.; García-Cayuela, T.; Alper, H.S.; Rodriguez-Martinez, V.; Carrillo-Nieves, D. Valorization of Pelagic Sargassum Biomass into Sustainable Applications: Current Trends and Challenges. J. Environ. Manag. 2021, 283, 112013. [Google Scholar] [CrossRef]
  18. Hsiao, W.-C.; Hong, Y.-H.; Tsai, Y.-H.; Lee, Y.-C.; Patel, A.K.; Guo, H.-R.; Kuo, C.-H.; Huang, C.-Y. Extraction, Biochemical Characterization, and Health Effects of Native and Degraded Fucoidans from Sargassum crispifolium. Polymers 2022, 14, 1812. [Google Scholar] [CrossRef] [PubMed]
  19. Zubia, M.; Payri, C.; Deslandes, E. Alginate, Mannitol, Phenolic Compounds and Biological Activities of Two Range-Extending Brown Algae, Sargassum mangarevense and Turbinaria ornata (Phaeophyta: Fucales), from Tahiti (French Polynesia). J. Appl. Phycol. 2008, 20, 1033–1043. [Google Scholar] [CrossRef]
  20. Oxenford, H.A.; Cox, S.-A.; van Tussenbroek, B.I.; Desrochers, A. Challenges of Turning the Sargassum Crisis into Gold: Current Constraints and Implications for the Caribbean. Phycology 2021, 1, 27–48. [Google Scholar] [CrossRef]
  21. Rossignolo, J.A.; Felicio Peres Duran, A.J.; Bueno, C.; Martinelli Filho, J.E.; Savastano Junior, H.; Tonin, F.G. Algae Application in Civil Construction: A Review with Focus on the Potential Uses of the Pelagic Sargassum spp. Biomass. J. Environ. Manag. 2022, 303, 114258. [Google Scholar] [CrossRef] [PubMed]
  22. Bilba, K.; Onésippe Potiron, C.; Arsène, M.-A. Invasive Biomass Algae Valorization: Assessment of the Viability of Sargassum Seaweed as Pozzolanic Material. J. Environ. Manag. 2023, 342, 118056. [Google Scholar] [CrossRef] [PubMed]
  23. Bauta, J.; Vaca-Medina, G.; Raynaud, C.D.; Simon, V.; Vandenbossche, V.; Rouilly, A. Development of a Binderless Particleboard from Brown Seaweed Sargassum spp. Materials 2024, 17, 539. [Google Scholar] [CrossRef] [PubMed]
  24. Abu-Khudir, R.; Ismail, G.A.; Diab, T. Antimicrobial, Antioxidant, and Anti-Tumor Activities of Sargassum linearifolium and Cystoseira crinita from Egyptian Mediterranean Coast. Nutr. Cancer 2021, 73, 829–844. [Google Scholar] [CrossRef] [PubMed]
  25. Ahmed, N.; Mohamed, H.F.; Xu, C.; Sun, X.; Huang, L. Novel Antibacterial Activity of Sargassum fusiforme Extract against Coral White Band Disease. Electron. J. Biotechnol. 2022, 57, 12–23. [Google Scholar] [CrossRef]
  26. Spagnuolo, D.; Iannazzo, D.; Len, T.; Balu, A.M.; Morabito, M.; Genovese, G.; Espro, C.; Bressi, V. Hydrochar from Sargassum muticum: A Sustainable Approach for High-Capacity Removal of Rhodamine B Dye. RSC Sustain. 2023, 1, 1404–1415. [Google Scholar] [CrossRef]
  27. Milledge, J.J.; Maneein, S.; Arribas López, E.; Bartlett, D. Sargassum Inundations in Turks and Caicos: Methane Potential and Proximate, Ultimate, Lipid, Amino Acid, Metal and Metalloid Analyses. Energies 2020, 13, 1523. [Google Scholar] [CrossRef]
  28. Paredes-Camacho, R.M.; González-Morales, S.; González-Fuentes, J.A.; Rodríguez-Jasso, R.M.; Benavides-Mendoza, A.; Charles-Rodríguez, A.V.; Robledo-Olivo, A. Characterization of Sargassum spp. from the Mexican Caribbean and Its Valorization through Fermentation Process. Processes 2023, 11, 685. [Google Scholar] [CrossRef]
  29. Rosado-Espinosa, L.A.; Freile-Pelegrín, Y.; Hernández-Nuñez, E.; Robledo, D. A Comparative Study of Sargassum Species from the Yucatan Peninsula Coast: Morphological and Chemical Characterisation. Phycologia 2020, 59, 261–271. [Google Scholar] [CrossRef]
  30. Tonon, T.; Machado, C.B.; Webber, M.; Webber, D.; Smith, J.; Pilsbury, A.; Cicéron, F.; Herrera-Rodriguez, L.; Jimenez, E.M.; Suarez, J.V.; et al. Biochemical and Elemental Composition of Pelagic Sargassum Biomass Harvested across the Caribbean. Phycology 2022, 2, 204–215. [Google Scholar] [CrossRef]
  31. Sluiter, A.; Hames, B.; Ruiz, R.; Scarlata, C.; Sluiter, J.; Templeton, D.; Crocker, D. Determination of Structural Carbohydrates and Lignin in Biomass; National Renewable Energy Laboratory: Golden, CO, USA, 2012.
  32. Cameron, M.C.; Ross, A.G.; Percival, E.G.V. Methods for the Routine Estimation of Mannitol, Alginic Acid, and Combined Fucose in Seaweeds. J. Chem. Technol. Biotechnol. 1948, 67, 161–164. [Google Scholar] [CrossRef]
  33. International Organization for Standardization Solid Biofuels—Determination of Moisture Content—Oven Dry Method—Part 2: Total Moisture—Simplified Method. Available online: https://www.iso.org/fr/standard/86024.html (accessed on 10 April 2024).
  34. International Organization for Standardization Solid Biofuels—Determination of Ash Content. Available online: https://www.iso.org/fr/standard/83190.html (accessed on 2 July 2023).
  35. International Organization for Standardization Starches and Derived Products—Determination of Nitrogen Content by the Kjeldahl Method—Titrimetric Method. Available online: https://www.iso.org/fr/standard/8379.html (accessed on 2 July 2023).
  36. Commission of the European Communities. COMMISSION DIRECTIVE 98/64/EC of 3 September 1998 Establishing Community Methods of Analysis for the Determination of Aminoacids, Crude Oils and Fats, and Olaquindox in Feedingstuffs and Amending Directive 71/393/EEC; Commission of the European Communities: Brussels, Belgium, 1998. [Google Scholar]
  37. Folch, J.; Lees, M.; Stanley, G.H.S. A simple method for the isolation and purification of total lipides from animal tissues. J. Biol. Chem. 1957, 226, 497–509. [Google Scholar] [CrossRef] [PubMed]
  38. International Organization for Standardization Animal and Vegetable Fats and Oils—Gas Chromatography of Fatty Acid Methyl Esters—Part 3: Preparation of Methyl Esters Using Trimethylsulfonium Hydroxide (TMSH). Available online: https://www.iso.org/fr/standard/70249.html (accessed on 2 July 2023).
  39. Perez, R.; Kaas, R.; Campello, F.; Arbault, S.; Barbaroux, O. La Culture des Algues Marines dans le Monde; Institut Français de Recherche pour l’Exploitation de la Mer, Ed.; IFREMER: Plouzané, France, 1992; ISBN 978-2-905434-41-8. [Google Scholar]
  40. Salachna, P.; Grzeszczuk, M.; Meller, E.; Soból, M. Oligo-Alginate with Low Molecular Mass Improves Growth and Physiological Activity of Eucomis Autumnalis under Salinity Stress. Molecules 2018, 23, 812. [Google Scholar] [CrossRef] [PubMed]
  41. Rashid, T.; Kait, C.F.; Murugesan, T. A “Fourier Transformed Infrared” Compound Study of Lignin Recovered from a Formic Acid Process. Procedia Eng. 2016, 148, 1312–1319. [Google Scholar] [CrossRef]
  42. Oyesiku, O.O.; Egunyomi, A. Identification and Chemical Studies of Pelagic Masses of Sargassum natans (Linnaeus) Gaillon and S. fluitans (Borgessen) Borgesen (Brown Algae), Found Offshore in Ondo State, Nigeria. Afr. J. Biotechnol. 2014, 13, 1188–1193. [Google Scholar] [CrossRef]
  43. Torres-Conde, E.G.; van Tussenbroek, B.I.; Rodríguez-Martínez, R.E.; Martínez-Daranas, B. Temporal Changes in the Composition of Beached Holopelagic Sargassum spp. along the Northwestern Coast of Cuba. Phycology 2023, 3, 405–412. [Google Scholar] [CrossRef]
  44. Alleyne, K.S.T.; Johnson, D.; Neat, F.; Oxenford, H.A.; Vallès, H. Seasonal Variation in Morphotype Composition of Pelagic Sargassum Influx Events Is Linked to Oceanic Origin. Sci. Rep. 2023, 13, 3753. [Google Scholar] [CrossRef] [PubMed]
  45. Machado, C.B.; Maddix, G.-M.; Francis, P.; Thomas, S.-L.; Burton, J.-A.; Langer, S.; Larson, T.R.; Marsh, R.; Webber, M.; Tonon, T. Pelagic Sargassum Events in Jamaica: Provenance, Morphotype Abundance, and Influence of Sample Processing on Biochemical Composition of the Biomass. Sci. Total Environ. 2022, 817, 152761. [Google Scholar] [CrossRef]
  46. Schell, J.M.; Goodwin, D.S.; Volk, R.H.; Siuda, A.N.S. Preliminary Explorations of Environmental Tolerances and Growth Rates of Holopelagic Sargassum Morphotypes. Aquat. Bot. 2024, 190, 103723. [Google Scholar] [CrossRef]
  47. Davis, D.; Simister, R.; Campbell, S.; Marston, M.; Bose, S.; McQueen-Mason, S.J.; Gomez, L.D.; Gallimore, W.A.; Tonon, T. Biomass Composition of the Golden Tide Pelagic Seaweeds Sargassum fluitans and S. natans (Morphotypes I and VIII) to Inform Valorisation Pathways. Sci. Total Environ. 2021, 762, 143134. [Google Scholar] [CrossRef] [PubMed]
  48. Ortega-Flores, P.A.; Serviere-Zaragoza, E.; De Anda-Montañez, J.A.; Freile-Pelegrín, Y.; Robledo, D.; Méndez-Rodríguez, L.C. Trace Elements in Pelagic Sargassum Species in the Mexican Caribbean: Identification of Key Variables Affecting Arsenic Accumulation in S. fluitans. Sci. Total Environ. 2022, 806, 150657. [Google Scholar] [CrossRef] [PubMed]
  49. Olguin-Maciel, E.; Leal-Bautista, R.M.; Alzate-Gaviria, L.; Domínguez-Maldonado, J.; Tapia-Tussell, R. Environmental Impact of Sargassum spp. Landings: An Evaluation of Leachate Released from Natural Decomposition at Mexican Caribbean Coast. Environ. Sci. Pollut. Res. 2022, 29, 91071–91080. [Google Scholar] [CrossRef] [PubMed]
  50. Brust, G.E. Management Strategies for Organic Vegetable Fertility. In Safety and Practice for Organic Food; Elsevier: Amsterdam, The Netherlands, 2019; pp. 193–212. ISBN 978-0-12-812060-6. [Google Scholar]
  51. Mæhre, H.; Dalheim, L.; Edvinsen, G.; Elvevoll, E.; Jensen, I.-J. Protein Determination—Method Matters. Foods 2018, 7, 5. [Google Scholar] [CrossRef] [PubMed]
  52. Sosulski, F.W.; Imafidon, G.I. Amino Acid Composition and Nitrogen-to-Protein Conversion Factors for Animal and Plant Foods. J. Agric. Food Chem. 1990, 38, 1351–1356. [Google Scholar] [CrossRef]
  53. Angell, A.R.; Mata, L.; de Nys, R.; Paul, N.A. The Protein Content of Seaweeds: A Universal Nitrogen-to-Protein Conversion Factor of Five. J. Appl. Phycol. 2016, 28, 511–524. [Google Scholar] [CrossRef]
  54. Mohammed, A.; Rivers, A.; Stuckey, D.C.; Ward, K. Alginate Extraction from Sargassum Seaweed in the Caribbean Region: Optimization Using Response Surface Methodology. Carbohydr. Polym. 2020, 245, 116419. [Google Scholar] [CrossRef] [PubMed]
  55. Gordillo Sierra, A.R.; Amador-Castro, L.F.; Ramírez-Partida, A.E.; García-Cayuela, T.; Carrillo-Nieves, D.; Alper, H.S. Valorization of Caribbean Sargassum Biomass as a Source of Alginate and Sugars for de Novo Biodiesel Production. J. Environ. Manag. 2022, 324, 116364. [Google Scholar] [CrossRef] [PubMed]
  56. Karim, H.; Ahmad, A.; Natzir, R.; Massi, M.N.; Arfah, R.; Asmi, N.; Karim, A. Isolation and Identification of Bioactive Proteins from the Brown Algae Sargassum, Sp. and Their Potential as Anticancer Agents. J. Phys. Conf. Ser. 2019, 1341, 032009. [Google Scholar] [CrossRef]
  57. O’ Connor, J.; Meaney, S.; Williams, G.A.; Hayes, M. Extraction of Protein from Four Different Seaweeds Using Three Different Physical Pre-Treatment Strategies. Molecules 2020, 25, 2005. [Google Scholar] [CrossRef] [PubMed]
  58. van Ginneken, V.J.; Helsper, J.P.; de Visser, W.; van Keulen, H.; Brandenburg, W.A. Polyunsaturated Fatty Acids in Various Macroalgal Species from North Atlantic and Tropical Seas. Lipids Health Dis. 2011, 10, 104. [Google Scholar] [CrossRef]
  59. Christie, W.W.; Han, X. Lipid Analysis: Isolation, Separation, Identification and Lipidomic Analysis, 4th ed.; The Oily Press Lipid Library; The Oily Press, PJ Barnes & Associates: Bridgwater, UK, 2010; ISBN 978-0-9552512-4-5. [Google Scholar]
  60. Harrysson, H.; Krook, J.L.; Larsson, K.; Tullberg, C.; Oerbekke, A.; Toth, G.; Pavia, H.; Undeland, I. Effect of Storage Conditions on Lipid Oxidation, Nutrient Loss and Colour of Dried Seaweeds, Porphyra Umbilicalis and Ulva Fenestrata, Subjected to Different Pretreatments. Algal Res. 2021, 56, 102295. [Google Scholar] [CrossRef]
  61. Schmid, M.; Guihéneuf, F.; Stengel, D.B. Evaluation of Food Grade Solvents for Lipid Extraction and Impact of Storage Temperature on Fatty Acid Composition of Edible Seaweeds Laminaria digitata (Phaeophyceae) and Palmaria palmata (Rhodophyta). Food Chem. 2016, 208, 161–168. [Google Scholar] [CrossRef] [PubMed]
  62. Garcia-Perez, P.; Lourenço-Lopes, C.; Silva, A.; Pereira, A.G.; Fraga-Corral, M.; Zhao, C.; Xiao, J.; Simal-Gandara, J.; Prieto, M.A. Pigment Composition of Nine Brown Algae from the Iberian Northwestern Coastline: Influence of the Extraction Solvent. Mar. Drugs 2022, 20, 113. [Google Scholar] [CrossRef] [PubMed]
  63. Wang, M.; Hu, C.; Cannizzaro, J.; English, D.; Han, X.; Naar, D.; Lapointe, B.; Brewton, R.; Hernandez, F. Remote Sensing of Sargassum Biomass, Nutrients, and Pigments. Geophys. Res. Lett. 2018, 45, 12359–12367. [Google Scholar] [CrossRef]
  64. Davis, T.A.; Volesky, B.; Mucci, A. A Review of the Biochemistry of Heavy Metal Biosorption by Brown Algae. Water Res. 2003, 37, 4311–4330. [Google Scholar] [CrossRef] [PubMed]
  65. del Río, P.G.; Domínguez, E.; Domínguez, V.D.; Romaní, A.; Domingues, L.; Garrote, G. Third Generation Bioethanol from Invasive Macroalgae Sargassum muticum Using Autohydrolysis Pretreatment as First Step of a Biorefinery. Renew. Energy 2019, 141, 728–735. [Google Scholar] [CrossRef]
  66. Aparicio, E.; Rodríguez-Jasso, R.M.; Pinales-Márquez, C.D.; Loredo-Treviño, A.; Robledo-Olivo, A.; Aguilar, C.N.; Kostas, E.T.; Ruiz, H.A. High-Pressure Technology for Sargassum Spp Biomass Pretreatment and Fractionation in the Third Generation of Bioethanol Production. Bioresour. Technol. 2021, 329, 124935. [Google Scholar] [CrossRef] [PubMed]
  67. Bonilla Loaiza, A.M.; Rodríguez-Jasso, R.M.; Belmares, R.; López-Badillo, C.M.; Araújo, R.G.; Aguilar, C.N.; Chávez, M.L.; Aguilar, M.A.; Ruiz, H.A. Fungal Proteins from Sargassum spp. Using Solid-State Fermentation as a Green Bioprocess Strategy. Molecules 2022, 27, 3887. [Google Scholar] [CrossRef] [PubMed]
  68. Rhein-Knudsen, N.; Ale, M.T.; Ajalloueian, F.; Meyer, A.S. Characterization of Alginates from Ghanaian Brown Seaweeds: Sargassum spp. and Padina spp. Food Hydrocoll. 2017, 71, 236–244. [Google Scholar] [CrossRef]
  69. Hasnain, M.S.; Nayak, A.K. (Eds.) Alginates: Versatile Polymers in Biomedical Applications and Therapeutics, 1st ed.; Apple Academic Press: Palm Bay, FL, USA, 2019; ISBN 978-0-429-02343-9. [Google Scholar]
  70. Bi, D.; Yang, X.; Yao, L.; Hu, Z.; Li, H.; Xu, X.; Lu, J. Potential Food and Nutraceutical Applications of Alginate: A Review. Mar. Drugs 2022, 20, 564. [Google Scholar] [CrossRef] [PubMed]
  71. de Souza Coração, A.C.; dos Santos, F.S.; Duarte, J.A.D.; Lopes-Filho, E.A.P.; De-Paula, J.C.; Rocha, L.M.; Krepsky, N.; Fiaux, S.B.; Teixeira, V.L. What Do We Know about the Utilization of the Sargassum Species as Biosorbents of Trace Metals in Brazil? J. Environ. Chem. Eng. 2020, 8, 103941. [Google Scholar] [CrossRef]
  72. Chale-Dzul, J.; Pérez-Cabeza de Vaca, R.; Quintal-Novelo, C.; Olivera-Castillo, L.; Moo-Puc, R. Hepatoprotective Effect of a Fucoidan Extract from Sargassum fluitans Borgesen against CCl4-Induced Toxicity in Rats. Int. J. Biol. Macromol. 2020, 145, 500–509. [Google Scholar] [CrossRef] [PubMed]
  73. Fernando, I.P.S.; Sanjeewa, K.K.A.; Lee, H.G.; Kim, H.-S.; Vaas, A.P.J.P.; De Silva, H.I.C.; Nanayakkara, C.M.; Abeytunga, D.T.U.; Lee, W.W.; Lee, D.-S.; et al. Characterization and Cytoprotective Properties of Sargassum natans Fucoidan against Urban Aerosol-Induced Keratinocyte Damage. Int. J. Biol. Macromol. 2020, 159, 773–781. [Google Scholar] [CrossRef] [PubMed]
  74. Kadam, S.U.; Tiwari, B.K.; O’Donnell, C.P. Extraction, Structure and Biofunctional Activities of Laminarin from Brown Algae. Int. J. Food Sci. Technol. 2015, 50, 24–31. [Google Scholar] [CrossRef]
  75. Zhang, R.; Zhang, X.; Tang, Y.; Mao, J. Composition, Isolation, Purification and Biological Activities of Sargassum fusiforme Polysaccharides: A Review. Carbohydr. Polym. 2020, 228, 115381. [Google Scholar] [CrossRef] [PubMed]
  76. Alzate-Gaviria, L.; Domínguez-Maldonado, J.; Chablé-Villacís, R.; Olguin-Maciel, E.; Leal-Bautista, R.M.; Canché-Escamilla, G.; Caballero-Vázquez, A.; Hernández-Zepeda, C.; Barredo-Pool, F.A.; Tapia-Tussell, R. Presence of Polyphenols Complex Aromatic “Lignin” in Sargassum spp. from Mexican Caribbean. J. Mar. Sci. Eng. 2020, 9, 6. [Google Scholar] [CrossRef]
  77. Chen, H. Lignocellulose Biorefinery Feedstock Engineering. In Lignocellulose Biorefinery Engineering–Principles and Applications, 1st ed.; Woodhead Publishing: Sawston, UK, 2015; pp. 37–86. ISBN 978-0-08-100145-5. [Google Scholar]
  78. Weng, J.; Chapple, C. The Origin and Evolution of Lignin Biosynthesis. New Phytol. 2010, 187, 273–285. [Google Scholar] [CrossRef] [PubMed]
  79. Alzagameem, A.; Khaldi-Hansen, B.; Büchner, D.; Larkins, M.; Kamm, B.; Witzleben, S.; Schulze, M. Lignocellulosic Biomass as Source for Lignin-Based Environmentally Benign Antioxidants. Molecules 2018, 23, 2664. [Google Scholar] [CrossRef] [PubMed]
  80. Nagasawa, N.; Mitomo, H.; Yoshii, F.; Kume, T. Radiation-Induced Degradation of Sodium Alginate. Polym. Degrad. Stab. 2000, 69, 279–285. [Google Scholar] [CrossRef]
  81. Wasikiewicz, J.M.; Yoshii, F.; Nagasawa, N.; Wach, R.A.; Mitomo, H. Degradation of Chitosan and Sodium Alginate by Gamma Radiation, Sonochemical and Ultraviolet Methods. Radiat. Phys. Chem. 2005, 73, 287–295. [Google Scholar] [CrossRef]
  82. Borines, M.G.; de Leon, R.L.; Cuello, J.L. Bioethanol Production from the Macroalgae Sargassum spp. Bioresour. Technol. 2013, 138, 22–29. [Google Scholar] [CrossRef]
  83. Groisillier, A.; Shao, Z.; Michel, G.; Goulitquer, S.; Bonin, P.; Krahulec, S.; Nidetzky, B.; Duan, D.; Boyen, C.; Tonon, T. Mannitol Metabolism in Brown Algae Involves a New Phosphatase Family. EXBOTJ 2014, 65, 559–570. [Google Scholar] [CrossRef] [PubMed]
  84. Komoe, K.; Sankare, Y.; Fofie, N.B.Y.; Bamba, A.; SAHR, A.G.-S. Taxonomic Study of Two Species of Sargassum: Sargassum fluitans (Børgesen) Børgesen and Sargassum natans (Linnaneus) Gaillon (Brown Algae) Collected in Côte d’Ivoire Coasts, West Africa. Nat. Sci. 2016, 14, 50–56. [Google Scholar] [CrossRef]
  85. Saha, B.C.; Racine, F.M. Biotechnological Production of Mannitol and Its Applications. Appl. Microbiol. Biotechnol. 2011, 89, 879–891. [Google Scholar] [CrossRef] [PubMed]
  86. Imbs, T.I.; Zvyagintseva, T.N. Phlorotannins Are Polyphenolic Metabolites of Brown Algae. Russ. J. Mar. Biol. 2018, 44, 263–273. [Google Scholar] [CrossRef]
  87. Saldarriaga-Hernandez, S.; Melchor-Martínez, E.M.; Carrillo-Nieves, D.; Parra-Saldívar, R.; Iqbal, H.M.N. Seasonal Characterization and Quantification of Biomolecules from Sargassum Collected from Mexican Caribbean Coast—A Preliminary Study as a Step Forward to Blue Economy. J. Environ. Manag. 2021, 298, 113507. [Google Scholar] [CrossRef] [PubMed]
  88. Subbiah, V.; Duan, X.; Agar, O.T.; Dunshea, F.R.; Barrow, C.J.; Suleria, H.A.R. Comparative Study on the Effect of Different Drying Techniques on Phenolic Compounds in Australian Beach-Cast Brown Seaweeds. Algal Res. 2023, 72, 103140. [Google Scholar] [CrossRef]
  89. Zhao, T.; Dong, Q.; Zhou, H.; Yang, H. Drying Kinetics, Physicochemical Properties, Antioxidant Activity and Antidiabetic Potential of Sargassum fusiforme Processed under Four Drying Techniques. LWT 2022, 163, 113578. [Google Scholar] [CrossRef]
  90. Le Lann, K.; Jégou, C.; Stiger-Pouvreau, V. Effect of Different Conditioning Treatments on Total Phenolic Content and Antioxidant Activities in Two Sargassacean Species: Comparison of the Frondose Sargassum muticum (Yendo) Fensholt and the Cylindrical Bifurcaria bifurcata R. Ross. Phycol. Res. 2008, 56, 238–245. [Google Scholar] [CrossRef]
  91. Charles, A.L.; Sridhar, K.; Alamsjah, M.A. Effect of Drying Techniques on Color and Bioactive Potential of Two Commercial Edible Indonesian Seaweed Cultivars. J. Appl. Phycol. 2020, 32, 563–572. [Google Scholar] [CrossRef]
  92. Uribe, E.; Pardo-Orellana, C.M.; Vega-Gálvez, A.; Ah-Hen, K.S.; Pastén, A.; García, V.; Aubourg, S.P. Effect of Drying Methods on Bioactive Compounds, Nutritional, Antioxidant, and Antidiabetic Potential of Brown Alga Durvillaea antarctica. Dry. Technol. 2020, 38, 1915–1928. [Google Scholar] [CrossRef]
  93. Amsler, C.D.; Fairhead, V.A. Defensive and Sensory Chemical Ecology of Brown Algae. In Advances in Botanical Research; Elsevier: Amsterdam, The Netherlands, 2005; Volume 43, pp. 1–91. ISBN 978-0-12-005943-0. [Google Scholar]
  94. Stiger, V.; Deslandes, E.; Payri, C.E. Phenolic Contents of Two Brown Algae, Turbinaria Ornata and Sargassum mangarevense on Tahiti (French Polynesia): Interspecific, Ontogenic and Spatio-Temporal Variations. Bot. Mar. 2004, 47, 402–409. [Google Scholar] [CrossRef]
  95. Fernandez, A.; Singh, A.; Jaffé, R. A Literature Review on Trace Metals and Organic Compounds of Anthropogenic Origin in the Wider Caribbean Region. Mar. Pollut. Bull. 2007, 54, 1681–1691. [Google Scholar] [CrossRef]
  96. Idota, Y.; Kogure, Y.; Kato, T.; Yano, K.; Arakawa, H.; Miyajima, C.; Kasahara, F.; Ogihara, T. Relationship between Physical Parameters of Various Metal Ions and Binding Affinity for Alginate. Biol. Pharm. Bull. 2016, 39, 1893–1896. [Google Scholar] [CrossRef]
  97. Mohammed, C.; Lalgee, L.; Kistow, M.; Jalsa, N.; Ward, K. On the Binding Affinity and Thermodynamics of Sodium Alginate-Heavy Metal Ion Interactions for Efficient Adsorption. Carbohydr. Polym. Technol. Appl. 2022, 3, 100203. [Google Scholar] [CrossRef]
  98. Lim, Y.-C.; Chen, C.-F.; Tsai, M.-L.; Wu, C.-H.; Lin, Y.-L.; Wang, M.-H.; Albarico, F.P.J.B.; Chen, C.-W.; Dong, C.-D. Impacts of Fishing Vessels on the Heavy Metal Contamination in Sediments: A Case Study of Qianzhen Fishing Port in Southern Taiwan. Water 2022, 14, 1174. [Google Scholar] [CrossRef]
  99. Rodríguez-Martínez, R.E.; Roy, P.D.; Torrescano-Valle, N.; Cabanillas-Terán, N.; Carrillo-Domínguez, S.; Collado-Vides, L.; García-Sánchez, M.; van Tussenbroek, B.I. Element Concentrations in Pelagic Sargassum along the Mexican Caribbean Coast in 2018–2019. PeerJ 2020, 8, e8667. [Google Scholar] [CrossRef] [PubMed]
  100. European Commission. COMMISSION REGULATION (EU) 2019/1869 of 7 November 2019 Amending and Correcting Annex I to Directive 2002/32/EC of the European Parliament and of the Council as Regards Maximum Levels for Certain Undesirable Substances in Animal Feed; European Commission: Brussels, Belgium, 2019. [Google Scholar]
Figure 1. Localities in the Caribbean where the different batches of Sargassum seaweed were collected: Guadeloupe (a) and Dominican Republic (b). (Map background: d-maps.com).
Phycology 04 00011 g001
Figure 2. Graphical abstract of the characterisation scheme showing all the analytic steps of each protocol implemented in this study for the analysis of ashes, structural carbohydrates, alginates, mannitol, crude lipids, fatty acids profiles, polyphenols, mannitol, heavy metals, organic nitrogen (Kjeldahl), amino acids profiles, and CHN content.
Phycology 04 00011 g002
Figure 3. Schematic representation of the NREL protocol, consisting of water and an ethanol extraction, used to determine the polyphenol content by Folin’s method, followed by acid hydrolysis, which gives a filtrate in which depolymerised structural carbohydrates are analysed by HPLC-DAD, and a residue, analysed by IR and UV-visible spectrometry.
Phycology 04 00011 g003
Figure 4. Relative amino acid profiles (%) of the nine Sargassum batches represented with different colors for each batch. Standard deviations are represented on the histogram for each value.
Phycology 04 00011 g004
Figure 5. Linear regression between %AA and %NKjeldahl (a) and %AA and %NCHN (b).
Phycology 04 00011 g005
Figure 6. Infrared (a) and UV-vis (b) spectra of commercial alginate, commercial alginate AIR, Sargassum AIR, lignin Organosolv, and lignin Organosolv AIR. Dashed lines correspond to similar wavenumber or wavelength peaks between different samples.
Phycology 04 00011 g006
Figure 7. Average composition of the nine seaweed batches (Mean ± SD).
Phycology 04 00011 g007
Table 1. Description of the nine batches of Sargassum seaweeds. XX: sampling area, b/p: harvested on a beach/port; w/f: whole plant/floats; n/s: native/one-month stored; 2X: year of sampling.
Sample CodeLocation of HarvestHarvest Date
DPbwn21Dominican Republic, Punta CanaOctober 2021
GLbwn21Guadeloupe, Le GosierSeptember 2021
GVbwn21Guadeloupe, Vieux HabitantsJune 2021
GBbwn22Guadeloupe, Bouillante en merJanuary 2022
GFpwn22Guadeloupe, Saint Felix seaportJuly 2022
MGbwn22Marie Galante, Plage des GaletsJune 2022
MGbfn22Marie Galante, Plage des GaletsJune 2022
MCbwn22Marie Galante, CapesterreJune 2022
MCbws22Marie Galante, CapesterreJune 2022
Table 2. Overall composition of the nine Sargassum batches (Mean ± SD). All the results pertaining to Sargassum composition except TPC are in %DW of the seaweed. Exponent letters on each line express the significant differences observed in ANOVA analyses. Exponent letters refer to Tukey’s HSD test.
DPbwn21GLbwn21GVbwn21GBbwn22GFpwn22MGbwn22MGbfn22MCbwn22MCbws22
Proximate analysis
Dry matter (%)83.30 ± 0.1582.21 ± 0.1084.80 ± 0.0682.59 ± 0.1986.23 ± 0.2987.45 ± 0.2085.80 ± 0.1186.09 ± 0.4085.69 ± 0.12
Mineral matter15.49 ± 0.4116.18 ± 0.5714.81 ± 0.2519.86 ± 0.5314.48 ± 0.6414.79 ± 0.4017.06 ± 0.2516.99 ± 0.3918.55 ± 0.73
C38.75 ± 0.0237.28 ± 0.1337.44 ± 0.1636.82 ± 0.3337.10 ± 0.1338.89 ± 0.0335.53 ± 0.0737.22 ± 0.0137.86 ± 0.08
H6.28 ± 0.175.39 ± 0.035.47 ± 0.045.88 ± 0.096.59 ± 0.165.94 ± 0.025.41 ± 0.095.41 ± 0.025.88 ± 0.05
N1.10 ± 0.100.98 ± 0.011.13 ± 0.111.25 ± 0.051.01 ± 0.021.00 ± 0.060.86 ± 0.081.13 ± 0.051.39 ± 0.02
Proteins
Kjeldahl organic Nitrogen0.95 ± 0.011.01 ± 0.010.98 ± 0.011.18 ± 0.010.97 ± 0.010.86 ± 0.010.74 ± 0.011.05 ± 0.011.17 ± 0.01
Kjeldahl Proteins6.19 ± 0.06 e6.59 ± 0.05 c6.38 ± 0.02 d7.69 ± 0.08 a6.30 ± 0.02 de5.58 ± 0.08 f4.80 ± 0.02 g6.88 ± 0.02 b7.64 ± 0.06 a
Total amino acids5.27 ± 0.05 cd5.40 ± 0.07 c5.20 ± 0.14 cd6.11 ± 0.05 ab5.05 ± 0.22 d4.37 ± 0.07 e3.86 ± 0.04 f5.88 ± 0.10 b6.32 ± 0.14 a
Nitrogen in AA (%)15.40 ± 0.0615.47 ± 0.0215.46 ± 0.0215.47 ± 0.0415.21 ± 0.4214.58 ± 0.0714.04 ± 0.0215.39 ± 0.0415.41 ± 0.03
N/Protein conversion factor (Nprot)6.49 ± 0.036.46 ± 0.016.47 ± 0.016.46 ± 0.026.58 ± 0.186.86 ± 0.037.12 ± 0.016.50 ± 6.506.49 ± 0.01
Lipids
Total lipid content0.50 ± 0.05 c0.81 ± 0.01 b0.58 ± 0.01 c0.28 ± 0.16 d1.05 ± 0.07 a1.10 ± 0.02 a0.40 ± 0.01 cd0.63 ± 0.08 bc1.03 ± 0.06 a
Total FAME0.14 ± 0.010.22 ± 0.010.14 ± 0.010.03 ± 0.010.32 ± 0.010.34 ± 0.010.10 ± 0.010.16 ± 0.010.28 ± 0.01
Carbohydrates
Glucan17.26 ± 0.64 bcd14.59 ± 2.37 cd15.94 ± 3.31 d16.94 ± 0.66 bcd19.74 ± 0.69 abc22.00 ± 0.40 a20.68 ± 1.17 ab20.44 ± 0.92 abc20.83 ± 1.86 ab
Fucan8.99 ± 0.21 de10.25 ± 0.11 bc11.28 ± 0.29 b12.63 ± 0.26 a8.21 ± 0.01 e8.42 ± 0.60 e9.55 ± 0.12 cd9.22 ± 0.56 cde9.23 ± 0.64 cde
AIR23.8 ± 1.4 ab24.8 ± 0.5 ab25.1 ± 0.1 ab25.8 ± 1.4 ab23.4 ± 0.5 b26.4 ± 0.3 a23.7 ± 1.0 b25.9 ± 0.7 ab23.2 ± 1.5 b
Alginate content25.83 ± 6.89 ab23.05 ± 1.14 ab25.45 ± 1.28 ab30.19 ± 1.80 a17.75 ± 0.44 b17.88 ± 1.57 b19.00 ± 4.32 b19.21 ± 1.40 b17.82 ± 3.24 b
Mannitol2.47 ± 0.09 ab2.24 ± 0.07 abc2.00 ± 0.27 bcd1.95 ± 0.08 cd2.80 ± 0.20 a2.53 ± 0.43 ab1.60 ± 0.08 d2.18 ± 0.15 bc2.14 ± 0.09 bc
TPC
(mg/g GAE)
10.79 ± 0.33 ab10.75 ± 0.31 ab8.12 ± 0.47 cd8.08 ± 0.22cd9.95 ± 0.20 b11.02 ± 0.29 a8.70 ± 0.29 c7.45 ± 0.22 d8.20 ± 0.36 cd
Table 3. Fatty acids profile of the Sargassum batches. Each fatty acid is expressed as relative percentage of total FAME content. Proportion of FAME relative to total lipids and dry weight is also expressed (Mean ± SD). n.d.: non-detected.
DPbwn21GLbwn21GVbwn21GBbwn22GFpwn22MGbwn22MGbfn22MCbwn22MCbws22
C12:00.44 ± 0.070.76 ± 0.440.58 ± 0.111.04 ± 0.430.83 ± 0.850.45 ± 0.171.68 ± 0.640.58 ± 0.470.67 ± 0.34
C13:00.20 ± 0.07n.d.0.04 ± 0.06n.d.0.13 ± 0.010.21 ± 0.030.12 ± 0.100.11 ± 0.090.04 ± 0.07
C14:01.82 ± 0.203.85 ± 0.213.36 ± 0.062.15 ± 0.873.78 ± 0.203.57 ± 0.132.98 ± 0.202.97 ± 0.123.22 ± 0.42
C14:1n-50.31 ± 0.080.15 ± 0.130.06 ± 0.100.27 ± 0.460.09 ± 0.080.08 ± 0.070.42 ± 0.030.32 ± 0.010.14 ± 0.12
C16:035.11 ± 4.0455.57 ± 2.1853.22 ± 1.1437.97 ± 4.9246.09 ± 2.4741.09 ± 0.7341.33 ± 2.0857.33 ± 2.4948.75 ± 0.70
C16:1n-72.74 ± 0.377.39 ± 0.125.65 ± 0.162.09 ± 0.465.47 ± 0.266.38 ± 0.154.79 ± 0.113.11 ± 0.214.49 ± 0.08
C17:00.44 ± 0.16n.d.0.40 ± 0.340.50 ± 0.860.57 ± 0.500.54 ± 0.070.69 ± 0.600.59 ± 0.120.51 ± 0.06
C17:10.06 ± 0.05n.d.n.d.n.d.n.d.n.d.n.d.0.04 ± 0.060.07 ± 0.07
C18:06.79 ± 0.932.57 ± 0.273.74 ± 0.0711.74 ± 3.933.86 ± 0.403.02 ± 0.238.69 ± 0.965.39 ± 0.293.99 ± 0.05
C18:1n-9t0.56 ± 0.04n.d.0.10 ± 0.18n.d.0.40 ± 0.050.29 ± 0.06n.d.0.09 ± 0.16n.d.
C18:1n-924.57 ± 1.3816.56 ± 0.0618.84 ± 2.2214.61 ± 2.1017.15 ± 0.7617.32 ± 1.6619.80 ± 3.7712.30 ± 0.4616.63 ± 0.60
C18:2n-6t0.34 ± 0.061.13 ± 0.140.61 ± 0.54n.d.0.71 ± 0.651.00 ± 0.881.31 ± 0.110.55 ± 0.150.84 ± 0.12
C18:2n-615.89 ± 1.123.38 ± 3.425.40 ± 0.1112.15 ± 6.156.38 ± 0.367.87 ± 0.3510.68 ± 0.055.39 ± 0.666.06 ± 0.10
C18:3n-6n.d.n.d.n.d.n.d.0.16 ± 0.010.26 ± 0.01n.d.n.d.0.11 ± 0.19
C20:00.42 ± 0.380.39 ± 0.330.20 ± 0.35n.d.0.48 ± 0.080.34 ± 0.020.36 ± 0.310.39 ± 0.340.28 ± 0.24
C18:3n-3a6.11 ± 4.38n.d.1.41 ± 0.32n.d.3.37 ± 0.643.91 ± 0.140.96 ± 0.023.27 ± 2.692.74 ± 0.31
C22:02.36 ± 0.267.98 ± 0.035.90 ± 0.13n.d.9.66 ± 0.3012.76 ± 0.244.03 ± 0.086.36 ± 0.3010.54 ± 0.19
Saturated49.42 ± 6.571.39 ± 3.5767.92 ± 1.5671.78 ± 4.0066.27 ± 2.1362.74 ± 1.5162.05 ± 3.7174.93 ± 3.4568.93 ± 0.60
Mono-
unsaturated
28.24 ± 0.9424.11 ± 0.0324.65 ± 2.0416.96 ± 1.7623.12 ± 0.5624.21 ± 1.4025.01 ± 3.6415.86 ± 0.3521.33 ± 0.48
Poly-
Unsaturated
22.33 ± 5.564.51 ± 3.567.42 ± 0.8212.15 ± 6.1510.61 ± 1.5813.04 ± 0.6412.95 ± 0.099.21 ± 3.289.75 ± 0.42
FAME/
Total lipid (%)
17.04 ± 1.6237.24 ± 1.9027.40 ± 2.7711.79 ± 6.9730.19 ± 2.1931.09 ± 0.9924.00 ± 1.1725.24 ± 3.3426.8 ± 1.74
Total
%DW
0.138 ± 0.0130.216 ± 0.0110.137 ± 0.0020.033 ± 0.0050.317 ± 0.0900.342 ± 0.0090.096 ± 0.0040.159 ± 0.0060.276 ± 0.008
Table 4. Concentration of different elements in Sargassum samples (µg·kg−1 DW for Hg, mg·kg−1 DW for other elements).
DPbwn21GLbwn21GVbwn21GBbwn22GFpwn22MGbwn22MGbfn22MCbwn22MCbws22
Na13,182 ± 5097819 ± 835528 ± 1166835 ± 1169066 ± 3226833 ± 18217,001 ± 2738227 ± 2158808 ± 191
Mg8229 ± 26010,010 ± 12811,244 ± 25811,802 ± 1988991 ± 2569799 ± 5015,111 ± 11811,181 ± 23411,400 ± 260
S14,609 ± 76614,692 ± 42914,806 ± 38815,260 ± 57914,317 ± 70814,888 ± 46916,380 ± 39316,213 ± 28817,299 ± 595
Ca44,315 ± 80555,616 ± 86862,398 ± 29863,698 ± 18043,208 ± 125348,415 ± 6753,980 ± 37759,024 ± 104460,833 ± 1378
Cr0.595 ± 0.0070.592 ± 0.0150.857 ± 0.0010.903 ± 0.0152.222 ± 0.0250.571 ± 0.0110.916 ± 0.0200.506 ± 0.0020.737 ± 0.012
Co1.096 ± 0.0100.457 ± 0.0060.824 ± 0.0031.224 ± 0.0140.686 ± 0.0150.662 ± 0.0060.517 ± 0.0070.593 ± 0.0040.611 ± 0.014
Ni5.806 ± 0.0875.277 ± 0.0374.497 ± 0.0415.061 ± 0.0576.582 ± 0.1395.391 ± 0.0735.496 ± 0.0454.104 ± 0.0334.223 ± 0.047
Cu4.361 ± 0.0874.134 ± 0.01810.650 ± 0.1719.762 ± 0.0604.236 ± 0.0693.516 ± 0.0063.322 ± 0.0442.362 ± 0.0182.495 ± 0.022
Zn6.726 ± 0.0403.726 ± 0.03159.419 ± 0.91747.667 ± 0.2025.337 ± 0.0254.786 ± 0.09814.180 ± 0.0602.860 ± 0.0363.401 ± 0.078
As48.280 ± 0.06553.223 ± 0.43416.764 ± 0.47617.597 ± 0.18485.979 ± 1.02689.379 ± 0.67419.062 ± 0.25417.968 ± 0.18817.719 ± 0.374
Cd0.660 ± 0.0040.587 ± 0.0280.694 ± 0.0030.849 ± 0.0180.765 ± 0.0040.739 ± 0.0030.471 ± 0.0060.598 ± 0.0061.182 ± 0.021
Pb0.232 ± 0.0020.712 ± 0.0050.388 ± 0.0050.488 ± 0.0110.440 ± 0.0040.348 ± 0.0061.551 ± 0.0040.534 ± 0.0080.394 ± 0.005
Hg8.790 ± 1.0347.687 ± 0.90410.568 ± 1.24311.157 ± 1.3136.278 ± 0.7394.514 ± 0.5314.86 ± 0.5724.434 ± 0.5226.872 ± 0.809
Disclaimer/Publisher’s Note: The statements, opinions and data contained in all publications are solely those of the individual author(s) and contributor(s) and not of MDPI and/or the editor(s). MDPI and/or the editor(s) disclaim responsibility for any injury to people or property resulting from any ideas, methods, instructions or products referred to in the content.

