Article

Light-Emitting Diode Illumination Enhances Biomass, Pigment, and Lipid Production in Halotolerant Cyanobacterium Aphanothece halophytica

by
Sitthichai Thongtha
1,
Chokchai Kittiwongwattana
1,
Aran Incharoensakdi
2,3 and
Saranya Phunpruch
1,4,*
1
Department of Biology, School of Science, King Mongkut’s Institute of Technology Ladkrabang, Bangkok 10520, Thailand
2
Laboratory of Cyanobacterial Biotechnology, Department of Biochemistry, Faculty of Science, Chulalongkorn University, Bangkok 10330, Thailand
3
Academy of Science, Royal Society of Thailand, Bangkok 10300, Thailand
4
Bioenergy Research Unit, School of Science, King Mongkut’s Institute of Technology Ladkrabang, Bangkok 10520, Thailand
*
Author to whom correspondence should be addressed.
Phycology 2025, 5(2), 12; https://doi.org/10.3390/phycology5020012
Submission received: 11 February 2025 / Revised: 7 March 2025 / Accepted: 20 March 2025 / Published: 25 March 2025

Abstract

:
Light characteristics, including spectrum and intensity, significantly impact cyanobacterial biomass production, pigment biosynthesis, and cellular metabolism, influencing the composition of various biochemical compounds. This study aimed to investigate the effects of light-emitting diode (LED) illumination on biomass, pigment, and lipid production in the unicellular halotolerant cyanobacterium Aphanothece halophytica, cultivated in a suitable natural seawater (SNSW) medium. The results revealed that LED light outperformed fluorescent light, with blue LED light, particularly at an intensity of 60 μmol photons m−2 s−1, significantly enhancing growth, pigment synthesis, and lipid accumulation. This resulted in a maximum cell density of 68.96 ± 1.52 × 10⁶ cells mL−1, a specific growth rate of 0.302 ± 0.002 day−1, and a lipid productivity of 56.81 ± 0.75 mg L−1 day−1. White LED light produced lipids suitable for biodiesel, whereas blue, green, and red LEDs promoted the accumulation of polyunsaturated fatty acids (PUFAs), beneficial for food supplements. These findings highlight the potential of LED-based cultivation strategies for optimizing biomass and biochemical compound production in A. halophytica.

1. Introduction

Countries are facing a global fuel shortage which is driven by population growth and industrial expansion. The use of fossil fuels contributes to pollution and global warming. Renewable energy sources, such as solar, wind, hydropower, geothermal, and biomass, offer sustainable alternatives. Biomass energy derived from agricultural and organic waste can be converted into biofuels, such as bioethanol, biogas, and biodiesel. Biodiesel produced from vegetable oils, animal fats, or used cooking oils via transesterification faces several challenges, including high resource demands, long cultivation periods, high costs, and competition with food production. Ongoing research aims to develop cost-effective, non-food-based biodiesel sources to address these limitations.
Cyanobacteria and microalgae are promising raw materials for biodiesel production due to their rapid growth and minimal land requirements. Their growth and biomass composition are influenced by various environmental factors, including nutrient composition, pH, incubation temperature, and light quality and intensity [1,2,3,4,5]. Light plays a crucial role in cell growth and pigment composition in microalgae [6,7]; however, different species respond uniquely to light conditions, affecting their biomass accumulation and pigment production [8,9]. Traditional fluorescent lamps have limited ability to target specific chlorophyll absorption bands. In contrast, LED lighting offers precise single-wavelength illumination, lower energy consumption, longer lifespan, reduced heat output, and higher efficiency, making it ideal for cyanobacterial cultivation [10]. Optimized LED intensity enhanced both biomass and lipid productivity. For instance, Anabaena vaginicola exhibited its highest biomass and lipid productivity at 80 μmol photons m−2 s−1 compared to 8 and 150 μmol photons m−2 s−1 [11].
Additionally, different LED spectra and intensities influence the production of biomass, pigments, and other valuable biochemical compounds, such as proteins, carbohydrates, and lipids, in cyanobacteria and microalgae [5,12,13]. Red LED light promoted growth but inhibited chlorophyll content in Arthrospira platensis [14]. Green LED light enhanced growth, protein, and lipid content in Brachiomonas submarina and increased pigment content in Kirchneriella aperta, whereas blue LED light boosted carotenoid and zeaxanthin content in Rhodella sp. [15]. Blue LED light has been reported to reduce photosynthetic efficiency [16] but enhance carotenoid content in Synechocystis sp. PCC 6803 [17]. Illumination under blue LED light may induce cellular stress, leading to metabolic flux changes. Furthermore, blue LED light enhanced lipid content in Phaeodactylum tricornutum and Chlorella vulgaris [5,18,19]. Under a blue LED light intensity of 100 μmol photons m−2 s−1, P. tricornutum increased its total saturated fatty acid content, improving biodiesel properties, such as a higher cetane number and lower iodine value [5].
Aphanothece halophytica is a unicellular cyanobacterium recognized for its high salinity tolerance and the formation of colonies enclosed in a mucilaginous sheath. This cyanobacterium accumulates glycine betaine, an osmoprotectant [20], which enables it to grow in sodium chloride concentrations ranging from 0.25 to 3 M and under highly alkaline conditions, with a pH tolerance of up to 11 [21,22]. This strain has been previously identified as a promising candidate for biohydrogen and lipid production [23,24,25]. Previous studies have examined the impact of environmental factors on the growth and lipid production of A. halophytica [25,26]; however, relatively few studies have investigated the specific effects of light characteristics on biomass accumulation, pigment composition, and lipid synthesis in this strain. Therefore, this study aimed to investigate the influence of light quality by comparing fluorescent and LED illumination, as well as different LED colors and light intensities, on the growth, pigment content, and lipid production of the halotolerant cyanobacterium A. halophytica.

2. Materials and Methods

2.1. Cyanobacterial Cultivation

Aphanothece halophytica was cultivated in a 250 mL Erlenmeyer flask containing 100 mL of suitable natural seawater (SNSW) medium (pH 7.4) prepared with natural seawater supplemented with 17.6 mM NaNO3, Turk Island salt solution, 1.89 mmol C-atom L−1 glucose, and 0.75 M NaCl [25]. Prior to use, natural seawater, collected from Nang Rum Beach, Chonburi Province, Gulf of Thailand (12°36.969′ N, 100°55.280′ E), was filtered through a 0.7 µm glass microfiber filter (Whatman, Maidstone, UK), adjusted to pH 7.4 using 2 N NaOH, and sterilized by autoclaving. The culture was incubated on a rotary shaker at 120 rpm, at 30 °C, and exposed to a white light intensity of 15 µmol photons m−2 s−1 for 14 days.

2.2. Effect of Light Source, Quality, and Intensity on Growth, Pigment Content, and Lipid Production

A. halophytica was cultivated in SNSW medium at 30 °C under white fluorescent light, and white LED light, with the same intensity of 15 μmol photons m−2 s−1 for 14 days. Cells were harvested by centrifugation before subsequent determination of growth, pigment content, and lipid productivity. To determine the effects of the LED light spectrum, four types of LED light colors (blue, red, green, and white) were used for the illumination. The suitable LED light color was selected to investigate the effect of light intensities ranging from 15, 30, 45, to 60 μmol photons m−2 s−1 on these parameters. The fluorescent light was provided by a Philips TL-D 18W/865 fluorescent lamp (Suzhou, Jiangsu, China), while the LED light was supplied by the STL Lighting Group (T8LED18W, Shenzhen, Guangdong, China). The light spectra were measured using a plant lighting analyzer (PLA-20, Everfine, Hangzhou, China). The white fluorescent and LED light spectra are shown in Figure 1A, whereas the spectra of various colored LED lights are presented in Figure 1B. The cyanobacterial cultivation under different colored LED lights is demonstrated in Figure 2.

2.3. Growth Determination and Total Cell Concentration Measurements

One mL of culture was sampled every two days of cultivation. The optical density of cell culture at a wavelength of 730 nm was measured using a spectrophotometer (Thermo Fisher Scientific, G10S UV-Vis, Waltham, MA, USA). The total cell concentration was determined through direct counting with a Neubauer hemocytometer (Boeco, Hamburg, Germany) under a light microscope (Olympus CH30RF200, Tokyo, Japan). The specific growth rate (µ) was calculated following the method described by Tang et al. (2011) [27], while the doubling time, defined as the time required for the population to double, was determined according to Guillard (1973) [28].

2.4. Pigment Content Analysis

The concentrations of chlorophyll a, carotenoid, phycocyanin, allophycocyanin, and phycoerythrin were determined in A. halophytica cells cultivated in SNSW for 14 days. One mL of A. halophytica culture was harvested by centrifugation at 7000× g at 4 °C for 10 min and the cell pellet was resuspended in 1 mL of absolute methanol (RCI labscan, Bangkok, Thailand). The mixture was vortexed and incubated in the dark for three hours. After incubation, the sample was centrifuged at 7000× g at 4 °C for 10 min to separate the methanol extract. The chlorophyll a concentration in the methanol extract was determined by measuring absorbance at 665 nm and calculated using the extinction coefficient described by Mackinney (1941) [29]. Carotenoid concentration was calculated based on absorbance at 480 nm, following the method of Britton (1985) [30].
For the determination of water-soluble pigments (phycobiliproteins (PBPs)), phycocyanin, allophycocyanin, and phycoerythrin were extracted from the cell pellet derived from 1 mL of A. halophytica culture. The pellet was rinsed twice with 1 mL of 6 mM EDTA. The cells were then kept at −70 °C for 1 h before adding 1 mL of 2 mM EDTA (pH 8.0) containing 2% (v/v) Triton X-100 (Loba Chemic, Maharashtra, India) and 700 µg mL−1 lysozyme (Merck, Darmstadt, Germany). The mixture was incubated at 37 °C for 3 h. The concentrations of phycocyanin, allophycocyanin, and phycoerythrin were determined by measuring absorbance at 562, 615, and 652 nm using a spectrophotometer (Thermo Fisher Scientific, G10S UV-Vis, Waltham, MA, USA). PBPs contents were calculated according to the method described by Hsieh et al. (2014) [31].

2.5. Total Lipid Extraction

A. halophytica cells cultivated for 14 days were harvested by centrifugation at 7000× g, at 4 °C for 10 min. The cells were then dried in a hot air oven at 60 °C for 24 h. Total lipid extraction from the dried cells of A. halophytica was performed using a single-step method with a slight modification, as described by Axelsson and Gentili (2014) [32]. In this procedure, 20–30 mg of dried cells was mixed with 8 mL of a solvent mixture of chloroform (RCI labscan, Thailand) and methanol (2:1, v/v). The mixture was shaken vigorously, and 2 mL of 0.73% (w/v) NaCl solution was subsequently added before centrifugation at 7000× g at room temperature for 5 min. The bottom chloroform layer, containing crude lipids, was carefully transferred to a new tube. This extraction step was repeated five times. The chloroform layer was then evaporated using a vacuum evaporator, and the total crude lipid extract was weighed. Lipid content was calculated as a percentage of lipid per dry cell weight, while lipid productivity was determined as the lipid weight per culture volume per day. For dry cell weight determination, cells were harvested by centrifugation at 7000× g at 4 °C for 10 min, and the resulting cell pellet was dried in a hot air oven at 60 °C for 48 h before weighing the dry biomass.

2.6. Fatty Acid Profile Analysis

The fatty acid profile analysis was conducted at the Lipid Technology Research Laboratory, Division of Biochemical Technology, School of Bioresources and Technology, King Mongkut’s University of Technology Thonburi (Bangkhuntien, Bangkok, Thailand). Crude lipid extracts were transesterified using a modified protocol based on Lepage and Roy (1984) [33]. At least 10 mg of the lipid extract was combined with 5% (v/v) HCl in absolute methanol and incubated at 85 °C for 1 h. Fatty acid methyl esters (FAMEs) were analyzed using a gas chromatograph equipped with a flame ionization detector (Agilent 6850, Mulgrave, Australia), with heptadecanoic acid serving as an internal standard. The gas chromatography conditions were based on a previous study [34]. The injector and detector temperatures were set to 250 °C, and 1 µL of the sample was injected into split mode at a ratio of 500:1. Hydrogen gas (99.999% purity) was used as the carrier gas at a constant flow rate of 1.5 mL min−1.

2.7. Biodiesel Properties of Fatty Acid Methyl Ester

Biodiesel properties, including the degree of unsaturation (DU), saponification value (SV), iodine value (IV), cetane number (CN), long-chain saturated factor (LCSF), cold filter plugging point (CFPP), cloud point (CP), pour point (PP), allylic position equivalent (APE), bis-allylic position equivalent (BAPE), oxidation stability (OS), higher heating value (HHV), kinematic viscosity (ν), and density (ρ), were determined based on the fatty acid composition of the obtained methyl esters using Biodiesel Analyzer software version 1.1 as described by Talebi et al. (2014) [35].

2.8. Statistical Analysis

All experiments were conducted independently in triplicate to ensure the reliability and reproducibility of the results. The average values obtained from these experiments are presented along with their corresponding standard deviations to indicate the variability within the data. To assess statistically significant differences among the experimental groups, a one-way analysis of variance (ANOVA) was performed. Following ANOVA, Duncan’s multiple range test was applied as a post hoc analysis to determine which specific groups exhibited significant differences, with a confidence level of 95% (p < 0.05). All statistical analyses were conducted using IBM SPSS Statistics version 23 (IBM Corp., New York, NY, USA).

3. Results

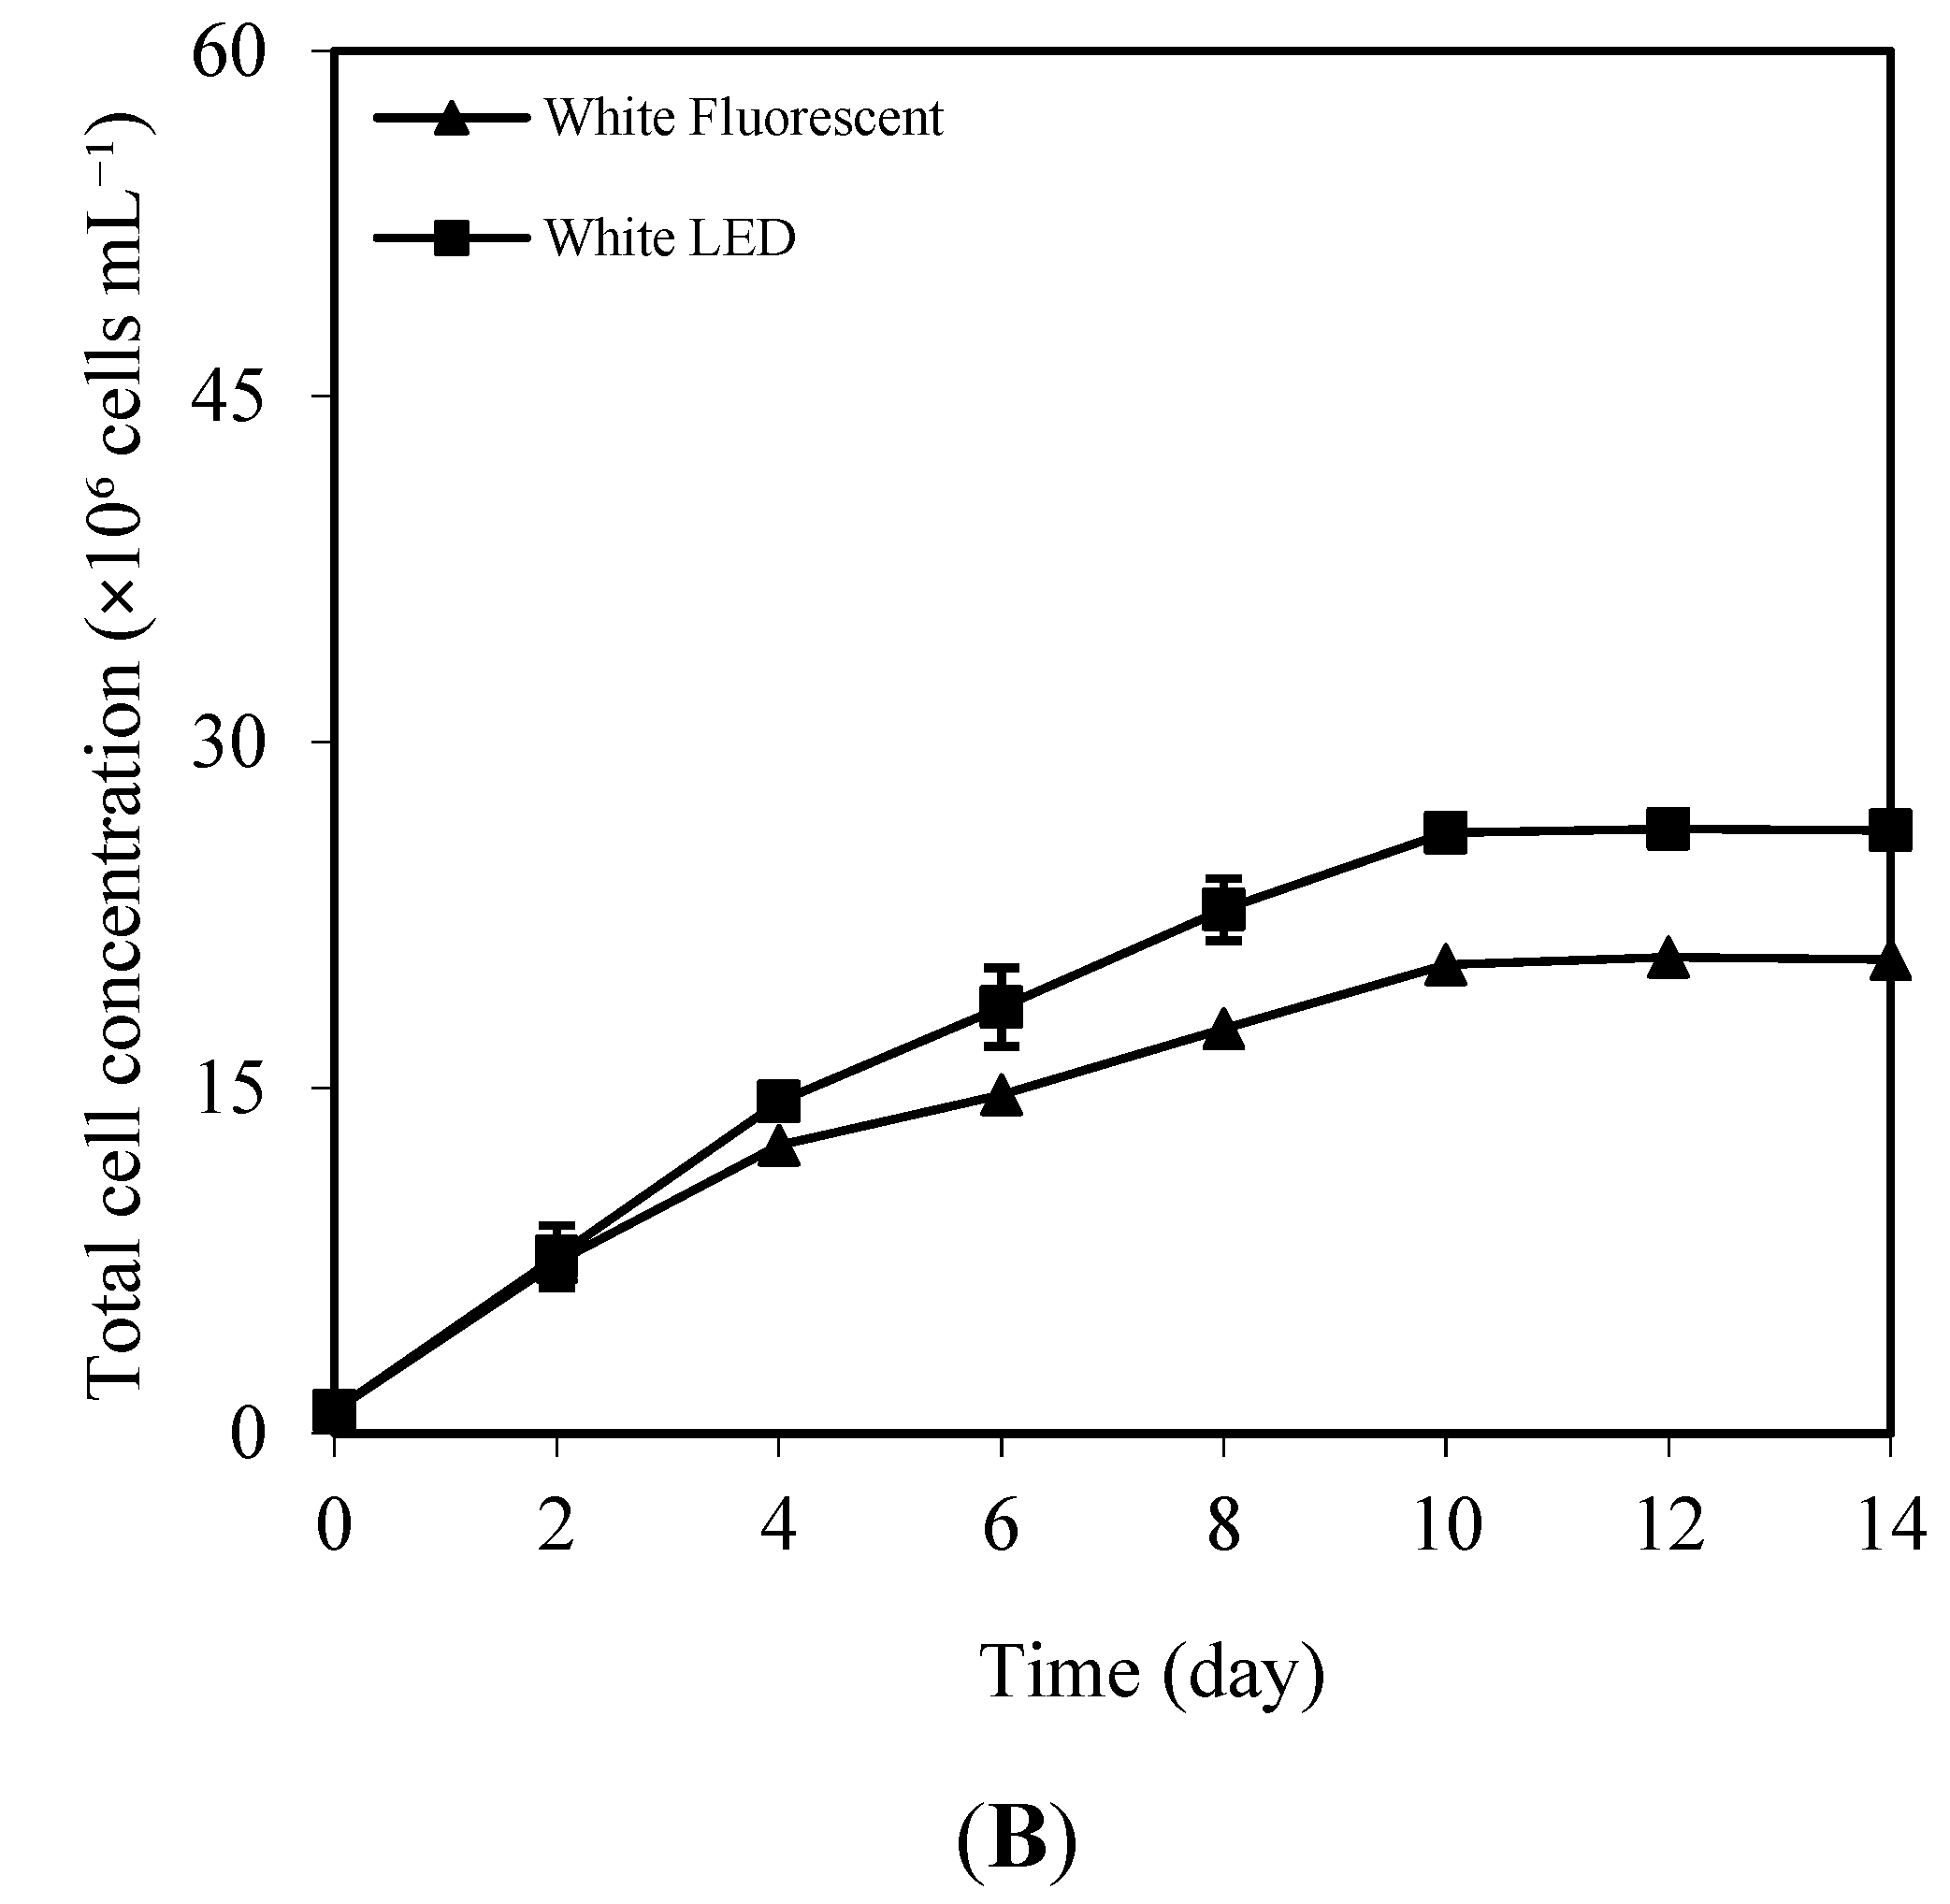
3.1. Effects of White Fluorescent and White LED Light on Growth, Pigment, and Total Lipid Content

At the same light intensity of 15 µmol photons m−2 s−1, A. halophytica cells exhibited higher growth, as measured by A730 and total cell concentration, under white LED illumination compared to white fluorescent illumination (Figure 3A,B). The maximum cell density and specific growth rate of cells cultivated under white LED light were 26.16 ± 0.36 × 10⁶ cells mL−1 and 0.233 ± 0.001 day−1, respectively, while those under white fluorescent light were 20.56 ± 0.37 × 10⁶ cells mL−1 and 0.216 ± 0.001 day−1 (Table 1). Pigment content analysis revealed no significant differences in chlorophyll a concentration between the two light sources. However, cells exposed to white LED illumination exhibited higher concentrations of phycocyanin, allophycocyanin, and phycoerythrin, whereas carotenoid concentration was higher in cells grown under white fluorescent light (Table 2). These findings suggest that LED light is an efficient light source for photosynthesis and pigment production, thereby promoting cell division and growth in A. halophytica.
Additionally, A. halophytica cells cultivated in SNSW under white LED light demonstrated the highest lipid content of 50.63 ± 1.06% and lipid productivity of 47.74 ± 0.97 mg L−1 day−1, representing an approximately 15% increase compared to cells grown under white fluorescent light (Table 1). Therefore, LED light was selected for further investigation to determine the optimal light quality due to its superior effects on growth, pigment accumulation, and lipid production.

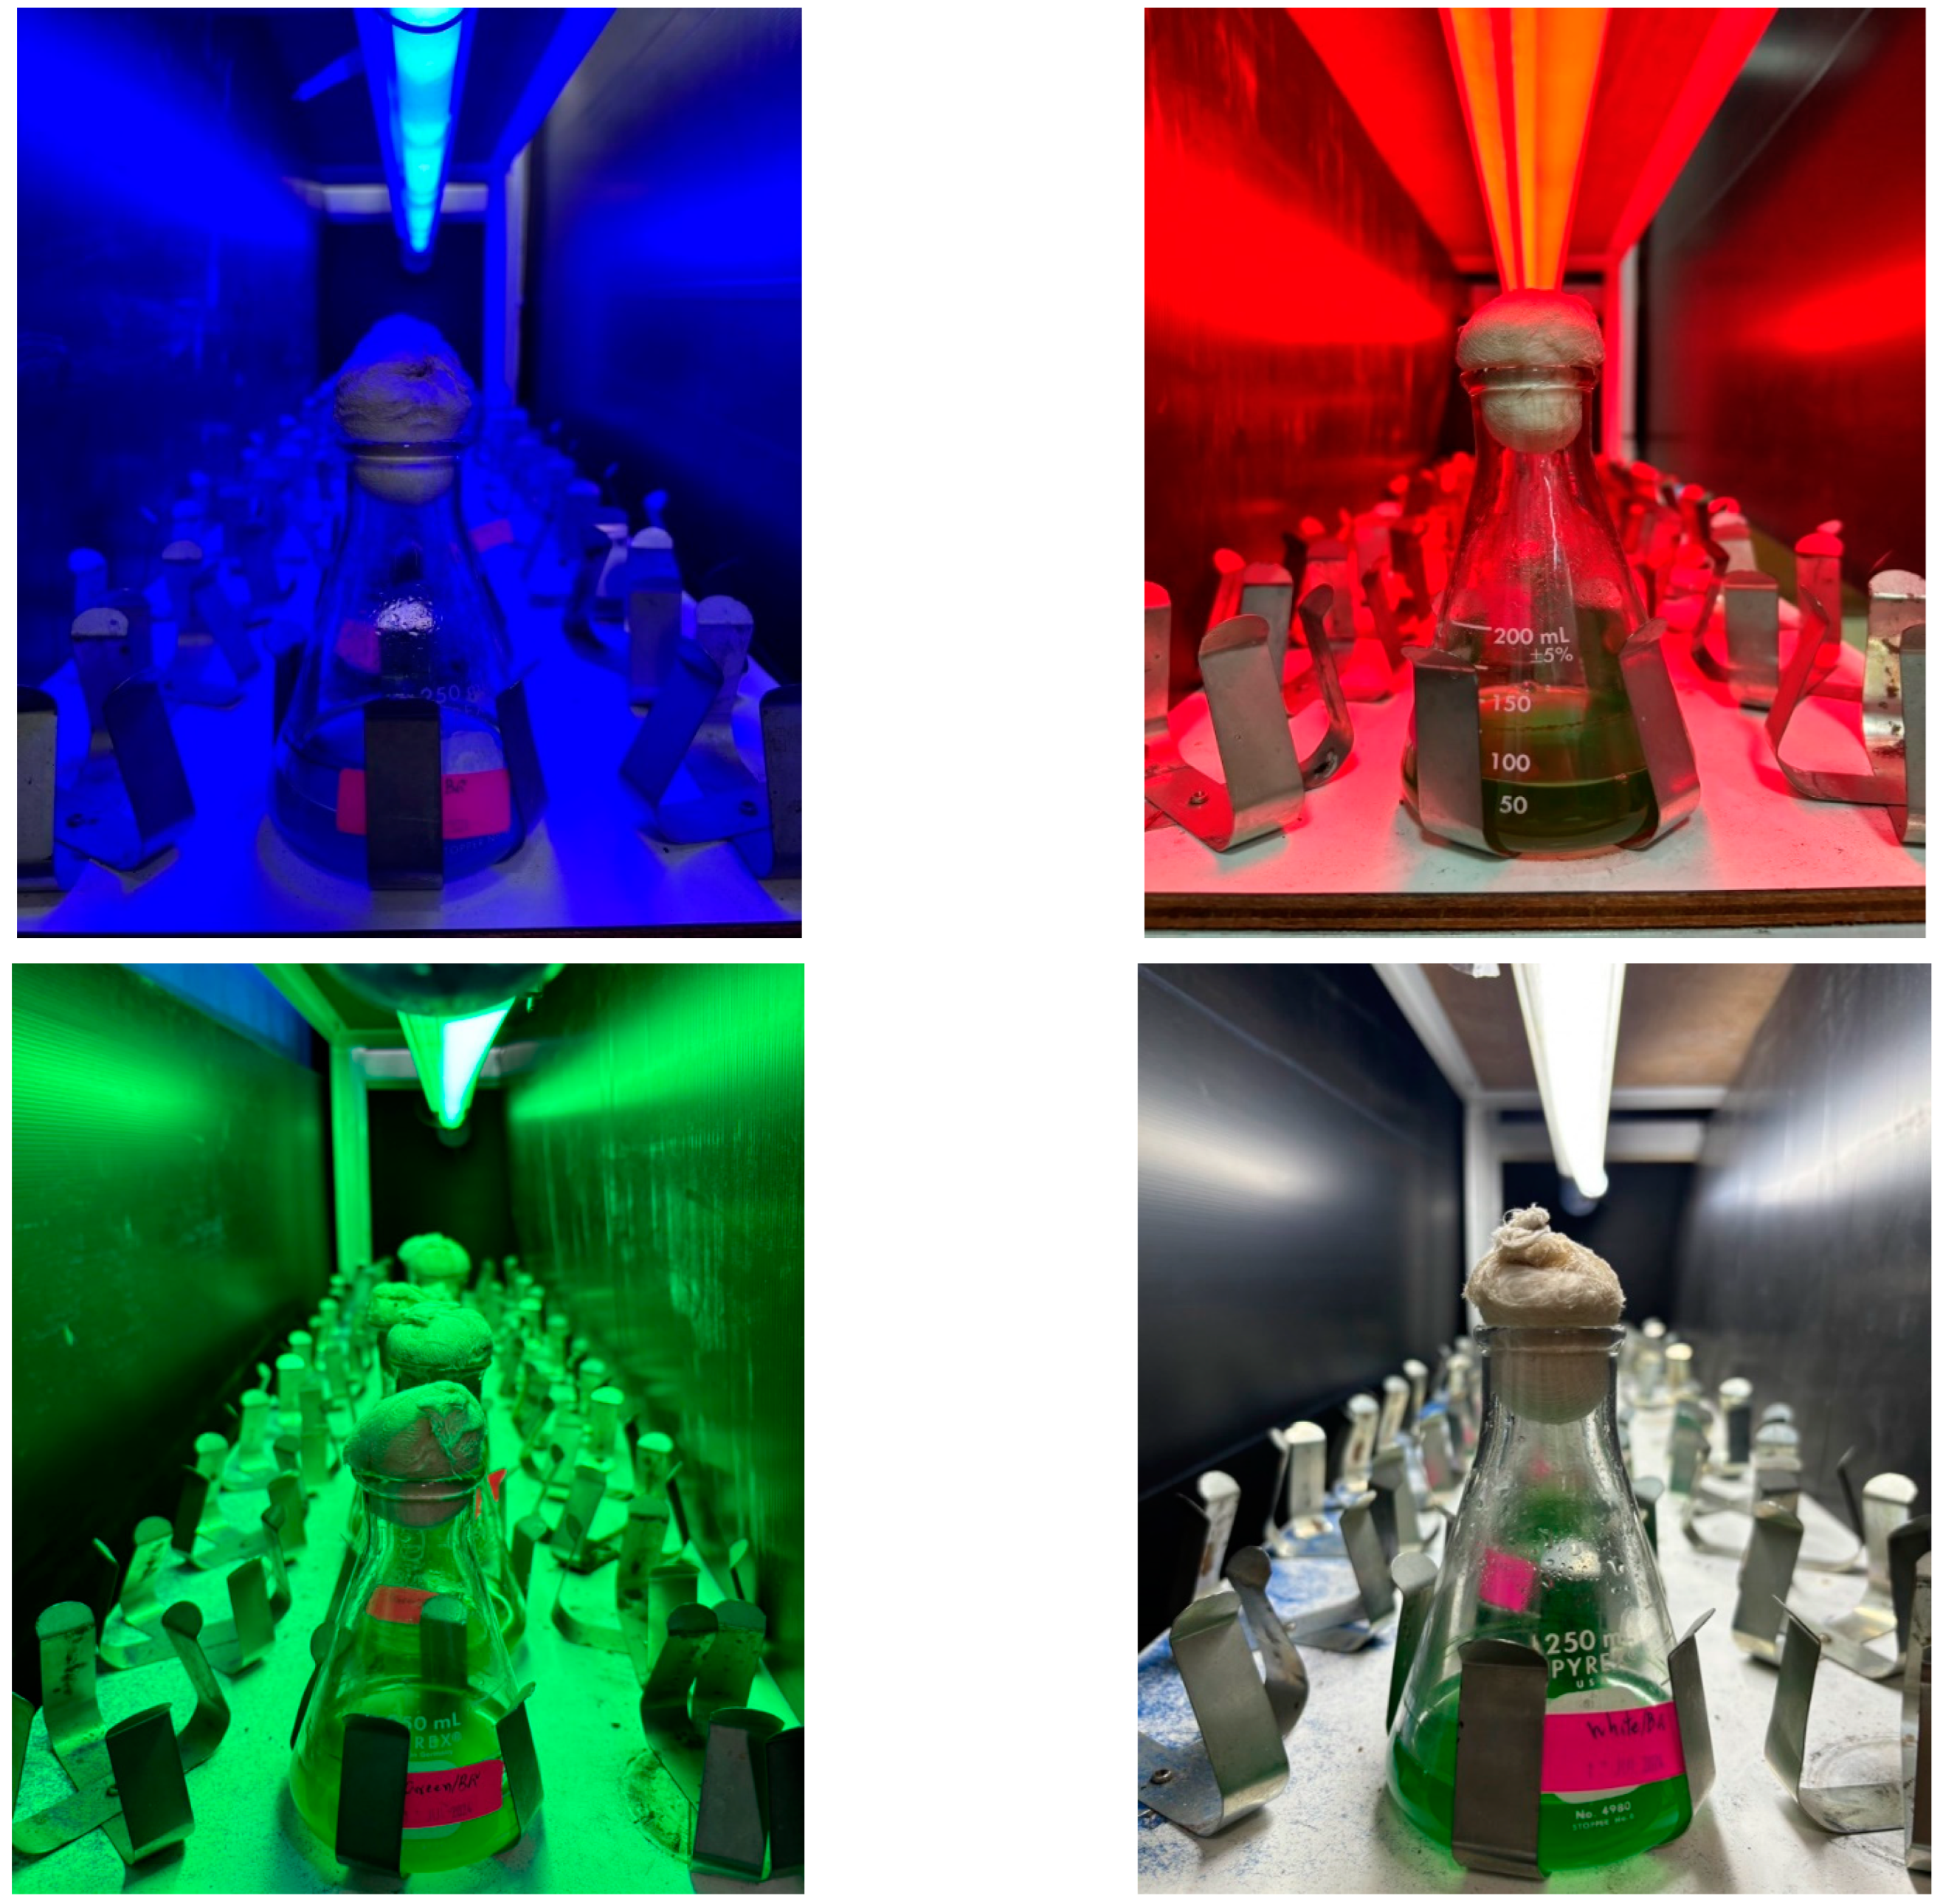
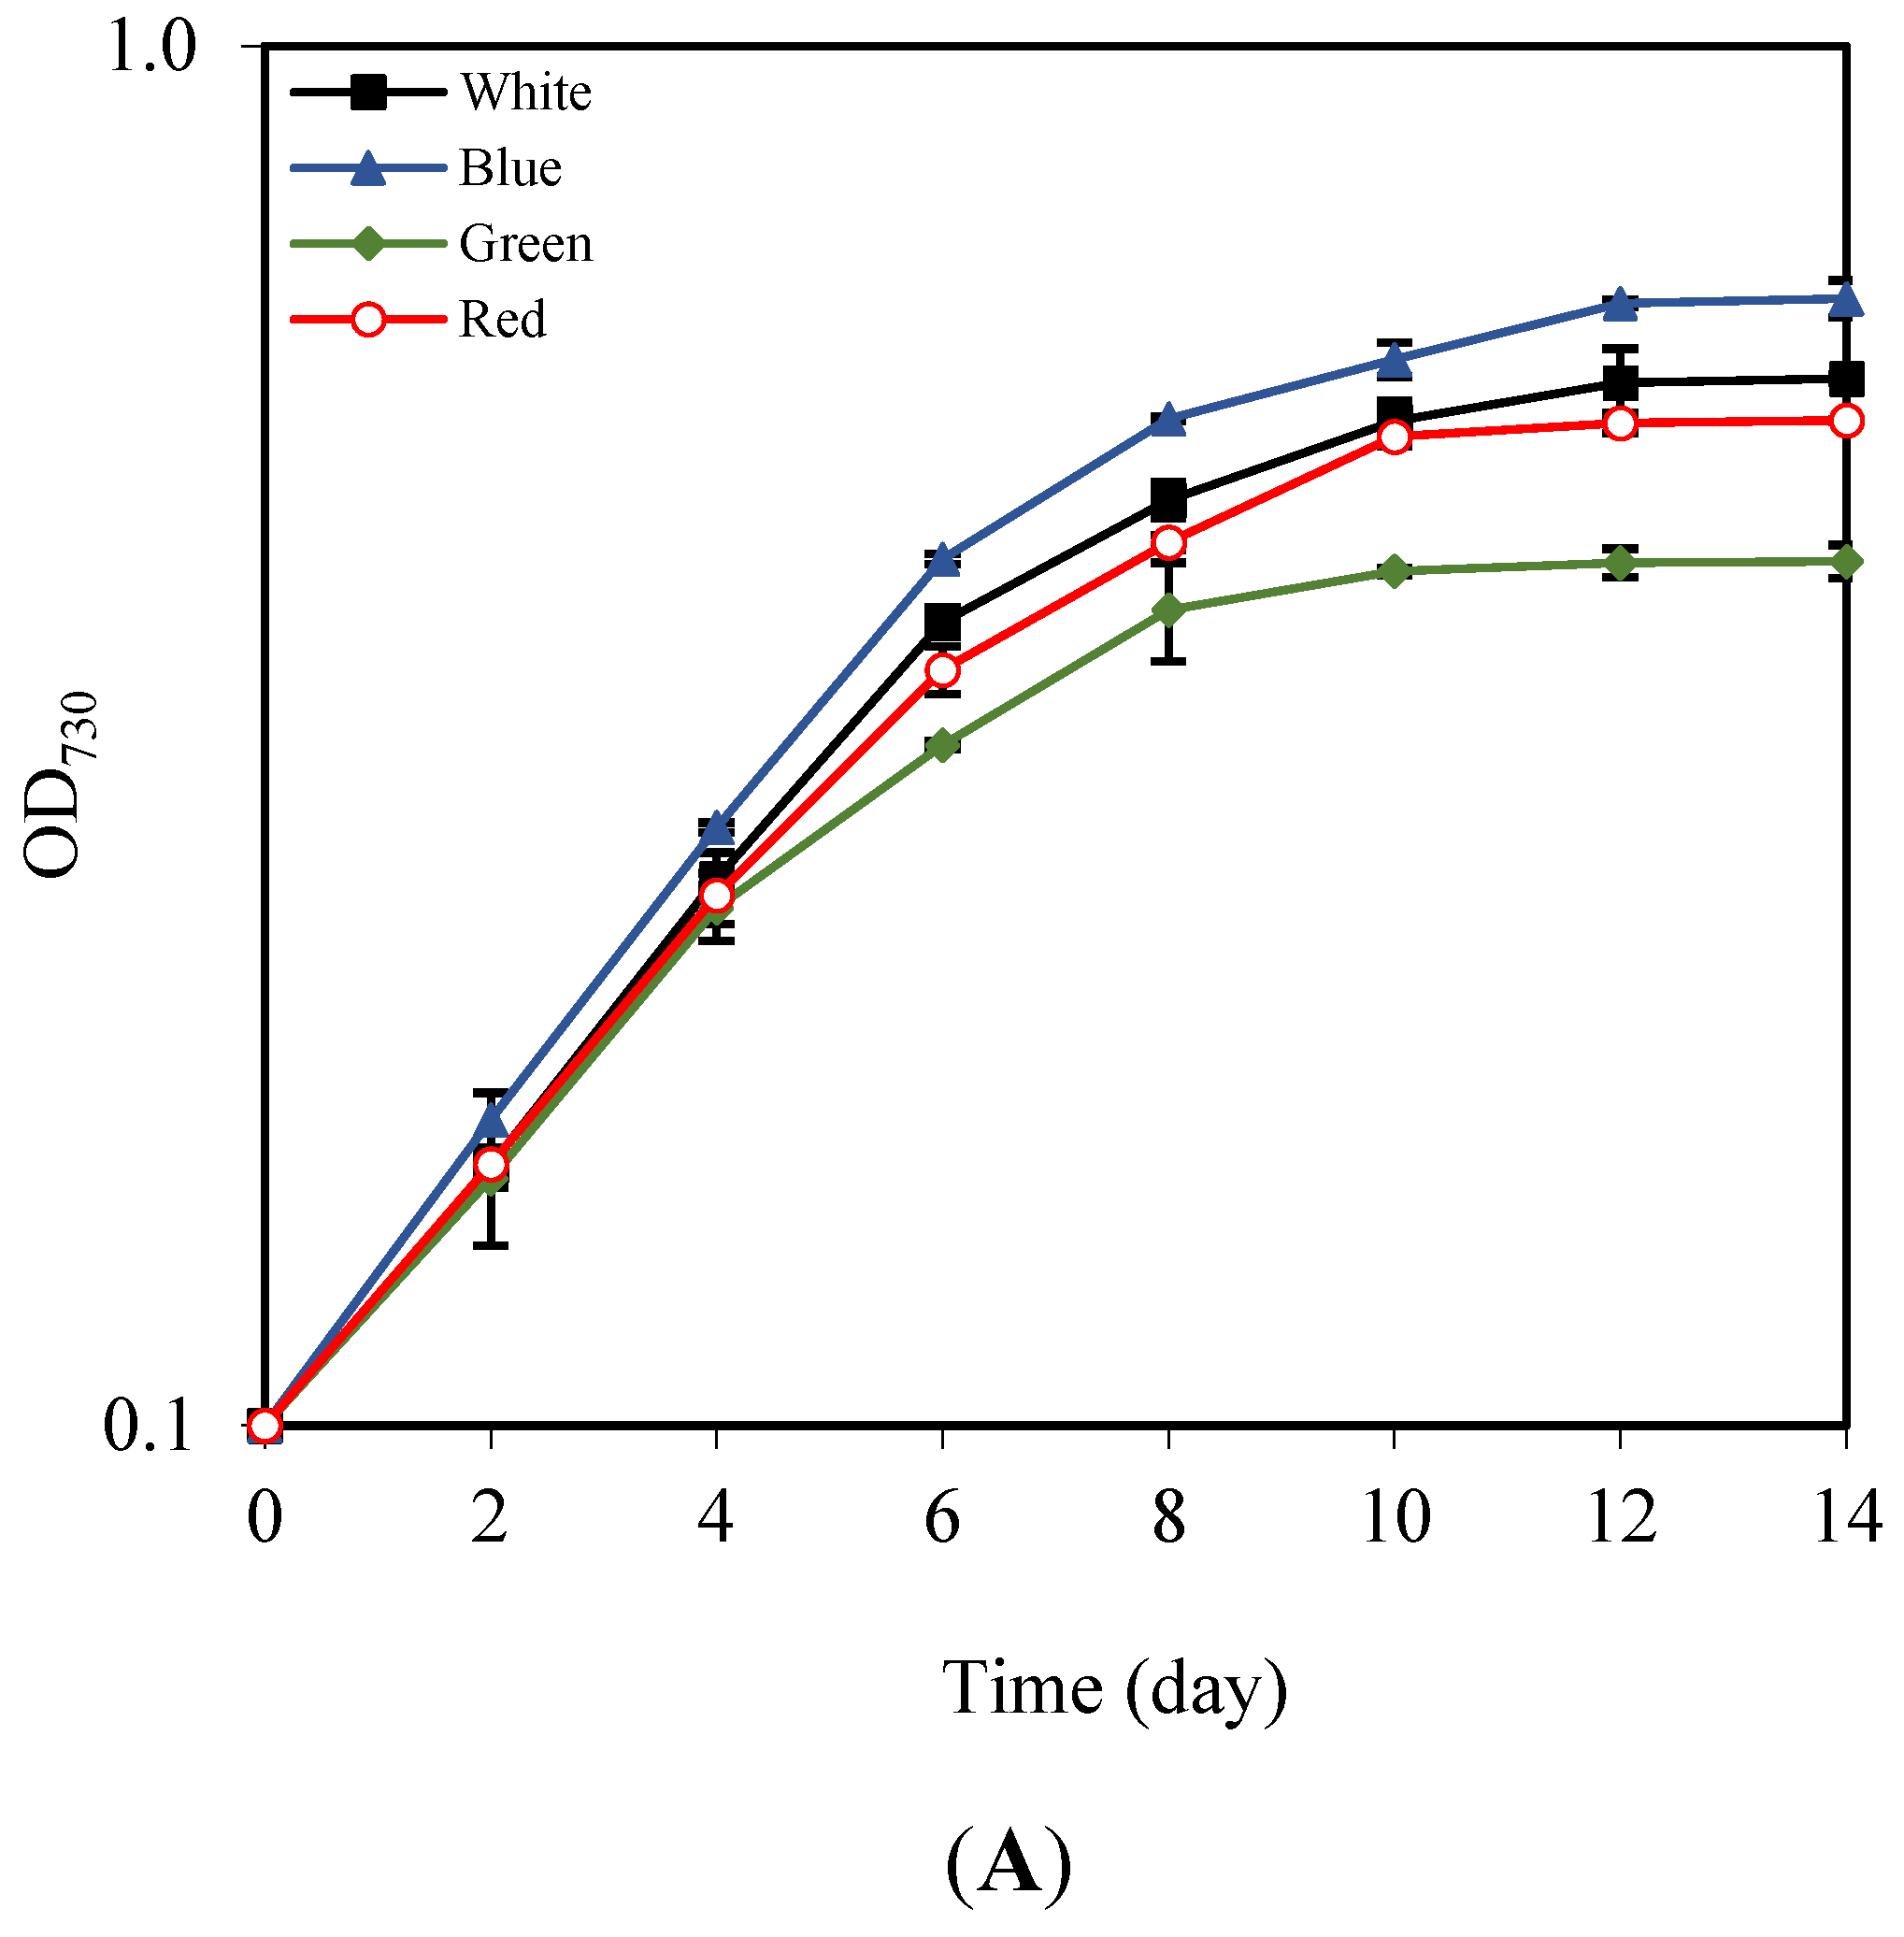
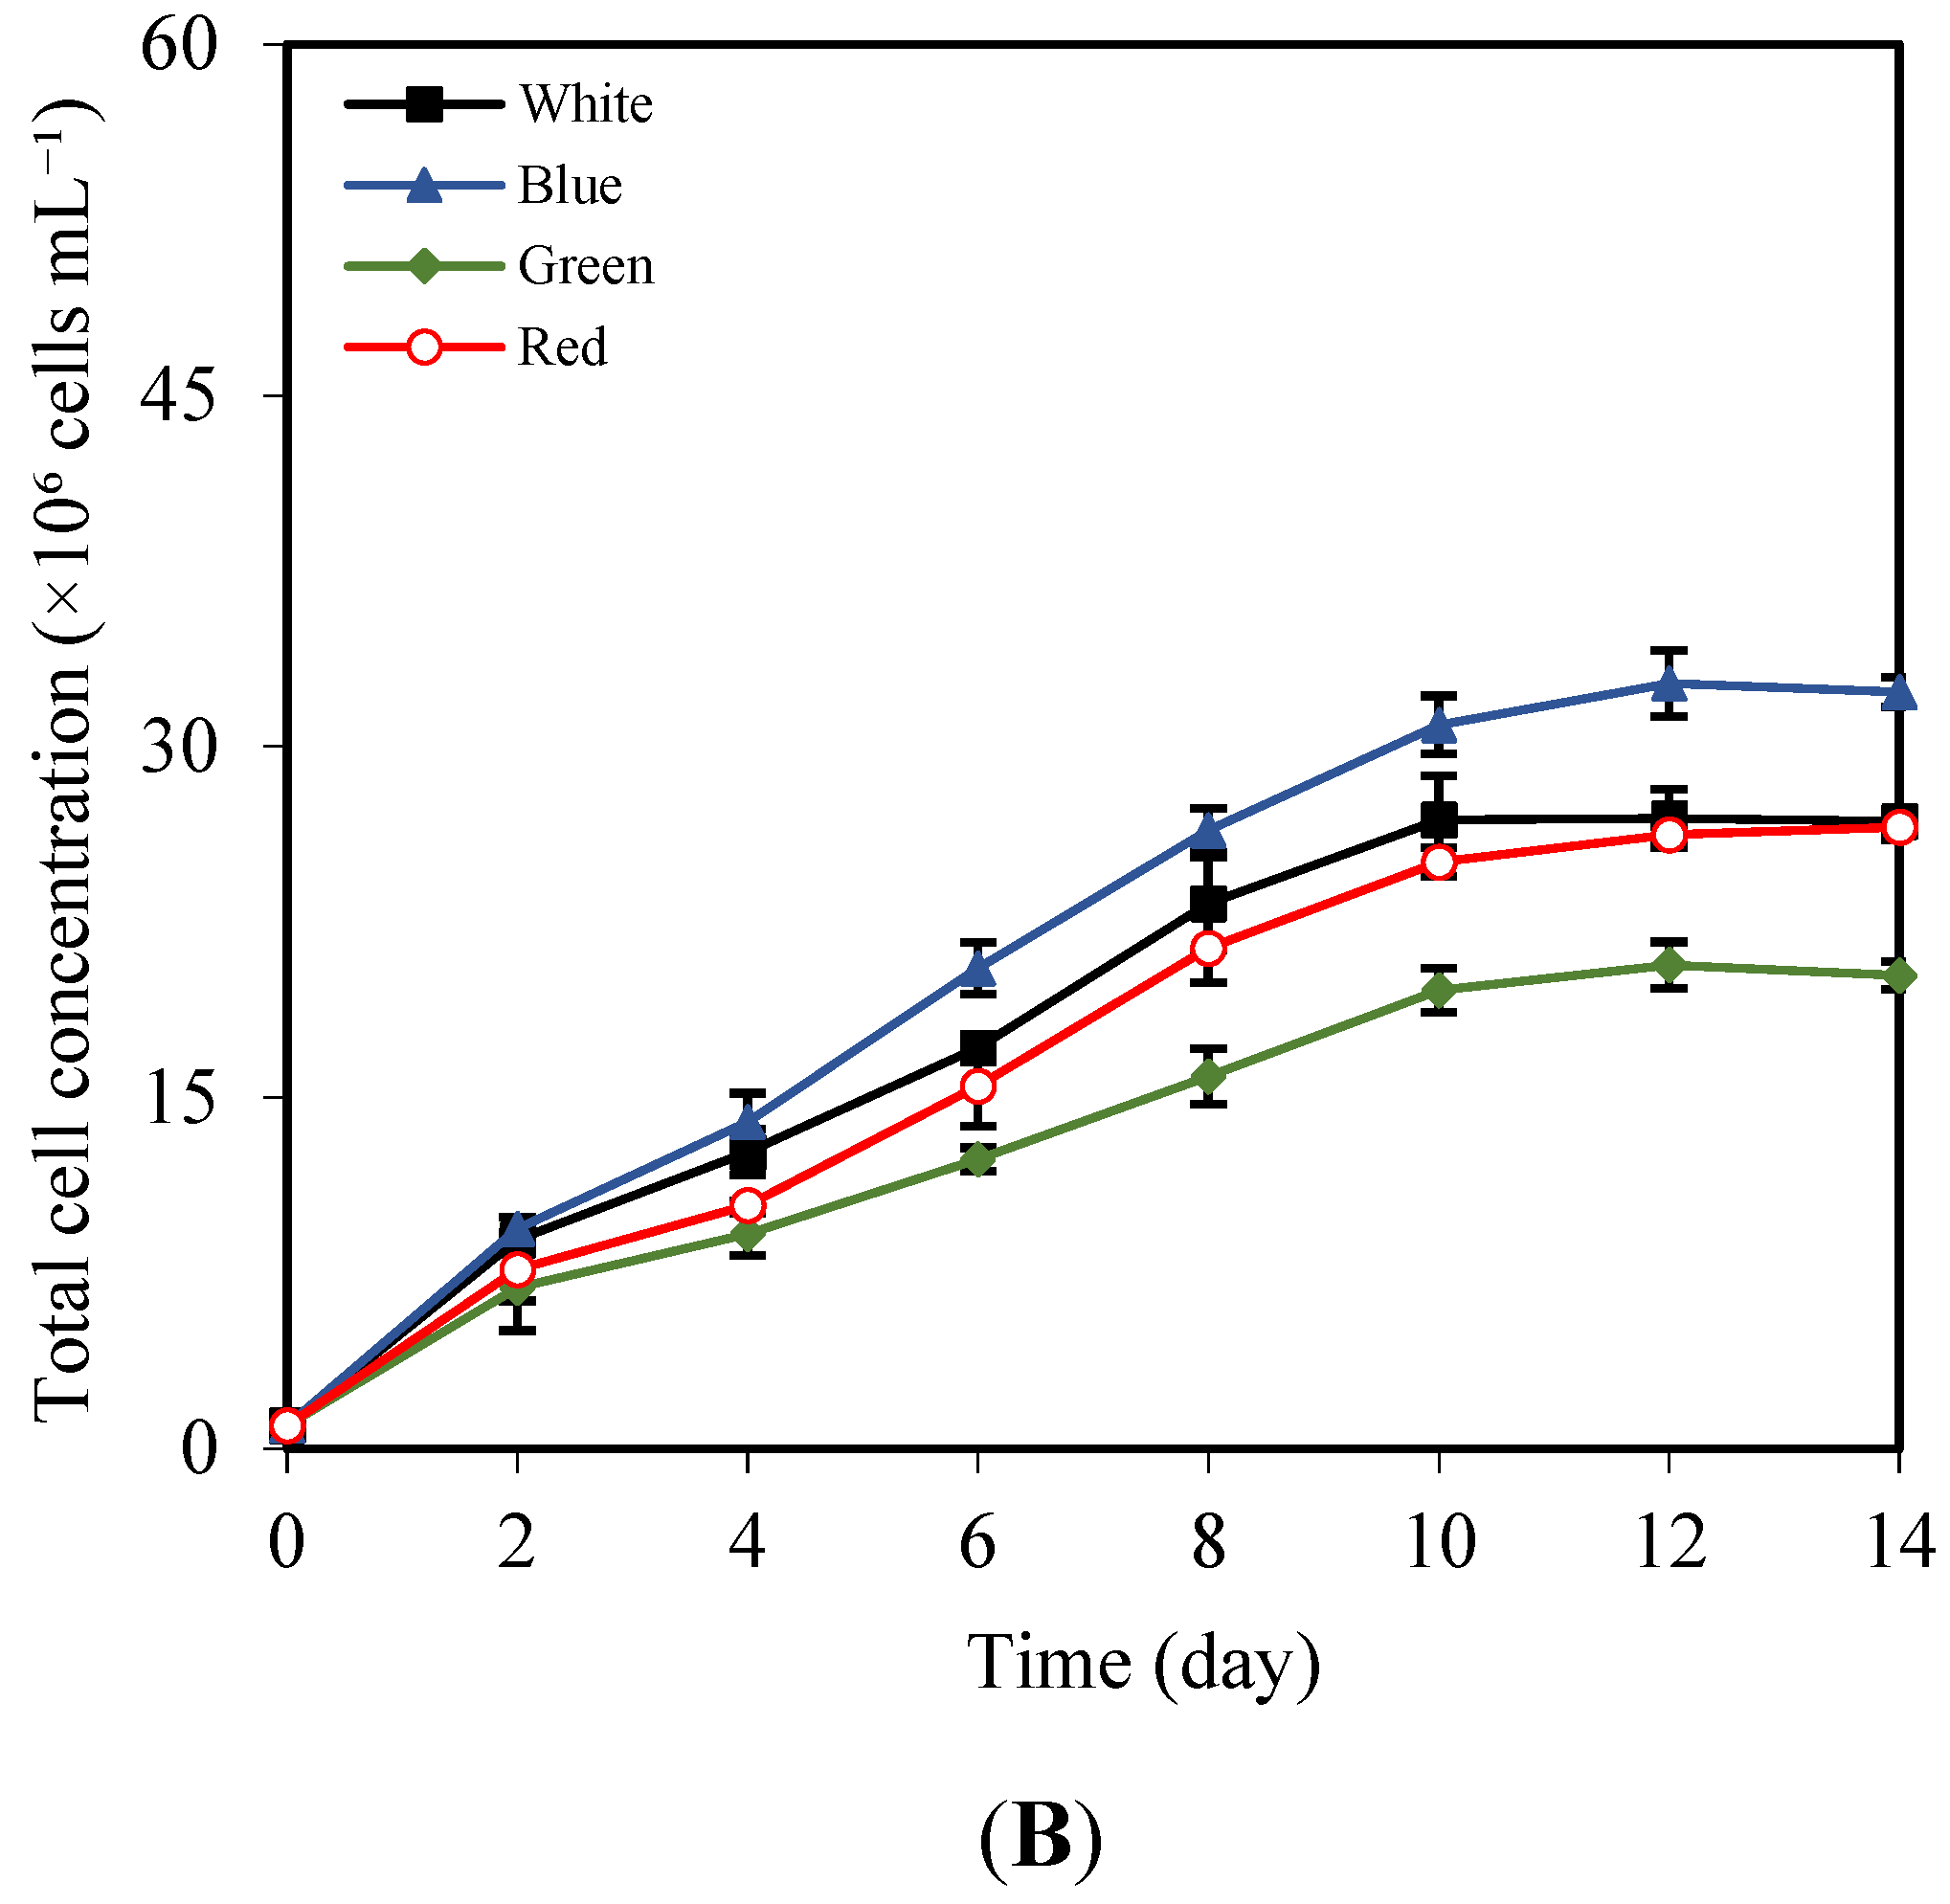
3.2. Effects of LED Light Colors on Growth, Pigment, and Total Lipid Content

Over 14 days of exposure to various LED light colors (blue, green, red, and white) at the same intensity of 15 μmol photons m−2 s−1, the growth of A. halophytica cells was evaluated based on A730 and total cell concentration measurements. Growth was highest in cells cultivated under blue LED light, followed by white, red, and green LEDs (Figure 4A,B). The maximum cell density recorded was 32.33 ± 0.63 × 10⁶ cells mL−1, with a specific growth rate of 0.248 ± 0.001 day−1 and a doubling time of 2.79 ± 0.02 days, observed in cells exposed to blue LED light (Table 3). Conversely, the lowest growth occurred under green LED light, with a maximum cell density of 20.23 ± 0.59 × 10⁶ cells mL−1, a specific growth rate of 0.214 ± 0.002 day−1, and a doubling time of 3.23 ± 0.03 days (Table 3). Regarding pigment content, the highest concentrations of chlorophyll a and carotenoid were found in cells exposed to blue LED light. Additionally, the highest concentrations of phycocyanin, allophycocyanin, and phycoerythrin were observed in cells exposed to blue and red LED lights (Table 4). For total lipid content analysis, blue LED light resulted in the highest total lipid content of 53.10 ± 0.73% and lipid productivity of 50.53 ± 0.59 mg L−1 day−1, with significant differences compared to cells grown under other LED light colors (Table 3). These results suggest that blue LED light effectively promotes pigment synthesis and enhances photosynthetic activity, thereby supporting cell growth. In addition, blue LED light stimulates lipid production in A. halophytica cells, highlighting its potential for further investigation to determine the optimal light intensity for maximizing lipid production.

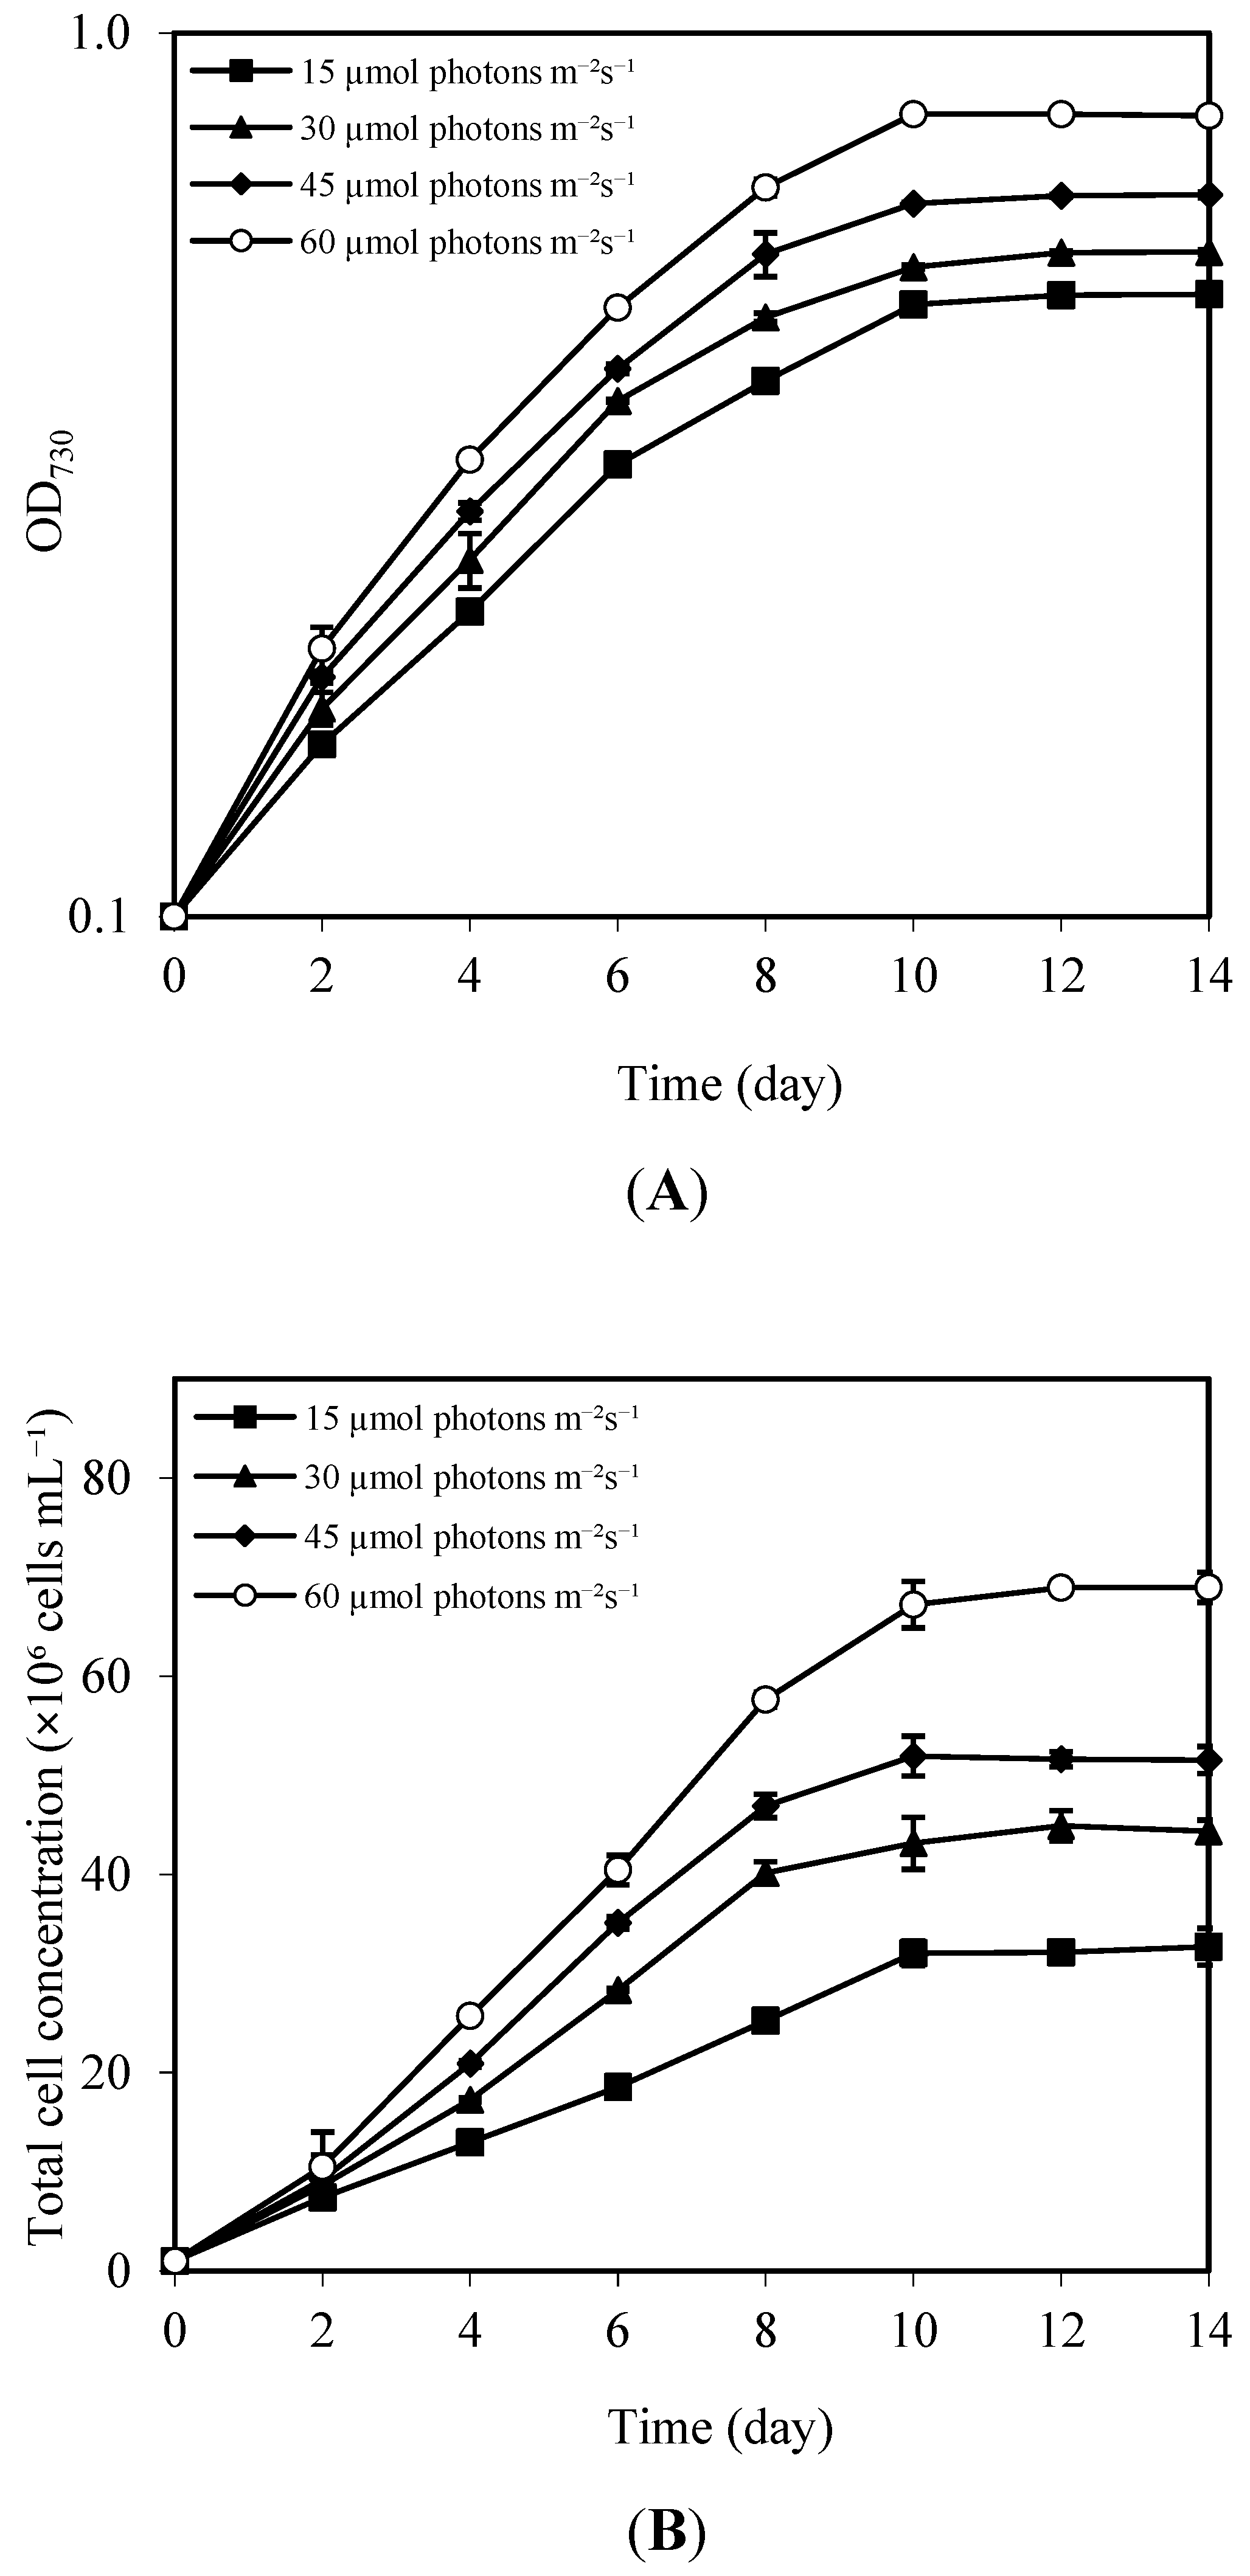
3.3. Effects of Blue LED Intensity on Growth, Pigment, and Lipid Content

Under varying intensities of blue LED light (15–60 µmol photons m−2 s−1), A. halophytica exhibited enhanced growth with increasing light intensities (Figure 5A,B). The maximum cell density of 68.96 ± 1.52 × 10⁶ cells mL−1 was observed at a blue LED light intensity of 60 µmol photons m−2 s−1. At this intensity, the specific growth rate was 0.302 ± 0.002 day−1, and the doubling time was 2.29 ± 0.01 days (Table 5). Analysis of pigment concentrations revealed that all pigment contents increased with higher blue LED light intensities, indicating a positive correlation between light intensity and pigment production (Table 6). Moreover, a blue LED light intensity of 60 µmol photons m−2s−1 resulted in the highest lipid content of 55.16 ± 0.10% and lipid productivity of 56.81 ± 0.75 mg L−1 day−1, both of which were significantly higher compared to other light intensities (Table 5).

3.4. Effects of LED Light Colors on Fatty Acid Profiles and Biodiesel Properties

A. halophytica cells cultivated in SNSW under various LED light colors for 14 days were used to extract total lipids and analyze their fatty acid profiles using GC. Quantitative analysis identified seven fatty acids, including three saturated fatty acids (SFAs)—myristic acid (C14:0), palmitic acid (C16:0), and stearic acid (C18:0)—as well as two monounsaturated fatty acids (MUFAs)—palmitoleic acid (C16:1) and oleic acid (C18:1)—and two polyunsaturated fatty acids (PUFAs)—linoleic acid (C18:2) and α-linolenic acid (C18:3) (Table 7). The results indicated that LED light color influenced the fatty acid composition of A. halophytica. Palmitic acid, linoleic acid, and α-linolenic acid were the predominant fatty acids in all samples (Table 7). Cells grown under white LED light exhibited the highest SFA content, with palmitic acid accounting for 52.51% of total fatty acids. MUFA content across all samples ranged from 8.84% to 12.66%. Interestingly, A. halophytica cells exposed to red, blue, and green LEDs exhibited approximately twice the PUFA content compared to those grown under white LED light (Table 7).
The biodiesel properties derived from the fatty acid composition of A. halophytica grown under different LED light colors are shown in Table 8. Biodiesel produced from lipids extracted from cells exposed to white LED light exhibited the highest saponification value (SV), cetane number (CN), long-chain saturated factor (LCSF), cold filter plugging point (CFPP), cloud point (CP), and oxidation stability (OS) compared to other LED light colors (Table 8). In contrast, biodiesel derived from lipids extracted from cells exposed to red LED light demonstrated higher values for the degree of unsaturation (DU), iodine value (IV), allylic position equivalent (APE), and bis-allylic position equivalent (BAPE) (Table 8). However, the iodine value (IV) of this biodiesel was 143.5, exceeding the standard maximum of 120 specified in ASTM D6751-08 and EN 14214 for biodiesel. Regarding the CN value, biodiesel derived from lipids extracted from cells exposed to blue, red, and green LED light had CN values ranging from 40.3 to 45.7, which are below the minimum CN requirements of ASTM D6751-08 and EN 14214. Based on the analysis of biodiesel properties, lipids obtained from cells cultivated under white LED light demonstrated the most suitable characteristics for biodiesel production.

4. Discussion

4.1. Effect of White Light Sources on Growth and Pigment Content

A. halophytica exhibited significantly higher growth in cell density and pigment concentrations (except carotenoids) under white LED light compared to fluorescent light (Table 1 and Table 2). This suggests that white LED light creates a more favorable environment for biomass production, potentially enhancing photosynthetic activity and pigment synthesis. As shown in Figure 1A, the irradiance spectra of LED and fluorescent lights were distinct. White LED light provides high irradiance spectra at 420–460 nm and broad spectra between 500 and 680 nm, whereas fluorescent light emits multiple sharp peaks across the 400–700 nm range. Despite these differences, both illumination sources include wavelengths of 420–470 nm and 660–680 nm, which are essential for pigment absorption and cyanobacterial growth. The superior pigment production under LED light is attributed to its consistent spectral quality and efficient energy delivery, which aligns effectively with the absorption spectra of photosynthetic pigments [36]. Chlorophyll, which absorbs light at 440 and 680 nm, plays a crucial role in light capture and energy transfer, while phycobiliproteins, which absorb light at 620 and 660 nm, enhance the efficiency of light-harvesting complexes in cyanobacteria [37]. These findings are in agreement with previous results, indicating that white LEDs are among the most widely used light sources for cultivating various cyanobacterial and microalgal strains [10,38,39].
LED technology consumes less energy, generates less heat, and offers higher energy conversion efficiency compared to fluorescent lighting [40,41]. LED lights also have a range of advantages, such as high response time, low maintenance cost, and long life [42]. This highlights the potential of LED lighting systems to enhance cyanobacterial productivity for biotechnological applications, including biofuel production and the synthesis of high-value pigments. Additionally, LEDs consume less energy compared to traditional light sources, making them a sustainable and cost-effective option for industrial-scale cultivation systems designed for economic feasibility.

4.2. Effects of LED Light Colors on Growth and Pigment Content

Light quality is a crucial factor influencing cyanobacterial growth, morphological characteristics, photosynthesis, and cellular metabolism. A. halophytica exhibited the highest growth, with the maximum specific growth rate observed under blue LED light (Table 3). This enhanced growth is likely due to the optimization of photosynthetic activity facilitated by the increased concentrations of chlorophyll a, carotenoid, phycocyanin, allophycocyanin, and phycoerythrin. Pigment analysis further supported this observation, as blue LED light induced the highest concentrations of all measured pigments (Table 4). These results were due to the fact that blue light is efficiently absorbed by the photosynthetic pigment chlorophyll a, enhancing improved light capture, energy conversion, and biomass accumulation. The superior pigment production under blue light can be attributed to the high absorption efficiency of photosynthetic pigments in the blue-violet light region. In this study, blue LED light also promoted carotenoid production (Table 4). It was due to the absorption peak of carotenoids near blue light, supporting the efficient blue light adsorption by carotenoids [43]. Our results were consistent with previous studies where blue LED light showed higher biomass production, chlorophyll, and carotenoid contents compared to other LED light colors in Oscillatoria sp. [44], increased biomass production in Chlorella pyrenoidosa [45], Chlorella sp. [46], Nannochloropsis sp. [47], and P. tricornutum [5], and increased carotenoid levels in Synechocystis sp. PCC 6803 [17]. Unexpectedly, blue light also stimulated the production of phycocyanin, allophycocyanin, and phycoerythrin, with no significant differences compared to red light (Table 4). This aligns with the previous reports demonstrating that blue light triggers high photosynthetic pigments synthesis, particularly phycocyanin synthesis in Spirulina platensis [48] and Anabaena ambiguo Rao [49]. Conversely, lower photosynthetic pigments were reported under blue light compared to those under red and white light in Synechocystis strains [50].
Previous studies have demonstrated that cyanobacteria can adapt to different spectral light conditions by controlling energy transfer between PS I and II [17]. In contrast with our study, in Synechocystis sp. PCC 6803, blue light decreased the photosynthetic efficiency due to an imbalance between PS I and II by upregulating genes encoding the D1 and D2 proteins of PS II, the chlorophyll-binding protein CP47, and genes involved in PS II repair [16,51]. The effects of blue LED light on photosynthetic pigment responses varied depending on the species. Further investigation is needed to analyze the expression of genes related to photosynthesis in our cyanobacterial strain.
The effects of blue LED intensities on growth, pigment, and lipid contents were also investigated. Our results demonstrated that all these parameters increased with rising blue LED light intensities, reaching their maximum values at 60 µmol photons m−2 s−1 (Table 5 and Table 6). This intensity appears to provide an optimal environment for the synthesis of essential photosynthetic pigments, which are critical for light harvesting and energy transfer during photosynthesis. The increased pigment content contributed to an enhanced growth rate. In addition, higher intensities of blue LED light promoted the synthesis of carotenoids (Table 6), which play a vital role in photoprotection by dissipating excess light energy and shielding cells from oxidative damage. Importantly, the light intensity of 60 µmol photons m−2 s−1 might not be high enough to induce cellular stress or damage. A previous study showed that light intensities higher than 120 µmol photons m−2 s−1 could diminish phycocyanin, allophycocyanin, and phycoerythrin production, which significantly reduced growth and biomass production in Oscillatoria [52]. Unfortunately, due to equipment limitations in the laboratory, blue LED light intensities above 60 µmol photons m−2 s−1 were not tested.

4.3. Effects of LED Light on Lipid Production

Lipids are major constituents of cyanobacterial biomass. Galactolipids, rather than triacylglycerols, are the most abundant lipids in many cyanobacterial species [53]; however, triglyceride levels as high as 95.8% of extracted lipids have been reported in A. halophytica grown in SNPK (Seaweed extract + NPK) medium [26]. Triacylglycerols could include acyl-plastoquinols, such as palmitoyl and stearoyl plastoquinols, which co-migrate with triacylglycerols, as analyzed by chromatography [54]. In A. halophytica, higher lipid production was observed in cells exposed to white LED light compared to white fluorescent light (Table 1). Among different LED light colors, blue LED light yielded the highest lipid content and lipid productivity (Table 3). The optimal light intensity for lipid production was 60 µmol photons m−2 s−1 (Table 5). This could be explained that chlorophyll a and phycobiliproteins efficiently absorb blue LED light, resulting in an enhancement of photosynthetic activity, thus contributing to greater biomass accumulation, which in turn supports increased lipid biosynthesis. Blue light exposure may change carbon metabolism by inhibiting starch accumulation [55] and synthesizing TCA cycle intermediates [56], leading to lipid accumulation.
In this study, A. halophytica exhibited increased lipid content under moderate light stress, which can be induced by specific wavelengths of blue LED light. The findings in this study align with previous research reporting that a blue LED light intensity of 200 µmol photons m−2 s−1 led to the maximum lipid content for Chlorella vulgaris [19]. This was attributed to the need for light energy (ATP and NADH) to support triglyceride production, which helps mitigate photochemical [19]. Similarly, the highest lipid content was observed in Arthrospira platensis, C. vulgaris, S. obliquus, and P. tricornutum under blue LED [5,57]. On the other hand, Nannochloropsis sp. exhibited maximum growth under blue LED light but accumulated higher lipid content under green LED light [58].
The LED light colors influenced the fatty acid profiles in A. halophytica (Table 7). Red, green, and blue LED lights stimulated the formation of PUFAs compared to white LED light. This led to a change in the ratio of saturated to unsaturated fatty acids in response to cell stress. The ratio of saturated to unsaturated fatty acids in cells exposed to red, green, and blue LEDs was lower than the ratio in those exposed to white LED light. Notably, the highest production of α-linolenic acid at 36.32% was observed in cells exposed to red LED light. This effect could be attributed to enhanced desaturase activity, which led to a higher proportion of linoleic acid and α-linolenic acid. Similarly, red light has been shown to stimulate PUFA synthesis in P. tricornutum [59] and promote EPA (eicosapentaenoic acid) and DHA (docosahexaenoic acid) production in Porphyridium purpureum [60]. Under blue LED light, increased PUFA content has been reported in C. vulgaris, Auxenochlorella pyrenoidosa, Scenedesmus quadricauda, and Tetradesmus obiquus [61]. However, the higher proportion of PUFAs in A. halophytica under red, green, and blue LED lights led to a lower cetane number (CN) in biodiesel (Table 8). As a result, lipids from cells exposed to these LED colors are less suitable as a biodiesel source but are more suitable for PUFA production as food supplements.

5. Conclusions

Our findings highlight the significance of LED light intensity and spectral quality in enhancing the growth, pigment synthesis, and lipid production of A. halophytica. Blue LED light promoted the highest growth, pigment synthesis, and lipid production. For biotechnological applications, fatty acids derived from A. halophytica lipids under white LED light are suitable for biodiesel production, while those produced under blue, red, and green LED lights contain high levels of PUFAs, making them suitable for use as food supplements. This study provides valuable insights into the selection of LED colors to optimize growth and the production of pigments and lipids in indoor cultivation, making it an attractive option for industrial applications. However, further investigation is needed to evaluate the economic feasibility of using different LED colors in various culture systems.

Author Contributions

Conceptualization, S.P.; methodology, S.T. and S.P.; software, S.T.; validation, S.T. and S.P.; formal analysis, S.T. and S.P.; investigation, S.T.; resources, S.P.; data curation, S.T. and S.P.; writing—original draft preparation, S.T.; writing—review and editing, C.K., A.I. and S.P.; visualization, S.T. and S.P.; supervision, S.P. and A.I.; funding acquisition, S.P. All authors have read and agreed to the published version of the manuscript.

Funding

This work was partially financially supported by a research grant from the Department of Biology, School of Science, King Mongkut’s Institute of Technology Ladkrabang. S.T. thanks the School of Science, King Mongkut’s Institute of Technology Ladkrabang for his scholarship (RA/TA-2562-D-011).

Institutional Review Board Statement

Not applicable.

Informed Consent Statement

Not applicable.

Data Availability Statement

The data presented in this study are available on request from the corresponding author.

Conflicts of Interest

The authors declare no conflicts of interest.

References

  1. Trabelsi, L.; Ben Ouada, H.; Bacha, H.; Ghoul, M. Combined Effect of Temperature and Light Intensity on Growth and Extracellular Polymeric Substance Production by the Cyanobacterium Arthrospira platensis. J. Appl. Phycol. 2009, 21, 405–412. [Google Scholar] [CrossRef]
  2. Rai, S.V.; Rajashekhar, M. Effect of pH, Salinity and Temperature on the Growth of Six Species of Cyanobacteria Isolated from Arabian Sea Coast of Karnataka. Int. J. BioSci. Technol. 2016, 9, 1–6. [Google Scholar]
  3. Shukla, M.; Tabassum, R.; Singh, R.; Dhar, D.W. Influence of Light Intensity, Temperature and CO2 Concentration on Growth and Lipids in Green Algae and Cyanobacteria. Indian J. Exp. Biol. 2016, 54, 482–487. [Google Scholar]
  4. Meng, F.; Cui, H.; Wang, Y.; Li, X. Responses of a New Isolated Cyanobacterium aponinum Strain to Temperature, pH, CO2 and Light Quality. J. Appl. Phycol. 2018, 30, 1525–1532. [Google Scholar] [CrossRef]
  5. Elshobary, M.E.; Abo-Shanab, W.A.; Ende, S.S.W.; Alquraishi, M.; El-Shenody, R.A. Optimizing Phaeodactylum tricornutum Cultivation: Integrated Strategies for Enhancing Biomass, Lipid, and Fucoxanthin Production. Biotechnol. Biofuels Bioprod. 2025, 18, 7. [Google Scholar] [CrossRef]
  6. Klepacz-Smółka, A.; Pietrzyk, D.; Szeląg, R.; Głuszcz, P.; Daroch, M.; Tang, J.; Ledakowicz, S. Effect of Light Colour and Photoperiod on Biomass Growth and Phycocyanin Production by Synechococcus PCC 6715. Bioresour. Technol. 2020, 313, 123700. [Google Scholar] [CrossRef]
  7. Hoi, S.K.; Winayu, B.N.R.; Hsueh, H.T.; Chu, H. Light Factors and Nitrogen Availability to Enhance Biomass and C-Phycocyanin Productivity of Thermosynechococcus sp. CL-1. Biochem. Eng. J. 2021, 167, 107899. [Google Scholar] [CrossRef]
  8. Han, G.; Shen, G.; Zhao, R.; Bryant, D.A. Additional Families of Orange Carotenoid Proteins in the Photoprotective System of Cyanobacteria. Plant Physiol. Biochem. 2017, 118, 626–636. [Google Scholar] [CrossRef]
  9. Maltsev, Y.; Maltseva, K.; Kulikovskiy, M.; Maltseva, S. Influence of Light Conditions on Microalgae Growth and Content of Lipids, Carotenoids, and Fatty Acid Composition. Biology 2021, 10, 1060. [Google Scholar] [CrossRef]
  10. Okamoto, A.; Imamura, M.; Tani, K.; Matsumoto, T. The Effect of Using Light Emitting Diodes and Fluorescent Lamps as Different Light Sources in Growth Inhibition Tests of Green Alga, Diatom, and Cyanobacteria. PLoS ONE 2021, 16, e0247426. [Google Scholar] [CrossRef]
  11. Goldoost, H.; Vahabzadeh, F.; Fallah, N. Lipids Productivity of Cyanobacterium Anabaena vaginicola in an Internally Illuminated Photobioreactor Using LED Bar Lights. Sci. Rep. 2024, 14, 6857. [Google Scholar] [CrossRef]
  12. Lima, G.M.; Teixeira, P.C.N.; Teixeira, C.M.L.L.; Filócomo, D.; Lage, C.L.S. Influence of Spectral Light Quality on the Pigment Concentrations and Biomass Productivity of Arthrospira platensis. Algal Res. 2018, 31, 157–166. [Google Scholar] [CrossRef]
  13. Hotos, G.N.; Antoniadis, T.I. The Effect of Colored and White Light on Growth and Phycobiliproteins, Chlorophyll and Carotenoids Content of the Marine Cyanobacteria Phormidium sp. and Cyanothece sp. in Batch Cultures. Life 2022, 12, 837. [Google Scholar] [CrossRef] [PubMed]
  14. Markou, G. Effect of Various Colors of Light-Emitting Diodes (LEDs) on the Biomass Composition of Arthrospira platensis Cultivated in Semi-Continuous Mode. Appl. Biochem. Biotechnol. 2014, 172, 2758–2768. [Google Scholar] [CrossRef] [PubMed]
  15. McGee, D.; Archet, L.; Fleming, G.T.A.; Gillespie, E.; Touzet, N. Influence of Spectral Intensity and Quality of LED Lighting on Photoacclimation, Carbon Allocation and High-Value Pigments in Microalgae. Photosynth. Res. 2020, 143, 67–80. [Google Scholar] [CrossRef]
  16. Luimstra, V.M.; Schuurmans, J.M.; Verschoor, A.M.; Hellingwerf, K.J.; Huisman, J.; Matthijs, H.C.P. Blue Light Reduces Photosynthetic Efficiency of Cyanobacteria through an Imbalance between Photosystems I and II. Photosynth. Res. 2018, 138, 177–189. [Google Scholar] [CrossRef]
  17. Toyoshima, M.; Toya, Y.; Shimizu, H. Flux Balance Analysis of Cyanobacteria Reveals Selective Use of Photosynthetic Electron Transport Components under Different Spectral Light Conditions. Photosynth. Res. 2020, 143, 31–43. [Google Scholar] [CrossRef]
  18. Wong, Y.K.; Ho, Y.H.; Ho, K.C.; Leung, H.M.; Chow, K.P.; Yung, K.K.L. Effect of Different Light Sources on Algal Biomass and Lipid Production in Internal LEDs-Illuminated Photobioreactor. J. Mar. Biol. Aquac. 2016, 2, 1–8. [Google Scholar] [CrossRef]
  19. Atta, M.; Idris, A.; Bukhari, A.; Wahidin, S. Intensity of Blue LED Light: A Potential Stimulus for Biomass and Lipid Content in Freshwater Microalgae Chlorella vulgaris. Bioresour. Technol. 2013, 148, 373–378. [Google Scholar] [CrossRef]
  20. Ishitani, M.; Takabe, T.; Kojima, K.; Takabe, T. Regulation of Glycinebetaine Accumulation in the Halotolerant Cyanobacterium Aphanothece halophytica. Aust. J. Plant Physiol. 1993, 20, 693–703. [Google Scholar] [CrossRef]
  21. Hibino, T.; Kaku, N.; Yoshikawa, H.; Takabe, T.; Takabe, T. Molecular Characterization of DnaK from the Halotolerant Cyanobacterium Aphanothece halophytica for ATPase, Protein Folding, and Copper Binding under Various Salinity Conditions. J. Biol. Chem. 1999, 40, 409–418. [Google Scholar] [CrossRef]
  22. Waditee, R.; Tanaka, Y.; Aoki, K. Isolation and Functional Characterization of N-Methyltransferases that Catalyze Betaine Synthesis from Glycine in a Halotolerant Photosynthetic Organism Aphanothece halophytica. J. Biol. Chem. 2003, 278, 4932–4942. [Google Scholar] [CrossRef] [PubMed]
  23. Chinchusak, N.; Incharoensakdi, A.; Phunpruch, S. Enhancement of Dark Fermentative Hydrogen Production in Nitrogen-deprived Halotolerant Unicellular Cyanobacterium Aphanothece halophytica by Treatment with Reducing Agents. Biomass Bioenergy 2022, 167, 106624. [Google Scholar] [CrossRef]
  24. Chinchusak, N.; Incharoensakdi, A.; Phunpruch, S. Dark Fermentative Hydrogen Production and Transcriptional Analysis of Aphanothece halophytica under Nitrogen and Potassium Deprivation. Front. Bioeng. Biotechnol. 2023, 10, 1028151. [Google Scholar] [CrossRef]
  25. Thongtha, T.; Aryusuk, K.; Kittiwongwattana, C.; Incharoensakdi, A.; Phunpruch, S. Modified Natural Seawater as Growth Medium for the Halotolerant Cyanobacterium Aphanothece halophytica to Increase Lipid Content for Biodiesel Production. J. Appl. Phycol. 2024, 37, 83–95. [Google Scholar] [CrossRef]
  26. Miriam, L.R.M.; Raj, R.E.; Kings, A.J.; Adhi, V.M. Identification and Characterization of a Novel Biodiesel Producing Halophilic Aphanothece halophytica and Its Growth and Lipid Optimization in Various NET Media. Energy Convers. Manag. 2017, 141, 93–100. [Google Scholar] [CrossRef]
  27. Tang, D.; Han, W.; Li, P.; Miao, X.; Zhong, J. CO2 Bio Fixation and Fatty Acid Composition of Scenedesmus obliquus and Chlorella pyrenoidosa in Response to Different CO2 Levels. Bioresour. Technol. 2011, 102, 3071–3076. [Google Scholar] [CrossRef]
  28. Guillard, R.R.L. Division Rates. In Handbook of Phycological Methods: Culture Methods and Growth Measurements; Stein, J.R., Ed.; Cambridge University Press: London, UK, 1973; pp. 289–311. [Google Scholar]
  29. Mackinney, G. Absorption of Light by Chlorophyll Solutions. J. Biol. Chem. 1941, 140, 315–322. [Google Scholar] [CrossRef]
  30. Britton, G. General Carotenoid Methods. In Methods in Enzymology; Elsevier: Amsterdam, The Netherlands, 1985; pp. 113–149. [Google Scholar] [CrossRef]
  31. Hsieh, P.; Pedersen, J.Z.; Bruno, L. Photoinhibition of Cyanobacteria and Its Application in Cultural Heritage Conservation. Photochem. Photobiol. 2014, 90, 533–543. [Google Scholar] [CrossRef]
  32. Axelsson, M.; Gentili, F. A Single-Step Method for Rapid Extraction of Total Lipids from Green Microalgae. PLoS ONE 2014, 9, e89643. [Google Scholar] [CrossRef]
  33. Lepage, G.; Roy, C.C. Improved Recovery of Fatty Acid through Direct Transesterification without Prior Extraction or Purification. J. Lipid Res. 1984, 25, 1391–1396. [Google Scholar] [CrossRef] [PubMed]
  34. Pojjanapornpun, S.; Nolvachai, Y.; Aryusuk, K.; Kulsing, C.; Krisnangkura, K.; Marriott, P.J. Ionic Liquid Phases with Comprehensive Two-Dimensional Gas Chromatography of Fatty Acid Methyl Esters. Anal. Bioanal. Chem. 2018, 410, 4669–4677. [Google Scholar] [CrossRef] [PubMed]
  35. Talebi, A.F.; Tabatabaei, M.; Chisti, Y. Biodiesel Analyzer: A User-Friendly Software for Predicting the Properties of Prospective Biodiesel. Biofuel Res. J. 2014, 2, 55–57. [Google Scholar] [CrossRef]
  36. Park, J.; Dinh, T.B. Contrasting Effects of Monochromatic LED Lighting on Growth, Pigments and Photosynthesis in the Commercially Important Cyanobacterium Arthrospira maxima. Bioresour. Technol. 2019, 291, 121846. [Google Scholar] [CrossRef]
  37. Larkum, A.W.D. Light-Harvesting in Cyanobacteria and Eukaryotic Algae: An Overview. In Advances in Photosynthesis and Respiration; Springer International Publishing: Cham, Switzerland, 2020; pp. 207–260. [Google Scholar] [CrossRef]
  38. Schulze, P.S.C.; Barreira, L.A.; Pereira, H.G.C.; Perales, J.A.; Varela, J.C.S. Light Emitting Diodes (LEDs) Applied to Microalgal Production. Trends Biotechnol. 2014, 32, 422–430. [Google Scholar] [CrossRef]
  39. Glemser, M.; Heining, M.; Schmidt, J.; Becker, A.; Garbe, D.; Buchholz, R.; Brück, T. Application of Light-Emitting Diodes (LEDs) in Cultivation of Phototrophic Microalgae: Current State and Perspectives. Appl. Microbiol. Biotechnol. 2016, 100, 1077–1088. [Google Scholar] [CrossRef]
  40. Zhao, Y.; Wang, J.; Zhang, H.; Yan, C.; Zhang, Y. Effects of Various LED Light Wavelengths and Intensities on Microalgae-Based Simultaneous Biogas Upgrading and Digestate Nutrient Reduction Process. Bioresour. Technol. 2013, 136, 461–468. [Google Scholar] [CrossRef]
  41. Teo, C.L.; Atta, M.; Bukhari, A.; Taisir, M.; Yusuf, A.M.; Idris, A. Enhancing Growth and Lipid Production of Marine Microalgae for Biodiesel Production via the Use of Different LED Wavelengths. Bioresour. Technol. 2014, 162, 38–44. [Google Scholar] [CrossRef]
  42. Chang, M.H.; Das, D.; Varde, P.V.; Pecht, M. Light Emitting Diodes Reliability Review. Microelectron. Reliab. 2012, 52, 62–782. [Google Scholar] [CrossRef]
  43. Ra, C.H.; Sirisuk, P.; Jung, J.H.; Jeong, G.T.; Kim, S.K. Effects of Light-Emitting Diode (LED) with a Mixture of Wavelengths on the Growth and Lipid Content of Microalgae. Bioprocess Biosyst. Eng. 2018, 41, 457–465. [Google Scholar] [CrossRef]
  44. Sharmila, D.; Suresh, A.; Suresh, A.; Indhumathi, J.; Velmurugan, N. Impact of Various Color Filtered LED Lights on Microalgae Growth, Pigments and Lipid Production. Eur. J. Biotechnol. Biosci. 2018, 6, 1–7. [Google Scholar]
  45. Asuthkar, M.; Gunti, Y.; Rao, R.; Rao, C.S.; Yadavalli, R. Effect of Different Wavelengths of Light on the Growth of Chlorella pyrenoidosa. Int. J. Pharm. Sci. Res. 2016, 7, 847–851. [Google Scholar] [CrossRef]
  46. Liu, X.; Hong, Y.; Liu, Y. Cultivation of Chlorella sp. HQ in Inland Saline-Alkaline Water under Different Light Qualities. Front. Environ. Sci. Eng. 2022, 16, 45. [Google Scholar] [CrossRef]
  47. Das, P.; Aziz, S.S.; Obbard, J.P. Two-Phase Microalgae Growth in the Open System for Enhanced Lipid Productivity. Renew. Energy 2011, 36, 2524–2528. [Google Scholar] [CrossRef]
  48. Tian, J.-H.; Pourcher, A.-M.; Bize, A.; Wazeri, A.; Peu, P. Impact of Wet Aerobic Pretreatments on Cellulose Accessibility and Bacterial Communities in Rape Straw. Bioresour. Technol. 2017, 237, 31–38. [Google Scholar] [CrossRef]
  49. Vijaya, V.; Anand, N. Blue Light Enhances the Pigment Synthesis in Cyanobacterium Anabaena ambigua Rao (Nostocales). ARPN J. Agric. Biol. Sci. 2009, 4, 36–43. [Google Scholar]
  50. Hauschild, C.A.; Heather, M.C.; Murter, H.J.G.; Pick, F.R. Effect of Spectral Quality on Growth and Pigmentation of Picocyanobacteria. J. Phycol. 1991, 27, 698–702. [Google Scholar] [CrossRef]
  51. Luimstra, V.M.; Schuurmans, J.M.; Hellingwerf, K.J.; Matthijs, H.C.P.; Huisman, J. Blue Light Induces Major Changes in the Gene Expression Profile of the Cyanobacterium Synechocystis sp. PCC 6803. Physiol. Plant. 2020, 170, 10–26. [Google Scholar] [CrossRef]
  52. Contreras-Ropero, J.E.; Lidueñez-Ballesteros, V.S.; Rodríguez-Bohórquez, A.D.; García-Martínez, J.B.; Urbina-Suarez, N.A.; López-Barrera, G.L.; Barrajas-Solano, A.F.; Bryan, S.J.; Zuorro, A. The Effect of LEDs on Biomass and Phycobiliproteins Production in Thermotolerant Oscillatoria sp. Appl. Sci. 2022, 12, 11664. [Google Scholar] [CrossRef]
  53. Kahn, A.; Oliveira, P.; Cuau, M.; Leão, P.N. Incorporation, Fate, and Turnover of Free Fatty Acids in Cyanobacteria. FEMS Microbiol. Rev. 2023, 47, fuad015. [Google Scholar] [CrossRef]
  54. Mori-Moriyama, N.; Yoshitomi, T.; Sato, N. Acyl Plastoquinol Is a Major Cyanobacterial Substance That Co-Migrates with Triacylglycerol in Thin-Layer Chromatography. bioRxiv 2023, 641, 8–26. [Google Scholar] [CrossRef]
  55. Yuan, X.; Iannetta, A.A.; Kim, M.; Sadecki, P.W.; Arend, M. Phototropin Connects Blue Light Perception to Starch Metabolism in Green Algae. bioRxiv 2024, 170, 1216. [Google Scholar] [CrossRef]
  56. Jungandreas, A.; Schellenberger Costa, B.; Jakob, T.; Von Bergen, M.; Baumann, S.; Wilhelm, C. The Acclimation of Phaeodactylum tricornutum to Blue and Red Light Does Not Influence the Photosynthetic Light Reaction but Strongly Disturbs the Carbon Allocation Pattern. PLoS ONE 2014, 9, e99727. [Google Scholar] [CrossRef]
  57. Raqiba, H.; Sibi, G. Light-Emitting Diode (LED) Illumination for Enhanced Growth and Cellular Composition in Three Microalgae. Adv. Microb. Res. 2019, 3, 007. [Google Scholar] [CrossRef]
  58. Ra, C.-H.; Kang, C.-H.; Jung, J.-H.; Jeong, G.-T.; Kim, S.-K. Effects of Light-Emitting Diodes (LEDs) on the Accumulation of Lipid Content Using a Two-phase Culture Process with Three Microalgae. Bioresour. Technol. 2016, 212, 254–261. [Google Scholar] [CrossRef] [PubMed]
  59. Sharma, N.; Fleurent, G.; Awwad, F.; Cheng, M.; Meddeb-Mouelhi, F.; Budge, S.M.; Germain, H.; Desgagné-Penix, I. Red Light Variation as an Effective Alternative to Regulate Biomass and Lipid Profiles in Phaeodactylum tricornutum. Appl. Sci. 2020, 10, 2531. [Google Scholar] [CrossRef]
  60. Kim, S.H.; Sunwoo, L.Y.; Hong, H.J.; Awah, C.C.; Jeong, G.T.; Kim, S.K. Lipid and Unsaturated Fatty Acid Productions from Three Microalgae Using Nitrate and Light-Emitting Diodes with Complementary LED Wavelength in a Two-Phase Culture System. Bioprocess Biosyst. Eng. 2019, 42, 1517–1526. [Google Scholar] [CrossRef]
  61. Zhong, Y.; Jin, P.; Cheng, J.J. A Comprehensive Comparable Study of the Physiological Properties of Four Microalgal Species under Different Light Wavelength Conditions. Planta 2018, 248, 489–498. [Google Scholar] [CrossRef]
Figure 1. Relative emission spectra of white fluorescent and LED lights (A) and various LED light qualities: white, blue, green, and red (B). All light intensities were set to 15 μmol photons m−2 s−1.
Phycology 05 00012 g001
Figure 2. Cultivation conditions of A. halophytica under different LED light colors at an intensity of 15 µmol photons m−2s−1.
Phycology 05 00012 g002
Figure 3. Optical density at 730 nm (A) and total cell concentration (B) of A. halophytica cultivated in SNSW medium under the white fluorescent and white LED lights at the same intensity of 15 µmol photons m−2 s−1 for 14 days.
Phycology 05 00012 g003aPhycology 05 00012 g003b
Figure 4. Optical density at 730 nm (A) and total cell concentration (B) of A. halophytica cultivated in SNSW medium under various LED colors at an intensity of 15 µmol photons m−2 s−1 for 14 days.
Phycology 05 00012 g004aPhycology 05 00012 g004b
Figure 5. Optical density at 730 nm (A) and total cell concentration (B) of A. halophytica cultivated in SNSW medium under blue LED light with different intensities from 15 to 60 µmol photons m−2 s−1 for 14 days.
Phycology 05 00012 g005
Table 1. Cell density, specific growth rate, doubling time, lipid content, and lipid productivity of A. halophytica cultivated in SNSW medium under white fluorescent and white LED lights at an intensity of 15 µmol photons m−2 s−1 for 14 days. Data were analyzed in three independent measurements and expressed as mean ± SD. Different superscript letters indicate statistically significant differences between samples in the same column at a 95% confidence level.
Type of Light SourceCell Density
(×106 Cells
mL−1)
Specific Growth Rate
(Day−1)
Doubling Time
(Days)
Lipid
Content
(%)
Lipid Productivity
(mg L−1 day−1)
White Fluorescent20.56 ± 0.37 b0.216 ± 0.001 b3.21 ± 0.02 b43.12 ± 0.14 b39.37 ± 0.87 b
White LED26.16 ± 0.36 a0.233 ± 0.001 a2.97 ± 0.01 a50.63 ± 1.06 a47.74 ± 0.97 a
Table 2. Pigment contents of A. halophytica cells cultivated in SNSW medium under white fluorescent and LED lights at an intensity of 15 µmol photons m−2 s−1 for 14 days. Data were analyzed in three independent measurements and expressed as mean ± SD. Different superscript letters indicate statistically significant differences between samples in the same column at a 95% confidence level.
Type of Light SourceChlorophyll a
(µg mL−1)
Carotenoid
(µg mL−1)
Phycocyanin
(µg mL−1)
Allophycocyanin
(µg mL−1)
Phycoerythrin
(µg mL−1)
White Fluorescent2.57 ± 0.05 a0.74 ± 0.01 a4.52 ± 0.13 b5.45 ± 0.11 b1.66 ± 0.40 b
White LED2.68 ± 0.09 a0.66 ± 0.01 b5.21 ± 0.80 a7.78 ± 0.09 a2.76 ± 0.31 a
Table 3. Cell density, specific growth rate, doubling time, lipid content, and lipid productivity of A. halophytica cultivated in SNSW medium under colored LEDs at an intensity of 15 µmol photons m−2 s−1 for 14 days. Data were analyzed in three independent measurements and expressed as mean ± SD. Different superscript letters indicate statistically significant differences between samples in the same column at a 95% confidence level.
LED ColorCell Density
(×106 Cells
mL−1)
Specific Growth Rate
(Day−1)
Doubling Time
(Days)
Lipid
Content
(%)
Lipid Productivity
(mg L−1 day−1)
White26.82 ± 0.22 b0.235 ± 0.001 b2.95 ± 0.01 b51.51 ± 0.81 b46.38 ± 2.15 b
Blue32.33 ± 0.63 a0.248 ± 0.001 a2.79 ± 0.02 a53.10 ± 0.73 a50.53 ± 0.59 a
Green20.23 ± 0.59 c0.214 ± 0.002 c3.23 ± 0.03 c47.87 ± 0.42 c43.05 ± 0.24 c
Red26.56 ± 0.54 b0.234 ± 0.002 b2.96 ± 0.02 b50.38 ± 0.66 b47.33 ± 0.78 b
Table 4. Pigment contents of A. halophytica cells cultivated in SNSW medium under different colored LED lights at an intensity of 15 µmol photons m−2 s−1 for 14 days. Data were analyzed in three independent measurements and expressed as mean ± SD. Different superscript letters indicate statistically significant differences between samples in the same column at a 95% confidence level.
LED ColorChlorophyll a
(µg mL−1)
Carotenoid
(µg mL−1)
Phycocyanin
(µg mL−1)
Allophycocyanin
(µg mL−1)
Phycoerythrin
(µg mL−1)
White2.68 ± 0.09 ab0.66 ± 0.01 e5.21 ± 0.80 c7.78 ± 0.09 c2.76 ± 0.31 c
Blue2.82 ± 0.07 a1.26 ± 0.02 a13.02 ± 0.21 a15.63 ± 0.36 a5.89 ± 0.06 a
Green2.60 ± 0.08 b0.93 ± 0.01 c7.12 ± 0.46 b10.90 ± 0.46 b4.39 ± 0.24 b
Red2.57 ± 0.10 b1.02 ± 0.01 b13.57 ± 1.44 a16.16 ± 1.04 a6.23 ± 0.40 a
Table 5. Cell density, specific growth rate, doubling time, lipid content, and lipid productivity of A. halophytica cultivated in SNSW medium under blue LED light with different intensities from 15 to 60 µmol photons m−2 s−1 for 14 days. Data were analyzed in three independent measurements and expressed as mean ± SD. Different superscript letters indicate statistically significant differences between samples in the same column at a 95% confidence level.
Blue LED Intensity
(µmol Photons
m−2 s−1)
Cell Density
(×106 Cells
mL−1)
Specific Growth Rate
(µ) (Day−1)
Doubling Time
(Days)
Lipid
Content
(%)
Lipid Productivity
(mg L−1
day−1)
1532.70 ± 1.86 d0.249 ± 0.004 d2.78 ± 0.04 d52.97 ± 0.23 d52.37 ± 0.77 d
3044.33 ± 1.15 c0.270 ± 0.002 c2.56 ± 0.02 c53.76 ± 0.34 c53.82 ± 0.40 c
4551.53 ± 1.37 b0.281 ± 0.002 b2.46 ± 0.02 b54.41 ± 0.08 b55.23 ± 0.45 b
6068.96 ± 1.52 a0.302 ± 0.002 a2.29 ± 0.01 a55.16 ± 0.10 a56.81 ± 0.75 a
Table 6. Pigment contents of A. halophytica cells cultivated in SNSW medium under blue LED light with different intensities from 15 to 60 µmol photons m−2 s−1 for 14 days. Data were analyzed in three independent measurements and expressed as mean ± SD. Different superscript letters indicate statistically significant differences between samples in the same column at a 95% confidence level.
Blue LED Intensity
(µmol Photons
m−2 s−1)
Chlorophyll a
(µg mL−1)
Carotenoid
(µg mL−1)
Phycocyanin
(µg mL−1)
Allophycocyanin
(µg mL−1)
Phycoerythrin
(µg mL−1)
153.41 ± 0.07 d1.26 ± 0.02 d12.71 ± 0.57 d18.95 ± 0.21 d6.73 ± 0.33 d
304.57 ± 0.05 c1.74 ± 0.01 c14.86 ± 0.34 c21.79 ± 0.32 c7.04 ± 0.64 c
455.15 ± 0.05 b2.31 ± 0.01 b15.99 ± 0.44 b23.09 ± 0.34 b7.61 ± 0.46 a
606.03± 0.05 a2.81 ± 0.08 a17.11 ± 0.73 a24.01 ± 0.40 a8.02 ± 0.49 a
Table 7. Fatty acids composition (% of total fatty acid) of total lipids obtained from A. halophytica cells cultivated in SNSW medium under colored LEDs at an intensity of 15 µmol photons m−2 s−1 for 14 days.
Fatty AcidsFatty Acid Composition (%)
White LEDBlue LEDGreen LEDRed LED
Myristic Acid (C14:0)1.872.120.902.05
Palmitic Acid (C16:0)52.5135.6237.0228.62
Palmitoleic Acid (C16:1)2.578.844.036.03
Stearic Acid (C18:0)10.975.197.354.35
Oleic acid (C18:1)8.123.824.813.10
Linoleic Acid (C18:2)9.9816.3016.2019.52
α-Linolenic acid (C18:3)13.9828.1029.6936.32
Saturated fatty acid (SFA)65.3542.9345.2735.02
Monounsaturated fatty acid (MUFA)10.6912.668.849.13
Polyunsaturated fatty acid (PUFA)23.9644.4045.8955.84
Table 8. Properties of biodiesel derived from lipids obtained from A. halophytica cells cultivated in SNSW medium under colored LEDs at an intensity of 15 µmol photons m−2 s−1 for 14 days. Biodiesel properties were analyzed by Biodiesel Analyzer version 1.1.
Biodiesel PropertiesWhite LEDBlue LEDGreen LEDRed LED
DU58.6101.4100.6120.8
SV210.6209.4207.9207.5
IV66.2118.6118.9143.5
CN57.345.645.740.3
LCSF10.76.17.35.0
CFPP17.22.86.7−0.6
CP22.613.714.410.0
APE56.092.696.5114.7
BAPE37.972.575.592.1
OS7.55.25.14.7
HHV39.239.239.239.2
υ1.31.21.21.1
Ρ870870870880
DU: Degree of unsaturation (% wt.), SV: Saponification value (mg g−1) IV: Iodine value g I2 (100 g)−1, CN: Cetane number, LCSF: Long-chain saturated factor, CFPP: Cold filter plugging point (°C), CP: Cloud point (°C), PP: Pour point (°C), APE: Allylic position equivalent, BAPE: Bis-allylic position equivalent, OS: Oxidation stability (h), HHV: Higher heating value (MJ kg−1), υ: Kinematic viscosity (mm2 s−1), ρ: Density (kg m−3).
Disclaimer/Publisher’s Note: The statements, opinions and data contained in all publications are solely those of the individual author(s) and contributor(s) and not of MDPI and/or the editor(s). MDPI and/or the editor(s) disclaim responsibility for any injury to people or property resulting from any ideas, methods, instructions or products referred to in the content.

