Article

Hydrodynamic Model Tests for Seaweed as a Source of Energy Reduction during Extreme Events

by
Olanrewaju Sulaiman Oladokun
Helmholtz Center for Polar and Marine Research, Alfred-Wegener-Institute, 27510 Bremerhaven, Germany
Aquac. J. 2023, 3(3), 181-195; https://doi.org/10.3390/aquacj3030015
Submission received: 23 February 2023 / Revised: 8 June 2023 / Accepted: 13 June 2023 / Published: 14 July 2023
(This article belongs to the Special Issue Feature Papers in Aquaculture 2022)

Abstract

:
One fifth of the world’s population and critical infrastructures are close to the coast and regions of high-risk sea level rise elevation. The last decades have been characterized by increasing extreme events, including storm surges, flooding, coastal erosion, enhanced coastal vulnerability with associated livelihood, and economic losses. Nature-based engineering solutions are being adopted as sustainable solutions for helping existing technologies live their design life and providing climate change adaptation and resilience for coastal and riverine communities. This paper involves the investigation of nature-based eco-hydraulic soft coastal engineering to cultivate seaweed for coastal protection. In this context, the present study involves an advanced risk evaluation performed by conducting an extreme bore interaction with seaweed as a soft engineering coastal protection measure. The load reduction on the inland structure during extreme flooding conditions, incorporating seaweed, is addressed. The present study indicates that the load on inland structures can be reduced by as much as 14% in extreme flooding conditions in the presence of seaweed with two rows of seaweed, indicating the usage of seaweed as a part of coastal protection over existing site protection infrastructure for improved coastal mitigation.

1. Introduction

Sea level rise and ecological impacts on the ecosystem are expected to intensify coastal flood events and increase their frequency. The last decades have been characterized by increasing extreme events, including storm surges, flooding, coastal erosion, enhanced coastal vulnerability with associated livelihood, and economic losses [1,2,3]. Hard engineering structures such as seawalls have been used to protect inland structures from extreme hydrodynamic forces during flood inundation [4,5,6]. Nature-based approaches such as mangrove forests or the application of seaweed can protect infrastructure from high-energy wave events and flash floods, while also maintaining local ecosystems by regulating the local biodiversity and providing fish habitats [7,8,9].
Recognizing the increased risk in coastal areas due to population growth, climate change, and the shortcomings of standard mitigation measures, the demand for alternative approaches is rising [10,11,12]. This study involves a hydrodynamic model test experiment at the Institute of Hydraulic Engineering and Water Resources Management (IWW), RWTH Aachen University, to evaluate coastal flood energy reduction by incorporating seaweed as a soft engineering coastal protection measure and the provision of resilience for the existing environment and infrastructure.

Seaweed as a Source of High Wave Energy Reduction

Seaweed (Macroalgae) are fast-growing aquatic plants that grow naturally in most coastal areas around the world. The application of seaweed benefits from their simple cultivation, which does not require irrigation, fertilizers, or arable land areas and can be realized as non-invasive [13,14,15]. The c. 10,000 existing species of seaweeds are divided into three main groups: Phaeophyta (brown algae), Chlorophyta (green algae), and Rhodophyta (red algae). These seaweed groups have specific properties and environmental preferences (e.g., regarding salinity and water temperature). While Phaeophyta prefer environments of cold water and can reach sizes of 10–30 m, Chlorophyta are most common in coastal water, freshwater, and terrestrial environments, while generally being smaller, at around 5–10 m.
The majority of the c. 6500 Rhodophyta species are marine and prefer intertidal to subtidal environments in up to 40 m water depths. The main biomass of red algae is provided by the species Corallinaceae and Gigartinaceae, with various additional species documented for the North and Baltic Seas [16]. Rhodophyta are also common in the open sea. Besides the widespread utilization of seaweed (approx. 30 billion tons per year) as a resource for products of all types (e.g., nutrition, food, bioplastic, and pharmaceuticals) [17,18], seaweed is known to support local ecosystems by supporting the restoration of biodiversity and bioremediation, while also providing fish habitats [19,20]. On a larger scale, seaweed is attributed to positively regulating the ocean temperature, capturing carbon, and subsequentially mitigating climate change [21,22,23]. Furthermore, seaweed is capable of mitigating the nearshore wave climate and cross-shore current velocity, thus reducing coastal erosion significantly [24].
Studies on the advantage and performance of nature for coastal protection are being explored. Seaweed is capable of mitigating the nearshore wave climate and cross-shore currents, thus reducing coastal erosion significantly [4,24]. Branched algae species act as an area reducer by limiting dragged sediment by reducing the projected area inflow. Seaweed has reportedly been found to attenuate waves by 80% [25]. However, there is a lack of available data on understanding the hydrodynamic load reduction due to seaweed platform design under extreme conditions such as coastal floods and tsunamis. Thus, model tests are the best way to quickly obtain such data. For this purpose, samples of seaweed cultures are obtained and subjected to dynamic tests. These tests are expected to provide insight into the performance of soft vegetation in coastal protection. Oladokun (2013) conducted a related experiment measuring the wave and current force loads on seaweed [26]. The present study is the extension of the first author’s previous work. In this study, we investigate seaweed as a source of energy or momentum reduction, similar to hard structures such as seawalls, by analyzing the reduction in the force on the inland building.

2. Physical Modelling

The experiments were carried out in the Large Tilting flume at the Institute of Hydraulic Engineering and Water Resources Management, RWTH Aachen, Germany, to replicate coastal flood events on the model scale. The inundating flood during extreme events resembles the movement of the mass of water over the existing still water depth. Henceforth, the experiments were conducted with three wet bed conditions (1 cm, 3 cm, and 5 cm). The movement of the mass of water over the still water depth is called a bore [2,27]. The bore was generated with the help of two pumps. The experimental flume could generate a discharge of up to 400 L/s. The bores of different strengths were generated by controlling the opening valve positions of the two pumps. The period of bore generation could also be controlled in the current experimental facility. To generate the wet bed bore, an initial still water depth ‘ds’ was ensured in the laboratory by adjusting the height of the barriers in the front end and rear end of the flume (Table 1). The generated bore in the wet bed case had an initial aerated bore front, followed by a quasi-steady flow phase; the characteristics were almost similar to the traditional tsunami bore [28,29,30]. The generated bore details are provided in Table 1. The test conditions in the laboratory were adopted from Harish et al. (2021) for comparability [28].
The experiments were carried out at a 1:30 scale. Three sets of experiments were carried out to understand the effect of seaweed in reducing the forces on the inland structure. (1). Experiments without seaweed and the structure for understanding the free-flow hydrodynamics (bore depth, h and bore velocity, u), (2). Experiments with the structure and without seaweed for obtaining forces in the absence of seaweed. (3). Experiments with the seaweed and structure for obtaining the force reduction. The idea behind the experiments was that design engineers can evaluate the forces on inland structures using h and u from the field measurements. As such, the second and third authors’ previous study results were partially used to appreciate the force reduction in this study. The instrumentation details are provided further.
A rectangular model was placed behind the seaweed to estimate the momentum loss due to the seaweed. The model represented a typical coastal building in a 1:30 Froude scaling. The building model was made of acrylic sheets. The model had 0.3 m × 0.3 m in its cross-section, representing b/W = 0.3 in the laboratory, where b was the building model width and W was the flow channel width. The building model was fixed at 16.9 m from the barrier (Figure 1). The seaweed was placed at 1 m and 1.3 m in front of the building. A six-axis load cell was used for measuring the force on the structure (interface force 6A130). Six ultrasonic wave gauges were used for measuring the bore height. WG6 measured the free-flow bore depth (h) in the absence of the structure and seaweed. A propeller meter was used to measure the flow velocity (u) at 3 cm and 6 cm from the bottom level (Figure 1a). Depth-averaged velocity was used further during the analysis. It is to be noted that the velocity measurements were carried out only for the experiments without the structure and seaweed. Figure 1 shows the location of all the instruments and the modeled structure and seaweed in the experimental flume for the experiments without the structure and the experiments with the structure and seaweed.
All the instruments were connected to a standard Data Acquisition System (NI USB-6211 DAQ). The seaweed was placed at 15.9 m and 15.6 m from the barrier (1 m and 1.3 m before the building). Once the bore generation started, the DAQ was started manually. Since all the instruments were synchronized to a single DAQ, the time synchronization was directly handled. For the analysis, the time at which the incoming bore crossed WG1 was taken as a reference time (time, t = 0 s), and all the data were time-shifted to this reference time for the analysis.

Seaweed Models

The 5 seaweed species are native to the European water were used for the experiment. Samples (clumps) of dried seaweed (see Figure 2) can be restored to nearly nominal properties when soaked in water for some time. A typical-size seaweed clump is shown in Figure 2. A clump may weigh up to 2.0 kg in the air when fully grown. However, the buoyancy nature of seaweed makes its weight in water almost insignificant. Nevertheless, the plant’s movement affected the incoming flow characteristics, thereby reducing the flow momentum. The samples were subjected to a series of tests to determine the hydrodynamic loading coefficients in a few different configurations. The experiments followed Froude scaling laws, where the seaweed was scaled based on weight at 1:30. This scale was chosen because of the tolerable dimension of the flume and the similar scale used there in the past. The weight of typical fully-grown seaweed is provided by Oladokun, (2013) [26] and the weight of the seaweed used for our experiment was taken and scaled at 1:30 compared with the weight of fully-grown seaweed.
The platform consisted of a frame, an anchoring system, and a geotextile for the algae. The frame with the seaweed was tested in the IWW flume, evaluating the force loss on the inland structure, thereby evaluating the flow attenuation.
A rope was used to tie a sufficient quantity of scaled seaweed. Up to five clumps of seaweed were hung on the line rope, which weighed up to 20 N in dry conditions. The rope was 0.1 m above the flume level. The experiments were carried out with single and two rows of seaweed. Figure 3 shows the two rows of seaweed hung in the lab before the bore interaction. In total, 30 individual experiments were carried out with the seaweed to understand the significance of seaweed in the force reduction on inland structures [6].

3. Result

3.1. Bore Characteristics in the Absence of Seaweed and the Structure

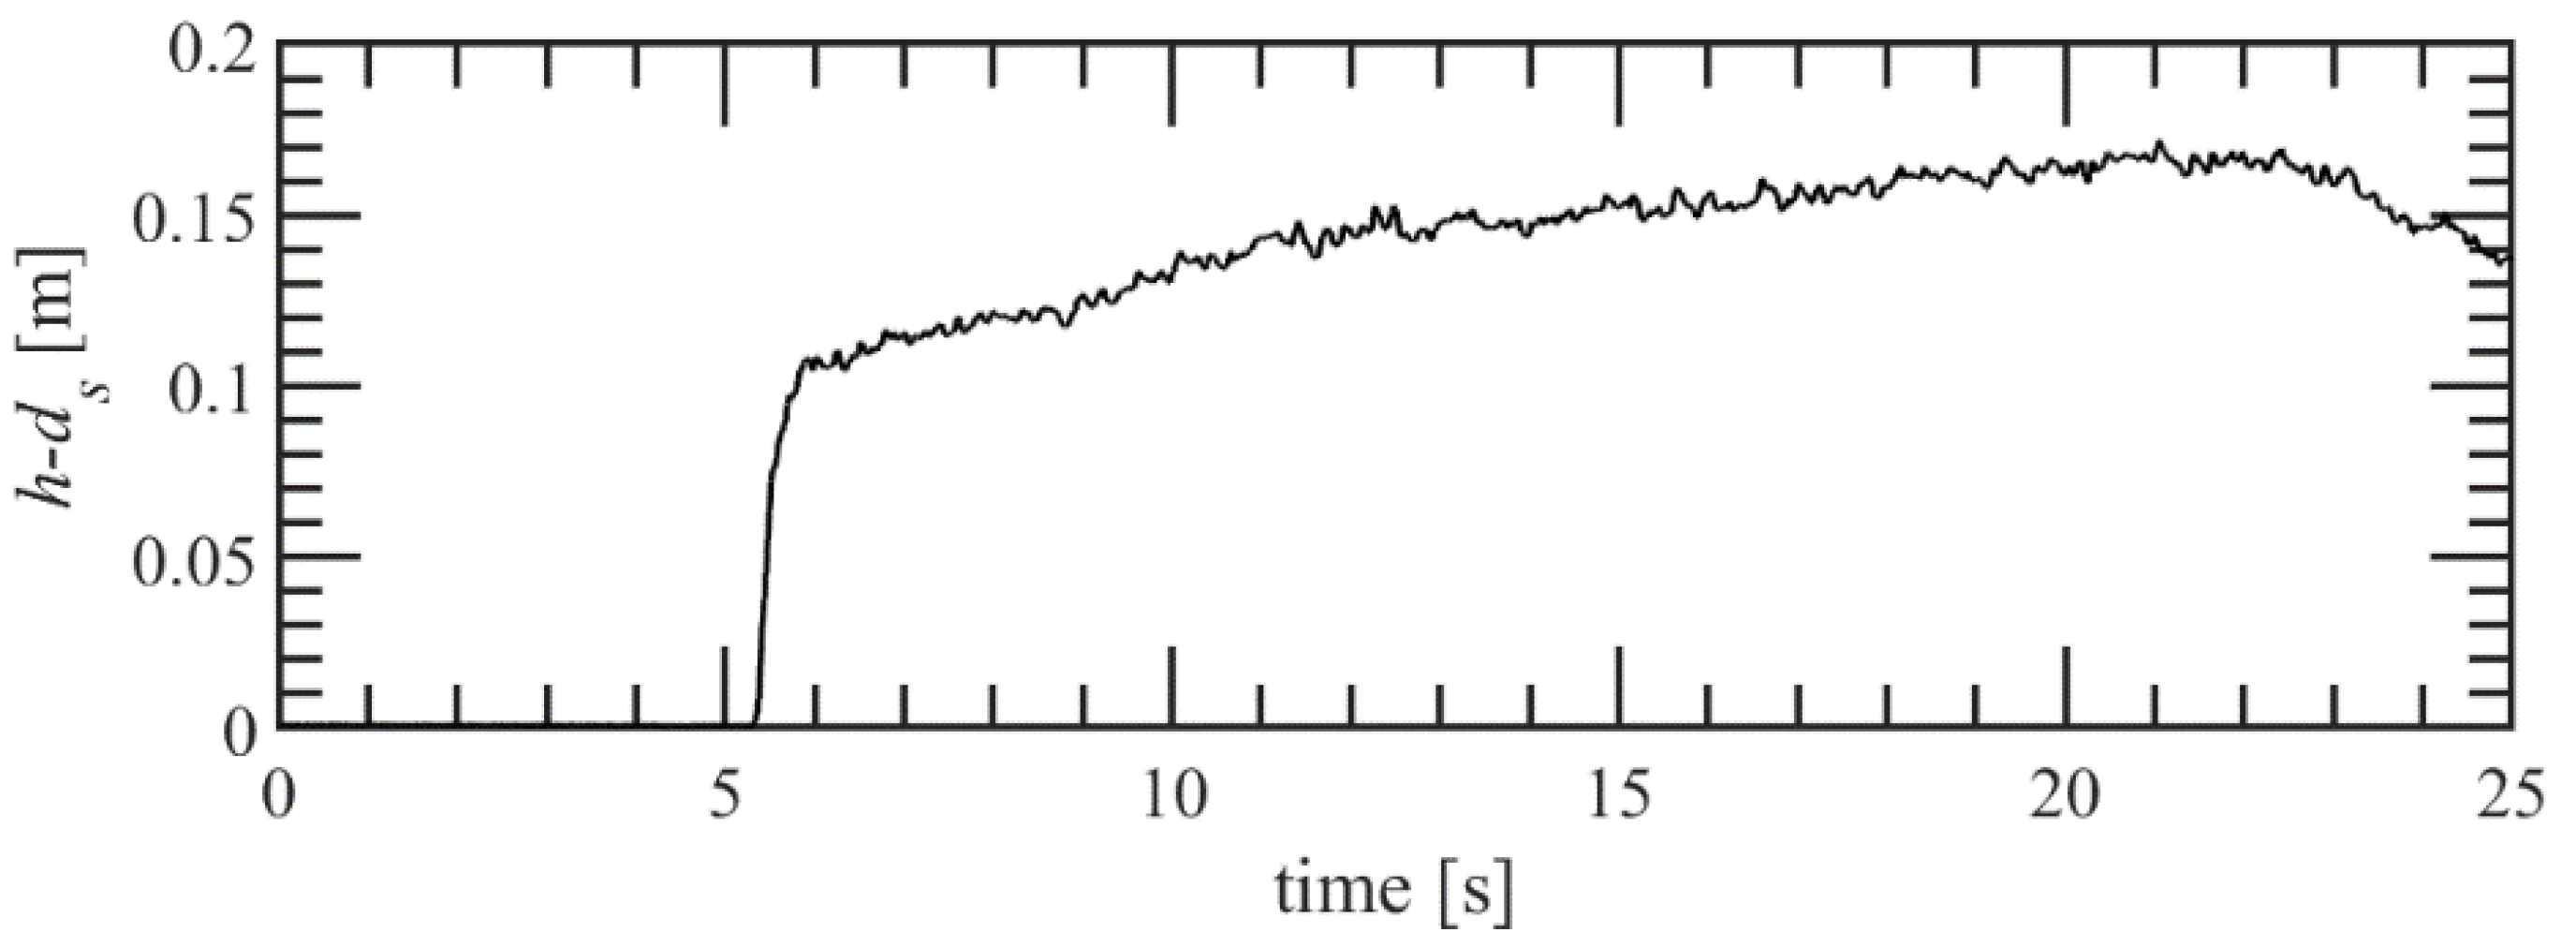
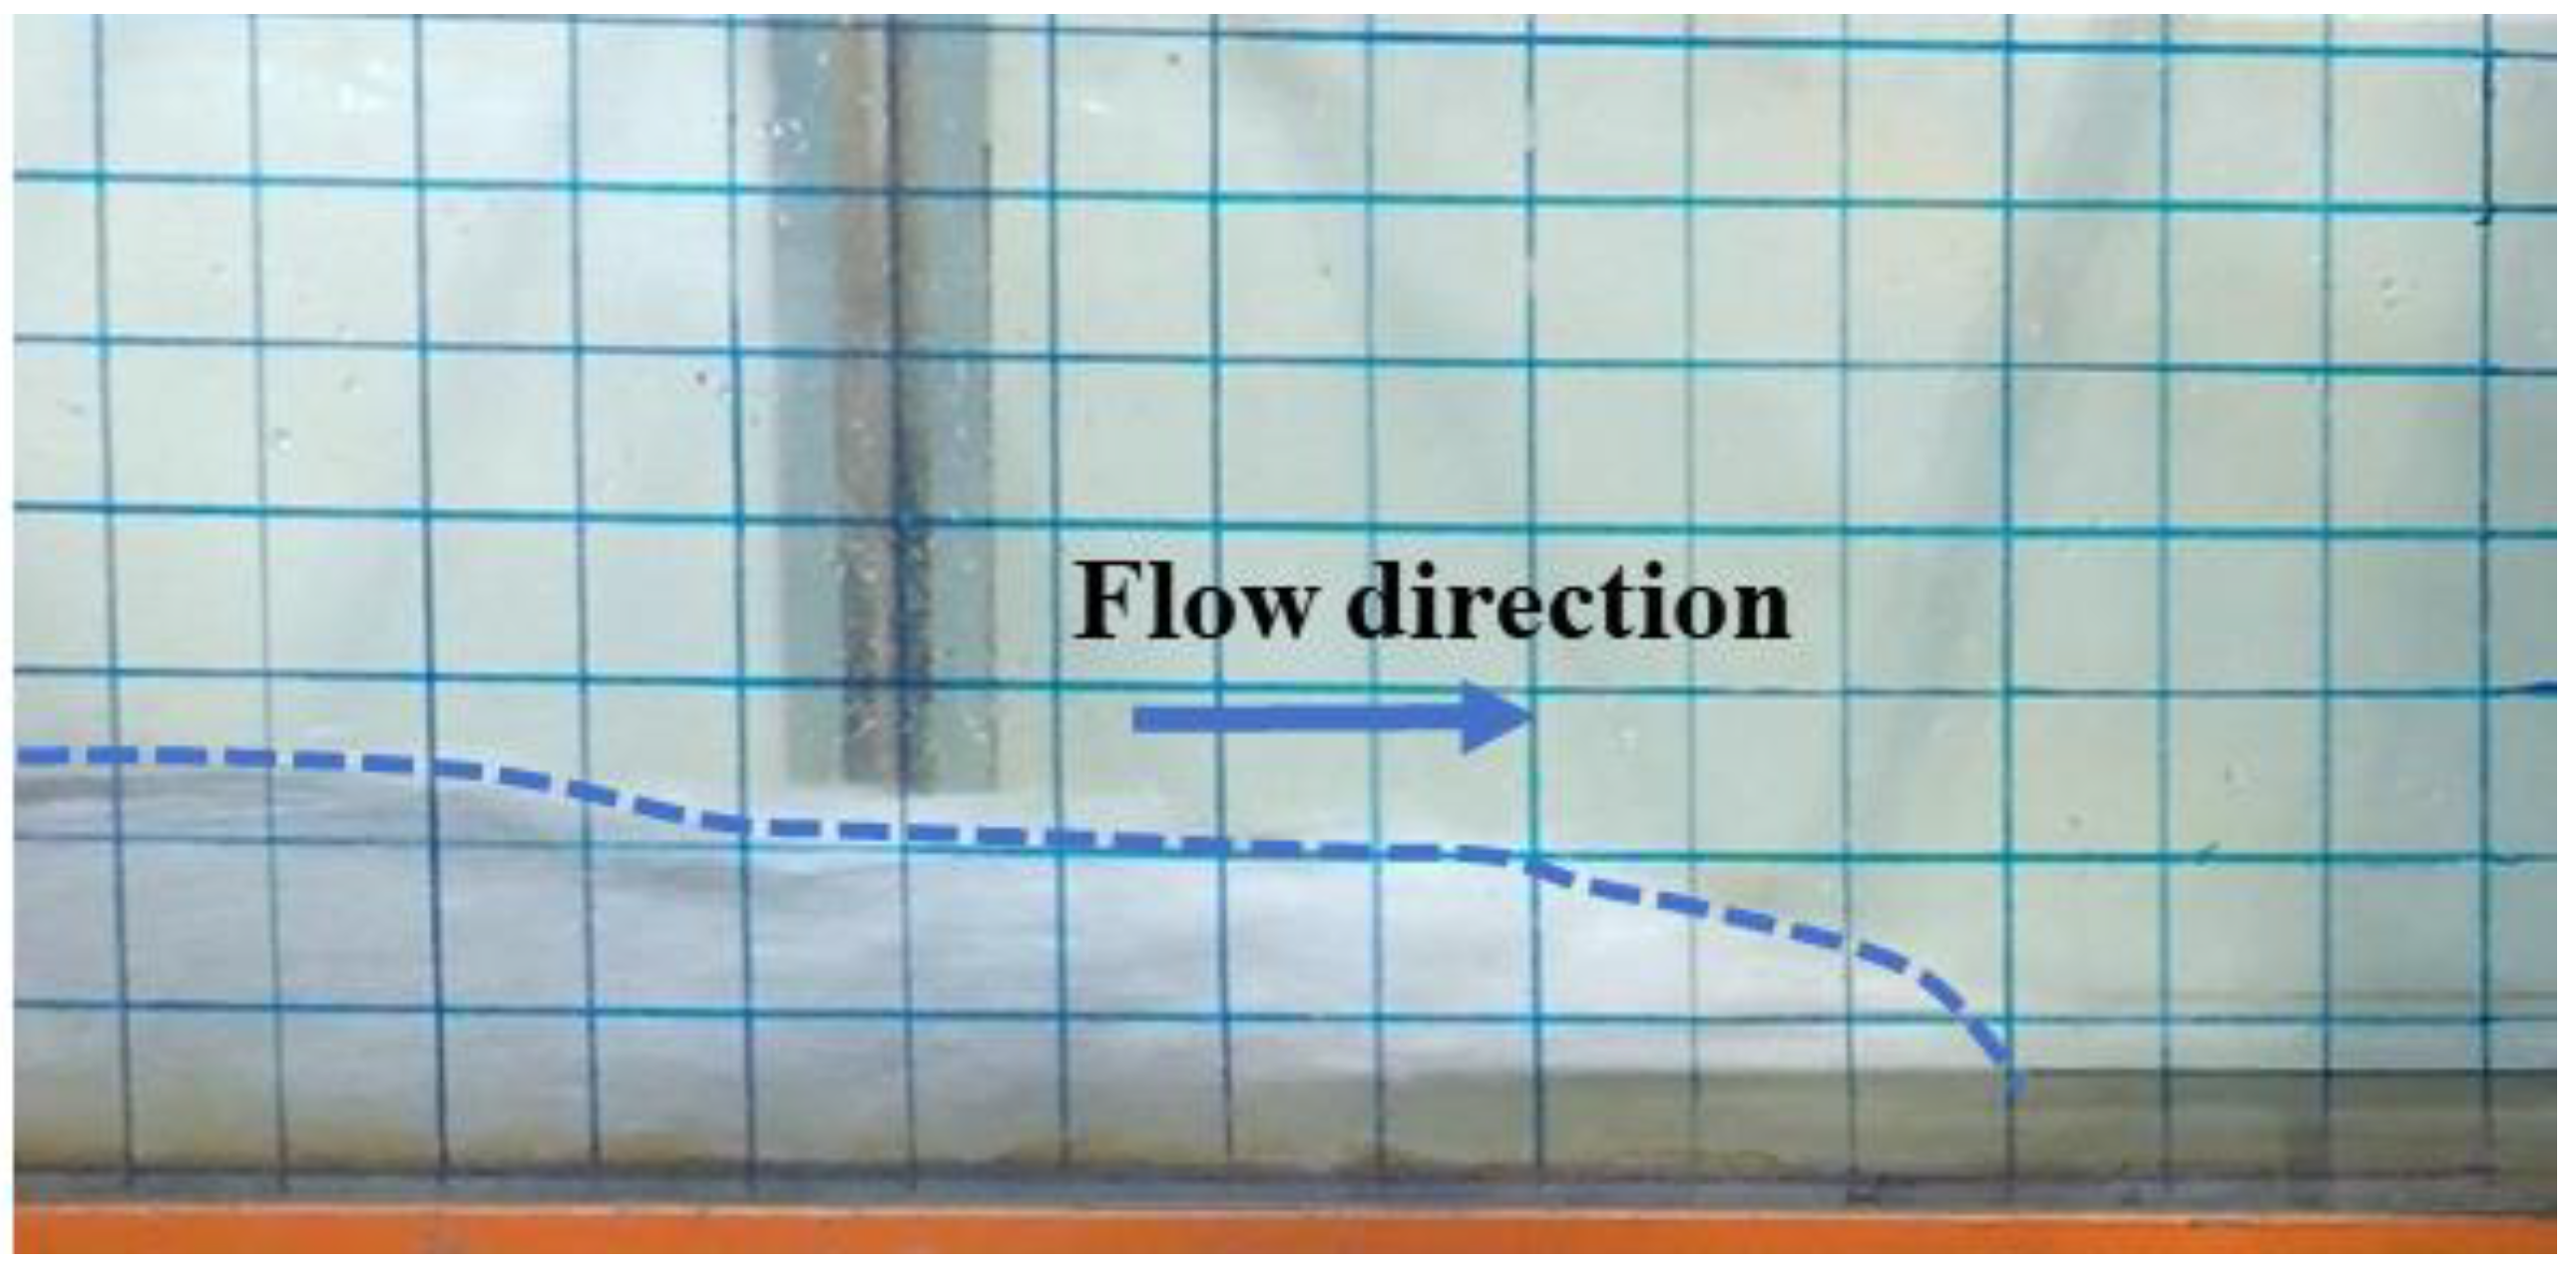
Figure 4 presents the sample bore depth time history (h) for case 3 and ds = 3 cm. From the time history, it can be observed that the bore had a steep bore front due to the movement of the bore over a wet bed. Visually, it resembles a turbulent aerated hydraulic jump (Figure 5). In addition, the Froude number (Fr) obtained from the study was in the range of that from previously occurred tsunamis (Figure 6); hence, this study could find direct applications in tsunami studies [32,33,34,35,36]. The Fr was evaluated by, u refer to flow velocity
F r = u g h
In the Fr plot, the initial few seconds of measurements are not shown, since the bore front was a highly turbulent aerated bore front (Figure 5) that was not captured by the propeller meter [37].

3.2. Forces on the Building in the Absence of Seaweed

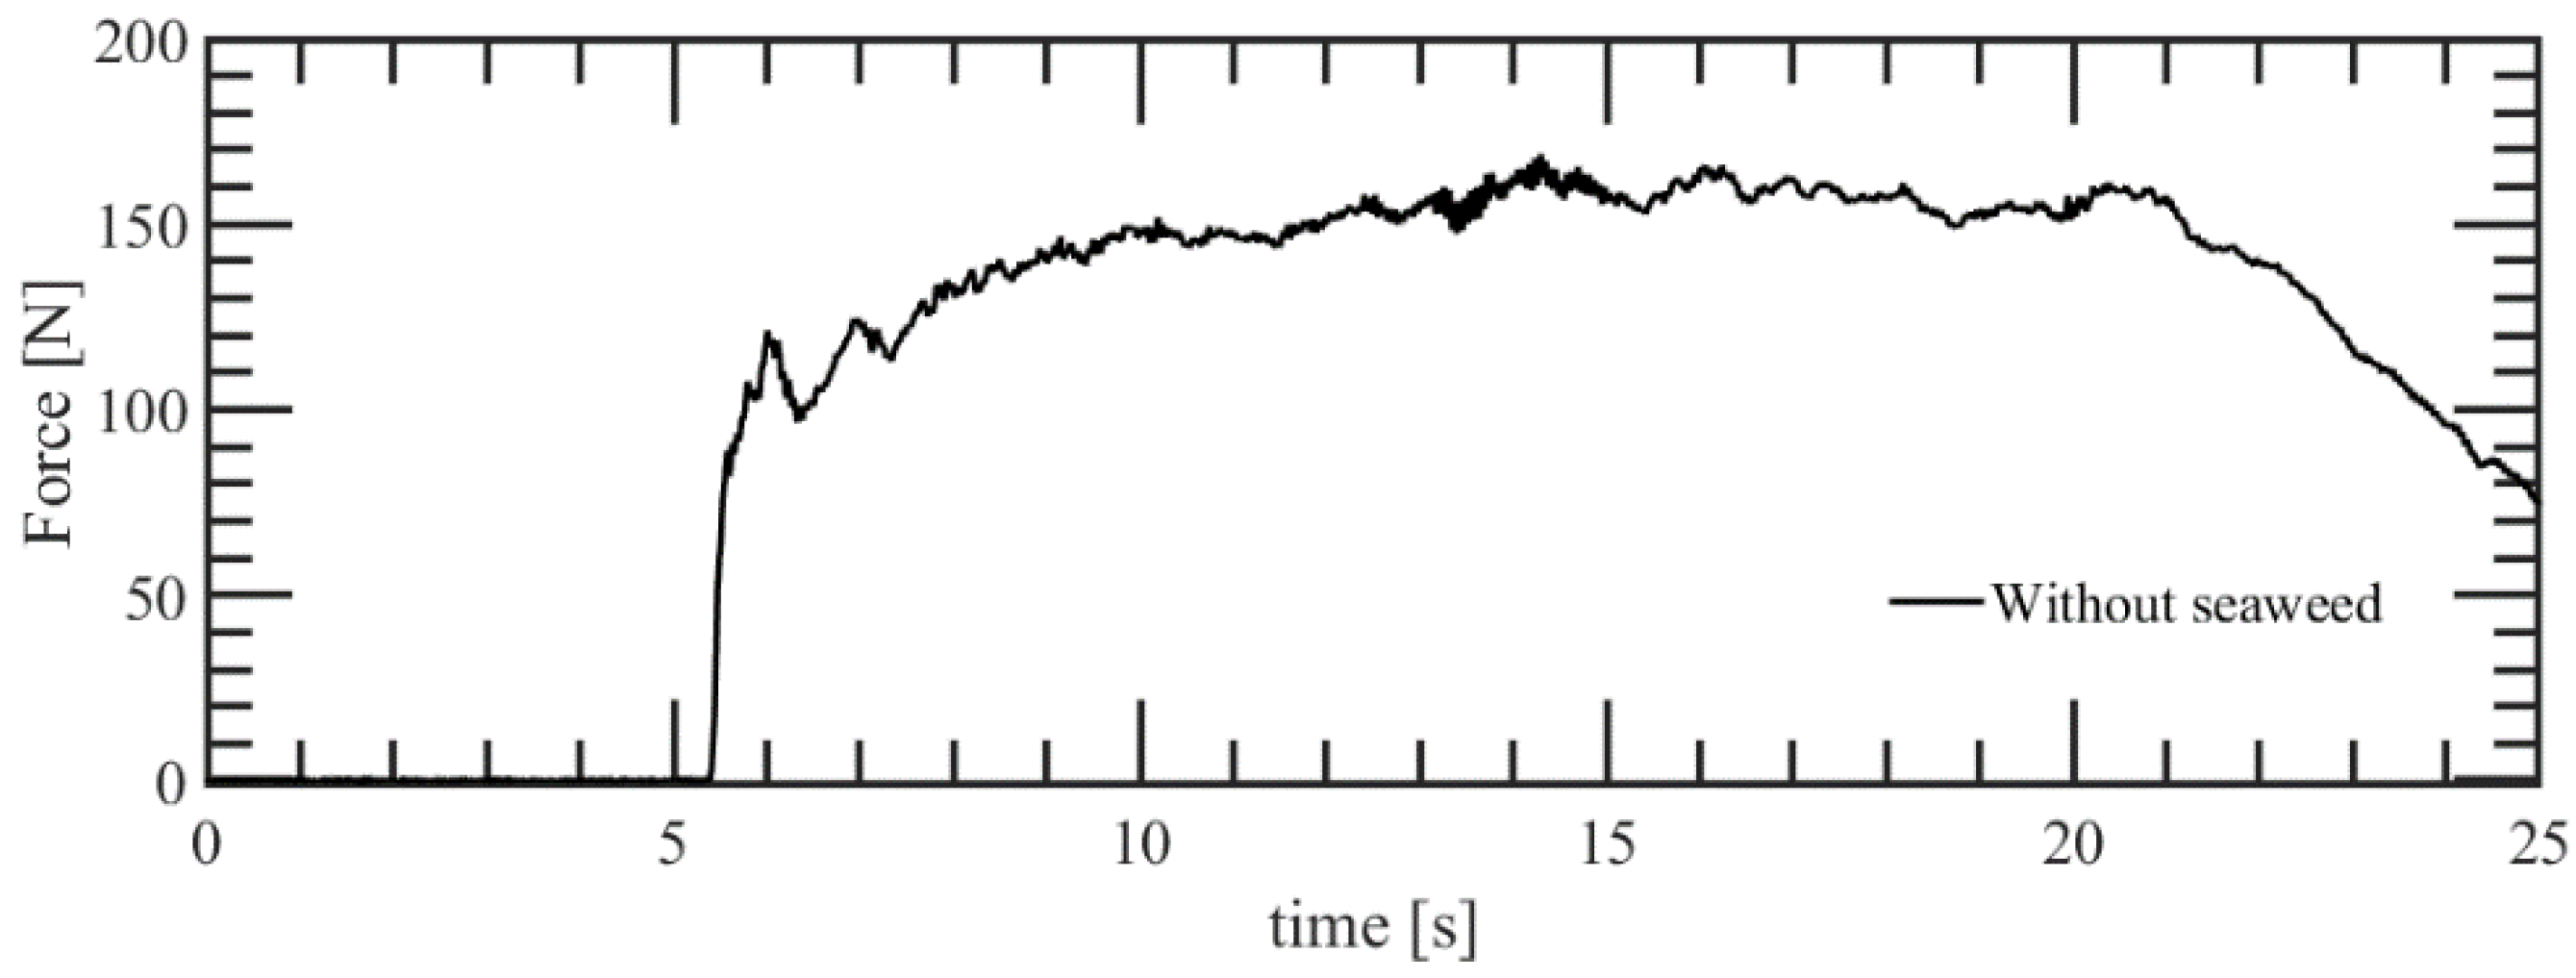
Figure 7 presents the force time history for test case 3 and ds = 3 cm. As observed, during the initial impact and initial reflection stage, a steep increase in the force on the structure was noticed.

3.3. Experiments with a Single Row of Seaweed

Figure 8 presents a picture of the seaweed during the bore interaction with the seaweed. It was observed that, once the bore interacted with the seaweed, the seaweed floated due to the buoyancy and hydrodynamic loading.
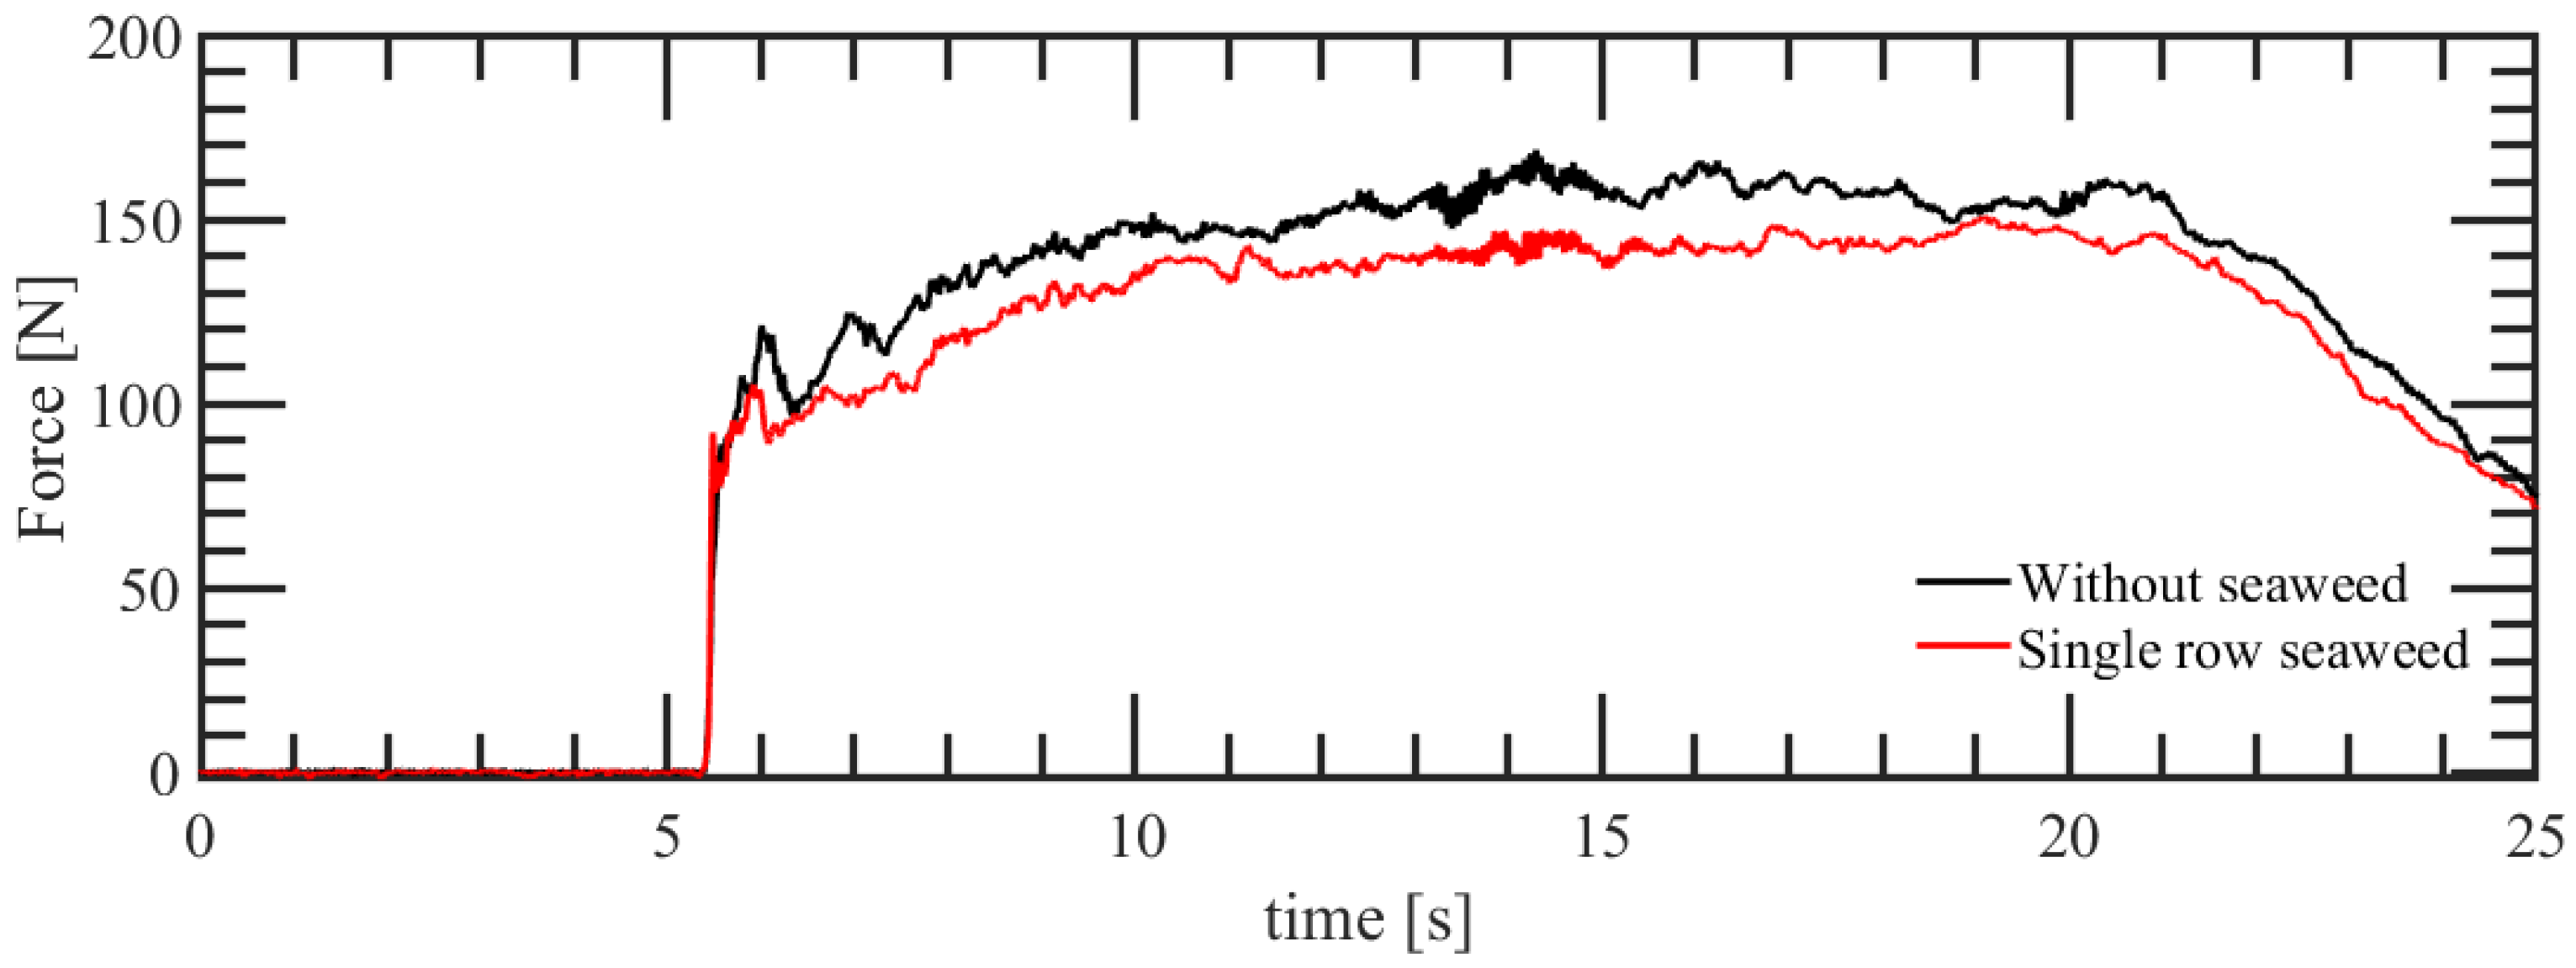
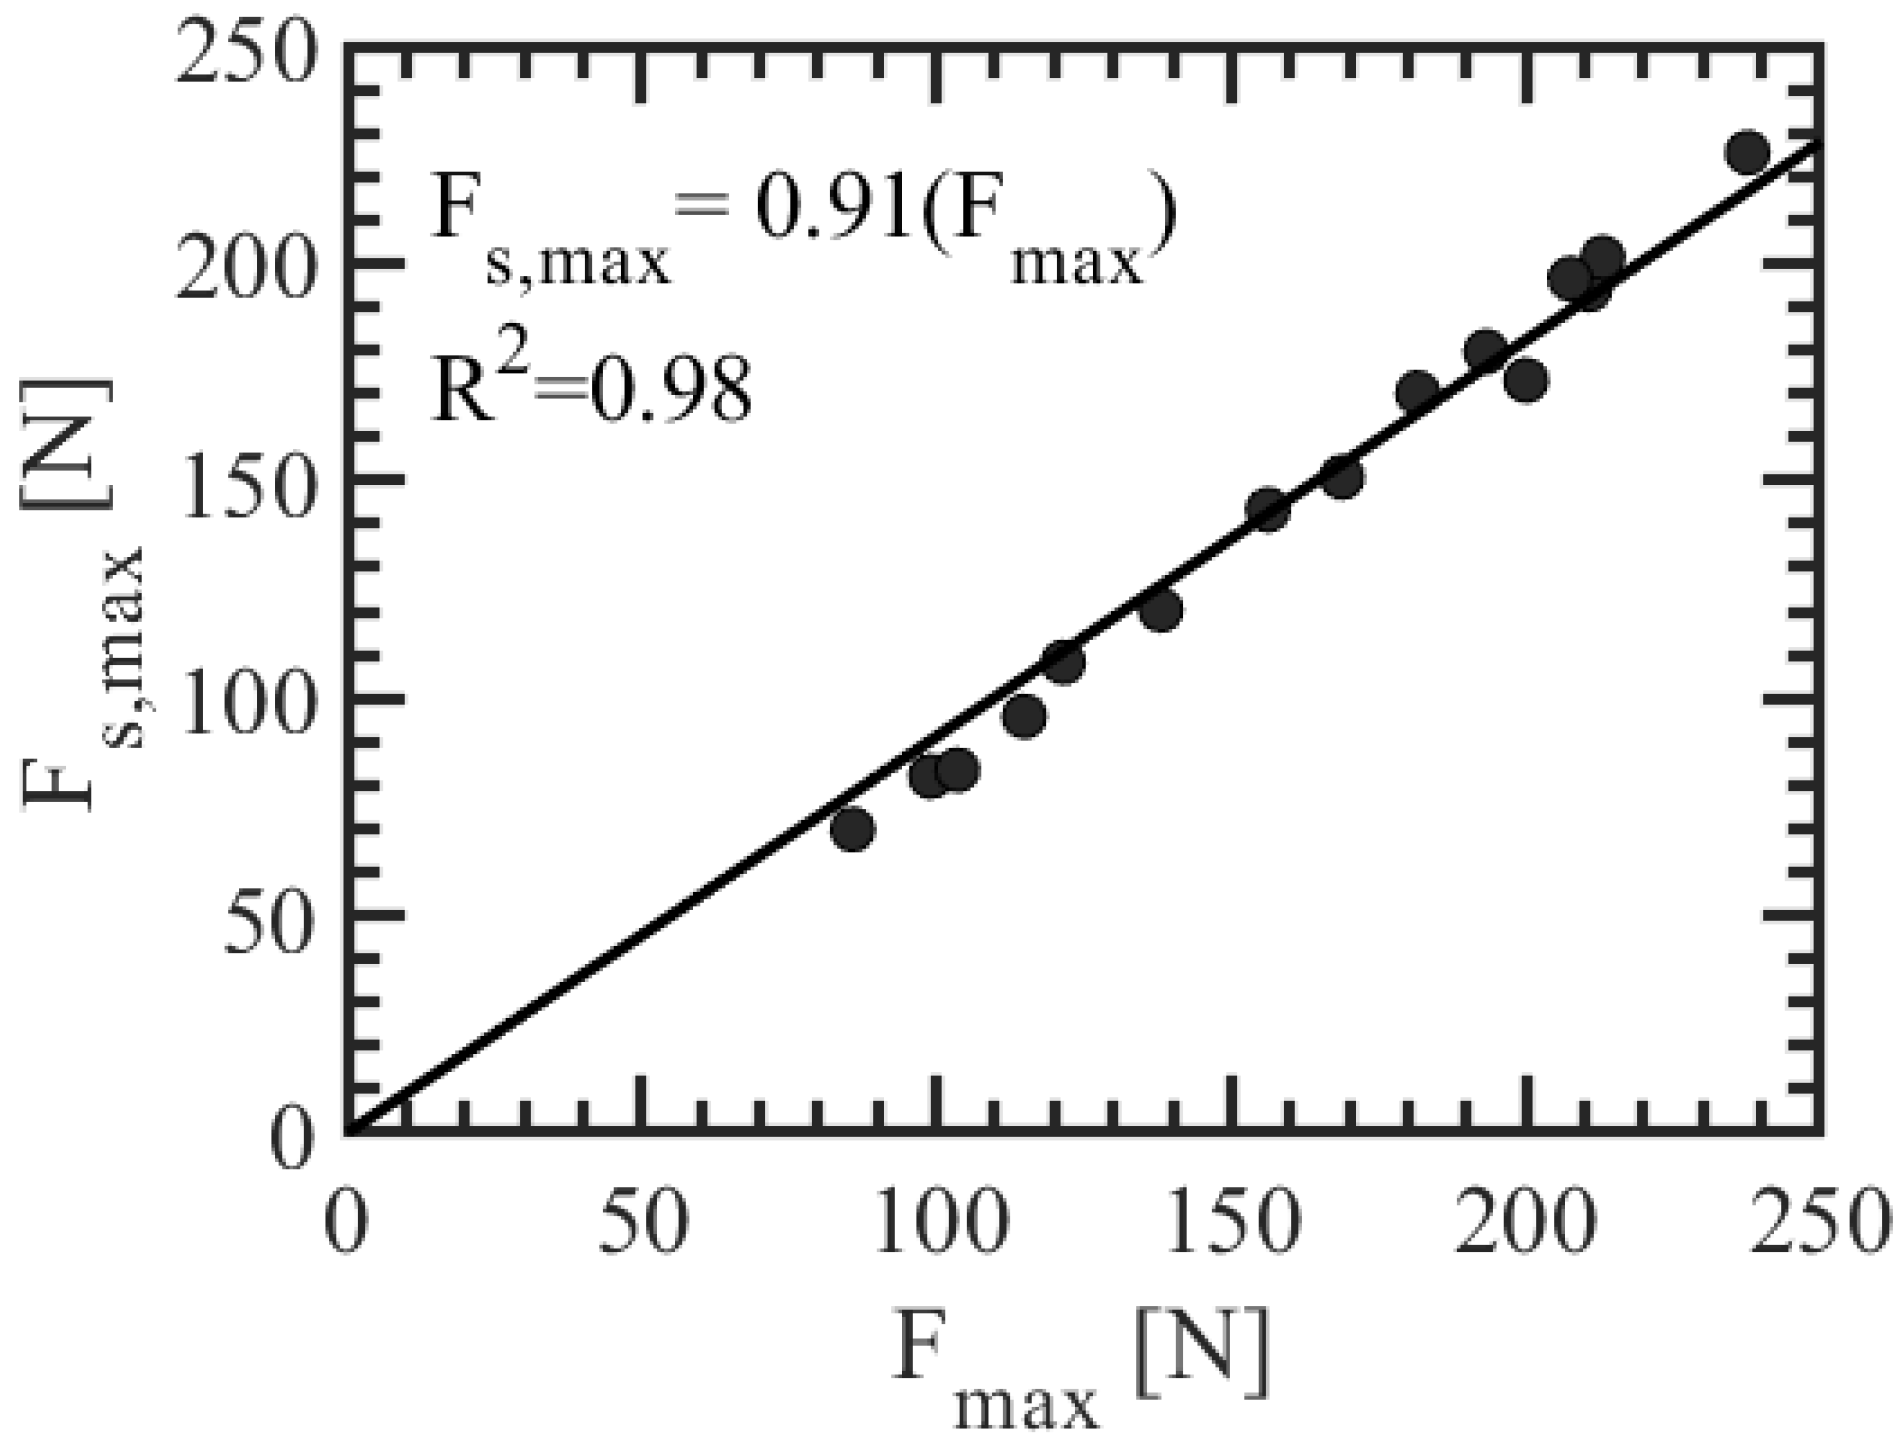
Figure 9 shows the force-time history of the structure with and without a single row of seaweed. As one could observe, there was a marginal decrease in the force on the inland structure due to the presence of the seaweed. Figure 10 presents a comparison between the maximum force with the seaweed and the force without the seaweed for all the test cases.

3.4. Experiments with Two Rows of Seaweed

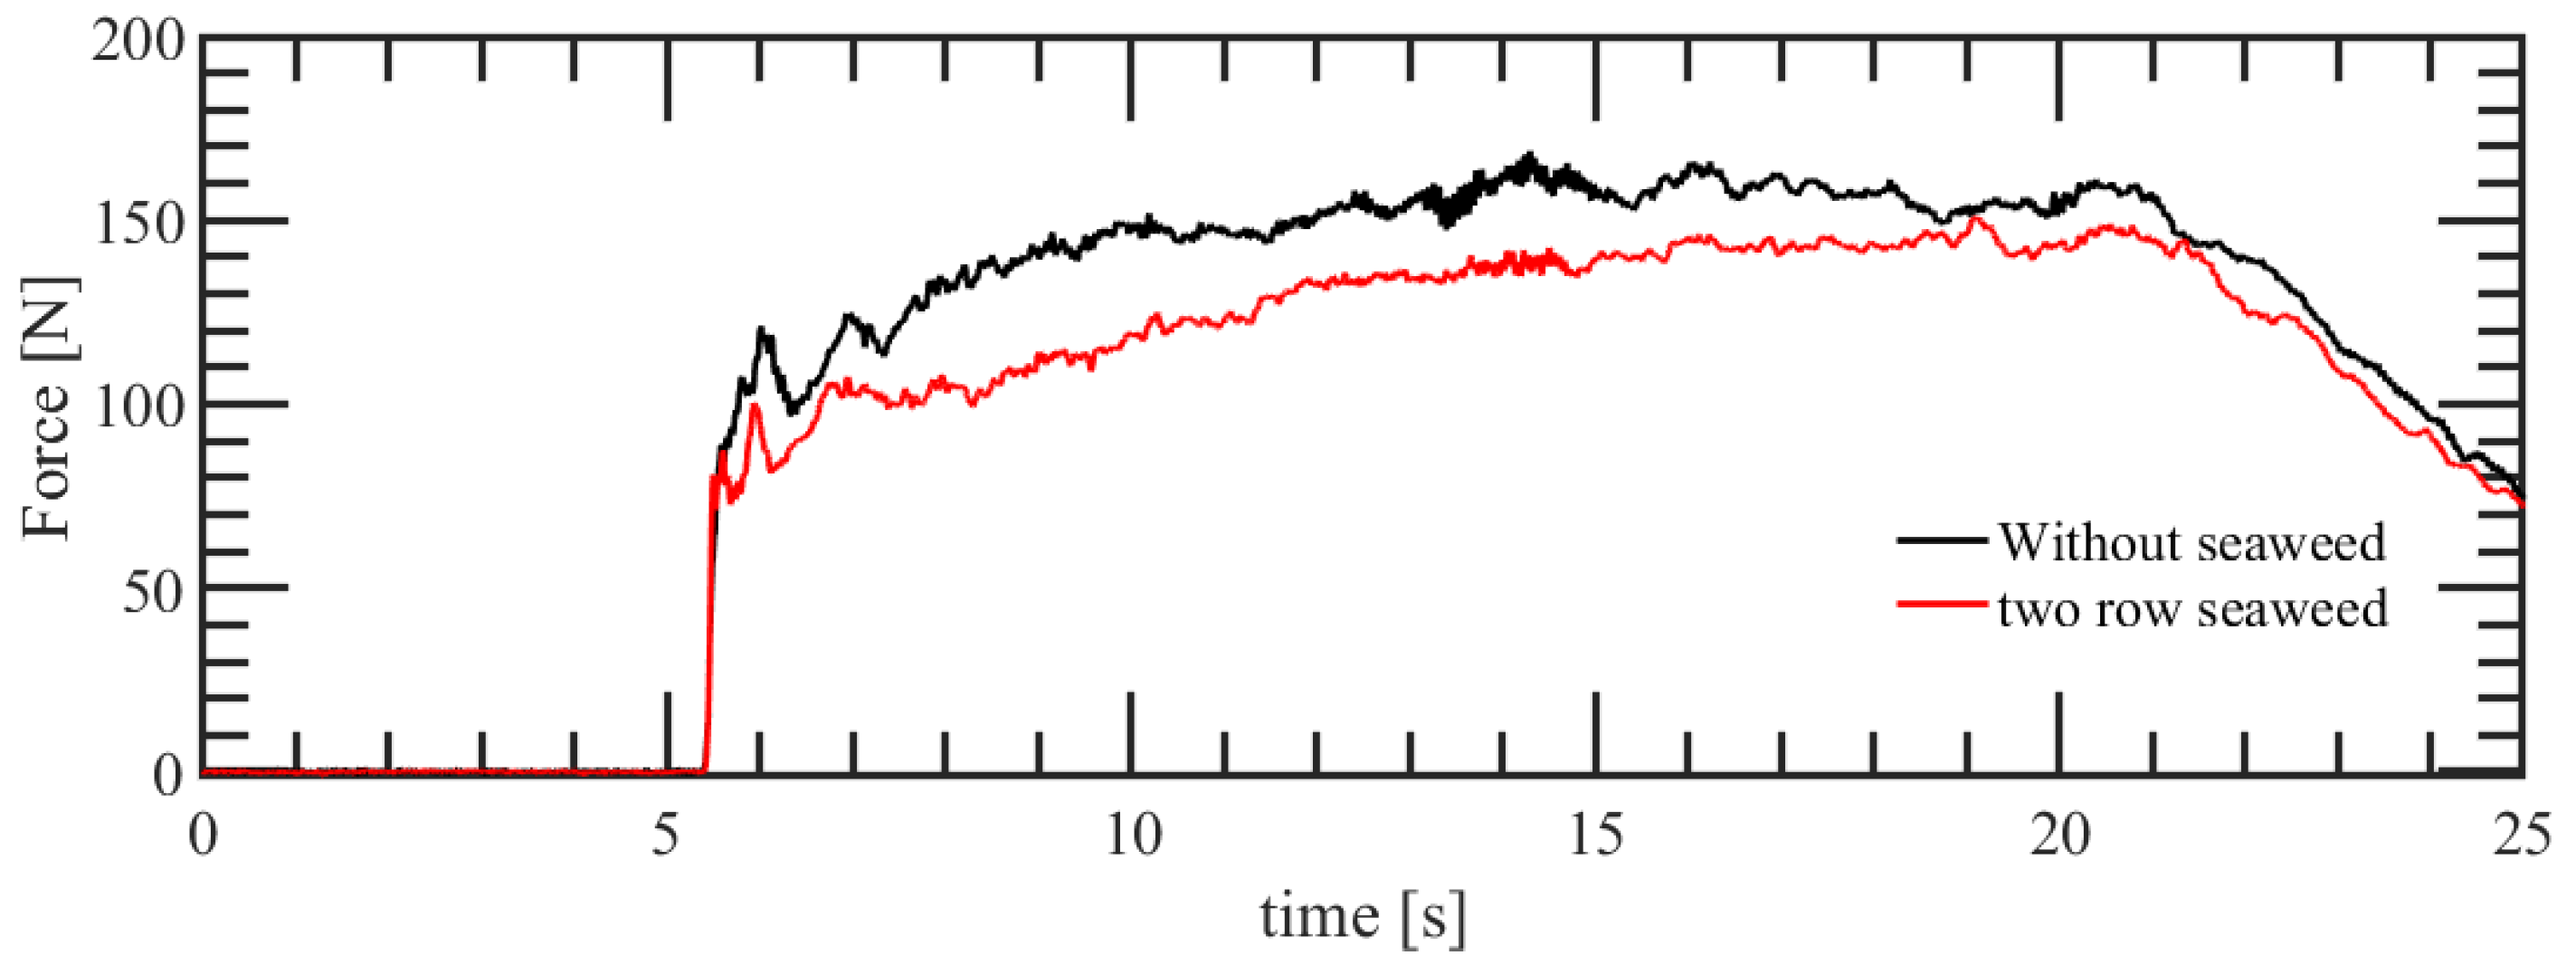
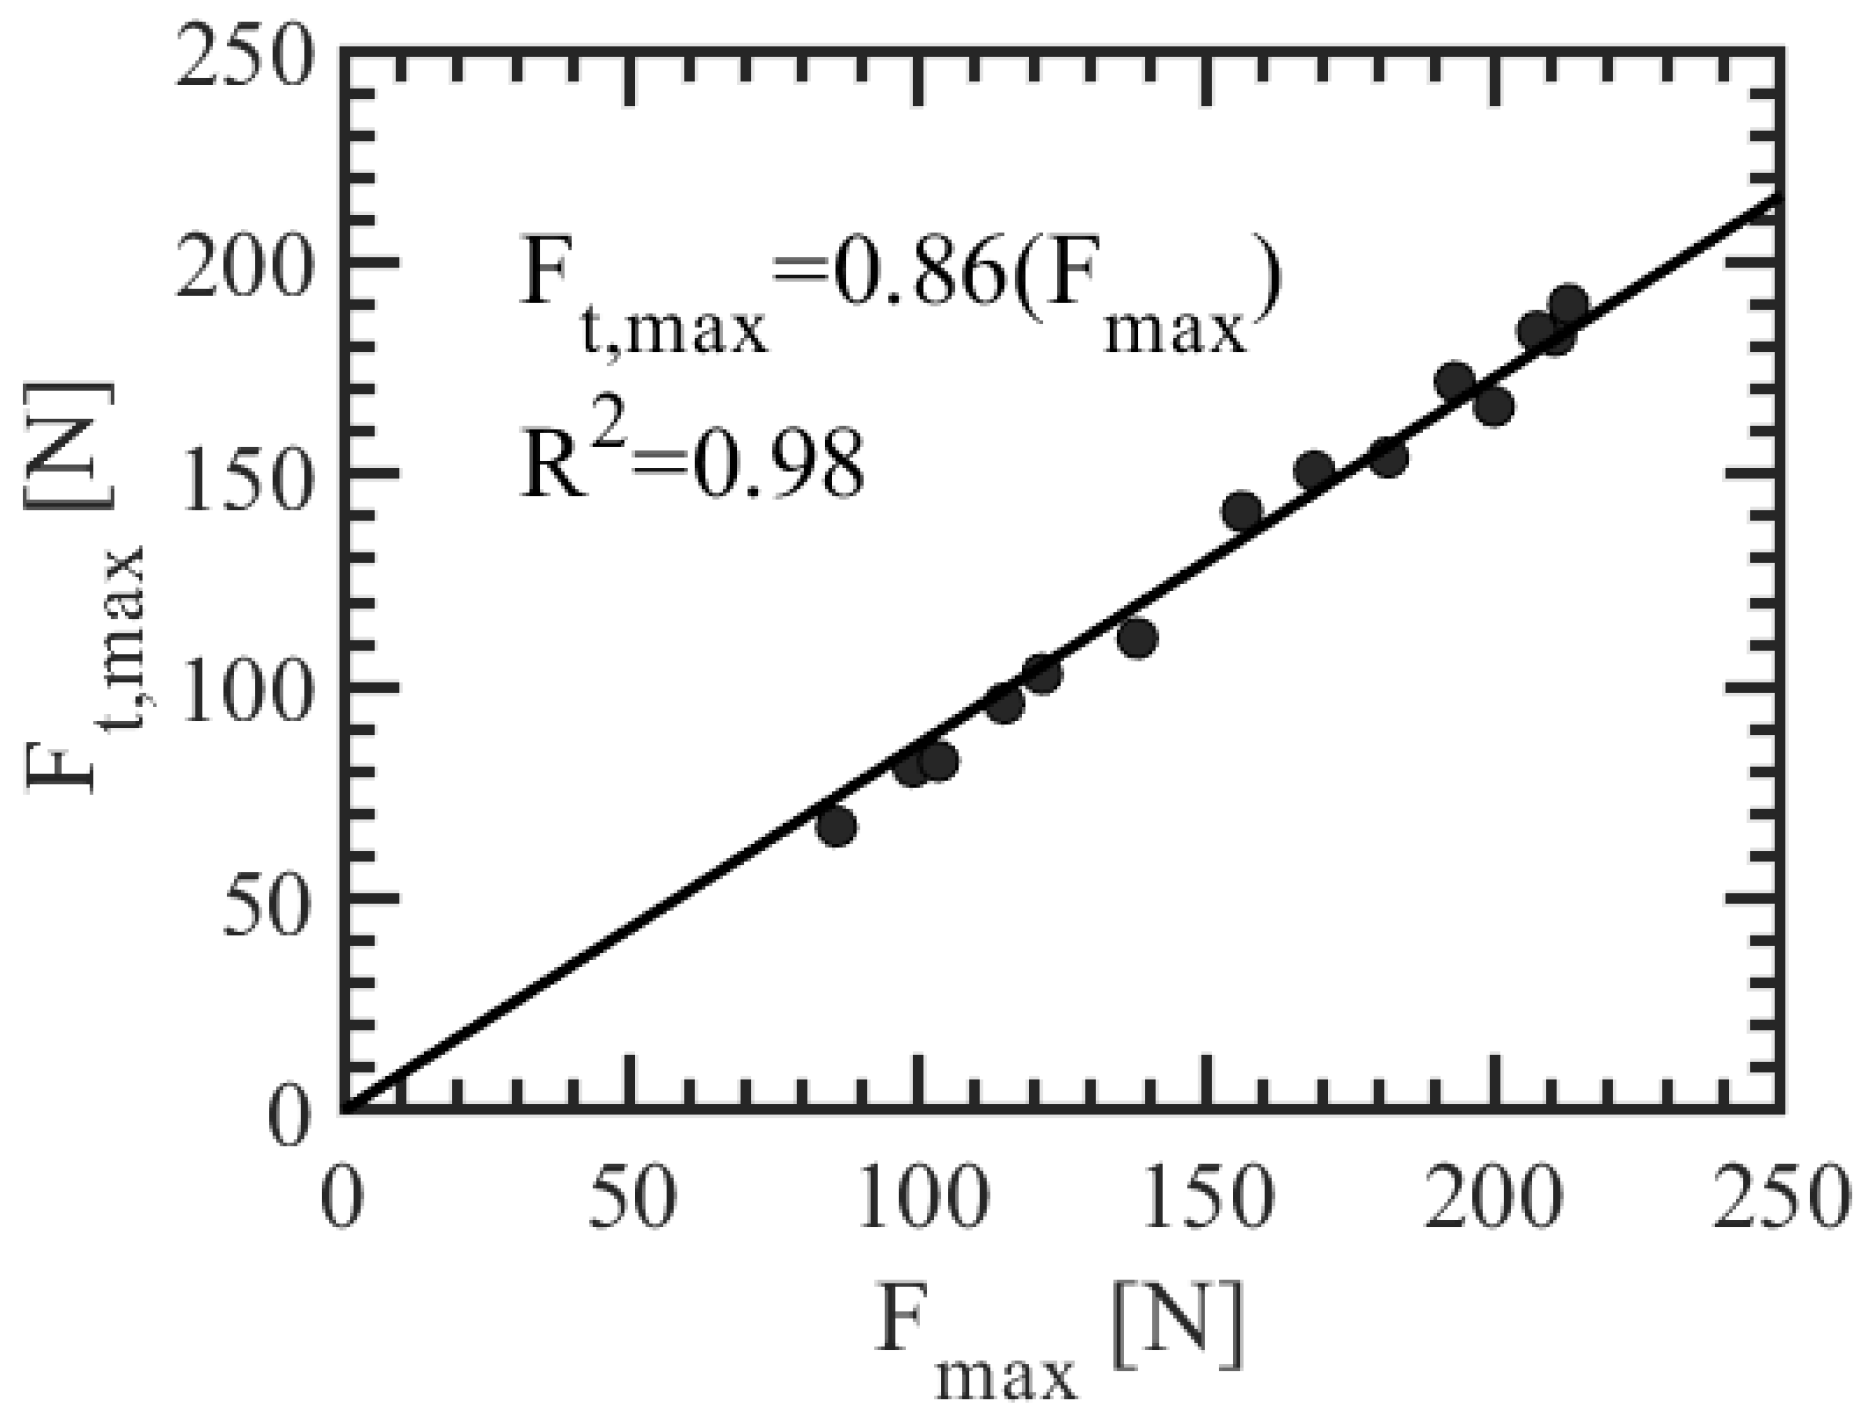
Figure 11 shows the force-time history of the structure with and without two rows of seaweed. It was observed that the force acting on the structure was reduced with an increase in the number of rows, as one could expect. Figure 12 presents a comparison between the maximum force with the two rows of seaweed and without the seaweed. One could observe that the linear trend line yielded a value of 0.863 with an R2 value of 0.98. This indicated that the two rows of seaweed could reduce approximately 14 percent of the force on the inland structure.
As observed in Figure 6, the Fr of the flow varied between different still water depths. Nevertheless, observing Figure 9 and Figure 11 shows that the force reduction was independent of the test cases in different still water depths (ds); hence, the Fr was not in agreement with Ahmed and Ghumman (2019) [38], who observed a linear decrease in the energy reduction with an increase in the Fr in experiments with rigid vegetation.

4. Discussion

4.1. Bore Characteristics in the Absence of Seaweed and the Structure

As explained in Section 2, the bore characteristics in Harish et al. (2021 and 2022) [28,37] and the bore height time history in the absence of the structure at the structure location were used for the experiment. Figure 4 presents the sample bore depth time history (h) for case 3 and ds = 3 cm. The bore steepness could also increase with the roughness of the bed [27,39]. It can be observed that the bore depth gradually increased over time, representing the continuous flow inundation during tsunamis and storm surges. Once the bore generation period ended, the flow depth was reduced drastically. Thus, the generated bore characteristics resembled a tsunami inundation or coastal flood inundation.

4.2. Forces on the Building in the Absence of Seaweed

The experiments were carried out in the absence of seaweed for measuring the forces on the structure model (i.e., building) without seaweed. Figure 7 shows the force time history for test case 3 and ds = 3 cm. This was due to the steeper bore front slope in wet conditions, agreeing with Cross (1967) and Wüthrich et al. (2018) [40,41]. Nevertheless, the maximum force occurred a long time after impact (i.e., during the quasi-steady flow phase). Furthermore, it also depended on the characteristics of the generated bore. In their studies, Harish et al. (2021) observed that, after a certain time from the bore tip interaction [28], the pressure profile on the structure’s front face was linear due to the flow-choked conditions. Since the experiments mainly focused on force reduction, the maximum force (Fmax) was chosen for further analysis.

4.3. Experiments with a Single Row of Seaweed

A single row of seaweed was placed 1 m away from the structure (building model) location.
Figure 8 presents a picture of the seaweed during the bore interaction with the seaweed. The presence of seaweed reflected a part of the incoming bore, thereby reducing the bore energy before the interaction with the building. Similar flow observations have been reported by earlier studies, which worked with rigid vegetation as a source of energy reduction [42,43]. Since the seaweeds were rigidly tightened with the side frame at the flume, the free-flow motions in the flow directions were restricted. Nevertheless, even in the field, although flexible, seaweed always sticks to the rock or the farm upon which it grows. The present study focused on understanding hydrodynamic force reduction; hence, the ends of the seaweed rope were tightened with the rigid frame.
Figure 9 revealed the force-time history of the structure with and without a single row of seaweed. The seaweed changed the overall flow behavior and induced a comparatively lesser force in the impact and quasi-steady phase. To potentially understand the force reduction, the maximum force (Fs,max) in the presence of the seaweed was chosen, where the subscript represents a single row. Figure 10 shows the differences between the maximum force with the seaweed and the force without the seaweed for all the test cases. A linear trend line yielded a value of 0.912 with an R2 value of 0.98. This indicated that the force reduction in the presence of the seaweed was approximately 9% for a single row of seaweed. The percentage of force reduction was comparable to the load reduction due to the low-rise seawall tested by Thomas and Cox (2011) and Harish et al. (2022b) [44,45], who observed only a 5 to 15% reduction in the force in the presence of a seawall. Thus, growing highly tensile seaweeds could reduce the flow momentum, comparable to a low-rise seawall.

4.4. Experiments with Two Rows of Seaweed

As a next step, the inland structure was tested with two rows of seaweed to better understand the overall performance in the form of seaweed bushes. In this case, another row of seaweed was placed 1.3 m away from the building model, including the first row. In Figure 11, the force-time history of the structure with and without two rows of seaweed is presented. To understand the force reduction, the maximum force on the inland building in the presence of the seaweed was chosen (Ft,max), similar to the previous subsection. Figure 12 shows a comparison between the maximum force with the two rows of seaweed and without the seaweed. The linear trend line yielded a value of 0.863 with an R2 value of 0.98 being observed. Rahman et al. (2020) and Ahmed et al. (2021) [46,47] also observed that an increase in the length of rigid vegetation such as trees positively affected energy reduction, like the present study’s observation. Furthermore, two rows of seaweed had a 5% higher force reduction than a single row of seaweed, which also indicated that the linear superposition principle may not be valid for identifying force reduction due to rows, thus necessitating investigations over a large length of seaweed cultivation.

4.5. Application of the Obtained Result

A prediction equation for the force is required to use the above results in the design of seashore buildings. Harish et al. (2021) suggested a method to estimate the forces on inland structures during quasi-steady conditions [28]. Since hydrostatic pressure exists during quasi-steady flow conditions, force prediction using bore depth at the structure’s front and backside is possible using the hydrostatic approach [28]. The maximum force predicted for the no seaweed condition is multiplied by the load reduction factors obtained from the single and two rows of seaweed. This is then compared with the experimental results to appreciate the prediction (Equation (2)). The procedure for predicting the forces for the no-seaweed case is summarized in Appendix A. The reduction factors for the single and two rows of seaweed are 9% and 14%, respectively.
Figure 13 presents a comparison of the predicted and measured force. It can be observed that the prediction yielded good results, since the data points pass through the plot diagonally, with an R2 value of 0.93. It should also be noted that the force prediction equation uses only h and u measured in the absence of any structure or obstruction. Zhang (2021) [48] presented in his work that tidal flats provide wave damping and equivalent protection standards for designing hybrid flood designs. The use of seaweed provides a better hybrid coastal protection (hard and soft technology) solution for modelling coastal protection because they can regulate the water temperature, provide a comforting biodiversity habitat, and provide climate change adaptation [3,49]. Design engineers can easily estimate the forces on an inland structure using free-flow hydrodynamics and seaweed information.
F m a x ,   s e a w e e d = P r e d i c     R e d u c t i o n   f a c t o r

5. Conclusions and Limitations

The present experimental study tried to understand the effect of seaweed as an alternate solution to reducing the forces on inland structures. Seaweeds of different species were tied together, resembling flexible bushes (vegetation) at the coast. Despite the buoyancy and flexible nature of the seaweed, they played an essential role in reducing the forces on the inland structure. The seaweed was tested in an idealized condition, where the seaweed did not break due to the tensile nature of the species for the hydrodynamic conditions. The experiments were conducted on a 1:30 geometric scale. Based on the extensive experimental results, it was found that a single row of seaweed presented before the inland structure could reduce the force on the inland structure by 9%, whereas two rows could reduce the force by 14%. The presence of flexible vegetation in the form of seaweed could reduce the hydrodynamic strength of the incoming bore by altering the flow characteristics. The force equation for no-seaweed conditions was utilized to predict the forces with the seaweed by multiplying the reduction factor obtained from the present study. Furthermore, the reduction percentage between one and two rows suggested that the linear superposition principle for the rows of seaweed was invalid, requiring further research with multiple rows, or more preferably, an investigation with the seaweed spread over the surface of the experimental flume is expected to provide more damping.
This study, which utilized seaweed as a source of energy reduction during extreme events, was successful in identifying seaweed as an alternate source to flow energy and momentum reduction; hence, the force. We achieved this by conducting experiments with a single row of seaweed, with each row weighing approximately 20 N in the lab. When scaled to the prototype using Fr scaling, the weight could be approximately 267 N/m (27 kg/m). The weights mentioned above are reasonable in the field [3]. Nevertheless, the spatial modelling still could not be replicated because seaweed is more spread in the actual field, unlike the rows of seaweed tested in this study. The scaling of the physical features and motion characteristics of seaweed has not been established until now, to our knowledge [22].
As mentioned above, the weight was predominantly used for the scaling, but other parameters such as the surface area or length should be further explored in the scaling for better results. More experimental runs should be carried out over a larger period to improve the results. Furthermore, it is not possible to use natural seaweed all the time and store them for a very long time. In this case, the use of a correctly modelled artificial plant that mimics real seaweed properties could mitigate this limitation.
The present study provides a pioneering idea for the coastal community to adopt seaweed as an alternate source of energy reduction under extreme conditions, as these seaweeds pose a good tensile strength [17]. Therefore, we encourage further modelling and research using seaweed spread over a large surface to potentially understand their influence as a source of energy dissipator under extreme wave conditions. Seaweed species are numerous and they have different shapes, which makes their scaling very challenging. Future work on scaling will provide more valuable information for the application of seaweed for coastal protection.

Funding

This research was funded by Theodore Von Karman Fellowship.

Institutional Review Board Statement

Not applicable.

Informed Consent Statement

Not applicable.

Data Availability Statement

The data relevant to the study are available from the corresponding author upon reasonable request.

Acknowledgments

The author acknowledges RWTH Aachen University for the award of the Theodore Von Karmen Fellowship to conduct this research.

Conflicts of Interest

The author declares no conflict of interest.

Appendix A. Prediction Equation

The prediction formula for estimating the quasi-static forces on the structure during the quasi-steady flow phase using bore height (h), Froude number (Fr), and structure width/flume width (b/W) are provided. In this study, b/W = 0.3. The force is estimated using the hydrostatic approach. The bore height at the structure front (hf) is obtained from the mass and momentum conservation equation, whereas the bore height and structure backside (hr) are obtained empirically.
Step 1: Obtain the bore height at the structure front iteratively by using Equation (A1):
h f h = 2 F r 2 ( 1 u f u ) 2 h f h 1 h f h + 1
The unknown uf/u should be obtained using the following empirical equation:
u f u = 0.4359 b W + 0.4366
Step 2: obtain the bore height at the structure backside using the empirical equation (Equation (A2)):
h r h f ( 1 u f u ) 2 = 1 120 F r 2 + 1 9 ; b W > 0.2
Step 3: Obtain the force (Equation (A4)):
F = 0.5 ρ g b h f 2 h r 2

References

  1. EASAC. Trends in Extreme Weather Events in Europe: Implications for National and European Union Adaptation Strategies. Policy Report 22. 2013. Available online: https://www.preventionweb.net/publication/trends-extreme-weather-events-europe-implications-national-and-european-union (accessed on 12 June 2023).
  2. Felder, S.; Chanson, H. Air–water flow patterns of hydraulic jumps on uniform beds macroroughness. J. Hydraul. Eng. 2018, 144, 04017068. [Google Scholar] [CrossRef]
  3. IPBES. The Assessment Report on Land Degradation and Restoration of the Intergovernmental Science-Policy Platform on Biodiversity and Ecosystem Services. Summary for Policymakers; Scholes, R., Montanarella, L., Brainich, A., Barger, N., Brink, B.T., Cantele, M., Erasmus, B., Fisher, J., Gardner, T., Holland, T.G., et al., Eds.; IPBES Secretariat: Bonn, Germany, 2018. [Google Scholar]
  4. Schoonees, T.; Mancheño, A.G.; Scheres, B.; Bouma, T.J.; Silva, R.; Schlurmann, T.; Schüttrumpf, H. Hard structures for coastal protection, towards greener designs. Estuaries Coasts 2019, 42, 1709–1729. [Google Scholar] [CrossRef]
  5. Hofmann, J.; Schüttrumpf, H. Risk-Based and Hydrodynamic Pluvial Flood Forecasts in Real Time. Water 2016, 12, 1895. [Google Scholar] [CrossRef]
  6. Olaodokun, S.O.; Tommonaro, G.; Guerriero, G.; Fogliano, C.; Iodice, C.; Velotto, G.; Tramice, A. New insight in marine, biotechnology: Carrageenans chemical features and acetylcholinesterase (AChE) inhibition activity of two edible seaweeds of the genus Kappaphycus. In Proceedings of the 2nd Euro Mediterranean Journal for Environmental Integration (EMCEI), Adisa Baba, Ethiopia, 10–13 October 2019; p. 213. [Google Scholar]
  7. IUCN. IUCN Global Standard for Nature-Based Solutions: A User-Friendly Framework for the Verification, Design, and Scaling up of NbS, 1st ed.; International Union for Conservation of Nature (IUCN): Gland, Switzerland, 2020. [Google Scholar] [CrossRef]
  8. EurOtop. Manual on Wave Overtopping of Sea Defenses and Related Structures. An Overtopping Manual Largely Based on European Research, but for Worldwide Application; van der Meer, J.W., Allsop, N.W.H., Bruce, T., de Rouck, J., Kortenhaus, A., Pullen, T., Schüttrumpf, H., Troch, P., Zanuttigh, B., Eds.; 2018; Available online: http://www.overtopping-manual.com/assets/downloads/EurOtop_II_2018_Final_version.pdf (accessed on 12 June 2023).
  9. Ismail, H.; Abd Wahab, A.K.; Alias, N.E. Determination of mangrove forest performance in reducing tsunami run-up using physical models. Nat. Hazards 2012, 63, 939–963. [Google Scholar] [CrossRef]
  10. Morris, R.L.; Konlechner, T.M.; Ghisalberti, M.; Swearer, S.E. From grey to green: Efficacy of eco-engineering solutions for nature-based coastal defense. Glob. Chang. Biol. 2017, 24, 1827–1842. [Google Scholar] [CrossRef] [PubMed]
  11. Iverson, L.R.; Prasad, A.M. Modeling tsunami damage in Aceh: A reply. Landsc. Ecol. 2008, 23, 7–10. [Google Scholar] [CrossRef]
  12. Olaodokun, S.O. Model Test for Determination of Hydrodynamic Ocean Coefficient for Design of Aquaculture Mooring System for Oceanic Macroalgae Farming. Biosci. Biotechnol. Res. Asia 2017, 14, 1227. [Google Scholar]
  13. Guiry, M.D.; Blunden, G. Seaweed Resources in Europe: Uses and Potential; John Wiley & Sons: Chichester, UK, 1991; p. 432. [Google Scholar]
  14. Olaodokun, S.O.; Abdelaziz, A.; Guerriero, G. Risk Analysis of Aquaculture Farming System: Towards Reliable Sea Farming; Lambert Academy Publishing: Berlin, Germany, 2016; p. 116. ISBN 978-3-8473-2198-9. [Google Scholar]
  15. Buck, B.H.; Nevejan, N.; Wille, M.; Chambers, M.D.; Chopin, T. Offshore and Multi-Use Aquaculture with Extractive Species: Seaweeds and Bivalves. In Aquaculture Perspective of Multi-Use Sites in the Open Ocean; Buck, B., Langan, R., Eds.; Springer: Cham, The Netherlands, 2017. [Google Scholar] [CrossRef]
  16. Müller, R.; Laepple, T.; Bartsch, I.; Wiencke, C. Impact of oceanic warming on the distribution of seaweeds in polar and cold-temperate waters. Bot. Mar. 2009, 52, 617–638. [Google Scholar] [CrossRef]
  17. Olaodokun, S.O. Modelling of Offshore Aquaculture Floating Structure for Macro Algae Oceanic Cultivation, Marine Technology, and Sustainable Development; Green Innovations; IGI Publisher: Hershey, PA, USA, 2014; p. 20. [Google Scholar]
  18. Guerriero, G.; Rabbito, D.; Alwany, M.A.; Madonna, A.; Temraz, T.A.; Sulaiman, O.O.; Bassem, S.M.; Trocchia, S.; Abdel-Gawad, F.K.; Ciarcia, G. Fisheries and biodiversity along the Mediterranean Sea: Italian and Egyptian coast overview. Euro-Mediterr. J. Environ. Integr. 2017, 2, 16. [Google Scholar] [CrossRef]
  19. Mortensen, L.M. Remediation of nutrient-rich, brackish fjord water through the production of protein-rich kelp S. latissima and L. digitata. J. Appl. Phycol. 2017, 29, 3089–3096. [Google Scholar] [CrossRef]
  20. Moreno-Mateos, D.; Power, M.E.; Comín, F.A.; Yockteng, R. Structural and functional loss in restored wetland ecosystems. PLoS Biol. 2012, 10, e1001247. [Google Scholar] [CrossRef]
  21. Duarte, C.M.; Wu, J.; Xiao, X.; Bruhn, A.; Krause-Jensen, D. Can seaweed farming play a role in climate change mitigation and adaptation? Front. Mar. Sci. 2017, 4, 100. [Google Scholar] [CrossRef]
  22. Olaodokun, S.O.; Magee, A.; Kader, A.S.A.; Tee, K.F. Simulation of offshore aquaculture system for macroalgae (seaweed) oceanic farming. Ships Offshore Struct. 2017, 12, 553–562. [Google Scholar]
  23. Lendering, K.T.; Jonkman, S.N.; van Gelder, P.H.A.J.M.; Peters, D.J. Risk-based optimization of land reclamation. Reliab. Eng. Syst. Saf. 2015, 144, 193–203. [Google Scholar] [CrossRef]
  24. Yang, Y.; Chai, Z.; Wang, Q.; Chen, W.; He, Z.; Jiang, S. Cultivation of seaweed Gracilaria in Chinese coastal waters and its contribution to environmental improvements. Algal Res. 2015, 9, 236–244. [Google Scholar] [CrossRef]
  25. Van Rooijen, A.A.; McCall, R.T.; van Thiel de Vries, J.S.M.; van Dongeren, A.R.; Reniers, A.J.H.M.; Roelvink, J.A. Modeling the effect of wave-vegetation interaction on wave setup. J. Geophys. Res. Ocean. 2016, 121, 4341–4359. [Google Scholar] [CrossRef]
  26. Olaodokun, S.O.; Magee, A.; Bahrain, Z.; Kader, A.S.A.; Maimun, A.; Pauzi, A.G.; Wan Nick, W.B.; Othman, K. Mooring analysis for very large offshore aquaculture ocean plantation floating structure. Ocean Coast. Manag. 2013, 80, 80–88. [Google Scholar]
  27. Wüthrich, D.; Pfister, M.; Schleiss, A.J. Effect of bed roughness on tsunami-like waves and induced loads on buildings. Coast. Eng. 2019, 152, 103508. [Google Scholar] [CrossRef]
  28. Harish, S.; Sriram, V.; Schüttrumpf, H.; Sannasiraj, S.A. Tsunami-like flow-induced force on the structure: Prediction formulae for the horizontal force in quasi-steady flow phase. Coast. Eng. 2021, 168, 103938. [Google Scholar] [CrossRef]
  29. Oetjen, J.; Engel, M.; Pudasaini, S.P.; Schüttrumpf, H. Significance of boulder shape, shoreline configuration, and pre-transport setting for the transport of boulders by tsunamis. Earth Surf. Process. Landforms 2020, 45, 2118–2133. [Google Scholar] [CrossRef]
  30. Martín-Antón, M.; Negro, V.; del Campo, J.M.; López-Gutiérrez, J.S.; Esteban, M.D. Review of coastal land reclamation situation in the world. J. Coastal Res. 2016, 75, 667–671. [Google Scholar] [CrossRef]
  31. Harish, S.; Sriram, V.; Schüttrumpf, H.; Sannasiraj, S.A. Flow-structure interference effects with the surrounding structure in the choked quasi-steady condition of tsunami: Comparison with traditional obstruction approach. Appl. Ocean Res. 2022, 126, 103255. [Google Scholar] [CrossRef]
  32. Matsutomi, H.; Shuto, N.; Imamura, F.; Takahashi, T. Field survey of the 1996 Irian Jaya earthquake tsunami in Biak Island. Nat. Hazards 2001, 24, 199–212. [Google Scholar] [CrossRef]
  33. Matsutomi, H.; Okamoto, K. Inundation flow velocity of tsunami on land. Island Arc 2010, 19, 443–457. [Google Scholar] [CrossRef]
  34. Fritz, H.M.; Borrero, J.C.; Synolakis, C.E.; Yoo, J. 2004 Indian Ocean tsunami flow velocity measurements from survivor videos. Geophys. Res. Lett. 2006, 33. [Google Scholar] [CrossRef]
  35. Jaffe, B.E.; Goto, K.; Sugawara, D.; Richmond, B.M.; Fujino, S.; Nishimura, Y. Flow speed estimated by inverse modeling of sandy tsunami deposits: Results from the 11 March 2011 tsunami on the coastal plain near the Sendai Airport, Honshu, Japan. Sedimentary Geology. Sediment. Geol. 2012, 282, 90–109. [Google Scholar] [CrossRef]
  36. NOAA. Designing for Tsunamis. National Tsunami Hazard Mitigation Program, USGS, FEMA, NSF, Alaska, California, 2001, Hawaii, Oregon, and Washington; NOAA: Silver Spring, MD, USA, 2001.
  37. Harish, S.; Sriram, V.; Schüttrumpf, H.; Sannasiraj, S.A. Tsunami-like flow-induced forces on the structure: Dependence of the hydrodynamic force coefficients on Froude number and flow channel width in quasi-steady flow phase. Coast. Eng. 2022, 172, 104078. [Google Scholar] [CrossRef]
  38. Ahmed, A.; Ghumman, A.R. Experimental investigation of flood energy dissipation by single and hybrid defense system. Water 2019, 11, 1971. [Google Scholar] [CrossRef]
  39. Esteban, M.; Roubos, J.J.; Iimura, K.; Salet, J.T.; Hofland, B.; Bricker, J.; Ishii, H.; Hamano, G.; Takabatake, T.; Shibayama, T. Effect of bed roughness on tsunami bore propagation and overtopping. Coast. Eng. 2020, 157, 103539. [Google Scholar] [CrossRef]
  40. Cross III, R.H. Tsunami surge forces. J. Waterw. Harb. Div. 1967, 93, 201–231. [Google Scholar] [CrossRef]
  41. Wüthrich, D.; Pfister, M.; Nistor, I.; Schleiss, A.J. Experimental study on the hydrodynamic impact of tsunami-like waves against impervious free-standing buildings. Coast. Eng. J. 2018, 60, 180–199. [Google Scholar] [CrossRef]
  42. Anjum, N.; Tanaka, N. Experimental study on flow analysis and energy loss around discontinued vertically layered vegetation. Environ. Fluid Mech. 2020, 20, 791–817. [Google Scholar] [CrossRef]
  43. Pasha, G.A.; Tanaka, N. Undular hydraulic jump formation and energy loss in flow-through emergent vegetation of varying thickness and density. Ocean Eng. 2017, 141, 308–325. [Google Scholar] [CrossRef]
  44. Thomas, S.; Cox, D. Influence of finite-length seawalls for tsunami loading on coastal structures. J. Waterw. Port Coast. Ocean Eng. 2012, 138, 203–214. [Google Scholar] [CrossRef]
  45. Harish, S.; Sriram, V.; Schüttrumpf, H.; Sannasiraj, S.A. Tsunami-like Flow-Induced Forces on the Landward Structure behind a Vertical Seawall with and without Recurve Using Open FOAM. Water 2022, 14, 1986. [Google Scholar] [CrossRef]
  46. Rahman, M.A.; Tanaka, N.; Rashedunnabi, A.H.M.; Igarashi, Y. Energy reduction in tsunamis through a defense system comprising an embankment and vegetation on a mound. In Proceedings of the 22nd IAHR-APD Congress, Sapporo, Japan, 14–17 September 2020. [Google Scholar]
  47. Ahmed, A.; Valyrakis, M.; Ghumman, A.R.; Pasha, G.A.; Farooq, R. Experimental Investigation of Flood Energy Dissipation through Embankment Followed by Emergent Vegetation. Period. Polytech. Civ. Eng. 2021, 65, 1213–1226. [Google Scholar] [CrossRef]
  48. Zhang, M.; Dai, Z.; Tjeerd; Bouma, J.; Bricker, J.; Townend, I.; Wen, J.; Zhao, T.; Cai, H. Tidal-flat reclamation aggravates potential risk from storm impacts. Coastal Eng. 2021, 166, 103868. [Google Scholar] [CrossRef]
  49. Bellanova, P.; Frenken, M.; Reicherter, K.; Jaffe, B.; Szczuciński, W.; Schwarzbauer, J. Anthropogenic pollutants and biomarkers for the identification of 2011 Tohoku-Oki tsunami deposits (Japan). Mar. Geol. 2020, 422, 106117. [Google Scholar] [CrossRef]
Figure 1. Schematics of the instrumentation, showing load cell installed under the structural barrier (in red, representing typical coal building) [28].
Aquacj 03 00015 g001
Figure 2. Clumps of 5 wet and dry seaweed.
Aquacj 03 00015 g002
Figure 3. Seaweed fixed in the lab.
Aquacj 03 00015 g003
Figure 4. Typical bore depth time history of the generated bore in the IWW Lab.
Aquacj 03 00015 g004
Figure 5. Typical bore front propagation in the laboratory.
Aquacj 03 00015 g005
Figure 6. Froude number tested in this study [28].
Aquacj 03 00015 g006
Figure 7. Forces on the structure in the absence of seaweed.
Aquacj 03 00015 g007
Figure 8. During bore interaction with the seaweed.
Aquacj 03 00015 g008
Figure 9. Force time history (with a single row of seaweed and without seaweed) for ds = 3 cm and Case 3.
Aquacj 03 00015 g009
Figure 10. Comparison of maximum force with and without a single row of seaweed.
Aquacj 03 00015 g010
Figure 11. Force time history (with two rows of seaweed and without seaweed) for ds = 3 cm and Case 3.
Aquacj 03 00015 g011
Figure 12. Comparison of maximum force with two rows of seaweed and without Seaweed.
Aquacj 03 00015 g012
Figure 13. Comparison of predicted maximum force from Harish et al. (2021) with maximum experimental force using Equation (2) [28].
Aquacj 03 00015 g013
Table 1. Test cases were used in the experiments. Bore depth (h) and depth-averaged velocity (u) were measured in the absence of seaweed and the structure [31].
Test Caseds = 1 cmds = 3 cmds = 5 cm
h (m)u (m/s)h (m)u (m/s)h (m)u (m/s)
Case 10.1051.4950.1371.2110.1611.106
Case 20.1251.6520.1501.4090.1791.181
Case 30.1461.7440.1741.5260.2081.143
Case 40.1591.8180.1881.5920.2171.304
Case 50.1701.8660.1941.6520.2271.319
Disclaimer/Publisher’s Note: The statements, opinions and data contained in all publications are solely those of the individual author(s) and contributor(s) and not of MDPI and/or the editor(s). MDPI and/or the editor(s) disclaim responsibility for any injury to people or property resulting from any ideas, methods, instructions or products referred to in the content.