Article

Coastal Retreat on the Spanish Mediterranean Coast in a Climate Change Context: Effects of the Regulation of the Segura River at Its Mouth and the Coastal Sand Dune in Guardamar del Segura (Alicante, Spain)

1
Interuniversitary Institute of Geography, University of Alicante, 03690 San Vicente del Raspeig, Spain
2
Department of Regional Geographical Analysis and Physical Geography, University of Alicante, 03690 San Vicente del Raspeig, Spain
3
Department of Geography and Spatial Planning, University of Zaragoza, 50009 Zaragoza, Spain
*
Author to whom correspondence should be addressed.
Coasts 2024, 4(1), 63-88; https://doi.org/10.3390/coasts4010005
Submission received: 22 November 2023 / Revised: 19 December 2023 / Accepted: 31 January 2024 / Published: 2 February 2024

Abstract

:
Coastal retreat processes are usually associated with many anthropogenic actions, such as the regulation of river basins, the construction of hydraulic storm defence works in coastal areas and the building of housing on the beach. To all of this, we should also add the increase in sea levels due to the effect of climate change. The chosen area of study corresponds to the coastal area of the municipality of Guardamar del Segura, belonging to the Segura River Basin. The methodology applied in this study comprised the gathering of historical information, the extraction of data using GIS, the compiling of data using official organisations and the analysis of all these data from a geographical perspective. The obtained results show the chronology of the regulation works in the Segura Basin and their relationship with the reduction and negative trend in average ordinary flows (1940–2023) and the extraordinary, swelled flows recorded in the period 1994–2023. Furthermore, the coastlines from 1923 to 2023 were mapped, enabling us to determine the evolution of the coastline retreat processes experienced in the dune ridge of Guardamar del Segura and the increase in the frequency of impacts due to storms on Babilonia Beach. Finally, data on wind, waves and marine currents recorded at a gauging station were incorporated, enabling us to understand their impact on this coastal sector. The results obtained are discussed, and they indicate the need to incorporate data on sediment into the study in order to complete it. The conclusions reveal the existence of a relationship between all these anthropogenic elements in the beach erosion processes experienced in the village of Guardamar del Segura.

1. Introduction

Coastal retreat is one of the most important problems that is currently affecting many coastal areas in the world as a result of the aggression of anthropogenic actions on coastal and river basin systems, aggravated by the increase in the sea level due to climate change processes. Coastal systems have been altered through anthropogenic processes, particularly since the second half of the twentieth century. The retreat experienced by coastal spaces is generated via different anthropogenic actions. Three large groups can be identified: (1) the regulation of river basins through the construction of dams, reservoirs, the deviation of flows, forest repopulation and channelling, which are responsible for the reduction in the contribution of sediment to coastal areas; (2) anthropogenic actions on the coast related to storm defence works that alter the functioning of the coastal drift and the distribution of sediment in coastal areas, such as breakwaters, jetties and sea walls, among others, in addition to actions related to economic activities, such as the construction of yachting or commercial harbours or housing on beaches, which affect the functioning of coastal dynamics or cause a wall or barrier effect to winds that transport fine sediment through the air; and (3) the effects of climate change related to the increase in sea levels caused by the thawing of the planet’s ice masses and the expansion of the oceans and seas due to their thermal warming, as well as a higher frequency of extreme weather events, particularly atmospheric situations that favour the formation of sea storms [1].
Meanwhile, the global average sea level has increased by between 13 and 20 cm since the preindustrial era [2], and this process has been intensifying and accelerating since the last decade of the twentieth century [3]. The PESETA III report [3] on coastal risk analysis predicts a highly probable increase in the European average sea level over the next 100 years of 34–76 cm in a scenario of moderate mitigation (RCP 4.5) and 58–172 cm in a scenario of high emission levels (RCP 8.5) for the whole of the European Union and the United Kingdom. The special oceans report of the Intergovernmental Panel on Climate Change (IPCC) indicates that the average sea level is increasing in an accelerated manner and that, in the period between 1901 and 1990, it increased by 1.4 mm/year; meanwhile, for the period of 1970–2015, it increased by 2.1 mm/year, and in the period of 1993–2015, the corresponding figure rose to 3.6 mm/year on a global scale [4]. Furthermore, the last IPCC report (AR6) revealed that the global average sea level is expected to continue to rise throughout the twenty-first century as a result of melting ice and the warming of the oceans and seas, generating their expansion landwards and increasing the sea level [5].
In addition to the rising sea level, there has also been an intensification of extreme weather phenomena that generate offshore storms and strong winds [4]. A high sea level causes offshore storms to have a more virulent impact on the coast and lead to larger coastal flooding areas due to waves penetrating the land for several metres or kilometres with respect to the original coast in a low-water situation [6]. Moreover, the increase in the sea level generates the formation of higher waves hitting the coast and nearby areas, increasing coastal erosion [7]. All these related elements contribute to coastal retreat [8].
The construction of large works that regulate the river basins (such as reservoirs, flood control dams, deviation channels, channellings and the deviation or river courses) has negatively affected the amount of sediment deposited in river mouths and coastal spaces. These deposits constitute a fundamental source of materials to replenish beaches or coastal systems [9,10,11].
In 2005, a total of 45,000 dams over 15 m high were counted throughout the world by the World Commission on Dams (WCD) [12,13], and the reduction in river sediment inputs is estimated to be between 5–20 GTm/year [12], which fosters the disconnection of rivers from their deltas and coastal contributions [10,14].
These types of works, and particularly reservoirs, have drastically reduced the average monthly flows that contributed to sediment’s movement to the coast [15]. Since the regulation of river basins, today, only extreme episodes, namely floods, transport and deposit large volumes of sediment on the coast [16,17].
Some authors have defended the “sediment continuity principle”, which argues that sediment is not created or destroyed but moves through the landscape so that what is lost in one space is gained in others [10]. With the construction of transverse walls, the sediment transported via rivers accumulates in dams, causing their clogging. This results in a breakdown or alteration of sedimentation processes downstream, including on coasts. The direct consequence of this is the production of coastal retreat processes [11].
Some studies have analysed the impact of these works in relation to the sediment transported and deposited along the course of rivers, thereby determining their implications and their impact on the input of sediment in coastal areas [9,18,19].
Sedimentary deficits are not only generated directly via the accumulation in reservoirs but also derived from reductions in the solid flow inputs from riverbanks and rivers themselves, principally due to the increase in plant cover in basins and riverbeds [20,21,22]. The increase in urbanisation and roads at headwaters and in mountain areas limits the amount of sediment that reaches rivers [23]. Forest repopulation and the recovery of the vegetation cover after the rural exodus have also reduced sediment inputs [23]. The construction of thousands of sediment retention dams (check dams) in mountain areas has also contributed to the sedimentary deficit in middle and lower courses. Another key process is the vegetation cover in riverbeds, particularly downstream from reservoirs. This has led to the consolidation of sedimentary deposits and the difficulty of setting them in motion, considerably restricting the transportation and generating sizeable and widespread processes of narrowing and incision [24]. These processes have been intensified due to the extraction of gravel, the channelling of riverbeds and riverbank defences that prevent in situ erosion and further reduce the availability and movement of sediment [25,26,27,28].
In short, the reduction of the discharge of sediment due to the regulation of river basins through dams and reservoirs, as well as the global change in basins and rivers and their undeniable sedimentary deficit effect, together with the increase in sea levels, have caused a process of retreat in coastal areas (deltas, beaches and dune ridges, among others) [29].
Meanwhile, the anthropogenic actions in coastal areas (hydraulic works and economic activities) condition their evolution as they alter the transportation of sediment along the coast via the tide. Therefore, hydraulic actions refer to the presence of hard engineering works to protect against offshore storms through the construction of jetties, breakwaters, sea walls and ports that break the coastal drift. This gives rise to imbalances in the system of sediment distribution, altering and modifying the natural dynamics. Therefore, in sectors of sediment accumulation and accretion areas, coastal areas are retreating further due to the rupture in the coastal drift that transports the materials that are deposited at river mouths and replenishes beaches and dune ridges. Meanwhile, economic activities refer to mass tourism and the construction of housing on beaches, which also alter the natural dynamics of coastal areas, even modifying the behaviour of the wind and affecting the transport of sediment via the air [30].
All these aspects together explain the reasons for the coastal retreat that is occurring in many parts of the world (Table 1), as in the case of Europe and the United Kingdom [8], the Malin Coast in Ilaje (Nigeria) [29], the Carteret Islands in the Pacific and the Indian Sundarbans, Lagos (Nigeria), Jakarta (Indonesia) and Houston (USA) [7], the deltas of the Mississippi (Colorado, USA), Danube, Ebro, Po and Rhone rivers (Europe), the Yellow, Yangtze and Mekong rivers (Asia), the Nile (Africa) [9], the southeast coast of Australia [31] and even California [32], and the coast of Indonesia [33].
In Spain, the current overall trend in the variation in the sea level on the coast is 2.5 mm/year. When this is extrapolated to the year 2050, there would be an average increase in sea levels of 0.125 m [34,35]. Furthermore, no relevant changes have been observed in the magnitude of wave energy, and the estimated directions of exceeded wave heights have tended to increase slightly along the whole coast, implying a reduction in the operability of ports. Moreover, the increase in sea levels gives rise to a variation in flood levels, which would affect the first 200 m of land inwards from the shore [35]. According to Spain’s National Plan for Adaptation to Climate Change (PNACC), for the period of 2021–2030, a significant increase in sea levels has been observed since 1993 along the whole of the Spanish coast. However, in the Mediterranean, there is greater uncertainty regarding the increase in the average sea level due to regional effects, although the rise in the Mediterranean sea level is also notorious [36].
There are more than 1200 large dams and reservoirs throughout the Spanish territory for regulating river basins, which together have a total capacity of 56,000 hm3 and the objective of supplying the existing water demands in terms of quality and sufficient quantity [37]. However, the existence of many transversal works is generating shoreline retreats in different coastal areas of Spain.
On the Atlantic coast in the north of Spain, erosion processes can be observed on the Cantabrian coast, for example on Gerra Beach (Cantabria) [32]. Meanwhile, according to the Environmental Hydraulic Institute of the Universidad de Cantabria, the coast of San Sebastián (Basque Country, Spain), which borders the Atlantic Ocean, is experiencing an increase in its sea level, which is generating coastal erosion processes on the beaches of Ondaretta and la Concha, the beach on the island of Santa Clara and Zurriola Beach. All of this is caused by the regulation of the River Urumea through the Añarbe and Artikutza reservoirs and control dams. This is also the case with the Zadorra River in Blibao, with four large reservoirs that reduce the load of sediment transported via the river to the coast [15].
On the Mediterranean coast, Prats-Puntí et al. [18] analysed the effects of engineering works in the Llobregat River (Catalonia) on the retreat of its delta, which has experienced a retreat of 800 m since the end of the nineteenth century and throughout the twentieth century. The construction of these works, which reduce the frequency of floods and retain sediment in situations of average flows, is responsible for the regression of the coastline [18]. Blay and Ávila [11] analysed the coastal retreat that is experienced at the Ebro Delta since the impact of Storm Gloria (January 2020) and as a result of the construction of reservoirs upstream to regulate the supply of the Ebro basin, which is generating a drastic reduction in the sediment deposited on the coast and leading to a coastal retreat process. Oliva and Olcina [38] analysed the coastal retreat experienced in the south of the province of Alicante and its impacts on the coastal area of the district of Vega Baja del Segura, specifically the beaches of Guardamar del Segura, Torrevieja, Orihuela and Pilar de la Horadada, where there are clear processes of retreat due to the intense regulation of the Segura River Basin, among other actions. These effects can also be seen on the Cádiz coast, particularly after coastal storms [39].
The regulation of river basins leads to a rupture of the river system in terms of the erosion, transport and sedimentation processes along rivers and at their coastal mouths. This has been demonstrated through the monitoring of the effects of the demolition of dams on rivers. In Spain, there are many cases, particularly in the north and west of the peninsula [40], such as that of the Gatera dam in the higher section of the Bernesga River in Leon [41]. According to ministerial data, in 2022, a total of 618 dams and transversal objects had been demolished.
Between 1998 and 2011, the General Directorate of Hydraulic Works of the Provincial Council of Guipúzcoa carried out 63 projects for the demolition of transversal walls, having conducted 11 total demolitions, 9 partial demolitions and 5 ramps for fish [42]. These projects included the complete demolition of the Mendaraz dam (2010) regulating the River Urumea (Guipúzcoa, Basque Country) and the partial demolition of the Inturia dam (2014) that regulated the River Leitzaran (Guipúzcoa, Basque Country) [40,43]. According to Ollero et al., (2014), just six months after the demolition of the first dam, rapid movements of sediment downstream were observed, thanks to an extraordinary swelling of 423 m3/s of the River Urumea on 6 November 2011, which generated significant geomorphological changes due to the downstream transportation of the majority of the sediment retained in the former water body [40].
The majority of the Spanish coasts have hydraulic infrastructure to defend against offshore storms, taking the form of breakwaters, jetties, sea walls and gabion walls, among others, that affect coastal drift. Furthermore, the channelling of the final stretches of the rivers also leads to the rupture or alteration of the functioning of coastal dynamics, which distribute the sediment along the coast. On the other hand, the economic activities carried out in these spaces also cause the rupture of coastal dynamics through the construction of yachting and commercial harbours with the presence of long jetties and the construction of buildings on beaches, which seriously affect the areas of sediment accumulation (dune ridges) and the disruption of the wind circulation which transports sediment by air.
In 2014, 4.2% of the land area in Spain corresponding to the first five kilometres leading inwards from the coast concentrated 44% of the Spanish population [44]. Between 2011 and 2020, the Spanish population increased by 0.6%, but this increase has principally affected the coastal areas (+1.6%), as opposed to the non-coastal areas, which have lost population (−0.1%). Currently, 18 million inhabitants are registered in coastal urban nuclei, with a density of 429 hab/km2, which is five times that of the average density of Spain as a whole [45]. This continued demographic growth process in coastal areas underwent an explosive phase called the “urbanisation tsunami”, experienced in Mediterranean coastal areas between 1995 and 2007 [46], when an intense “coastalisation of risk” occurred [47]. This accelerated occupation of the Spanish coastline has generated serious environmental problems and has reinforced the direct effects of erosion in coastal areas [38].
In the Region of Valencia, there is a high level of risk on the Mediterranean coast due to anthropogenic actions on the coastal system, which constitutes a very serious problem. The increase in the sea level, the regulation of the river basins and the anthropogenic pressure on the coast increase coastal erosion, raising the risk of coastal floods due to offshore storms affecting homes built on beaches [38].
This article analyses the coastal retreat on a beach sector in the south of the Province of Alicante. It completes and expands on the work carried out by Oliva and Olcina [38], focusing on the dune ridge of the Municipality of Guardamar del Segura (Alicante, Spain), where the effects of coastal retreat are extremely severe.
To do this, the objectives of the current research were the following:
(a)
To analyse the regulation works on the Segura River Basin with the reduction of average and extraordinary flows.
(b)
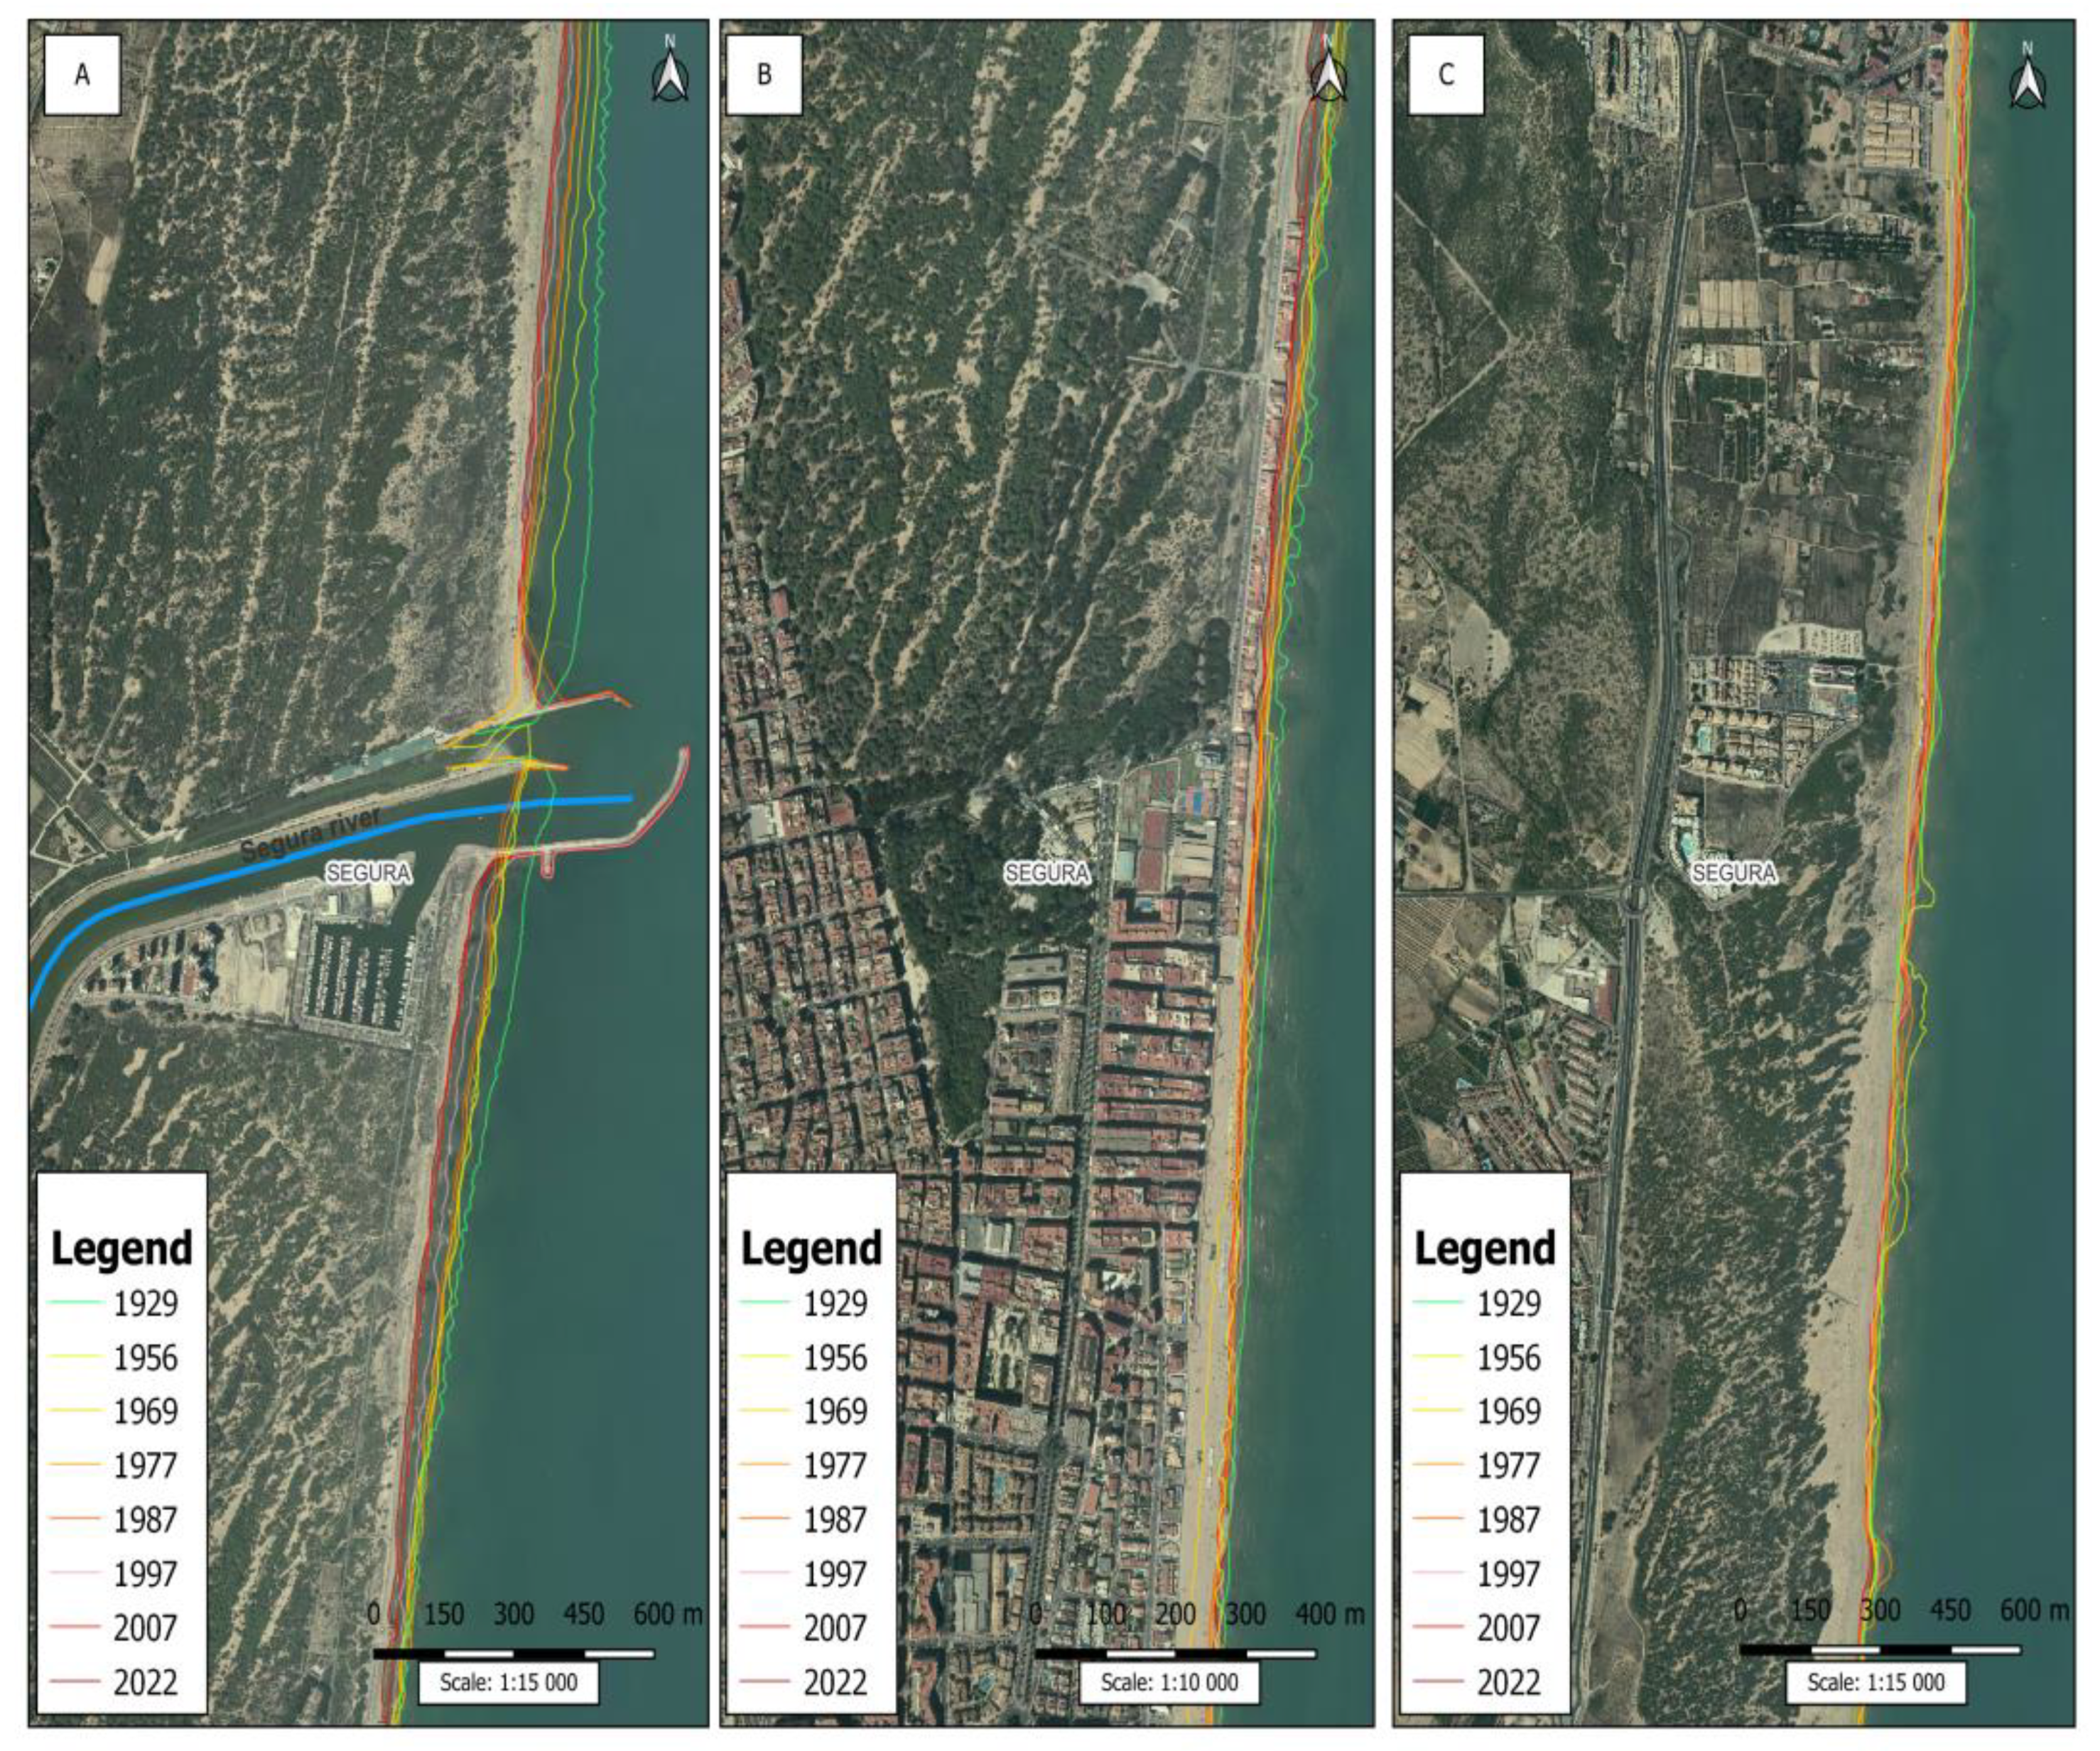
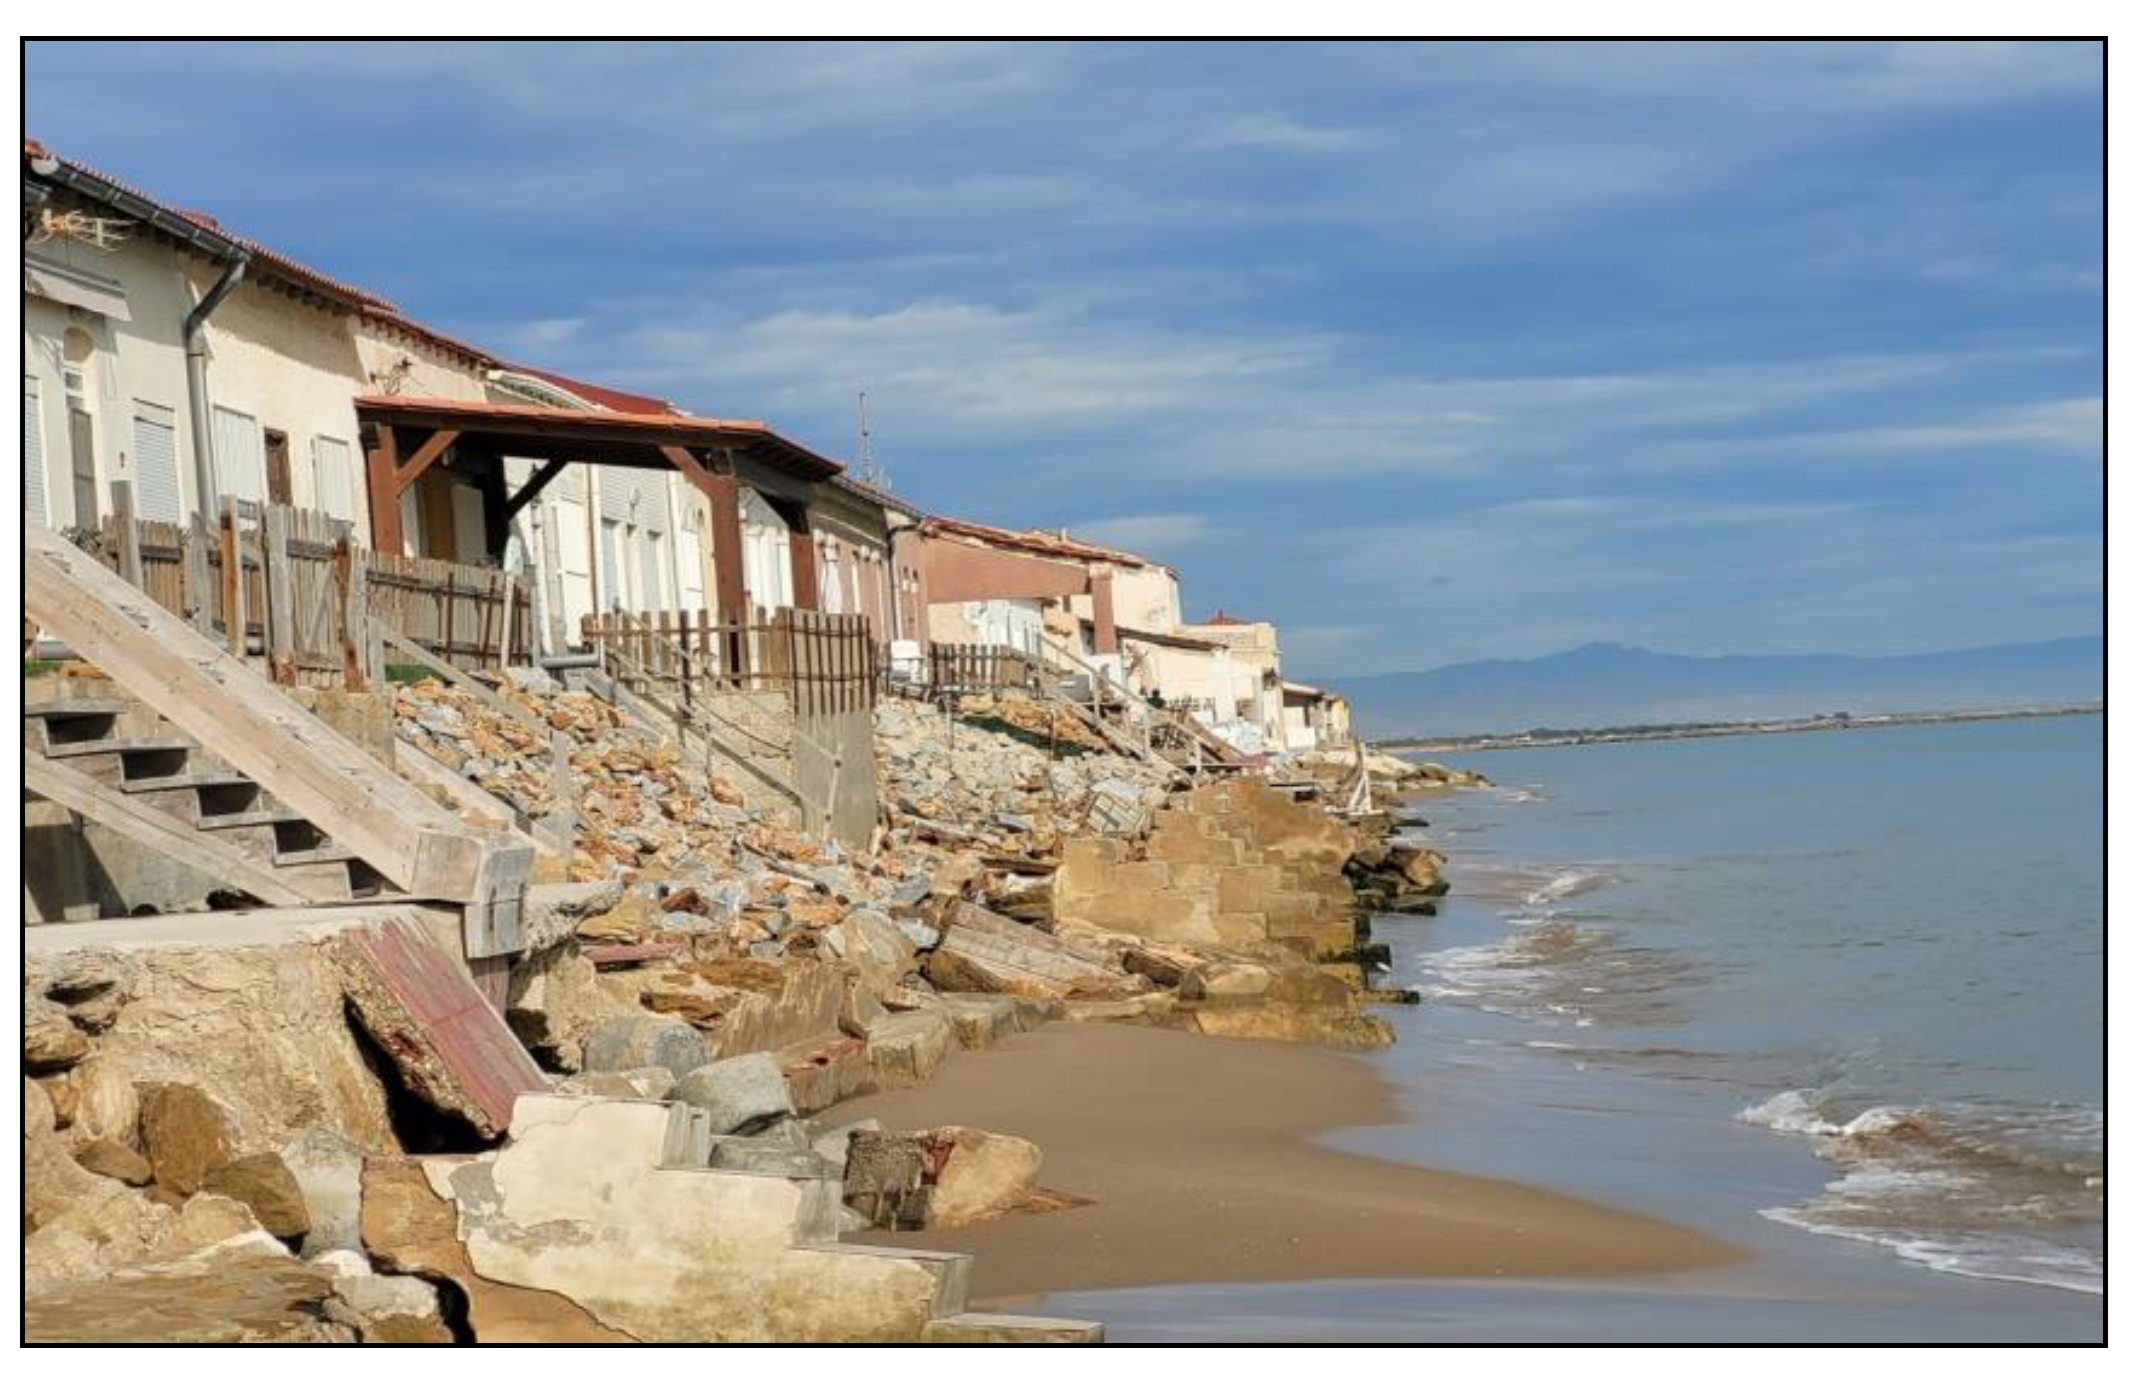
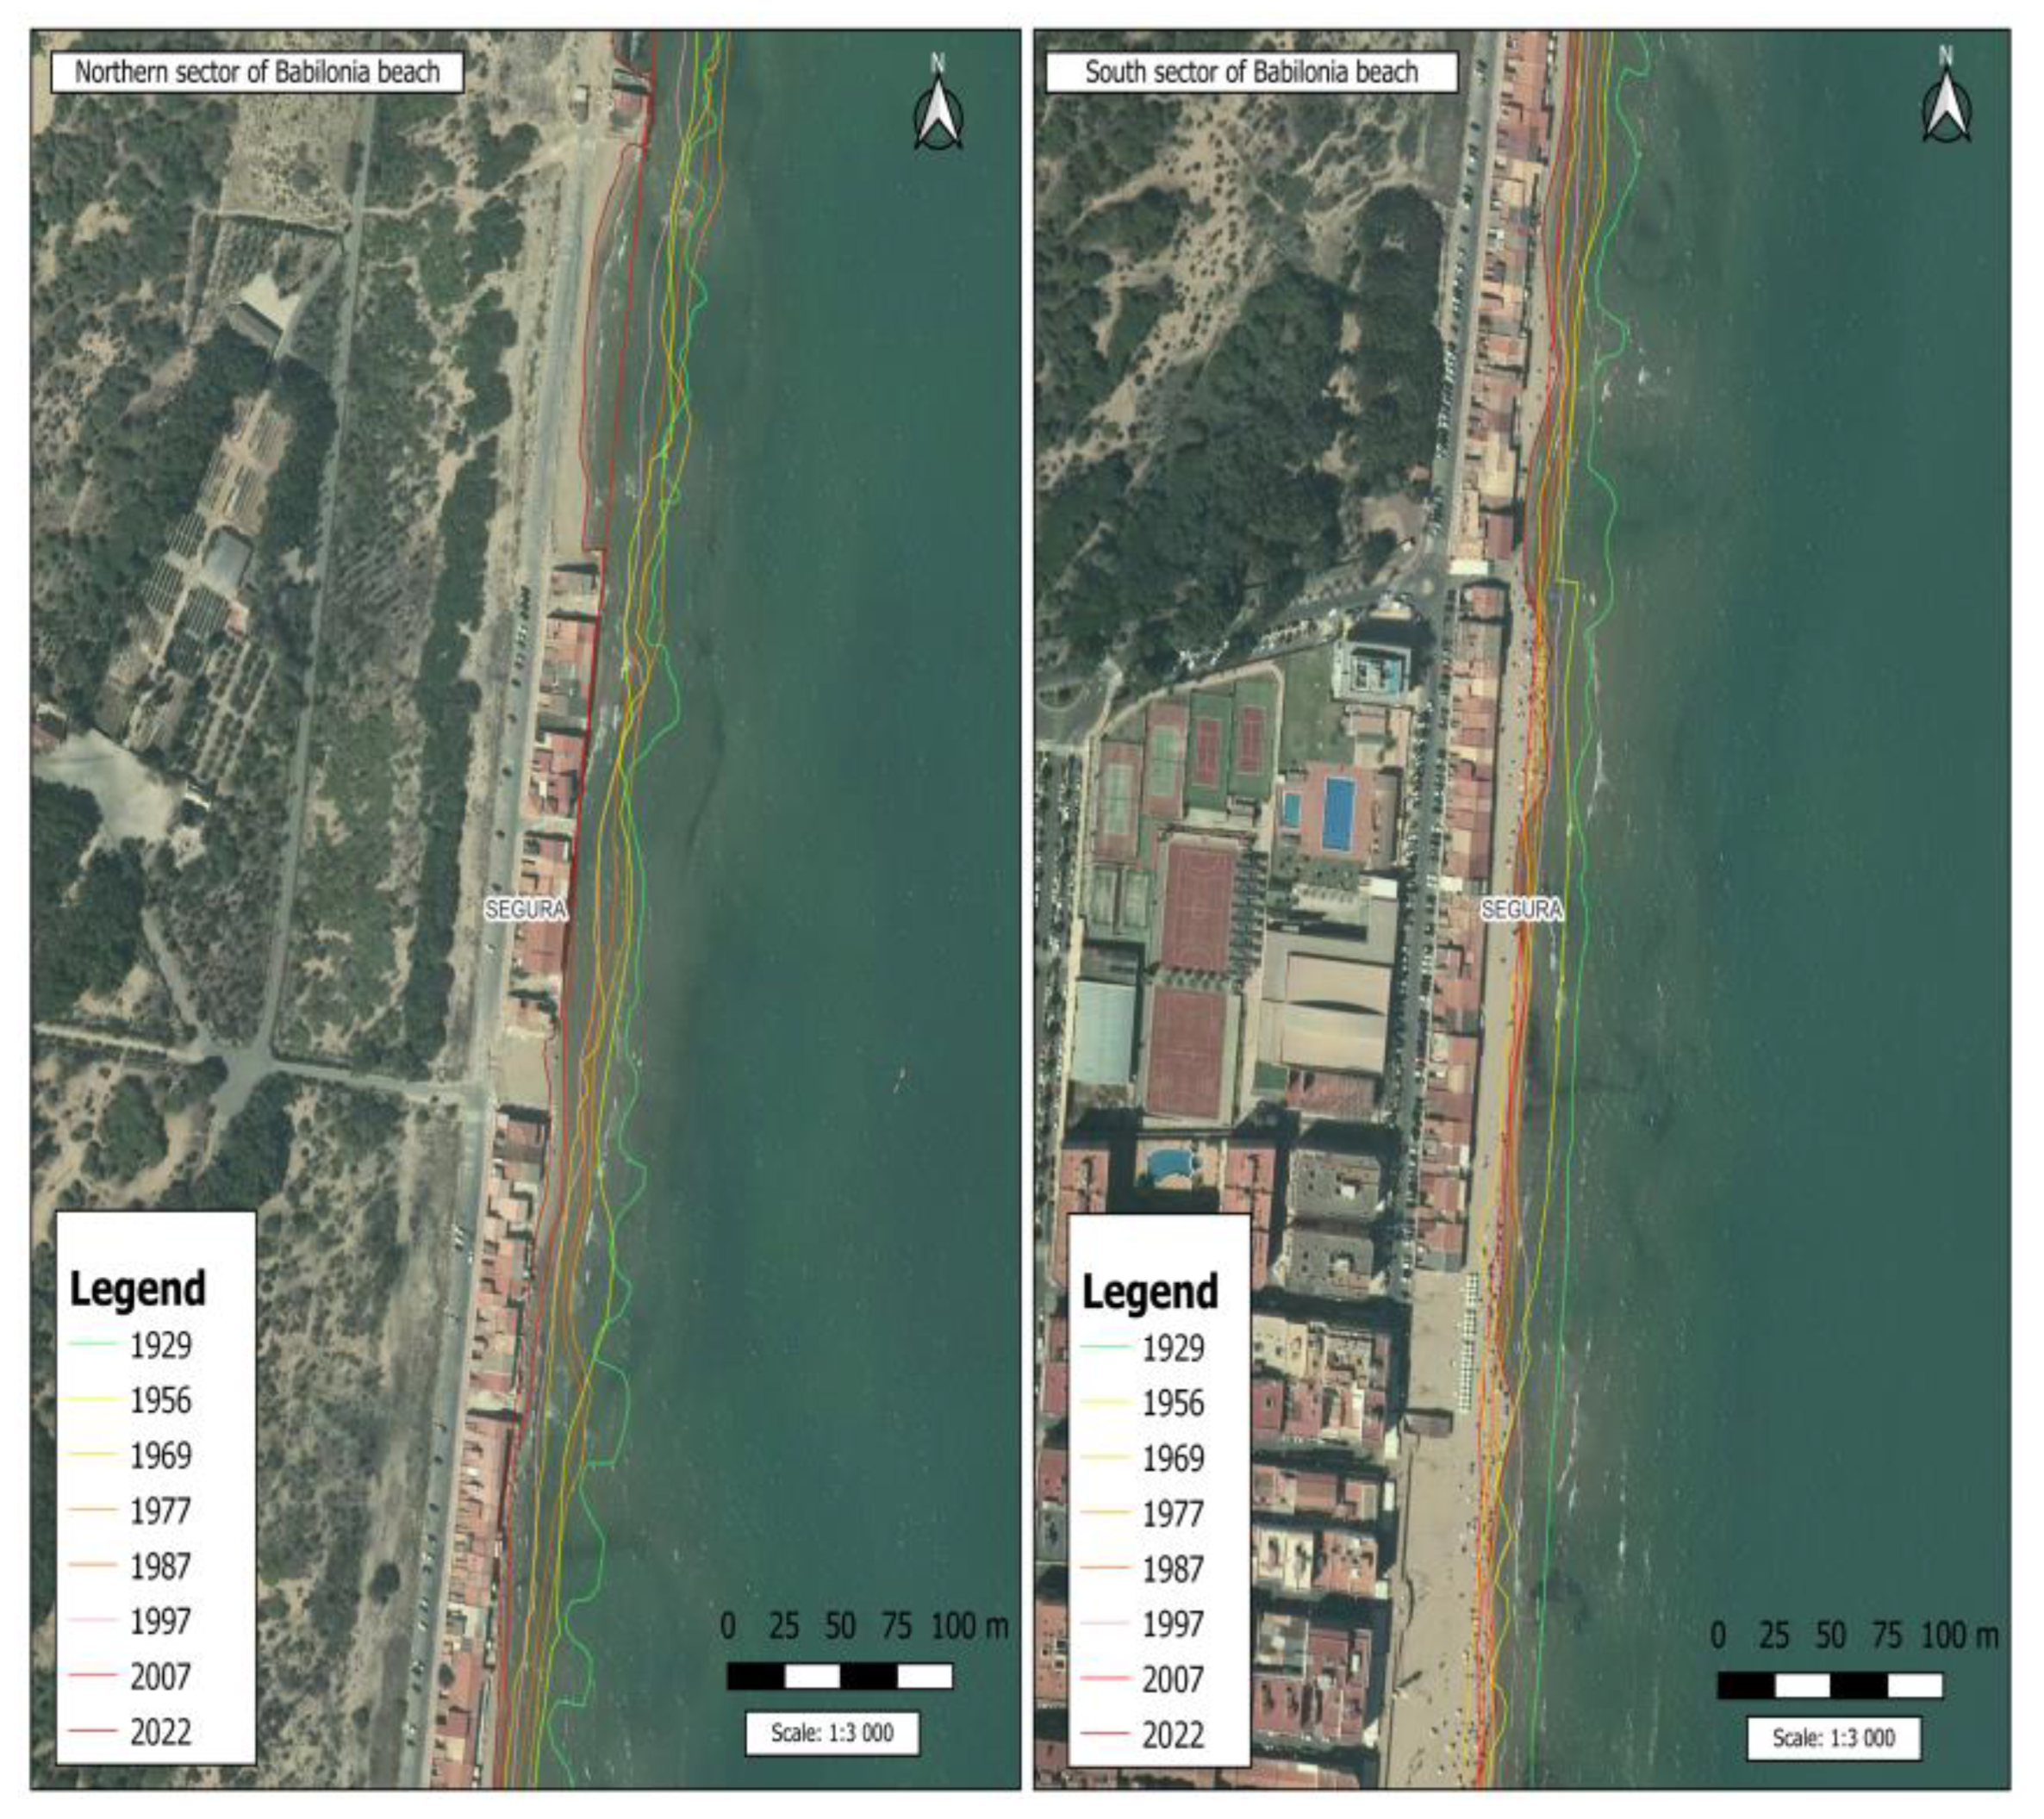
To analyse the coastal retreat experienced between 1929 and 2023 on the coast of Guardamar del Segura, specifically the problem of Babilonia Beach.
(c)
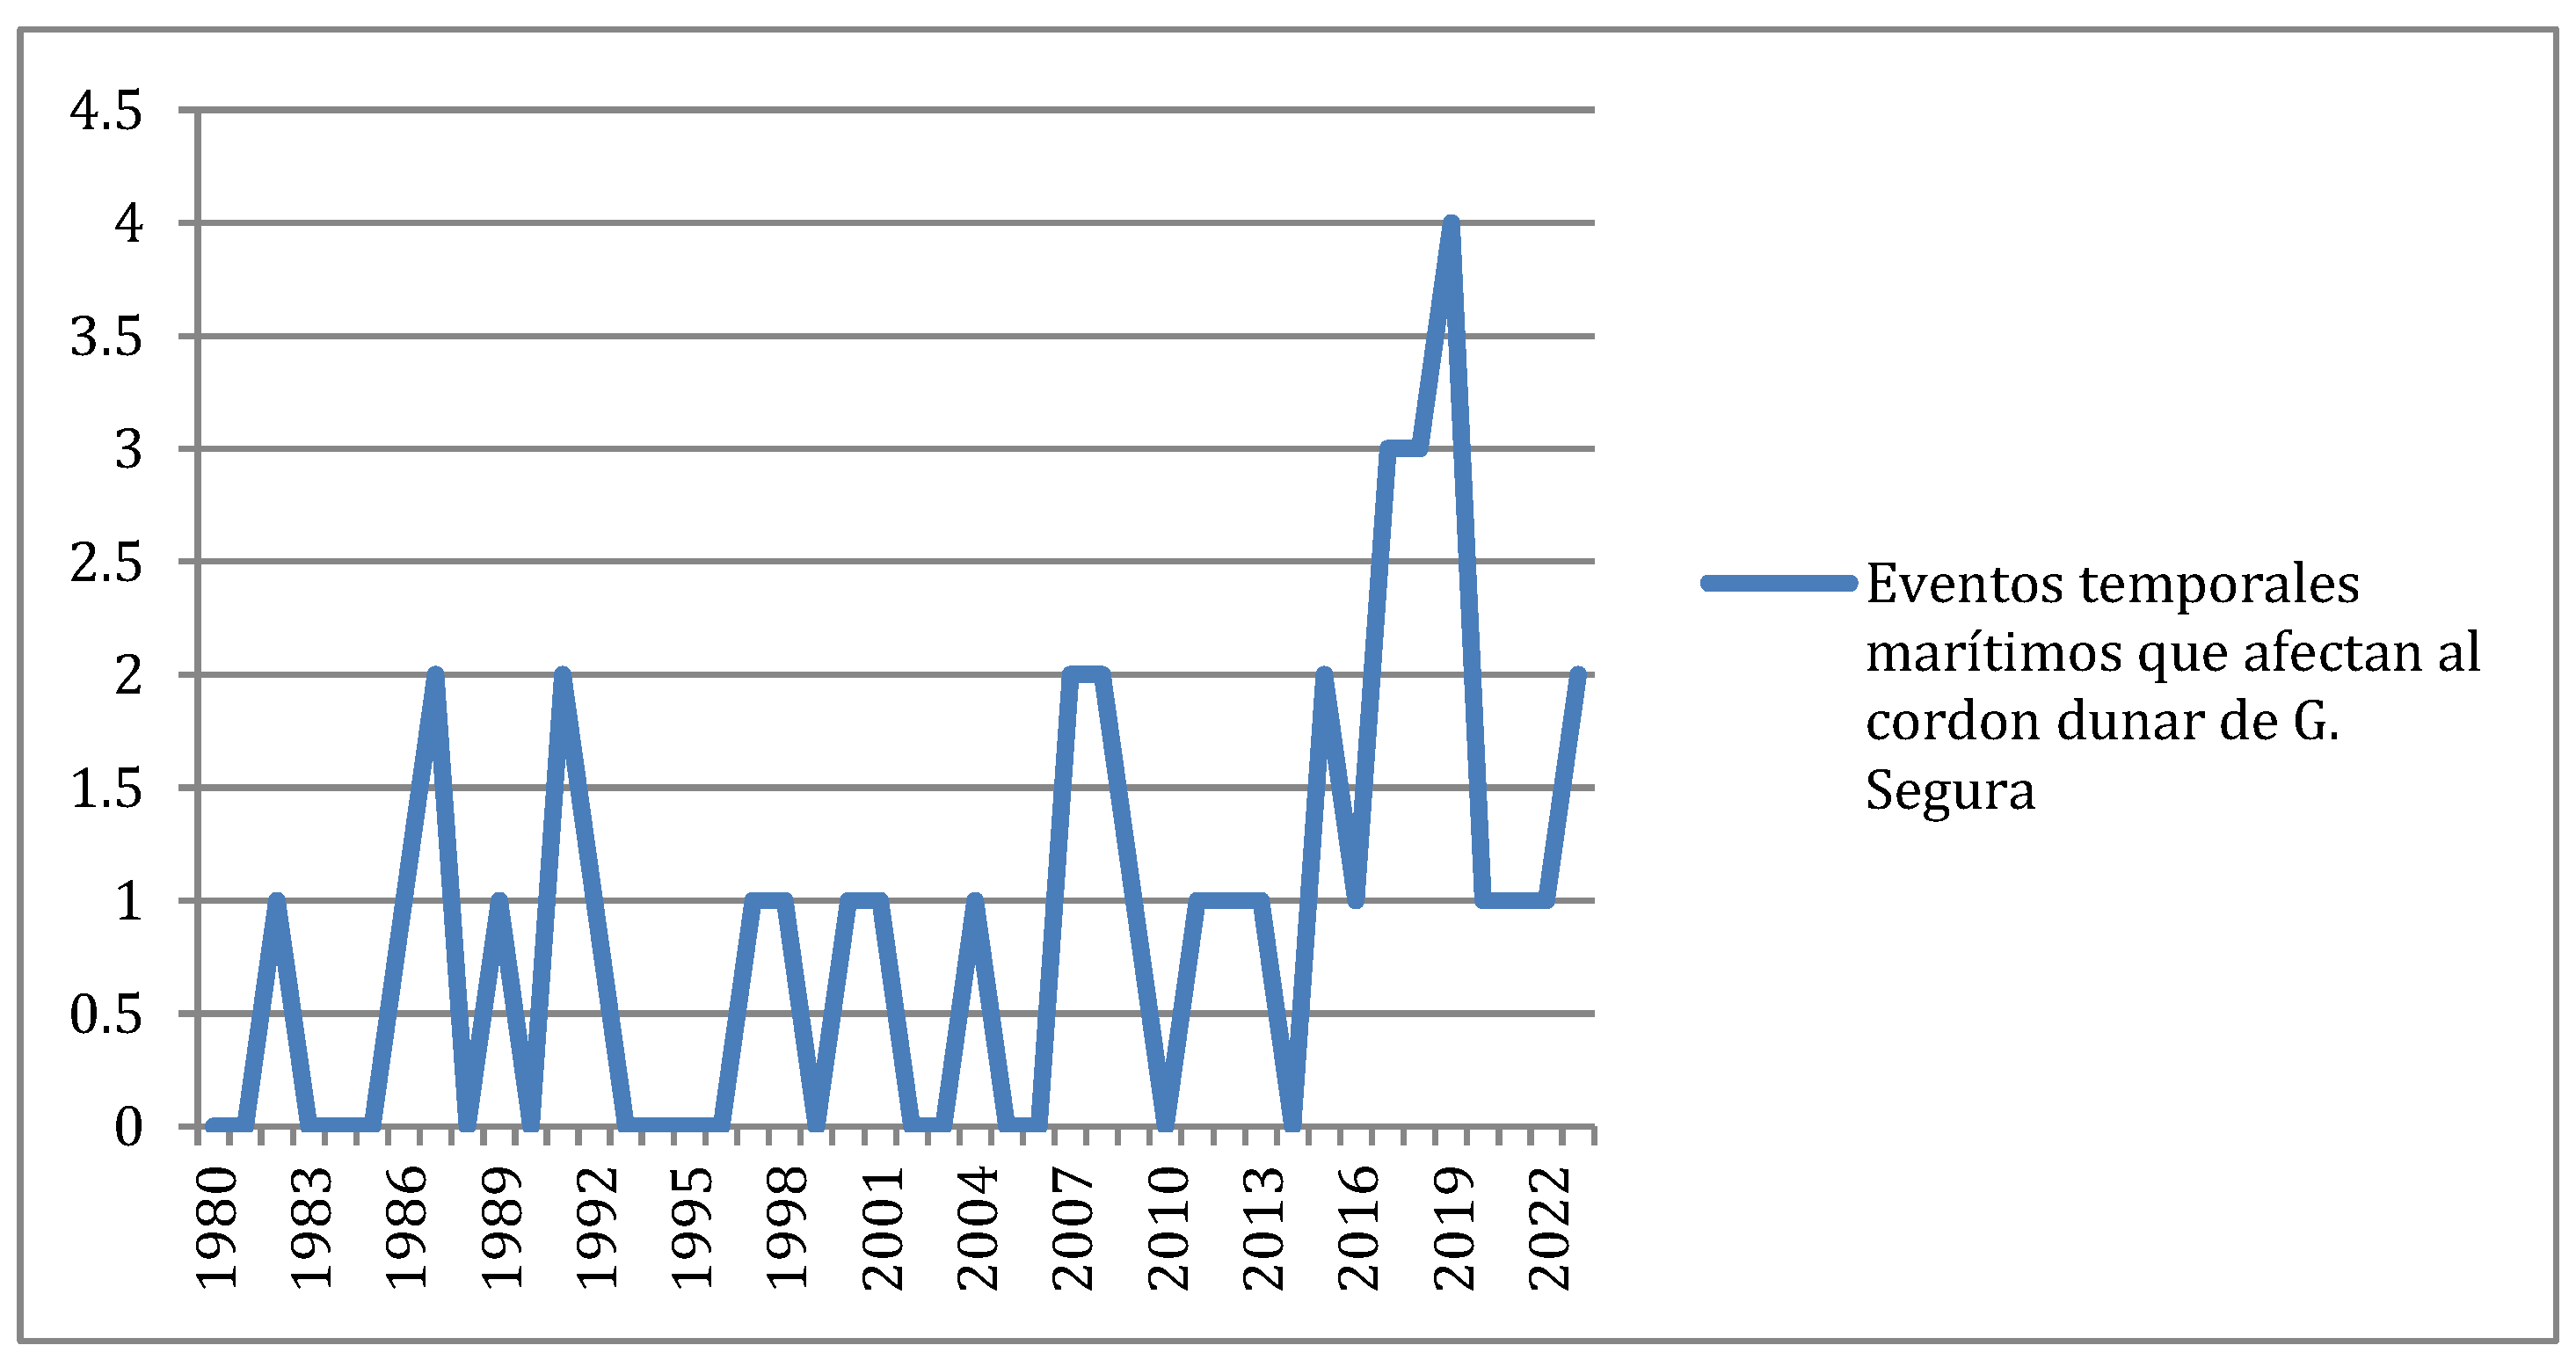
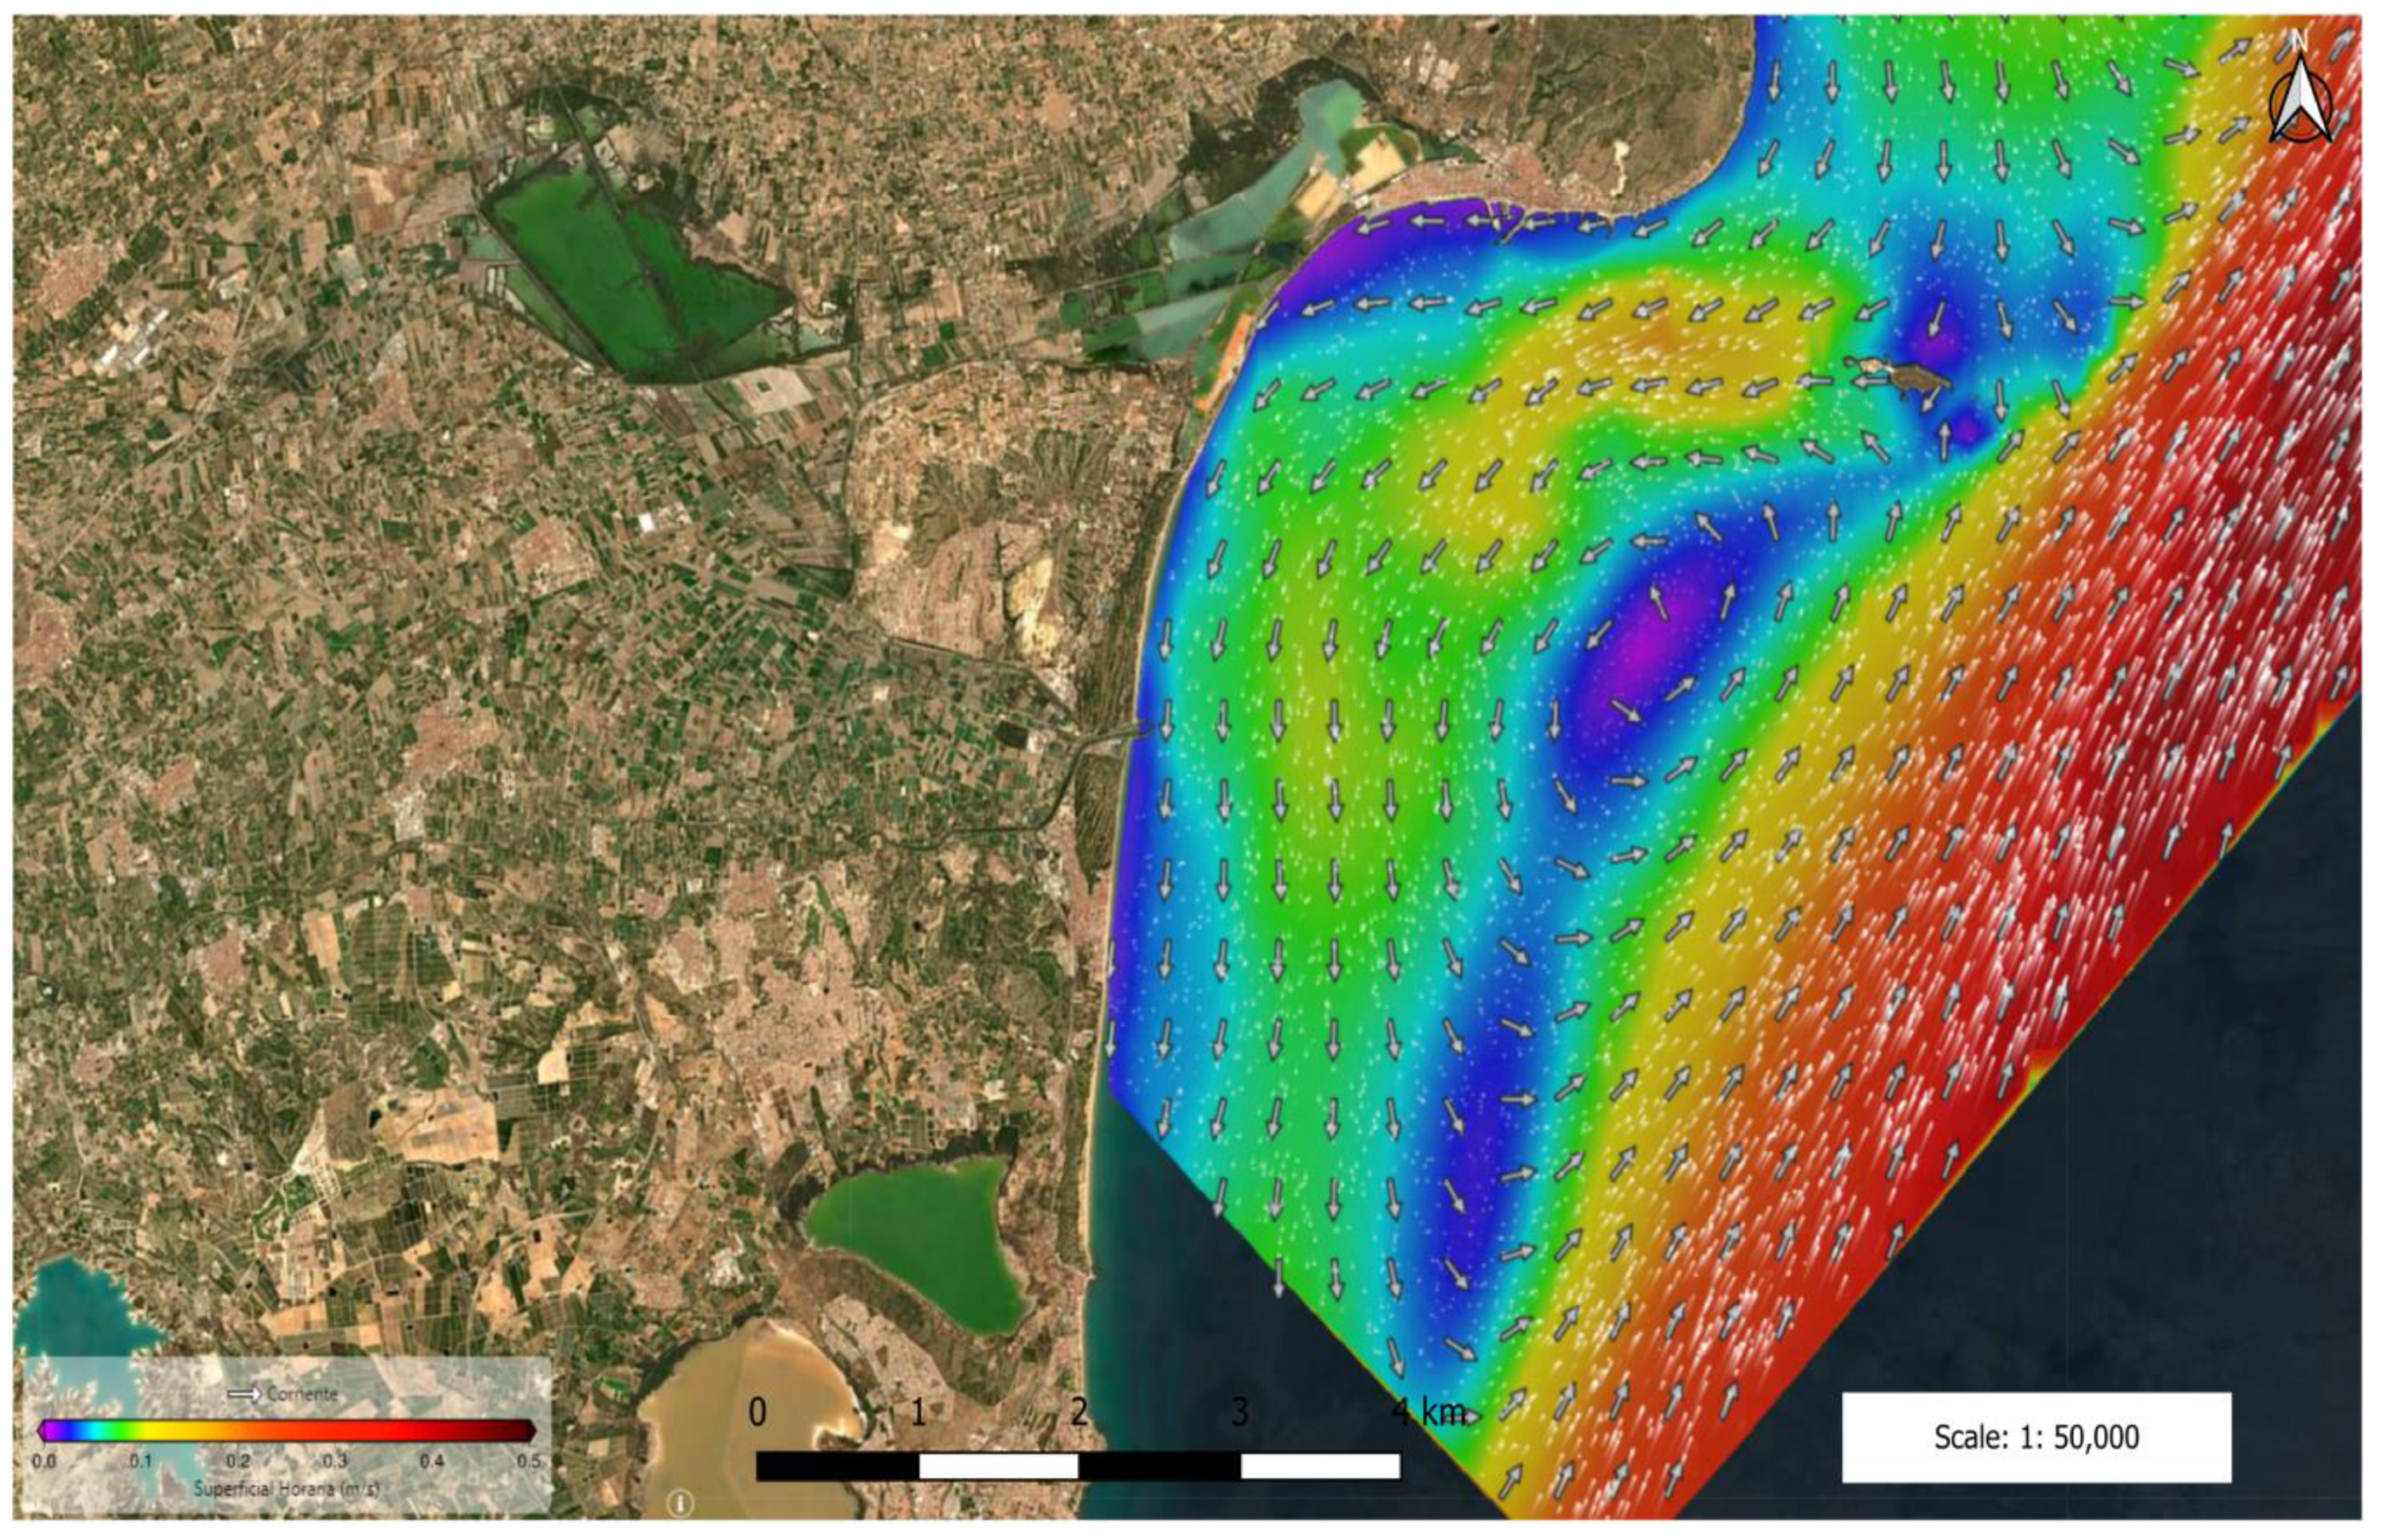
To analyse sea currents, waves and winds.
(d)
To make proposals for the recovery or reduction of coastal retreat in the sector of Guardamar del Segura.
Analysing these points enabled us to provide a series of proposals for adapting to climate change that will help slow down or reduce the coastal retreat in this space, increasing the resilience of coastal areas and, specifically, the sector located in the south of the mouth of the Segura River, a highly anthropised space which manifests the effects of the climate change process.

2. Materials and Methods
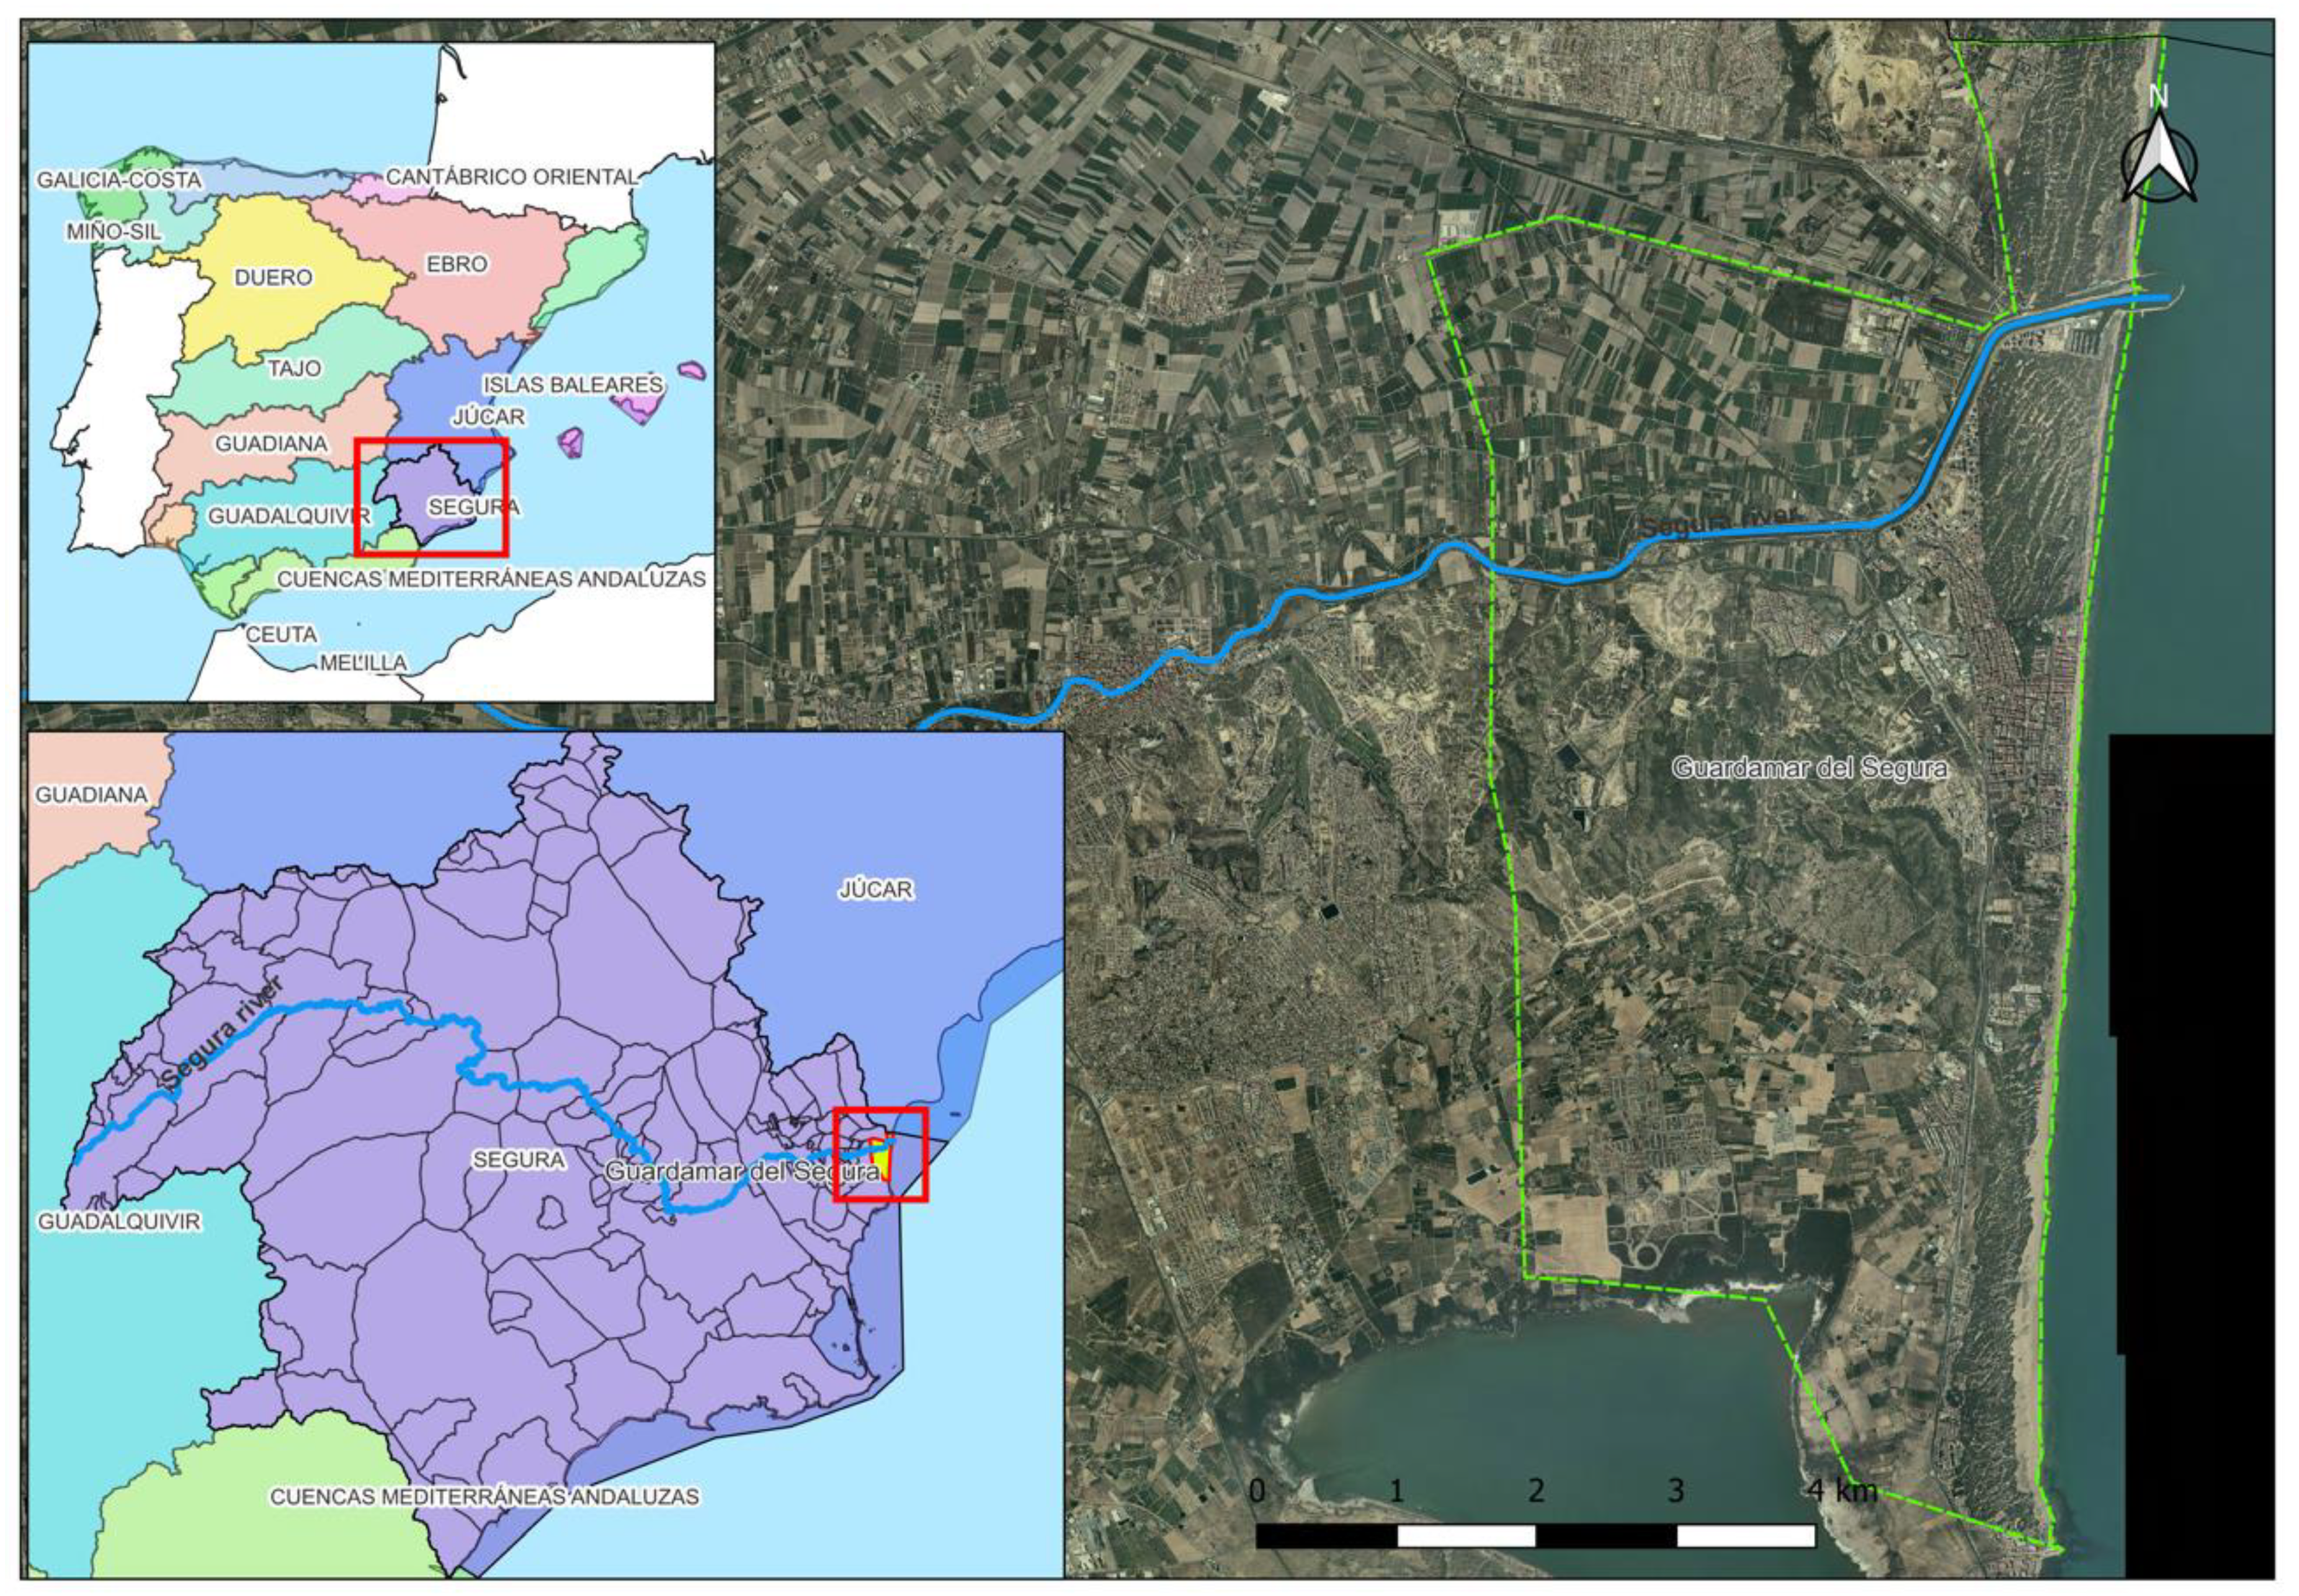
2.1. Study Area

The area of study is located in southeastern Spain and belongs to the Segura River Basin (SRB). This selected area corresponds to the Municipal District of Guardamar del Segura, where the mouth of the Segura River is found, which is the principal source of sediment input on the coast of this sector (Figure 1).
The predominant climate in the Segura River Basin corresponds to a Mediterranean climate, with particular typologies in the different areas that make it up (inland areas, coastal areas, mountain areas and river plains) [48]. The average annual temperature of the Segura Basin is 16.5 °C (for 1994–2014) [48]. The average annual rainfall of the Segura River Basin is 382 mm (1940–2006) or 362 mm (1980–2006), and it is characterised by a rainfall regime with large spatiotemporal imbalances and a clear contrast between the headwater areas and the middle and lower parts of the basin, including the coastal areas [48]. The wettest months are the autumn months: September, October, November and December. These are followed by a second peak in spring: March, April and May. The average potential evapotranspiration is of the order of 700 mm, and the average actual evapotranspiration is estimated at 328 mm (for 1940–2006) [48].
The Municipal District of Guardamar del Segura has a population of 16,138 inhabitants, according to the municipal population register of the INE (2022). The principal economic activity of the region is summer tourism [49], commonly known as sun and beach or mass tourism, which places greater anthropogenic pressure on the dune system.
The Guardamar del Segura coast has a long history of anthropogenic actions dating back to the eighteenth century [49]. As indicated by Fernández-Hernández et al. [49], the dune system of this area did not consolidate due to the mass felling of trees for the fishing industry during the eighteenth century. For a long time, the village of Guardamar was “threatened” by the movements of the dunes. From 1900 to 1930, the engineer Mira y Botella directed the reforestation of the area, which reduced the movements of the dunes and, therefore, prevented the burial of the village. Specifically, the houses on Babilonia Beach did not respond to the predatory urban planning model of the second half of the last century on the Spanish Levante coast. On the contrary, these houses were built before 1930. Over the years, the number of houses constructed on the beach increased until the end of the 1970s and remained constant until the 2000s [49].

2.2. Methodology

In order to fulfil the objectives of this research, historical data were obtained from an official organisation, specifically the Confederación Hidrográfica del Segura. In addition, many scientific–academic studies were consulted on topics related to the regulation of river basins, examples of dam demolitions, the behaviour of sediment and coastal retreat problems in coastal areas in other parts of the world and in river deltas. The literature on nature-based actions was also consulted, together with successful cases of coastal places’ recovery in other parts of Spain and the world.
Maps were developed using a GIS (geographical information system, specifically QGIS 3.26.2.), which presented the obtained results visually and graphically so that we could understand the evolution of the regulation works and the coastal retreat processes existing in the area of study.
The methodology applied to obtain the results presented in Section 3.1 was based on the consultation of public documents drawn from official sources (Confederación Hidrográfica del Segura), supported and complemented by a scientific–academic bibliography in order to establish the year of the regulation works in the Segura Basin. Furthermore, in order to obtain the average flows, we created our own graphs based on data gathered from the Hydrological Plan of the Segura Basin (2022–2027). The data referring to extraordinary flows or notorious floods of the Segura River and its network of tributaries were obtained from the SAIH (Automatic Hydrological Information System) of the Segura Basin for the period of 1994–2023, the years for which data on the functioning of the stations were available.
In order to obtain the results presented in Section 3.2, historical flight photographs from 1929 to 2023 were considered from three specific sources: the viewer of the Segura Hydrographic Confederation [50], the viewer of the Valencian Cartographic Institute (ICV) [51] and the WMS connection services of the National Geographic Institute (IGN) [52]. Therefore, through GIS, mapping was conducted manually to draw the coastal line that existed in each year chosen (1929, 1956, 1969, 1977, 1987, 1997, 2007 and 2023). This enabled us to observe the historical evolution of the area’s coastal retreat and relate it to the anthropogenic actions in the basin and coastal areas. The methodology applied to conduct the mapping was based on the study by Fernández-Hernández et al. [49]; it entailed drawing a line between dry sand and the sand that had been wet by waves [48] (Figure 2).
The measurements carried out started at the drawn line and finished at the end of the beach, where the line met the pine forests that fix the area’s dunes. In other words, the line that was drawn to the area where the tree cover starts was measured.
The number of homes was obtained by consulting the cadastre of the Region of Valencia, available in the viewer of the Valencian Cartographic Institute (ICV) [53] and the areas that represent the homes constructed and demolished through the calculation of areas in the GIS program.
In order to determine the frequency of offshore storms that affect Babilonia Beach, the newspaper archive of Diario Información was consulted, together with other digital sources and newspapers published in the area of study (Vega Baja Digital and Alicante Plaza, among others).
With respect to Section 3.3, the data referring to wind and waves and the modelling of existing marine currents in the area of study were obtained from the oceanographic section of the portal Puertos del Estado (State Ports) [54] associated with the Ministry of Transport, Mobility and Urban Agenda of the Spanish Government.

3. Results

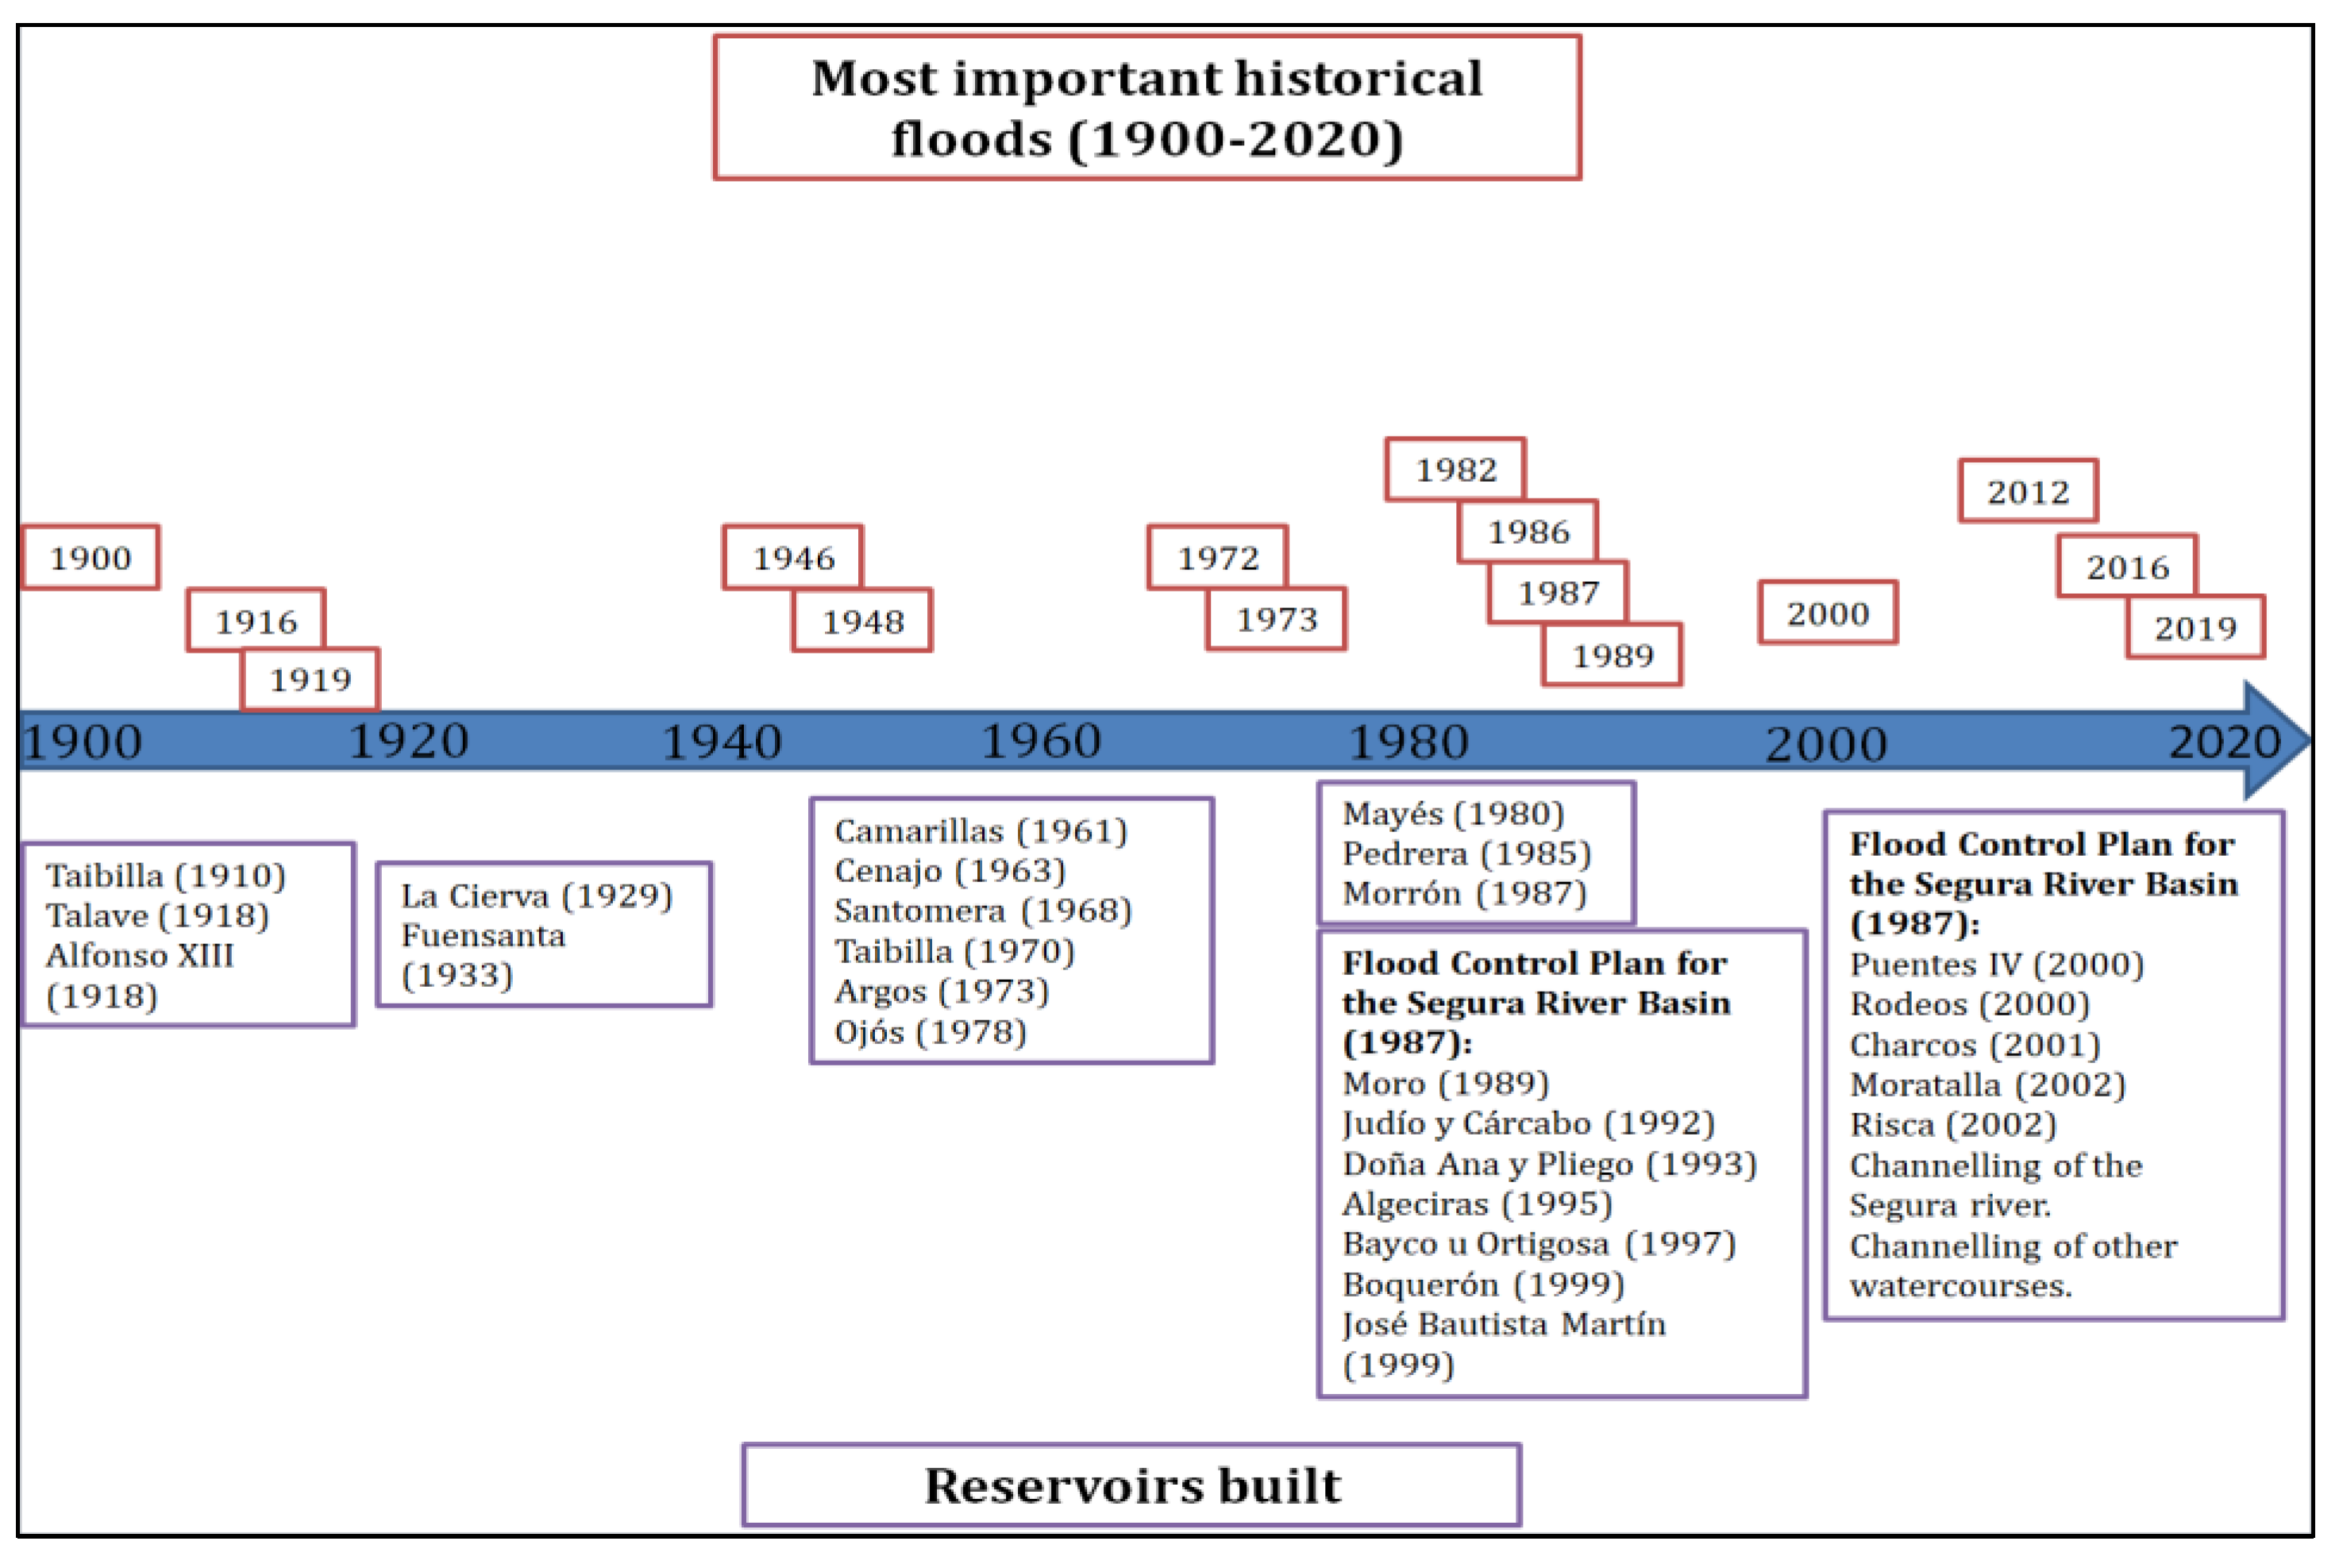
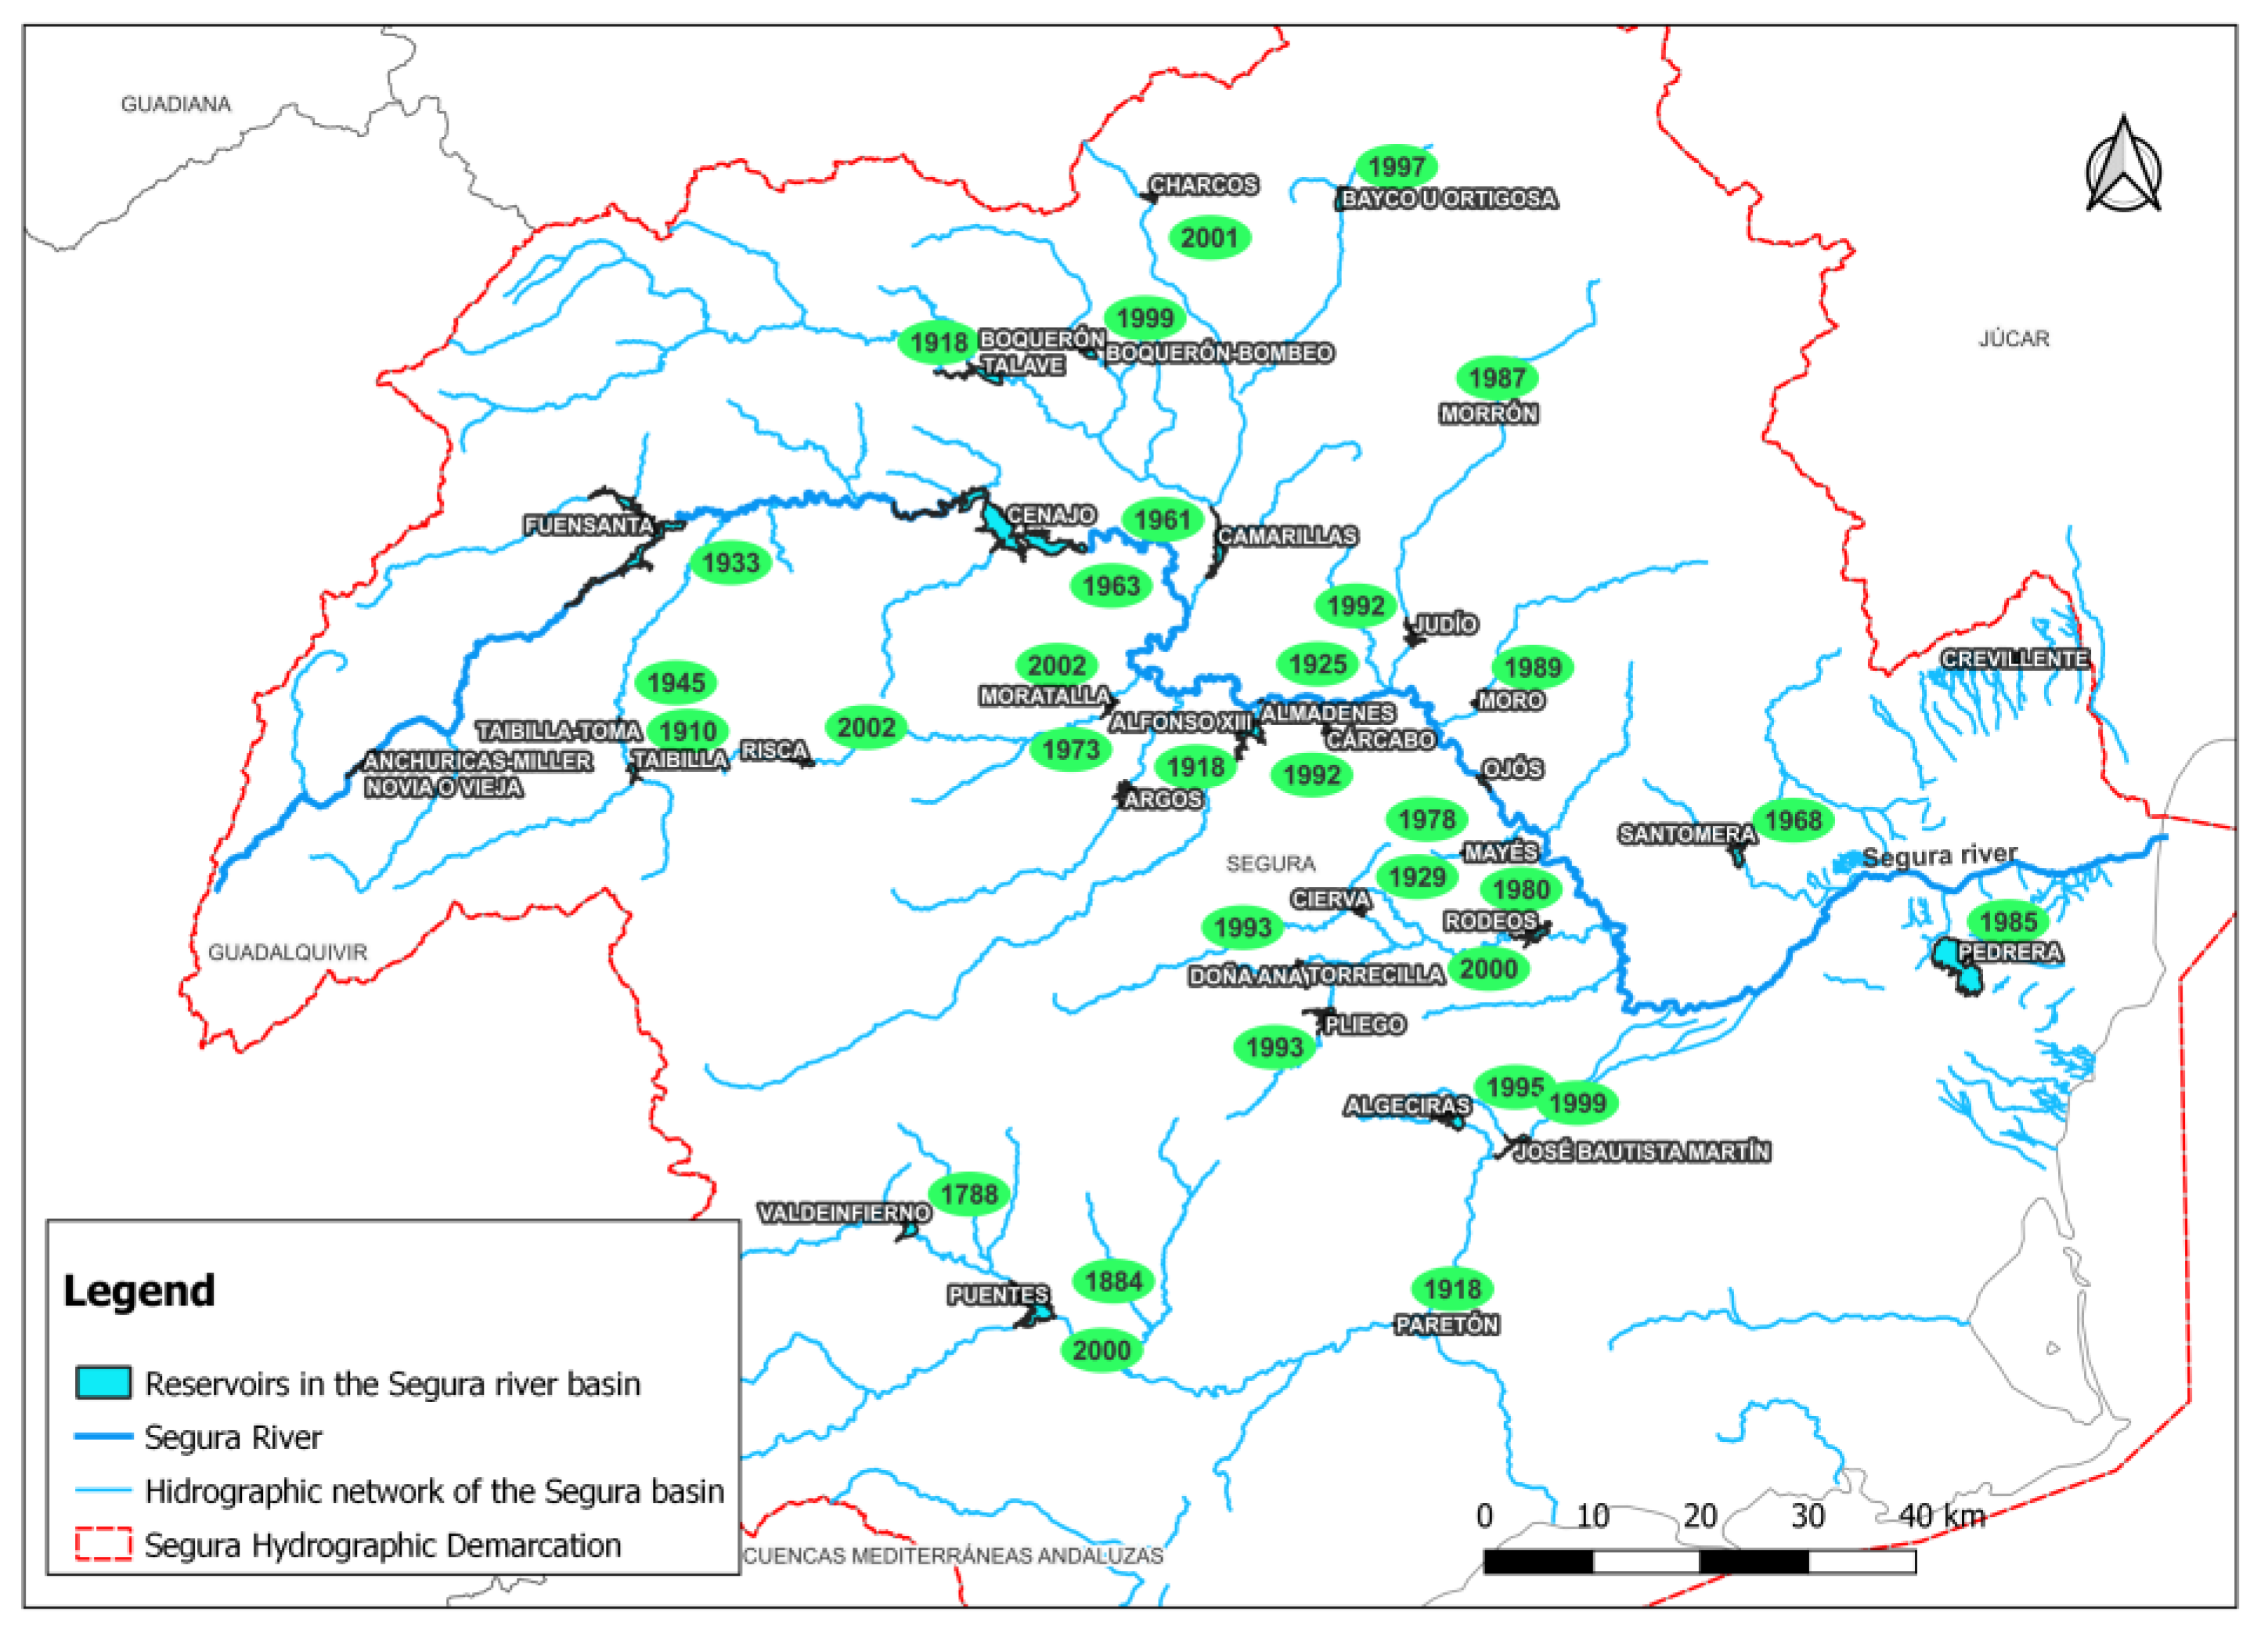
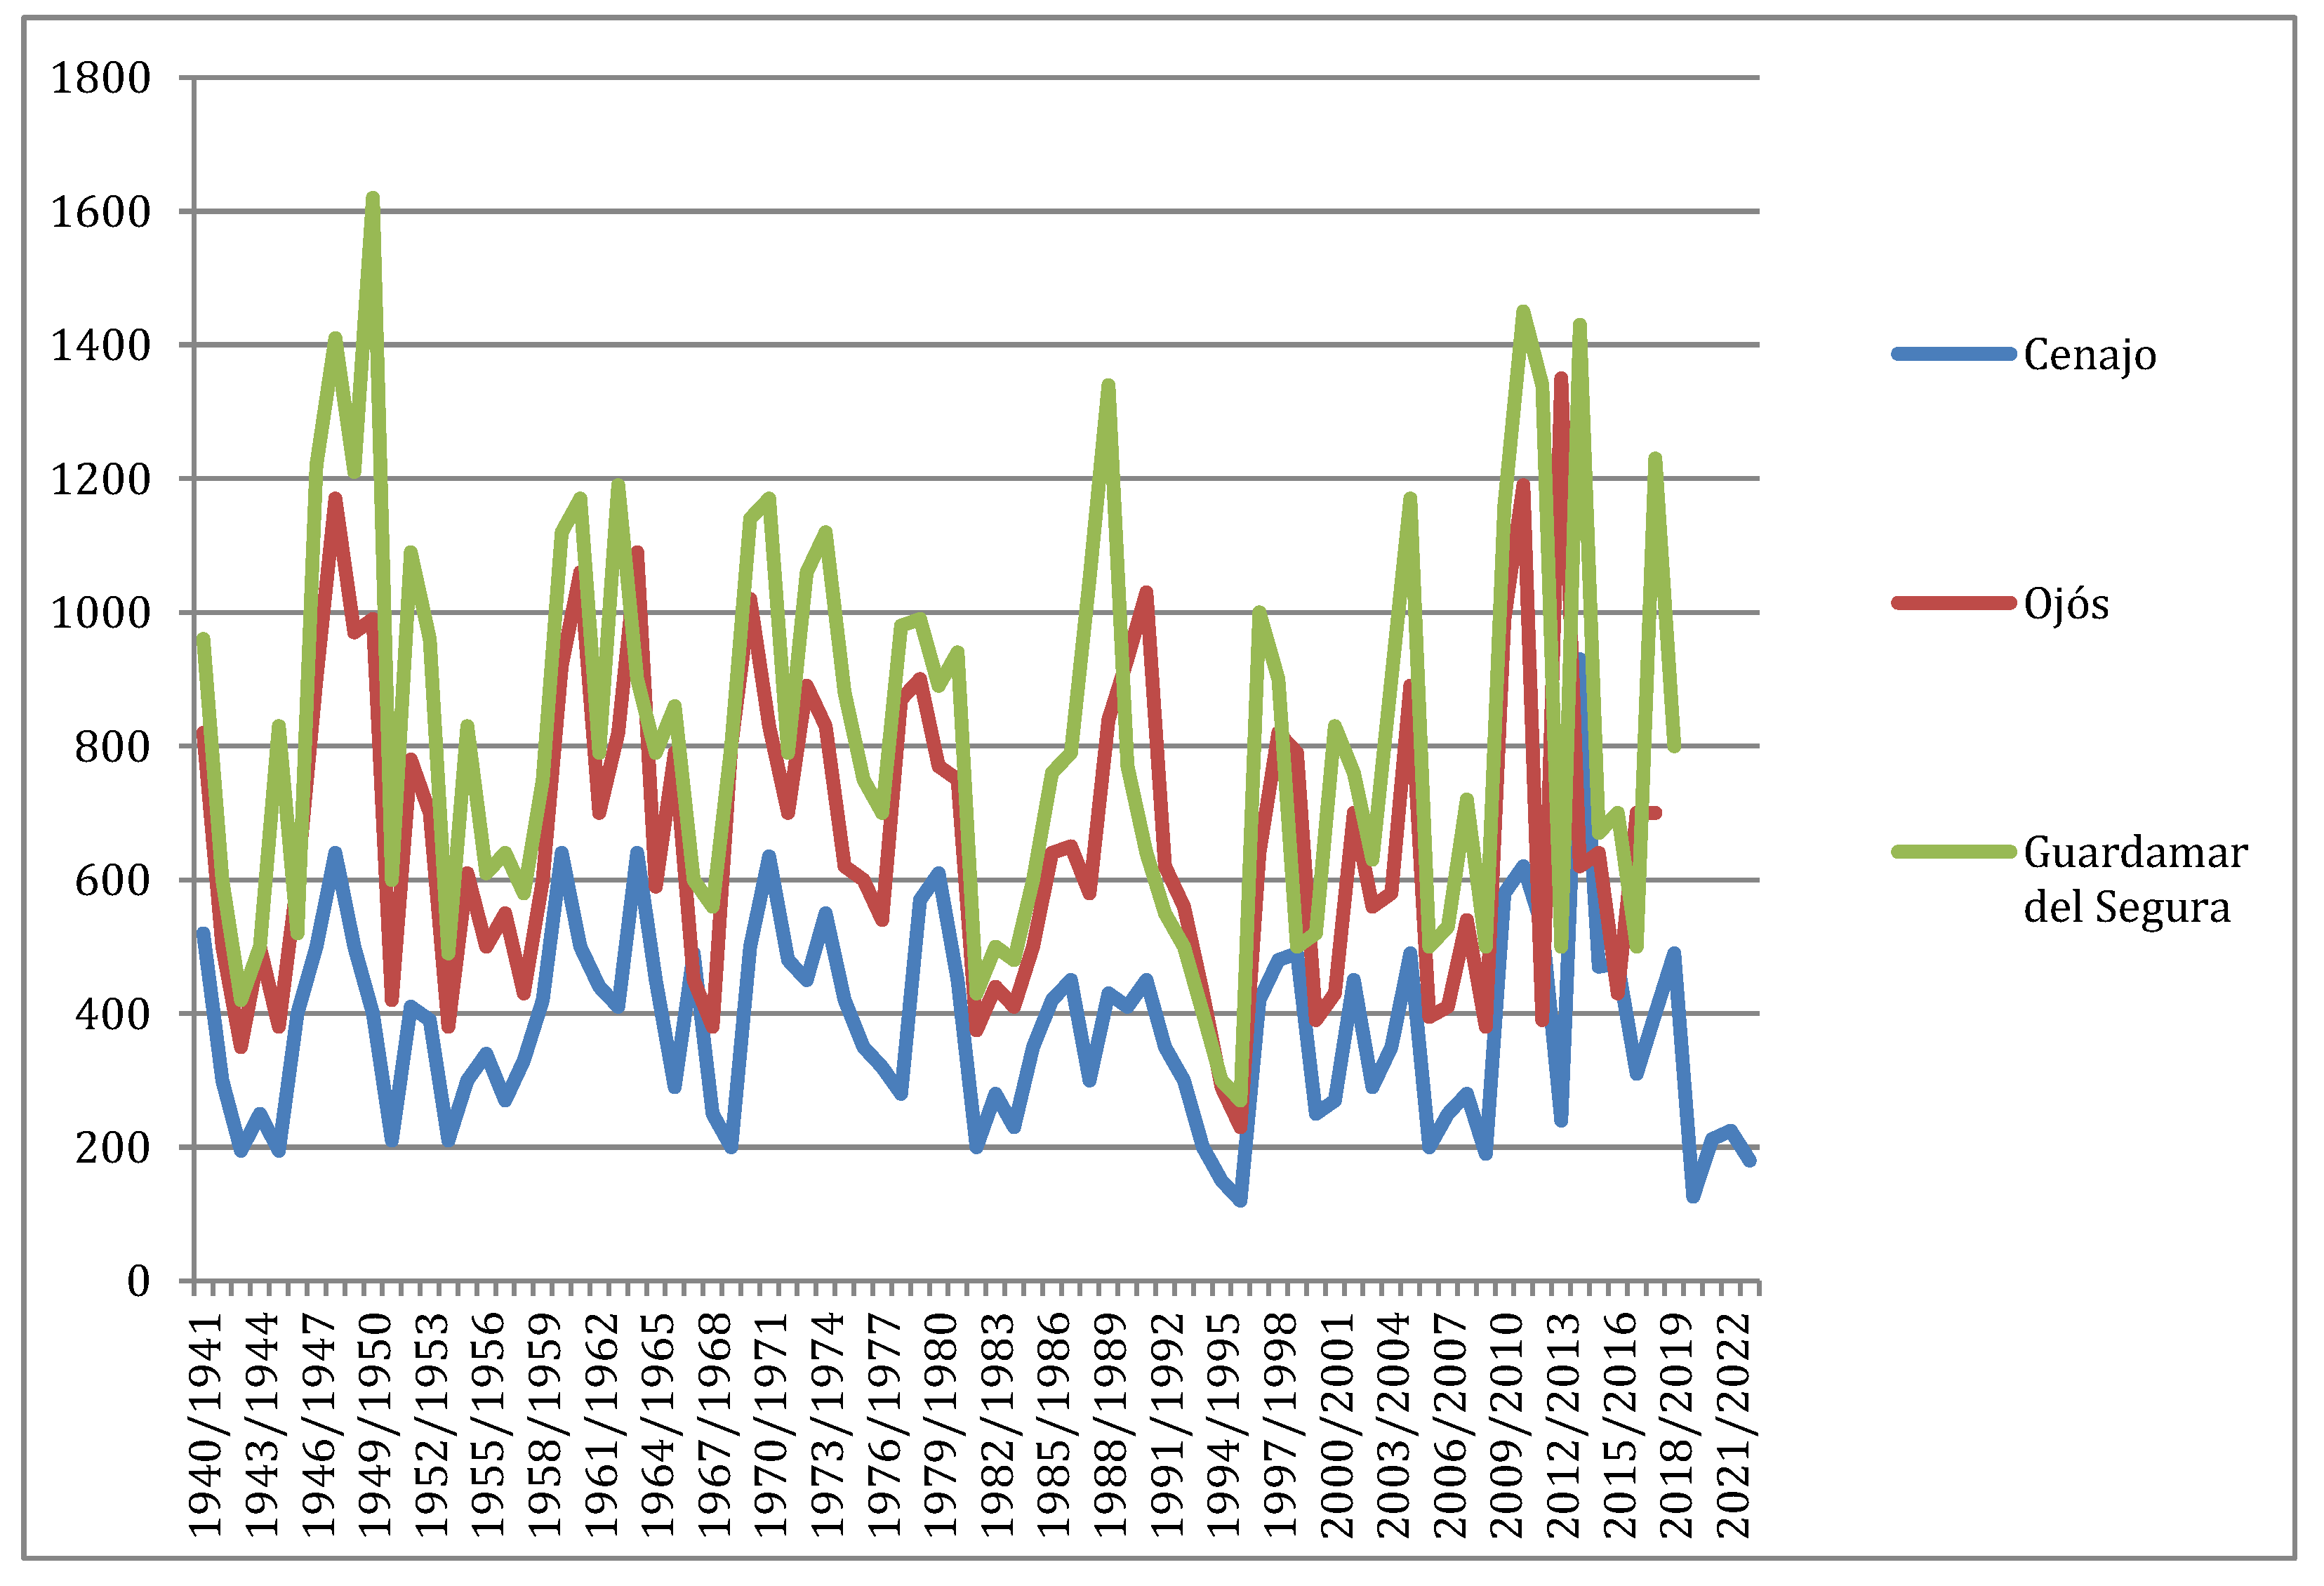
3.1. Major Regulation Works in the Segura Basin and the Reduction of Ordinary Average Flows and Extraordinary Maximum Flows

There is a direct relationship between the retreat effects in the coastal space of Guardamar del Segura and the large regulation works carried out in the Segura River Basin from the 1940s to the present day. The coastal retreat process experienced in the coastal area of Guardamar del Segura began with the construction of large dams or reservoirs.
In this case, the Valdeinfierno (1788) and Puentes III (1884) reservoirs particularly stand out, with a capacity of 20 hm3 and 36 hm3, respectively. However, the Guadalentín River has an ephemeral flow in which water circulates in situations of abundant or torrential rainfall. Therefore, its sediment input is produced in times of swelling or floods.
A chronological diagram was created, and it indicates the most important historical floods in the Segura Basin in the period of 1900–2020, together with the evolution of the construction of the reservoirs or control dams in said basin. Some were built to defend against floods and others to regulate the river basin and its water supply (Figure 3).
Figure 4 shows a map of the location of the reservoirs built in the Segura Basin and their year of construction (Figure 4).
It may be observed that the construction of reservoirs began with those in the Guadalentín Basin, as it affected the City of Murcia directly. In fact, after the flood of October 1879, the works proposed were concentrated in the Guadalentín Basin and were considered an urgent priority, as stated in the “Project of flood-defence works in the Segura Valley (1886)”, created by Ramón García and Luís Gaztelu, which were subsequently complemented by the works in the Segura Basin. Moreover, the first regulation works began in the headwaters and mid-section of the basin. This part of the Segura Basin was not regulated until the approval of the Segura Basin Flood-Defence Plan (1987).
Table 2 shows the total capacity of reservoir water from 1900 to 2020. Currently, the total capacity of reservoir water in the basin is 1257 hm3. All of these regulation works have influenced the river regimes of the main course of the basin, which is reflected in the flow data (Table 2). Cells painted in yellow represent reservoirs whose capacity has been reduced. Cells coloured green represent reservoirs whose capacity has increased and is related to the reduction of their capacity. Hence, it was decided to enlarge the reservoirs.
The data on total reservoir capacity correspond to the latest update in 2020 by the basin organisation of the Confederación Hidrográfica del Segura.
The reservoirs whose total storage capacity had decreased due to the accumulation of sediment are shown in yellow, while those whose storage capacity had increased due to their regrowth or maintenance tasks are shown in green. Both cases are signs of the sediment transport capacity of the river courses of the Segura Basin, and the retention of sediment in these infrastructures affects the coastal area of the mouth of the Segura River. Of particular note is the sharp reduction in the capacity of the Valdeinfierno reservoir. This is explained by the enormous erosion capacity in this area with poor-quality soils or those that are bare of vegetation.
Calvo García-Tornel [55] indicated that, in a non-regulated regime, the Segura River would display pluvio-nival behaviour, with the presence of permanent waters throughout the whole of its length and a very low presence in dry seasons, although it could even dry up. For the last two decades, the regime of the Segura River has been much more pluvial than nival due to the effects of climate change since snowfalls are becoming rare at its headwaters. Its regulation through the use of reservoirs has led to a constant flow during the whole year, but this means a reduction in the circulating volume and sediment at the mouth.
With respect to the ordinary average flows of the Segura River in the headwater reservoirs, the average for the period of 1959–1980 was 541 hm3, while for the period of 1981–1989, it was 343 hm3 and for the period of 1990–1994, it was 263 hm3 [49]. The reduction in average flows was due to the regulation of the river basin and drought periods that lasted for years, such as during the last period.
Gil Olcina and Canales [56] indicated that, in the historical period of 1930–2003, the input of surface resources at the headwaters of the Segura amounted to 490.27 hm3. The average inputs for the period of 1930–1980 were 573.15 hm3, and for the period of 1981–2003, they were 310.1 hm3. This sharp reduction in flows at the headwaters of the Segura River has been called the “Efecto 80”, whereby there is a sudden fall or rupture with respect to the previous situation [56,57].
In relation to this point, the Confederación Hidrográfica del Segura has a more updated data series included in the Hydrological Plan of the Segura Basin (2022–2027) with a long series from 1940 to 2019–2022, depending on the gauging station. Three gauging stations were chosen for this study along the course of the Segura River (Figure 5).
With respect to the highest section (Cenajo), the annual average flow calculated was 380 hm3 for the period of 1940–2022. Furthermore, the average calculated for the short period of 1940–1980 was 406 hm3 and 353 hm3, respectively. In the mid-section (Ojós), a reduction in the ordinary annual average flows may also be observed (hm3/year) in the historical period of 1940–2019. The average of the historical period of 1940–2019 is 668 hm3/year, and analysing the short period of 1940–1980 and 1981–2019 revealed that the average was 708 and 623 hm3/year, respectively. Finally, in the lower section (Guardamar del Segura), a reduction in the ordinary annual average flows may also be observed (hm3/year) in the historical period of 1940–2019. The average for the historical period of 1940–2019 is 818 hm3/year. Analysing the short periods of 1940–1980 and 1981–2019 revealed an average of 708 and 623 hm3/year, respectively.
These data reveal a considerable reduction in the annual ordinary average flows for the series analysed, as well as a negative trend. The reduction in the Segura River flows throughout the whole of its length has led to a reduction in the sediment transported, reducing the natural processes in the river dynamics and, therefore, reducing the amount of sediment that reaches the river mouth. The consequence of these effects is an increase in the retreat processes of coastal areas, given that the result of the balance between inputs and erosion is negative. Therefore, through the regulation of river basins, the ordinary average flows are not able to transport a sufficient amount of sediment to the coast since they are retained in longitudinal works.
The sediment input is drastically reduced due to the large and extraordinary floods experienced in the basin. The Automatic Hydrological Information System (SAIH) provides data from 1996 to 2023 to provide an approximate idea of the sediment input in relation to the flows recorded. However, until the installation of new gauging stations, much data could not be collected from different points. The flood episodes in which the flows registered at the gauging stations in the Segura Basin can be considered sufficient to transport large volumes of sediment were selected (Table 3). Nevertheless, there are many points where the materials were retained.
It should be pointed out that the real flows of the floods of December 2016 and 2019 of the lowest section of the Segura River were higher than those registered at the gauging stations. Furthermore, the contributions of the flows from the Guadalentín River were also considerable in many of these episodes, although the volumes of the flood water are unknown due to the absence of stations installed by the SAIH—for example, that of September 2012, when the Guadalentín River experienced swelling of 2500 m3/s as it passed through Lorca.
Furthermore, it can be observed that, when the rainfall originates in the Mediterranean, in DANA or cold-drop situations, abundant and intense rains occur in the lower parts of the Segura Basin, where large floods are experienced and where a double behaviour can be seen from the headwaters (04A06) to the beginning of the mid-section in Ojós (02A02) and from this point to Rojales (07R06) and to its mouth in Guardamar del Segura. Finally, it should be noted that, in the episode of September 2019, the data recorded at the gauging station of Orihuela (07A06), with a flow of 111.454 m3/s, are incorrect since the station ceased to function. This means the actual flow was even higher.
In addition to the construction of dams and reservoirs, the works to channel river courses should also be considered. The Segura River has been channelled from Contraparada (Murcia) until its mouth in Guardamar del Segura, a total of 66.50 linear kms. The channel has different sections with walls or reinforced concrete structures that reduce the deposit of sediment on the shores and coastal areas. Furthermore, the design of the channel was based on meander cut-offs of the Segura River, giving rise to a straight-line course along most of its length, eliminating a total of 56 meanders, which is equal to a reduction in the active area of 699,200 m2 and a reduction of 10.376 km in the length of the Segura River [56]. This has also had a negative effect on the natural dynamics of the Segura River and the possibility of the geomorphological processes (erosion–accretion and lateral) in the river course and its implications for the sediment deposits on the coast.
We should not forget that, in the mid and lower sections of the Segura River, there is an irrigation network formed by ditches that collect the excess irrigation water that also influences the sediment inputs at the mouth of the Segura River. This occurs after irrigation, when the excess waters drag sediment from the croplands and incorporate them into the ditches. The ditches move the stagnated waters after irrigation with sediment and transport them in the river along with the materials. An example of this is the enormous sinking problems at the mouth of the old Segura River, where 10 ditches discharge their waters.
We should also take into account other types of anthropogenic action, such as the construction of inverted breakwaters at the mouth of the Segura River which break the dominant coastal drift in this sector or the construction of a yachting harbour inside the course of the Segura River. These projects were executed practically at the same time, which led us to believe that the breakwaters were built to protect the harbour instead of protecting against the easterly storms or facilitating the discharge of floodwaters from the Segura River.

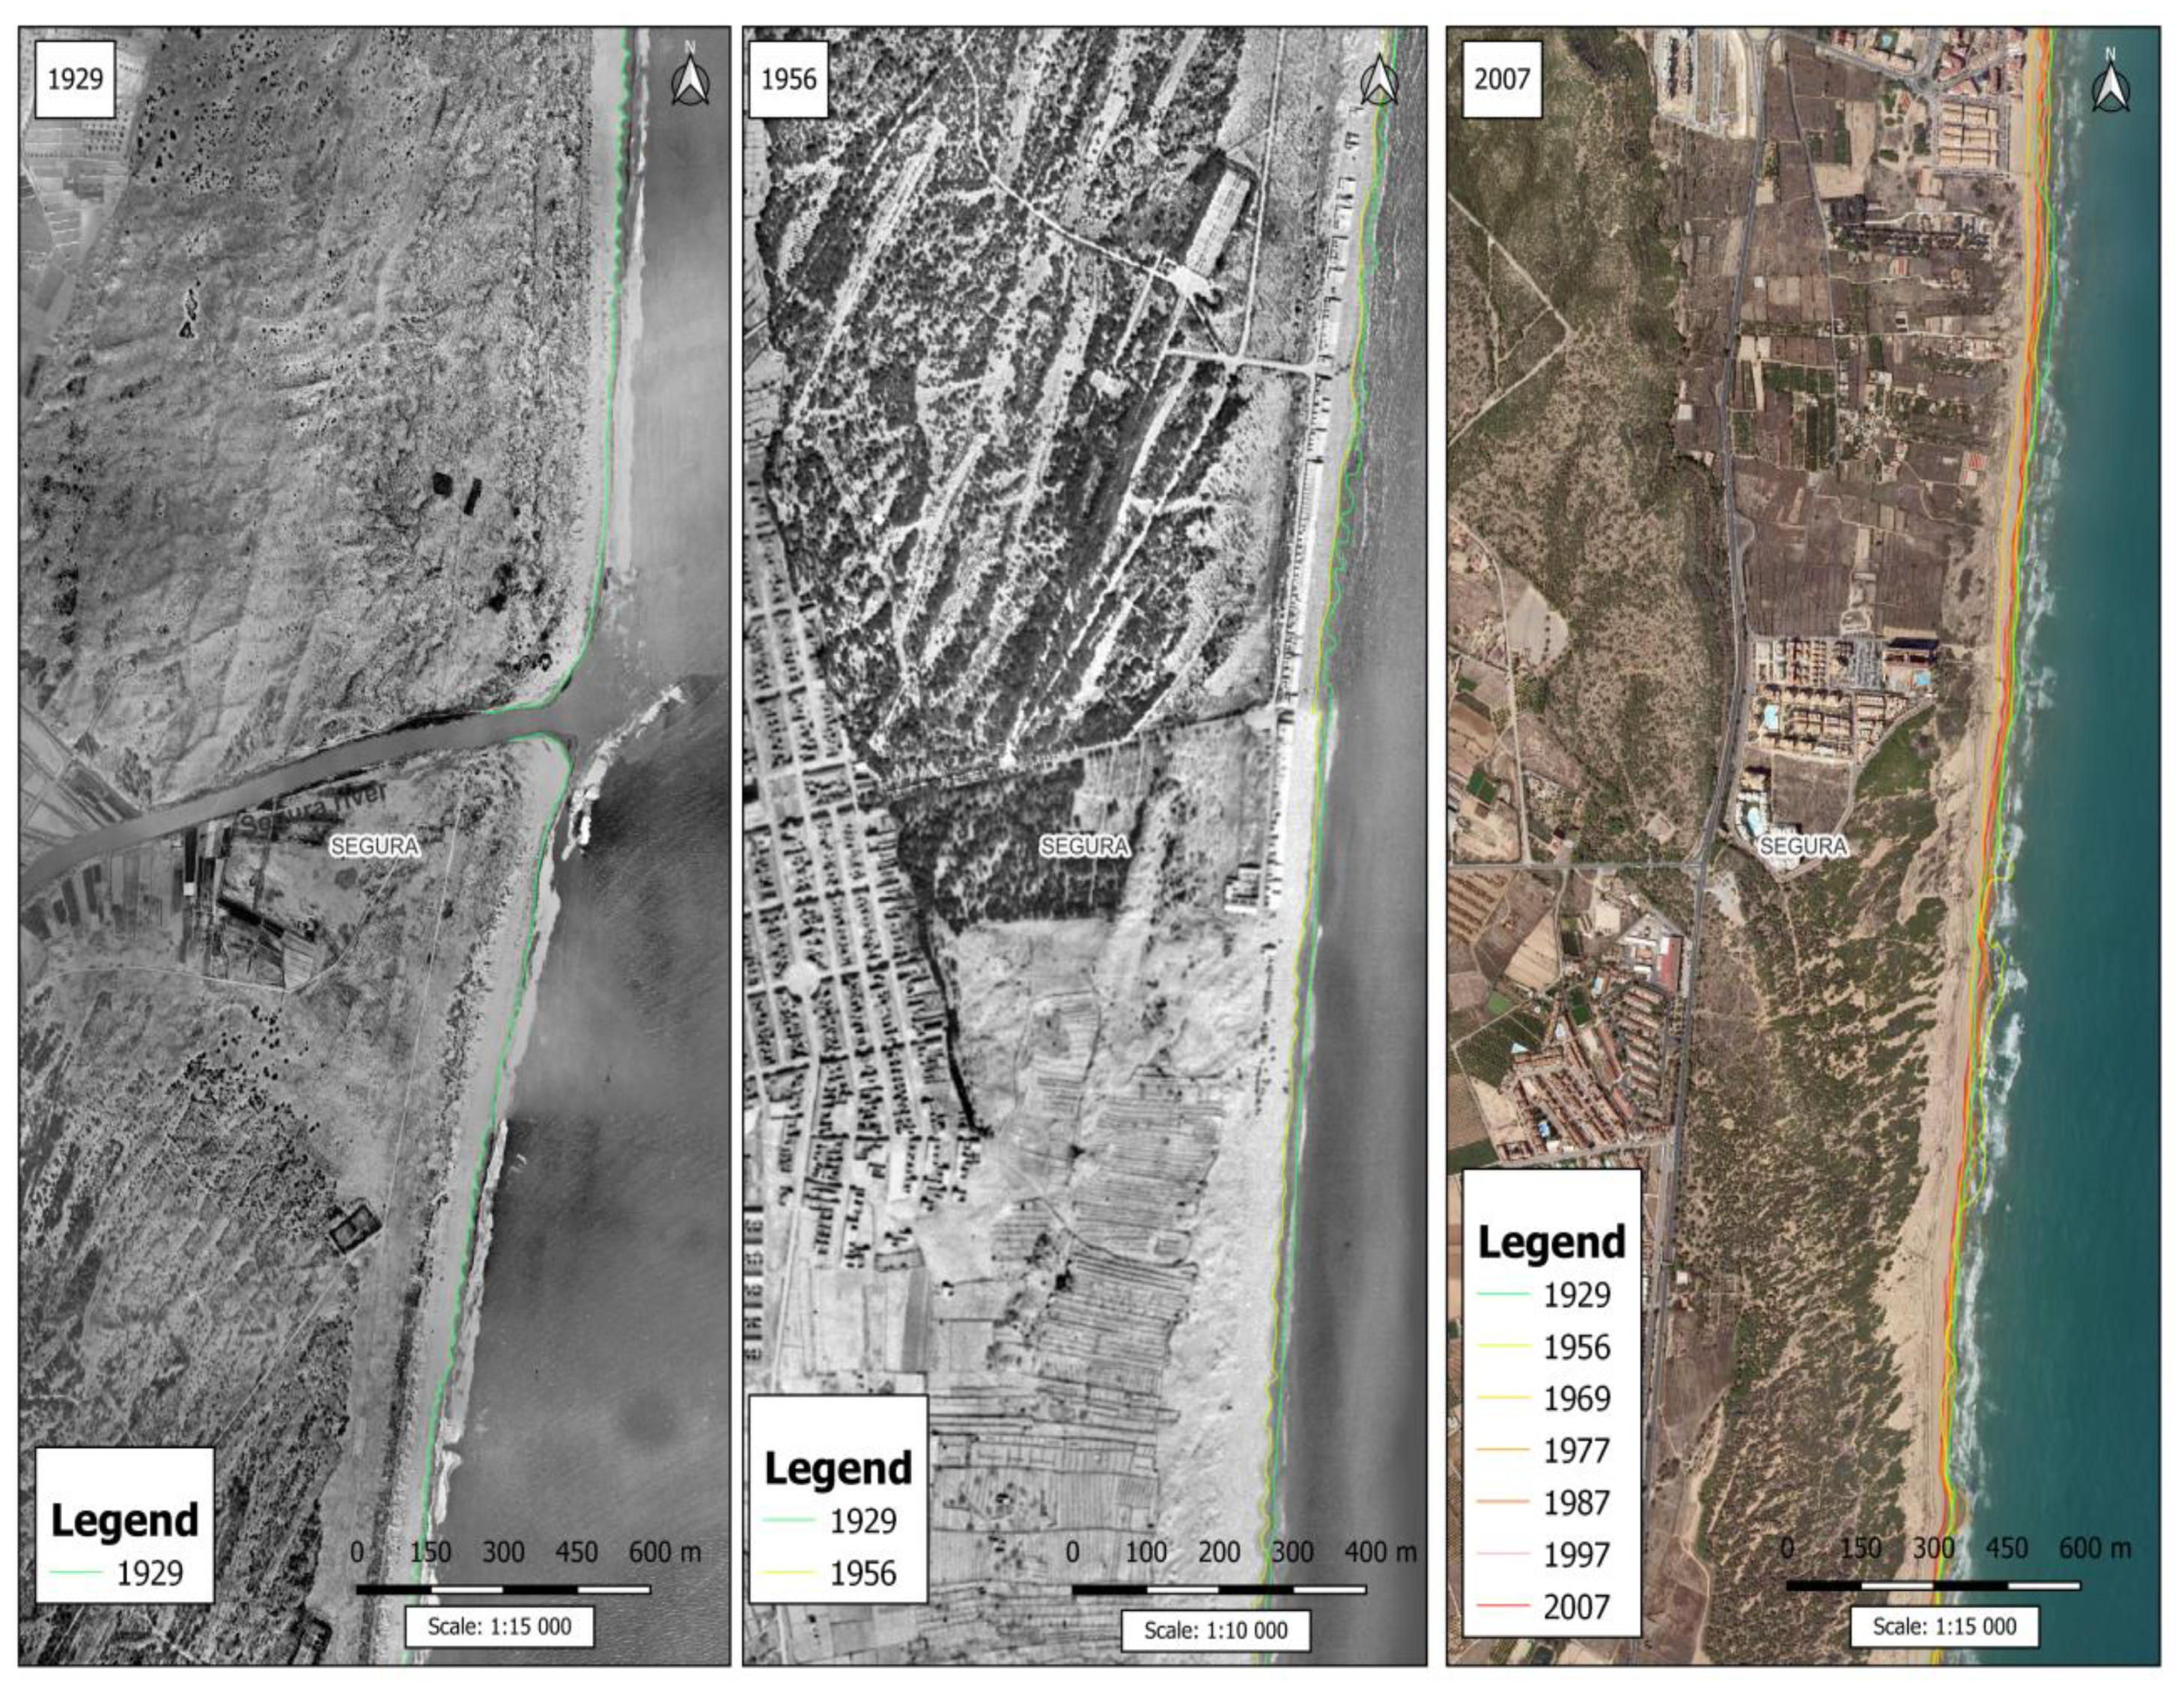
3.2. Evolution of the Coastal Retreat Process in the Coastal Area of Guardamar del Segura as a Result of the Anthropogenic Actions in the Segura Basin and the Coastal Space

Establishing a chronological list of the regulation works in the Segura Basin enabled a comparison to be made with the effects on the coastal area of Guardamar del Segura from the beginning of the twentieth century to the present day (Figure 6).
As we can see in Figure 6, on the coastline to the left (and north) of the mouth of the Segura River, a process of retreat occurred from 1929 to 2022, which has been increasing over time. It should be remembered that the first dams to be constructed in the Segura Basin have already generated significant regression in this sector, which is evident if we study the coastline between 1929 and 1956. Between 1956 and 1969, the loss in the coastal area was considerable due to the construction of the Cenajo hyper-reservoir. Since then, the erosion has been gradual over time. However, since the approval of the Flood Defence Plan of 1987, an intensification of the coastal retreat processes can be observed, resulting from all the dams built to defend against flooding, which were completed in 2002.
The distance between the seashore and the dunes or buildings in the coastal area of Guardamar del Segura was measured (Table 4).
With respect to the data referring to erosion, Fernández-Hernández et al. [49] indicated that, for the coastline south of the mouth of the Segura River in the coastal areas referred to as “Guardamar dunes” in this article, the average erosion rate for the period of 1930–1989 was found to be 1.13 m/year. Regarding the Babilonia Beach sector, they indicated that there was a low level of erosion until 1989 at 8.72 m over 60 years [49]. From that year, with the construction of the current and inverted breakwaters, together with the basin regulation works, the rate of erosion has increased to 12.09 m over the last 25 years (1997–2022), when more than 40% of the erosion took place in less than half of the period, which is concerning [49] (Figure 7). These data correspond to the reduction in sediment due to the regulation works in the basin, the construction of the inverted breakwater, the yachting harbour and the presence of buildings on the beach, together with the alteration in winds due to high-rise buildings being located in the town.
With respect to the evolution of the buildings on Babilonia Beach, in 1930, there was a built area of 8533 m2, composed of a total of 55 houses. This area had increased to 19,463 m2, with 126 houses, by 1977. This figure remained stable until 1999 (Table 5).
Until 2005, the loss of built-up land barely amounted to 131 m2 (1 house), but in the period of 2005–2012, the demolished area increased to 2218 m2 (14 houses), and this process did not end until 2022, with a loss of 1003 m2 (6 houses) despite the contention dyke works constructed in order to protect the homes [49]. In addition to these demolished areas, there are another 425 m2 corresponding to three more homes that were to be demolished in 2023, while another 80 homes are awaiting the ruling of the Constitutional Court (Table 6).
After Storm Gloria in January 2020 and the formation of unprecedented waves and sea storms in the Mediterranean, the sea directly affected many homes on Babilonia Beach located directly on the beach which will be destroyed by waves (Figure 8).
The following figure shows the houses constructed in 1977, the area that these buildings occupied and, in contrast, the houses existing today that cover their total area and the demolished homes to date (Figure 9).
A total of 102 houses occupy an area of 15,686 m2 in the first line of the coast, and they are at risk of destruction due to offshore storms because of their location [38] (Table 7).
In fact, episodes of offshore storms are becoming increasingly frequent in the Mediterranean, affecting the houses built on beaches, such as those on Babilonia Beach (Figure 10).
As shown in Figure 10, from 1980 to 2000, the offshore storm events that affected Babilonia Beach occurred between zero times and twice a year. However, from 2007 to 2023, the frequency of these episodes increased to between one and four episodes a year. All of this is derived from the coastal erosion–regression processes and the increase in sea levels.

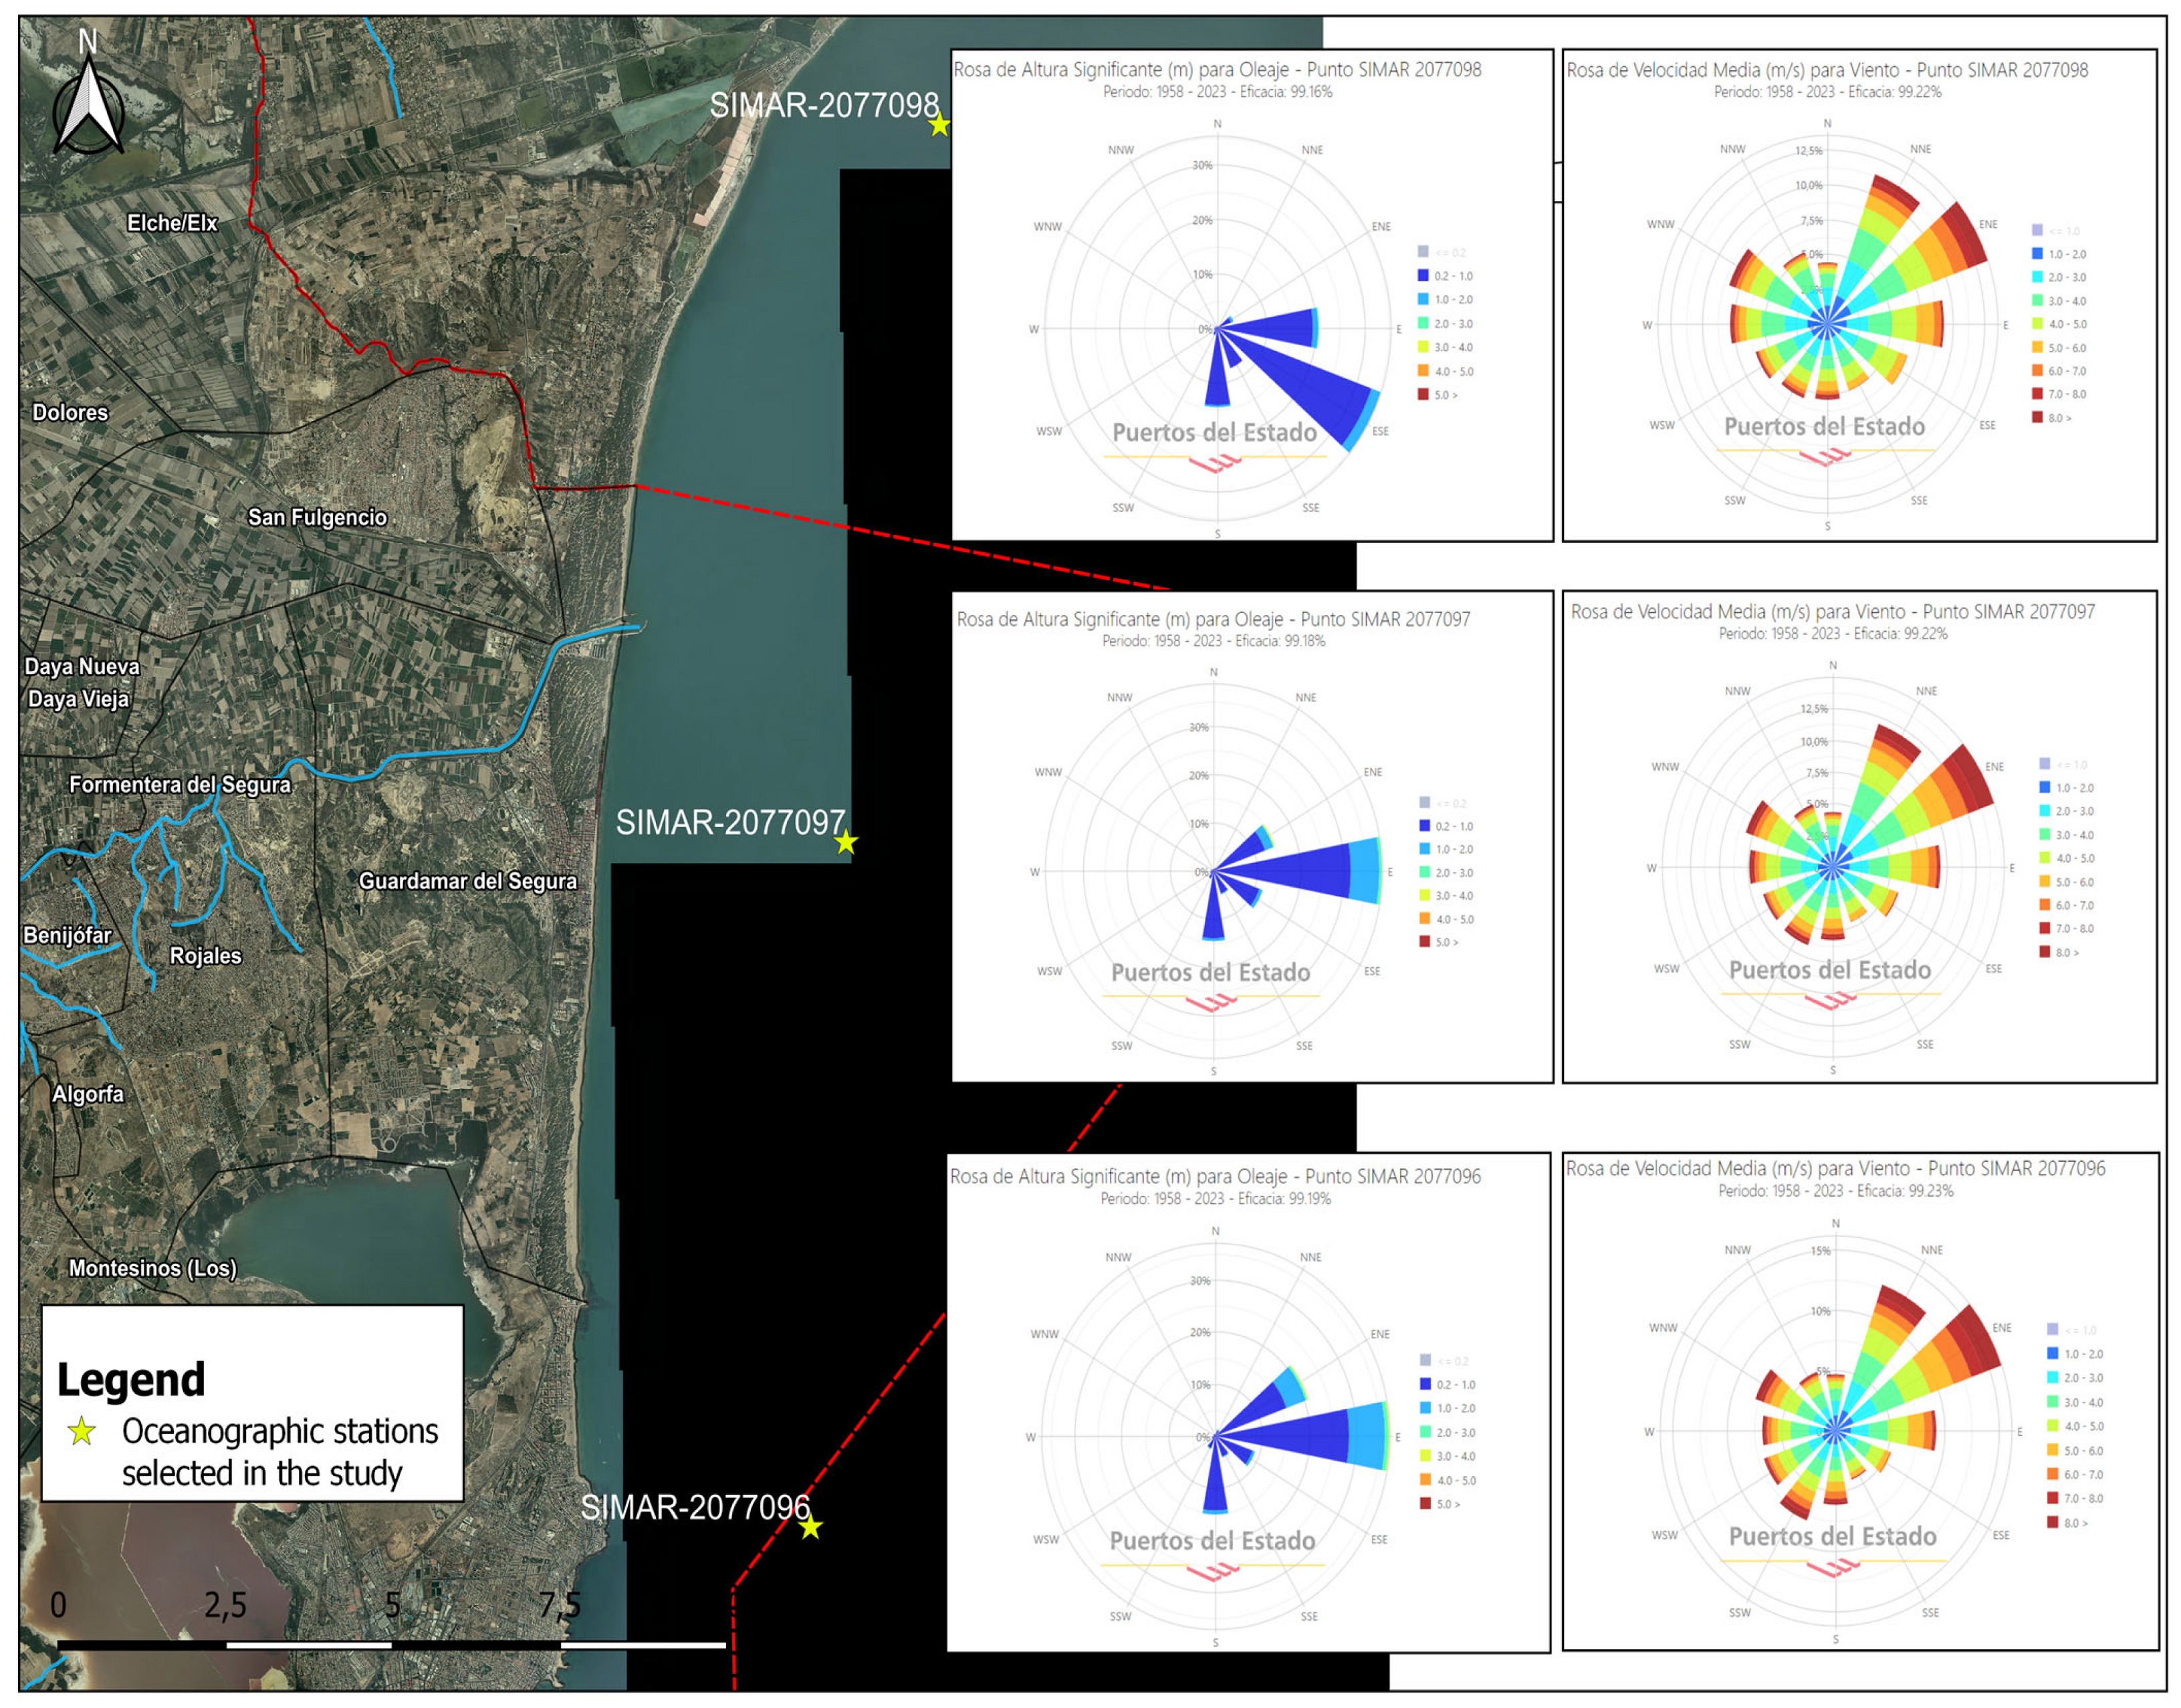
3.3. Dominant Winds, Waves and Marine Currents

The following results were obtained from the oceanographic portal of Puertos del Estado, which is managed by the Ministry of Transport, Mobility and Urban Agenda of the Spanish Government, which is the competent authority in coastal actions.
In order to understand the functioning of the coastal dynamics in the area of study, certain specific points should be analysed. Cape Santa Pola and the Island of Tabarca act as walls or screens, changing the direction of the N–S flow to E–W. When they reach the coast, the marine currents acquire an N–S direction from Santa Pola to Guardamar del Segura. The sectors closest to the coast maintain this direction, and some that are more offshore experience a change in direction to W–E and join the SW–NE current (red) (Figure 11).
Although the functioning of the marine currents may or may not be related to the surface waves, it should be noted that the direction of these currents also influences the distribution of sediment. Therefore, an N–S direction was confirmed for the area of study, as indicated by Fernández-Hernández et al. [49].
The data series for the period of 1958–2023 were extracted from three stations located in the sea that measure the winds and dominant sea swells and the direction they come from (Figure 12).
Figure 12 shows the results of three marine stations close to the coast, from north to south: SIMAR 2077098—Santa Pola, SIMAR 2077097—Guardamar del Segura and SIMAR 2077096—Torrevieja. As we can observe, the fastest winds belong to the first and second quadrants, that is, winds from the ENE, NNE and E (warm colours) for the time series of 1958–2023. This means that, in situations of intense winds, their origin is from these quadrants, so the maritime storms occurring in the area will have this location.
The graphs with cool colours show that, for the series of 1958–2023, the predominant direction of the swells differed with respect to the speed and direction of the winds. The Santa Pola station (SIMAR 2077098) observed that the predominant wind is from the SSE, followed by the E, corresponding to the third quadrant of the sea swell. This disposition explains the erosion of the dune ridge of Guardamar del Segura, to the north of the mouth of the Segura River, as the materials are deposited on the west of the port of Santa Pola. At the Guardamar del Segura station (SIMAR 2077097), located to the south of the mouth of the Segura River, close to the Municipality of Guardamar del Segura, the predominant sea swell originates in the second quadrant or E direction, followed by ENE. And in the station closest to Torrevieja, the majority of the sea swell proceeds from the E, followed by the ENE, corresponding to the third quadrant. According to these three stations, winds from the south occur very rarely.
This shows that the sediment deposits on the coastal areas are related to sea swells from the E, with a coastal drift in an N–S direction. However, the lack of sediment deposits from the Segura Basin as a result of its regulation has fostered the retreat processes of the sector, given that the natural distribution of the coastal drift does not have materials to distribute, which explains the evolutionary erosion of the coast of Guardamar del Segura. Furthermore, the storm events, which naturally enhance the coastal erosion–regression process, are derived from the winds from the ENE and E. This behaviour of the coastal area of study demonstrates the role of the lack of sediment inputs.

4. Discussion

This study constitutes an initial approach to analysing the retreat processes in coastal spaces as a consequence of the regulation of river basins, specifically the retreat experienced in the dune ridge of Guardamar del Segura due to the regulation of the Segura River Basin in the period of 1929–2023. A chronological list was created that evidences the processes experienced and that was based on annual average flow data since 1940. Moreover, the potential dragging and transport of sediment in situations of extraordinary flooding were identified based on the highest flows recorded in the Segura River between 1994 and 2023.
This study could be expanded in future research through the use of instruments and techniques that enable the transport of sediment with average, high and extraordinary flows to be measured, for example, with the Helley–Smith method [58,59], which could be applied to different bridges along the length of the Segura River. In this way, data referring to the transport of sediment from point A to point B could be estimated, for example, from the Fuensanta reservoir to the Cenajo reservoir. This would reveal the quantity and size of the sediment that is stored in the reservoirs and the amount that continues to circulate [60,61]. Trackers could also be installed in elements such as gravel to determine their displacement in different future hydrological events [62,63,64,65]. Therefore, the study could be expanded with another series of data if sufficient means were available.
With respect to the regulation of the river basins, many studies have indicated that the construction of dams and reservoirs drastically reduces the circulating flow and the sediment transported [9,11,14,59]. It is necessary to generate extraordinary swellings for an adequate transport of sediment to the mouth of a river so that coastal drift can subsequently distribute the sediment in accordance with its direction [10].
These retreat problems in coastal areas are occurring in different river courses throughout Spain, for example in the lower Ebro [66,67,68] and in its delta [11,69] or the Llobregat River [17]. In response to this problem, many recent cases of dam demolitions have favoured the recovery of river systems and the transport of sediment. In Spain, until 2022, a total of 618 dams and transversal objects had been demolished. This currently constitutes the principal action of river recovery [70]. The conclusion obtained by some authors is that, in a few months with high flows, rapid movements of sediment can occur in the downstream river courses, and if there is a considerable swelling of the river, geomorphological changes are generated, causing noteworthy sediment dragging, leading to the total recovery of the river section affected by the former structure and revealing an adequate transport of sediment to lower courses and river mouths [40,43].
Local anthropogenic actions have also influenced the coastal retreat processes on the dune ridge of Guardamar del Segura, particularly the construction of housing on the beach and breakwaters at the mouth of the Segura River.
As shown in the results section, the beaches of Guardamar del Segura have been experiencing a retreat process since the beginning of the twentieth century as a result of the regulation of the river basin and the breakwaters on the mouth of the Segura River. This has accelerated the erosion process of Babilonia Beach, and since 2007, many homes on the beach have been suffering damage from the waves due to offshore storms. Moreover, the increase in sea levels due to the effects of climate change has led to the recording of higher waves. For example, in the case of January 2020 with Storm Gloria, waves of almost 7 m were recorded [71]. In addition, it is estimated that the increase in sea level generates a landwards penetration of 200 m during offshore storms [34,35].
The houses built on Babilonia Beach are owned by the state, which grants temporary concessions to the usufructuaries who may live in housing located in the maritime–terrestrial public domain (DPMT) that is due to be demolished. In fact, the majority of the existing homes were badly damaged by Storm Gloria, and they represent a high risk to the physical safety of people in flood events due to a sea storm [38].
The presence of these houses in the DPMT has also influenced the retreat process since they provoke a rupture in the natural dynamics of the dune ridge of Guardamar del Segura. They constitute a negative aspect for which the only solution is their demolition. There are examples of houses that have been removed from the coastal areas in the DPMT, and after their demolition, the coastal space has been partially recovered, and the existing dunes have even expanded. In Vizcaya, the Goriz dune system has been recovered through nature-based solutions, the demolition of buildings and the modification of several types of infrastructure on the beach. This has enabled the recovery of a space that had been suffering from retreat processes and has increased the length of the beach [71]. In addition, actions have been carried out to apply nature-based solutions in the deltas of the Danube, Mississippi, Atchafalaya and the Yellow rivers [14]. On the Mississippi River, a mixed solution action programme of engineering and bioengineering works and nature-based solutions has been implemented in response to the storms and hurricanes after Hurricane Katrina in 2005. The application of these measures has enabled the protection of these spaces against less severe storms and hurricanes. Furthermore, nature-based solutions have a greater effect in protecting human lives and reducing economic costs than structural works [8].
The design and current location of the existing breakwaters in the mouth of the Segura River were not included in the 1987 flood-defence plan, given that the proposals in this plan consisted of the channelling of the river through a single course and with an outlet to the Mediterranean Sea free of obstacles or in maintaining the previously constructed breakwaters. This led us to believe that these breakwaters at the mouth of the Segura River were constructed for other reasons.
Before the flood of November 1987, aerial photographs were taken of the south of Alicante at a scale of 1:25,000 in which a breakwater on the mouth of the Segura River can be seen according to the natural coastal drift in the Province of Alicante (N-S), causing the lengthening of the beach on the left side of the Segura River and also favouring the input of sediment in situations of large floods in the mouth whose natural dynamics could distribute the materials along the beach of Guardamar del Segura.
However, the Directorate General of Ports and Coasts commissioned several organisations to conduct technical studies (1984 and 1987) prior to the flood of November 1987. With these studies, the CEDEX (Centre of the Centre for Public Works Studies and Experimentation) presented a single and final report, “Estudio del abrigo de la desembocadura del río Segura (Alicante)”, published in February 1988. This study justified the location of the current breakwaters based on the fact that the coastal drift of this sector is S–N and the dominant winds come from the SE and E, which generates the accumulation of sediment at the mouth of the Segura River. They also indicated that the offshore storms have this dominant direction; therefore, an inverted breakwater to reduce the effects of the SE (85% protection) and E (40% protection) storms was proposed.
Such reports were based on the comparison of historical time series maps and bathymetric charts of coastal areas to assess changes in sand volume and lower sand movement directions over the past century [72].
The study conducted by CEDEX and the data presented are incorrect for the following reasons:
  • They use data from the gauging station closest to Santa Pola, applying them to the mouth of the Segura River. As shown in the results section, the sea swell in the vicinity of Santa Pola is SSE, while in the area between and the mouth of the Segura River and Torrevieja, there is a predominantly ENE and E swell. Therefore, the placement of the breakwater should cover the SSE waves, which is incorrect.
  • The data used for the sea swell are based on 1751 observations. If each individual figure is understood as a day, it represents a time period of almost five years, which is insufficient for decision-making. In the results section of the current study, long series were used from 1953 to 2023, which reveal the real behaviour of the waves.
  • They consider the coastal drift to have an S–N direction, as it accumulates a greater volume of sediment towards the north. However, this interpretation of the data is incorrect, given that the greatest volume of sediment is found in the vicinity of the mouth of the Segura River, on its southern bank, and the further we move in this direction, the more we can observe a gradually greater reduction in the amount of materials. This justifies the distribution of materials via an N–S coastal drift from the mouth of the river to Torrevieja, which is the furthest point and is, therefore, where there is less sediment. Meanwhile, the materials deposited on the northern bank of the Segura River from S to N increase, but this is due to the waves from the SSE, as observed in the results section. Recent studies have shown that the dominant direction of the sea swell is NE, favouring the N–S coastal drift [49,71]. In fact, if the coastal drift were S–N, as indicated by CEDEX, after the construction of the breakwater, the beaches of Guardamar del Segura would have grown after more than 25 years in operation and would not have experienced a retreat process, which was shown in the results section of the current study with the evolution of the coastline from 1929 to 2023.
  • The final justification of the CEDEX study is that the placement of the breakwaters prevents the accumulation of materials in the mouth of the Segura River. This aspect has not been resolved, given that the sediment accumulates inside the breakwaters as its discharge from the river waters is hindered by the presence of the inverted breakwater, acting as a dam. This means that dredging actions have to be undertaken in the yachting harbour and the new and old courses of the Segura River. This situation also increases the difficulty of the flood waters of the Segura River in discharging, exponentially heightening the flood risk.
  • To all of this we should add a further problem: Between 1996 and 1999, the Guardamar yachting harbour was built inside the course of the Segura River in a former area of salt marshes. In order to construct it, 200,000 m3 of slurry was extracted and immediately deposited in the dune system, causing severe environmental damage and further aggravating the natural dynamics of the dune system [30,49,72]. The dumping of these slurries was halted by the Prosecutor’s Office for Environmental Crimes of the Provincial Court of Alicante [30,72]. Between 2002 and 2011, attempts were made to eliminate the anthropogenic materials that had been dumped [49].
  • The final result of all of these actions is the following negative effects: On the one hand is the channelling of the Segura River by way of the construction of an artificial canal that breaks the dynamics of the dune system of Guardamar del Segura in relation to its northern and southern coast. On the other hand are the long-existing and inverted breakwaters that break the dominant coastal drift (NE–SW), which enable the distribution of sediment in the coastal areas, favouring beach accretion processes in the coastal sector. This justifies the erosion–regression that exists in the area of study, particularly on the right bank of the mouth of the Segura River [30].
Currently, in flood situations, the sediment transported via the Segura River is lost in the sea, and the coastal drive cannot carry out its distribution function through the waves due to the presence of these breakwaters. Furthermore, the division of the Segura River between the old and new courses has not resolved the problem of sediment accumulation at the mouth and has led to the rupture of the dune system of Guardamar del Segura.
At this point, it is worth highlighting a similar example of the problem presented by the Segura River. This example is located in the United States, in the County of York (Pennsylvania) at Saco Bay, at the mouth of the River Saco.
Previous studies and reports indicated that the formation of sand in the bay came from glaciers, rather than from the Saco River. Also, the US Corps of Engineers considered the movement of sediment to have occurred in a north–south direction, so a breakwater of more than 2000 m in length was designed to trap sediment in the breakwater and encourage the accumulation of sand.
However, recent studies have shown the opposite [73]. Taking into account historical data and other sensor data, measurements and bathymetric maps, it has been possible to establish an S–N sediment direction [73]. Thus, the study carried out by an official body was proven erroneous. The consequences have been similar: the retreat of the coastline and the effect of extreme storms on the houses on the beach.
Finally, the proposals to attempt to reduce or mitigate the effects of coastal regression in the sector of Guardamar del Segura are as follows:
  • To increase the ecological flows with geomorphological patterns, enabling an increase in the transport of sediment from the river to its mouth. This action is, in any event, complicated within the context of climate change and the reduction of flows already recorded in the Segura River.
  • To eliminate some of the control dams in order to enable the input of sediment in the mid and lower sections of the Segura River. This action would require an economic feasibility study in order to evaluate the pros and cons in terms of the impact that it would have on the territory in the event of torrential rains and the flooding of the affected river courses.
  • To recover and restore the Segura River, eliminating the retaining walls built after the flood of November 1987 and the development, in the following years of the Segura Basin Flood-Defence Plan.
  • To completely eliminate the channelling of the old and new courses of the Segura River in its final stage in the Municipality of Guardamar del Segura and to eliminate the wall separating the old and new courses.
  • To completely remove the breakwaters at the mouth of the Segura River or construct a breakwater placed to protect from ENE and E storms, such as the one occurring in 1987 before the flood.
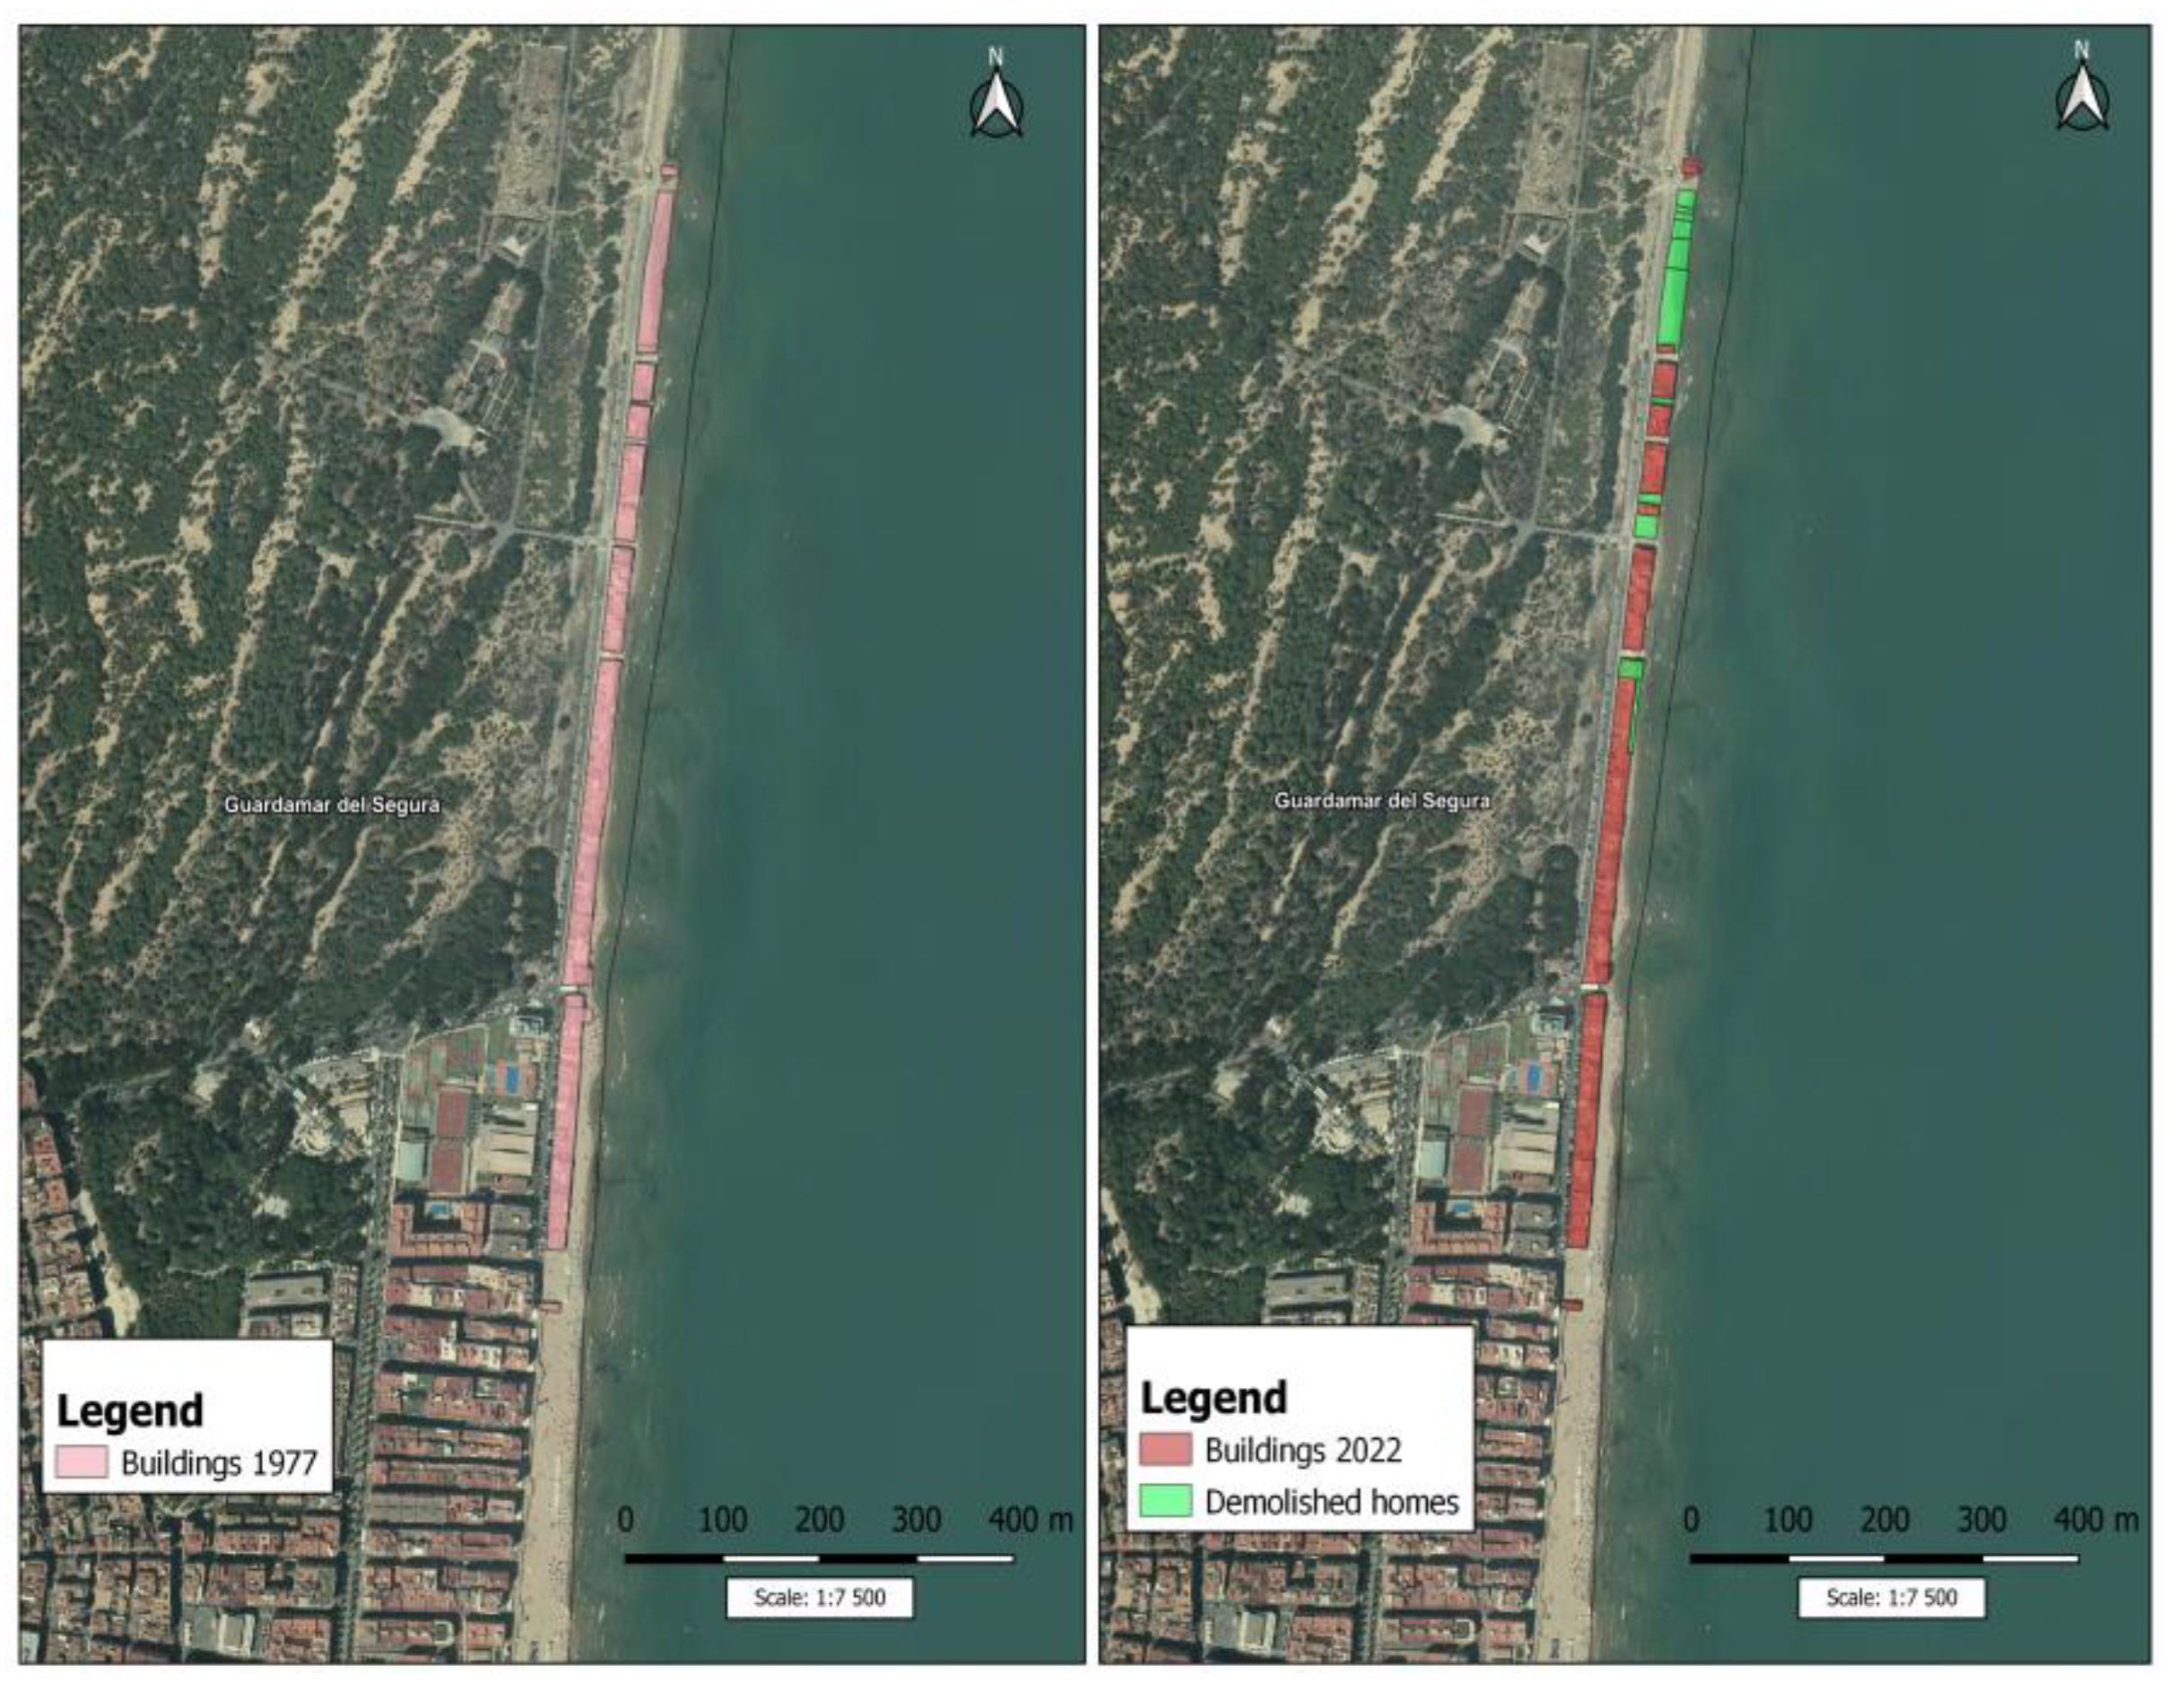
  • In agreement with the concessionaires, to demolish the houses on Babilonia Beach and apply bioengineering techniques or nature-based solutions to protect the coast from offshore storms and to favour a greater accumulation of sediment and the recovery of the dune system. This is a controversial measure due to the assumption of the “ownership” rights among the concessionaires of the occupation of the maritime–terrestrial public domain, hence the need for the central and local administrations to reach agreements with the concessionaires to offer them land further inland in the municipality, where they can build new houses under feasible financial conditions. In the worst-case scenario, if an agreement is not reached between the administration and the concessionaires, the Climate Change Law (2021) (Art. 20) would open the door for the withdrawal of concessionary rights, in compliance with the Coast Law of 1988 and the non-renewal of them in cases where the effects of climate change on the territories’ object of administrative concession are evident. This aspect was ratified in the modification of the Coastal Regulation of 2020 (RD 668/2022) [74].
These proposals can be completed with actions derived from a study of the measurement of the sediment transported in average, high, ordinary and extraordinary flows.

5. Conclusions

The present investigation has demonstrated the direct relationship between the large regulation works in the Segura Basin (from the headwaters to its mouth) and the coastal retreat that the sand dunes in the Town of Guardamar del Segura are experiencing. This fact has been demonstrated on maps where the evolution of the coastline is represented from 1929 to 2023. Likewise, it was demonstrated with the results that the historical wave and wind data show a dominant direction typical of the Spanish Mediterranean coast. The predominant winds come from the NE, and the waves from the E. This favours the behaviour of the coastal drift from Santa Pola to Torrevieja, including Guardamar del Segura, the coastal drift being N–S. This coastal drift is interrupted by the presence of the breakwaters at the mouth of the Segura River. All of these factors have caused a sand accumulation beach to reverse its process towards beach erosion. This fact has led to the beach’s eroding until it reaches the homes on Babilonia Beach, where sea storms associated with extreme weather phenomena cause the sea to hit the homes, putting human lives at risk and generating serious material damage to the homes. The only way to provide sediment to reduce beach erosion currently is via large river floods, bioengineering techniques or nature-based solutions to promote the accumulation of sand.
This work is important because it shows the previously mentioned relationship and discusses the results obtained in an official study by CEDEX (the Center for Studies and Experimentation of Public Works), managed by the Ministry of Transport and Sustainable Mobility of the Government of Spain, which designed the provision to reverse the breakwaters at the mouth of the Segura River without taking into account scientific criteria or a database of a period of 30 years, as well as the misinterpretation of the results obtained from the CEDEX study.
The results and arguments presented in the current study are intended to promote a rethinking of the problem of the lack of sedimentary contributions from the Segura River to the coastal areas, the reimagining of the design for the reverse breakwaters at the mouth of the Segura River and the search for solutions that allow for the alleviation of coastal retreat processes.
The severity of the problem that exists in the coastal area of the study requires decisive actions which break from the current reality. This would mean the demolition of the infrastructure that is harming or destroying the natural dynamics of coastal drift and the sediment inputs in the river basins. Nevertheless, a detailed assessment of the economic costs would have to be conducted in order to analyse the pros and cons of these measures for the socioeconomic development of the area of study. Currently, technical actions based on nature-based solutions or bioengineering exist that could help mitigate the effects of erosion or protect coastal areas from offshore storms. In any event, the vacating of the properties on the dune ridge is a first necessary step for the gradual regeneration, though slow, of this section of the Mediterranean coast at the mouth of the Segura River.

Author Contributions

Conceptualisation, A.O. (Antonio Oliva), J.O. and A.O. (Alfredo Ollero); methodology, A.O. (Antonio Oliva); software, A.O. (Antonio Oliva); validation, J.O. and A.O. (Alfredo Ollero); formal analysis, A.O. (Antonio Oliva), J.O. and A.O. (Alfredo Ollero); investigation, A.O. (Antonio Oliva), J.O. and A.O. (Alfredo Ollero); resources, A.O. (Antonio Oliva), J.O. and A.O. (Alfredo Ollero); data curation, J.O. and A.O. (Alfredo Ollero); writing—original draft preparation, A.O. (Antonio Oliva), J.O. and A.O. (Alfredo Ollero); writing—review and editing, A.O. (Antonio Oliva), J.O. and A.O. (Alfredo Ollero); supervision, J.O. and A.O. (Alfredo Ollero). All authors have read and agreed to the published version of the manuscript.

Funding

This research received no external funding.

Institutional Review Board Statement

Not applicable.

Informed Consent Statement

Not applicable.

Data Availability Statement

Publicly available datasets were analyzed in this study. This data can be found here: https://www.chsegura.es/es/index.html and https://www.puertos.es/es-es/oceanografia/Paginas/portus.aspx (accessed on 20 November 2023).

Conflicts of Interest

The authors declare no conflicts of interest.

References

  1. Pilkey, O.P.; Dixon, K. The Shore and the Corps; Island Press: Washington, DC, USA, 1996; pp. 1–272. [Google Scholar]
  2. Kopp, R.E.; Horton, R.M.; Little, C.M.; Mitrovica, J.X.; Oppenheimer, M.; Rasmussen, D.D.; Strauss, B.H.; Tebaldi, C. Probabilistic 21st and 22nd century sea-level projections at a global network of tide-gauge sites. Earth’s Future 2014, 2, 383–406. [Google Scholar] [CrossRef]
  3. Watson, C.S.; White, N.J.; Church, J.A.; King, M.A.; Burgette, R.J.; Legresy, B. Unabated global mean sea-level rise over the satellite altimeter era. Nat. Clim. Change 2015, 5, 565–568. [Google Scholar] [CrossRef]
  4. Join Research Center (JRC). PESETA III–Task 8. Coastal Impacts. Available online: https://joint-research-centre.ec.europa.eu/peseta-projects/peseta-iii_en (accessed on 20 November 2023).
  5. Intergovernmental Panel on Climate Change. Special Report on the Ocean and Cryosphere in a Changing Climate (Full Report). Available online: https://www.ipcc.ch/srocc/ (accessed on 20 November 2023).
  6. IPCC. AR6 Climate Change 2021–2022: The Physical Science Basis, Impacts, Adaptation and Vulnerability. Mitigation of Climate Change (Full Report). Available online: https://www.ipcc.ch/reports/ (accessed on 20 November 2023).
  7. Minunno, R.; Anderson, N.; Morrison, G.M. A systematic literature review considering the implementation of planetary geoengineering techniques for the mitigation of sea-level rise. Earth-Sci. Rev. 2023, 241, 104431. [Google Scholar] [CrossRef]
  8. JRC. PESETA IV–Task 6. Adopting to Rising Coastal Flood Risk in the EU under Climate Change; Publicaciones Office of the European Union: Luxemburg, 2020. [Google Scholar] [CrossRef]
  9. Wang, H.; Wu, X.; Bi, N.; Li, S.; Yuan, P.; Wang, A.; Syvitski, J.P.M.; Saito, Y.; Yang, Z.; Liu, S.; et al. Impacts of the dam-oriented water-sediment regulation scheme on the lower reaches and delta of the Yellow river (Huanghe): A review. Glob. Planet. Change 2017, 157, 93–113. [Google Scholar] [CrossRef]
  10. Batalla, R.J.; Vericat, D.; Farguel, J.; Úbeda, X.; Garcia, C. Processsos hidrològics I geomorfològics als rius: Context i exemples per a interpreter la seva resposta a episodis d’alta magnitude como el Glòria. Treb. Soc. Catalana Geogr. 2020, 89, 55–87. [Google Scholar] [CrossRef]
  11. Blay, J.; Ávila, A. Els efectes del temporal Glòria: Una mostra de la necessitate d’actuació urgent al delta de l’Ebre. Treb. Soc. Catalana Geogr. 2020, 163–189. [Google Scholar] [CrossRef]
  12. Nilsson, C.; Reidy, C.A.; Dynesius, M.; Revenga, C. Fragmentation and flow regulation of the world’s large river system. Science 2005, 308, 405–408. [Google Scholar] [CrossRef] [PubMed]
  13. Vörösmarty, C.; Meybeck, M.; Fekete, B.; Sharma, K.; Green, P.; Syvitski, J.P.M. Anthropogenic sediment retention: Major global impact from registered river impoundments. Glob. Anb Planet. Change 2003, 39, 169–190. [Google Scholar] [CrossRef]
  14. Giosan, L.; Constantinescu, S.; Syvitski, J.; Day, J.W. Climate Change: Protect the world’s deltas. Nature 2014, 516, 31–33. [Google Scholar] [CrossRef] [PubMed]
  15. Ibisate González de Matauco, A. Variación del riesgo de inundaciones en el río Zadorra (País Vasco) como consecuencia de su regulación. Investig. Geográficas 2005, 36, 119–133. [Google Scholar] [CrossRef]
  16. García Ruiz, J.M.; Lana-Renault, N.; Beguería, S.; Lasanta, T.; Regüés, D.; Nadal, E.; Serrano, P.; López Moreno, J.I.; Alvera, B.; Martí Bono, C.; et al. From plot to regional scales: Interactions of slope and catchment hydrological and geomorphic processes in the Spanish Pyrenees. Geomorphology 2011, 120, 248–257. [Google Scholar] [CrossRef]
  17. He, A.; Huang, J.; Sun, Z.; Zhou, J.; Yang, C. Spatial and Temporal evolution characteristics of the Salween river delta from 1973 to 2021. Remote Sens. 2023, 15, 1467. [Google Scholar] [CrossRef]
  18. Prats-Puntí, A.; Martín Vide, J.P.; Ferrer-Boix, C. Regressió del Delta del Llobregat. Efecte de les Obres d’Enginyeria al Riu d’Ençà del Segle XIX; Cuadernos de Geografía de la Universitat de Valencia: Valencia, Spain, 2021; p. 107. [Google Scholar]
  19. García Ruiz, J.M.; López Moreno, J.I.; Lasanta, T.; Vicente, S.M.; González Sampériz, P.; Valero, B.L.; Sanjuán, Y.; Beguería, S.; Nadal, E.; Lana-Renault, N.; et al. Los efectos geoecológicos del cambio global en el Pirineo central español: Una revisión a distintas escalas espaciales y temporales. Pirineos. Rev. Ecol. Montaña 2015, 170, 1–20. [Google Scholar] [CrossRef]
  20. Conesa, C. Cambio ambiental y equilibrio dinámico de los cauces. Papeles Geogr. 1999, 30, 31–46. [Google Scholar]
  21. Ollero, A.; Ibisate, A.; Granado, D.; Real de Asua, R. Channel responses to global change and local impacts: Perspectives and tools for floodplain management (Ebro River and tributaries, NE Spain). In Geomorphic Approaches to Integrated Floodplain Management of Lowland Fluvial Systems in North America and Europe; Hudson, P.F., Middelkoop, H., Eds.; Springer: New York, NY, USA, 2015; pp. 27–52. [Google Scholar]
  22. Vázquez-Tarrío, D.; Ruiz-Villanueva, V.; Garrote, J.; Benito, G.; Calle, M.; Lucía, A.; Díez-Herrero, A. Effects of sediment transport on flood hazards: Lessons learned and remaining challenges. Geomorfology 2023, 446, 108976. [Google Scholar] [CrossRef]
  23. Gallegos, A.; Perles, M.J. Relaciones entre los cambios en los usos del suelo y el incremento de los riesgos de inundabilidad y erosión: Análisis diacrónico en la provincia de Málaga (1957–2007). Bol. Asoc. Geógr. Esp. 2019, 81, 1–38. [Google Scholar] [CrossRef]
  24. Ollero, A.; Ibisate, A.; Acín, V.; Ballarín, D.; Granado, D.; Horacio, J.; Mora, D.; Nadal, E.; Sánchez Fabre, M.; Sebastián, M.; et al. Dynamique fluviale, changement global et pression anthropique dans le bassin, le cours et le delta de l’Èbre. Sud-Ouest Eur. 2017, 44, 41–54. [Google Scholar] [CrossRef]
  25. Kondolf, G.M. Hungry water: Effects of dams and gravel mining on river channels. Environ. Manag. 1997, 21, 533–551. [Google Scholar] [CrossRef] [PubMed]
  26. Surian, N. y Rinaldi, M. Morphological response to river engineering and management in alluvial channels in Italy. Geomorphology 2003, 50, 307–326. [Google Scholar] [CrossRef]
  27. Martín Vide, J.P.; Ferrer-Boix, C.; Ollero, A. Incision due to gravel mining: Modeling a case study from the Gállego River, Spain. Geomorphology 2010, 117, 261–271. [Google Scholar] [CrossRef]
  28. Ferrer-Boix, C.; Scorpio, V.; Martín Vide, J.P.; Núñez, F.; Mora, D. Massive incision and outcropping of bedrock in a former braided river attributed to mining and training. Geomorphology 2023, 436, 108774. [Google Scholar] [CrossRef]
  29. Daramola, S.; Li, H.; Omonigbehin, O.; Faruwa, A.; Gong, Z. Recent retreat and flood dominant areas along the muddy Mahin coastline of Ilaje, Nigeria. Reg. Stud. Mar. Sci. 2022, 52, 102272. [Google Scholar] [CrossRef]
  30. Matarredona Coll, E.; Marco Molina, J.A.; Prieto Cerdán, A. La configuración física del litoral sur alicantino. Geografía Física y Medio Ambiente. Guía Campo XXI J. Geogr. Física 2006, 1, 35–47. [Google Scholar]
  31. Doyle, T.B.; Short, A.D.; Ruggiero, P.; Woodroffe, C.D. Interdecadal foredune changes along the southeast Australian coastline: 1942–2014. J. Mar. Sci. Eng. 2019, 7, 177. [Google Scholar] [CrossRef]
  32. Sanjosé Blasco, J.J.; Serrano-Cañadas, E.; Sánchez-Fernández, M.; Gómez-Lende, M.; Redweik, P. Application of multiple geomatic techniques for coastline retreat analysis: The case of Gerra Beach (Cantabrian Coast, Spain). Remote Sens. 2020, 12, 3669. [Google Scholar] [CrossRef]
  33. Sui, L.; Wang, J.; Yang, X.; Wang, Z. Spatial-Temporal characteristics of Coastline Changes in Indonesia from 1990 to 2018. Sustainability 2020, 12, 3242. [Google Scholar] [CrossRef]
  34. Ministerio de Medio Ambiente (MMA). Impactos en la Costa Española por Efecto del Cambio Climático. Fase III. Estrategias Frente al Cambio Climático en la Costa, 1st ed.; Dirección General de Calidad y Evaluación Ambiental y Universidad de Cantabria: Madrid, Spain, 2004; pp. 1–132. [Google Scholar]
  35. Ministerio de Agricultura, Alimentación y Medio Ambiente (MAGRAMA). Cambio Climático en la Costa Española, 2nd ed.; Ministerio de Agricultura, Alimentación y Medio Ambiente: Madrid, Spain, 2014; pp. 1–132. [Google Scholar]
  36. Ministerio para la Transición Ecológica y Reto Demográfico (MITERD). Plan Nacional de Adaptación al Cambio Climático (PNACC); Ministerio para la Transición Ecológica y Reto Demográfico: Madrid, Spain, 2020; pp. 1–246. [Google Scholar]
  37. MITERD. En España Existen 1.200 Grandes Presas. Available online: https://hispagua.cedex.es/documentacion/noticia/38552 (accessed on 20 November 2023).
  38. Oliva Cañizares, A.; Olcina Cantos, J. Temporales marítimos, cambio climático y cartografía de detalle de ocupación de la franja costera: Diagnóstico en el sur de la provincia de Alicante (España). Doc. D’Anàlisi Geogràfica 2022, 68, 107–138. [Google Scholar] [CrossRef]
  39. Puig, M.; Montes, J.; Río, L.; Benavente, J.; Gracia, F.J. Costa gaditana: Esos temibles temporales costeros. Enseñanzas Cienc. Tierra 2017, 25, 247–249. [Google Scholar]
  40. Ollero, A.; Ibisate, A.; Acín, V.; Ballarín, D.; Besne, P.; Díaz, E.; Ferrer-Boix, C.; Granado, D.; Herrero, X.; Horacio, J.; et al. Geomorfología y restauración fluvial: Seguimiento del derribo de presas en Guipúzcoa. Cuad. Investig. Geográfica 2014, 40, 67–88. [Google Scholar] [CrossRef]
  41. Rodríguez, I.; Santillán, J.I.; Huertas, R. Excursión del I Congreso Ibérico de restauración fluvial. In Actas del I Congreso Ibérico de Restauración Fluvial Restauraríos; Centro Ibérico de Restauración Fluvial, Ministerio de Medio Ambiente y Medio Rural y Marino y Confederación Hidrográfica del Duero: León, Spain, 2011; pp. 891–895. [Google Scholar]
  42. Álvarez, F.; San Emeterio, D.; Tames, P. Criterios de Diseño de las Actuaciones en Obstáculos Realizadas por la Diputación Foral de Guipúzcoa. In Actas del I Congreso Ibérico de Restauración Fluvial Restauraríos; Centro Ibérico de Restauración Fluvial, Ministerio de Medio Ambiente y Medio Rural y Marino y Confederación Hidrográfica del Duero: León, Spain, 2011; pp. 397–404. [Google Scholar]
  43. Ibisate, A.; Ollero, A.; Ballarín, D.; Horacio, J.; Mora, D.; Mesanza, A.; Ferrer-Boix, C.; Acín, V.; Granado, D.; Martín-Vide, J.P. Geomorphic monitoring and response to two dam removals: Urumea and Leitzaran Rivers (Basque Country, Spain). Earth Surf. Process. Landf. 2016, 41, 2239–2255. [Google Scholar] [CrossRef]
  44. Prieto, F.; Navarro-Jurado, E. Desarrollo litoral sostenible en España: Proceso de litoralización (1960–2012). Tipificación de municipios y escenarios para 2030. Destrucción de un bien común y pérdida de los servicios de los ecosistemas. Lecciones aprendidas pensando en latino-América. La tragedia de los comunes en la costa española. In Libro de Comunicaciones y Pósteres. I Congreso Iberoamericano de Gestión Integrada de Áreas Litorales; Barragán Muñoz, J.M., Ed.; Universidad de Cádiz: Cádiz, Spain, 2012; pp. 133–152. [Google Scholar]
  45. Ministerio de Agricultura, Pesca y Alimentación. Demografía de la Población Costera en 2020. Análisis y Prospectiva. 2022. Available online: https://www.mapa.gob.es/es/ministerio/servicios/analisis-y-prospectiva/aypseriepesca5_demografiapoblacioncostera2020_tcm30-617441.pdf (accessed on 20 November 2023).
  46. Olcina Cantos, J.; Saurí, D.; Hernández, M.; Ribas, A. Flood Policy in Spain: A review for the period 1983–2013. Disaster Prev. Manag. 2016, 25, 41–58. [Google Scholar] [CrossRef]
  47. Olcina Cantos, J. Cambio climático y riesgos climáticos en España. Investig. Geográficas 2009, 49, 197–220. [Google Scholar] [CrossRef]
  48. Segura Hidrografic Confederation (CHS). Plan Hidrológico de la Cuenca del Segura (2022–2027). Available online: https://www.chsegura.es/es/cuenca/caracterizacion/marco-fisico/ (accessed on 20 November 2023).
  49. Fernández-Hernández, M.; Calvo, A.; Iglesias, L.; Castedo, R.; Ortega, J.J.; Díaz-Honrubia, A.J.; Mora, P.; Costamagna, E. Anthropic action on historical shoreline changes and future estimates using GIS: Guardamar del Segura (Spain). Appl. Sci. 2023, 13, 9792. [Google Scholar] [CrossRef]
  50. Segura Hidrografic Confederation (CHS). Visor CHS. Available online: https://www.chsegura.es/portalchsic/apps/webappviewer/index.html?id=893ec33b6ba84fc09102663dce94b740&codif=&nombre=Basico (accessed on 20 November 2023).
  51. Valencian Cartographic Institute (ICV). Fototeca. Available online: https://geofototeca.gva.es/visor_fototeca/ (accessed on 20 November 2023).
  52. National Geographic Institute (IGN). Servicios WMS. Available online: https://www.ign.es/web/ign/portal (accessed on 20 November 2023).
  53. Valencian Cartographic Institute (ICV). Visor GVA. Available online: https://visor.gva.es/visor/?idioma=es (accessed on 20 November 2023).
  54. Puertos del Estado. Available online: https://www.puertos.es/es-es (accessed on 13 October 2023).
  55. Calvo García-Tornel, F. Las transformaciones de los espacios urbanos fluviales en zonas áridas: Lecciones de la cuenca del Segura. Doc. D’Anàlisi Geogràfic 1997, 31, 103–116. [Google Scholar]
  56. Gil Olcina, A.; Canales Martínez, G. Concausas y Tipos de Inundaciones en la Vega Baja del Segura; Universidad de Alicante: San Vicente del Raspeig, Spain, 2022; pp. 1–472. [Google Scholar]
  57. Morote Seguido, A.F.; Rico Amorós, A.M. Perspectivas de funcionamiento del trasvase Tajo-Segura (España): Efectos de las nuevas reglas de explotación e impulso de la desalinización com recurso sustitutivo. Bol. Asoc. Geógr. Esp. 2018, 79, 1–43. [Google Scholar] [CrossRef]
  58. Vericat, D.; Batalla, R.J. Sediment transport in a large impounded river: The lower Ebro, NE Iberian Peninsula. Geomorphology 2006, 79, 72–92. [Google Scholar] [CrossRef]
  59. Benahmed, Z. Disseny d’un Sistema de Mostreig del Transport de Sediment de Fons a Rius amb Helley-Smith; Universitat Politècnica de Catalunya: Barcelona, Spain, 2021. [Google Scholar]
  60. Lobera, G.; Batalla, R.J.; Vericat, D.; López Tarazón, J.A.; Tena, A. Sediment transport in two mediterranean regulated rivers. Sci. Total Environ. 2016, 540, 101–113. [Google Scholar] [CrossRef] [PubMed]
  61. Horacio, J.; Ibisate, A.; Sánchez Pinto, I.; Beltrán de Lubiano, J.; Ollero, A. Seguimiento del transporte de sedimentos mediante trazadores en el río Leitzaran. In Geomorfología del “Antropoceno”: Efectos del Cambio Global Sobre los Procesos Geomorfológicos; Garcia, C., Gómez-Pujol, L., Morán-Tejeda, E., Batalla, R.J., Eds.; Universitat de les Illes Balears: Mallorca, Spain, 2018; pp. 53–56. [Google Scholar]
  62. Piégay, H.; Arnaud, F.; Cassel, M.; Dépret, T.; Alber, A.; Michel, K.; Rollet, A.J.; Vaudor, L. Suivi par RFID de la mobilité des galets: Retour sur 10 ans d’expérience en grandes rivières. Bull. Soc. Géogr. Liège 2016, 67, 77–91. [Google Scholar]
  63. Vázquez Tarrío, D.; Batalla, R.J. Assessing controls on the displacement of tracers in gravel-bed rivers. Water 2019, 11, 1598. [Google Scholar] [CrossRef]
  64. Arnaud, F.; Paquier, A.; Vázquez-Tarrío, D.; Camenen, B.; Le Coz, J.; Michel, K.; Naudet, G.; Pella, H.; Piégay, H. Comparing field, probabilistic, and 2D numerical approaches to assess gravel mobility in a gravel-bed river. Water Resour. Res. 2023, 59, e2022WR034127. [Google Scholar] [CrossRef]
  65. Braud, S.; Alber, A. Synthèses des Connaissances et Proposition D’une Méthode D’évaluation de L’impact des Ouvrages Transversaux sur la Continuité Sédimentaire des Cours D’eau; Direction Régionale de l’Environnement de l’Aménagement et du Logement Centre: Poiters, France, 2013; pp. 1–76. [Google Scholar]
  66. Ibáñez, C.; Prat, N.; Canicio, A. Changes in the hydrology and sediment transport produced by large dams on the lower Ebro river and its estuary. Regul. Rivers Res. Manag. 1996, 12, 51–62. [Google Scholar] [CrossRef]
  67. Vericat, D.; Church, M.; Batalla, R.J. Bed load bias: Comparison of measurements obtained using two (76 and 152 mm) Helley-Smith samplers in a gravel bed river. Water Resour. Res. 2006, 42, W01402. [Google Scholar] [CrossRef]
  68. Gorostiza, S.; Parrinello, G.; Aguettaz, D.; Saurí, D. Where have all the sediments gone? Reservoir silting and sedimentary justice in the lower Ebro River. Political Geogr. 2023, 107, 102975. [Google Scholar] [CrossRef]
  69. Mariano, M.; Abella, S.; Araujo, R.; Ibisate, A.; Ollero, A. Nature-human-river relationships at the Ebro River and its Delta (Spain). In River Culture–Life as a Dance to the Rhythm of the Waters; Wantzen, K.M., Ed.; UNESCO Publishing: Paris, France, 2023; pp. 745–782. [Google Scholar]
  70. Ollero, A. Los paisajes fluviales peninsulares en un contexto de cambio hidroclimático ambiental: Los retos de la gestión de riesgos y de la restauración. In El Bajo Segura como Enclave Hidrológico: Territorio, Economía y Paisaje; Zaragoza, M.F., Ed.; Tirant Humanidades: Valencia, Spain, 2023; pp. 287–318. [Google Scholar]
  71. Peña, L.; Onaindia, M.; Muñoz, O.; Amaya, A.; Fernández de Manuel, B.; Ametzaga-Arregi, I. Soluciones basadas en la naturaleza frente al cambio climático: Restauración de dunas y marismas. AZTI Rev. Investig. Mar. 2020, 27, 69–72. [Google Scholar]
  72. Ministerio de Obras Públicas, Transporte y Medio Ambiente (MOPTMA). El Litoral Valenciano: Análisis Territorial y Valoración de su Protección. El Papel de la Actual Legislación Sobre Costas; Centro de Publicaciones MOPTMA; Universidad de Alicante; Universidad de Madrid: Madrid, Spain, 1993; pp. 1–120. [Google Scholar]
  73. Kelley, J.T.; Barber, D.C.; Belknap, D.F.; Fitzgerald, D.M.; Van Heteren, S.; Dickson, S.M. Sand budgets ant geological, historical and contemporany time scales for a developed beach system, Saco Bay, Maine, USA. Mar. Geol. 2005, 214, 117–142. [Google Scholar] [CrossRef]
  74. Pons Cànovas, F. El nuevo régimen de la prórroga extraordinaria de las concesiones de dominio público marítimo terrestre. Rev. Adm. Pública 2022, 2019, 107–136. [Google Scholar] [CrossRef]
Figure 1. Study area on the scale of Spain’s river basins.
Coasts 04 00005 g001
Figure 2. Cartographic methodology for the delimitation of coastal zones based on aerial photography in different stretches applied to the entire coastal sector of Guardamar del Segura.
Coasts 04 00005 g002
Figure 3. Diagram of historical floods and evolution of reservoirs in the Segura Basin (1900–2020).
Coasts 04 00005 g003
Figure 4. Location and chronological evolution of the construction of large regulation works in the Segura Basin.
Coasts 04 00005 g004
Figure 5. Average annual flow (hm3/year) in the different sections of the Segura River (upper section: Cenajo; middle section: Ojós; and lower section: Guardamar del Segura) for the period of 1940–2022.
Coasts 04 00005 g005
Figure 6. Evolution of coastal retreat in the coastal area of Guardamar del Segura as a consequence of the regulation works in the Segura Basin and anthropic actions on the coast. (A) the northern sector of the municipality of Guardamar del Segura; (B) the central sector of the municipal district of Guardamar del Segura; (C) the southern sector of the municipal district of Guardamar del Segura.
Coasts 04 00005 g006
Figure 7. Evolution of coastal retreat at Babilonia Beach (Guardamar del Segura) (1929–2023).
Coasts 04 00005 g007
Figure 8. The current situation of the dwellings on Babilonia Beach in Guardamar del Segura.
Coasts 04 00005 g008
Figure 9. Comparison of dwellings and areas built and dwellings demolished on Babilonia Beach in Guardamar del Segura (1977–2023).
Coasts 04 00005 g009
Figure 10. Maritime storm events that have affected Babilonia Beach in Guardamar del Segura (1980–2023).
Coasts 04 00005 g010
Figure 11. Marine currents affecting the study area [54]. The arrows indicate the direction of the sea current in this sector on a day with atmospheric and sea stability.
Coasts 04 00005 g011
Figure 12. Swells and prevailing winds on the coast of Guardamar del Segura.
Coasts 04 00005 g012
Table 1. Conceptual scheme of natural and anthropogenic causes of coastal retreat processes.
OriginCauseConsequenceResults
NaturalMaritime stormsNaturally recoverable coastal retreatSediment accretion or accumulation zones and shoreline area reclamation
Storms on waterways
AnthropicSea level rise due to climate changeCoastal retreat not recoverableCoastal retreat not recoverable
River basin regulationSediment reduction
Land use changes in river basinsSediment reduction
River-defence hydraulic works and alluvial material extractionsSediment reduction
Coastal-defence hydraulic worksBreak in coastal drift
Urban development in coastal areasCoastal retreat
Wind disturbance
High economic losses
Risking human lives
Table 2. Storage capacity of water resources in the Segura River Basin.
Segura River Basin
RiversReservoirsProject Reservoir Capacity
(hm3)
Total Reservoir Capacity
(hm3)
GuadalentínValdeinfierno2111.16
Puentes IV29.329.3
Algeciras42.342.13
José Bautista Martín5.55.5
SeguraAlfonso XII2223
Fuensanta210224.7
Cenajo437465.59
Santomera26.6926.62
Taibilla9.59.5
Argos8.078.07
Ojós32.8
Mayés1.51.5
Pedrera246.7246.9
Moro7.077.07
Judío99
Cárcabo2.792.79
Moratalla55
La Risca3.173.17
MundoTalave3539.11
Camarillas38.6338.63
Los Charcos42
Bayco u Ortigosa99
Boquerón1312
MulaCierva57.28
Morrón0.070.03
Doña Ana2.542.36
Pliego8.918.00
Rodeos15.0114.50
TOTAL1120.751256.71
Table 3. Flows recorded through the SAIH during the most important flood episodes in the Segura Basin (1996–2019).
Recent Episodes of Major Floods in the Segura River Basin
RiverGauging StationsSeptember
1997
(m3/s)
February
1999
(m3/s)
October
2000
(m3/s)
October
2003
(m3/s)
October
2006
(m3/s)
September
2012
(m3/s)
December
2016
(m3/s)
September
2019
(m3/s)
Segura River04A06—La GrayaN/AN/AN/AN/AN/AN/AN/AN/A
04A04—El GallegoN/AN/AN/AN/AN/AN/A10.74236.457
03A03—CalasparraN/AN/AN/AN/A6.90328.66930.33669.587
02R01—Cieza69.94331.71629.09234.64714.63856.25429.536107.581
02A04—BlancaN/AN/AN/AN/AN/A63.15334.697192.949
02A02—Ojós36.8473.8663.065.942.31635.9578.465173.918
01A01—Contraparada174.9259.234107.519596.4772.499101.087140.988267.176
07R02—AlqueríasN/AN/AN/AN/A1.56122.267170.154183.544
07A06—OrihuelaN/AN/AN/AN/AN/AN/AN/A111.454 *
07R04—BenejúzarN/AN/AN/AN/A92.58785.288117.483173.715
07R06—RojalesN/AN/AN/AN/AN/A75.91990.565125.852
Mundo
River
03A05—LiétorN/AN/AN/AN/AN/AN/A3.64620.967
03A04—AzaraqueN/AN/AN/AN/AN/AN/A13.37816.182
Mula
River
01O03—Albuidete150.44271.75843.451653.049723.045137.39670.514157.954
Guadalentín
River
01O05—El Palmar
(Murcia)
N/AN/AN/AN/AN/AN/AN/AN/A
N/A: No data. The stations are ordered from the highest points of the basin to its mouth. * The value represents the maximum flow of the Segura river recorded at the Orihuela gauging station at 07 am. After this time the gauging station was flooded and did not record any more flows. This suggests that the flow was greater than the number shown in this table.
Table 4. Distance between the seashore and the dunes or buildings in the Municipality of Guardamar del Segura (1929–2023).
1929–19301956198720002023
Guardamar del SeguraNorthern coastline in relation to the mouth of the Segura RiverLos Tusales Beach159 m102 m31.3 m23.4 m12.5 m
Mouth of the Segura RiverMouth of the Segura River90.8 m55.5 m41.6 m8.3 m2 m
Southern coastline in relation to the mouth of the Segura RiverGuardamar dunes96.4 m54.9 m30.2 m21.8 m5.2 m
Babilonia Beach96.4 m55.6 m44.3 m32.1 m0 m
Centro Beach120 m73 m62.1 m55.6 m41.3 m
Las Ortigas Beach101 m122.4 m102.7 m124.3 m57.7 m
Data on regulatory works in the Segura BasinValdeinferno and Puentes IIIValdeinferno, Puentes III, Talave, Alfonso XII and FuensantaValdeinferno, Puentes III, Talave
Alfonso XII, Fuensanta, Cenajo, Camarillas, Santomera, Taibilla, Argos, Ojós, Pedrera and Morrón
Valdeinferno, Puentes III, Talave, Alfonso XII, Fuensanta, Cenajo, Camarillas, Santomera, Taibilla, Argos, Ojós, Pedrera, Morrón, Moro, Judío, Cárcabo, Doña Ana, Pliego, Algeciras, Bayco u Ortigosa, Boquerón, José Bautista Martín, Puentes IV, Rodeos, Charcos, Moratalla, Risca, Encauzamiento Segura and breakwaters at the mouth of the river-
Table 5. Evolution of the number of existing dwellings and the total built surface area on Babilonia Beach (Guardamar del Segura) (1930–1997).
YearNumber of DwellingsTotal Built-Up Area
(m2)
1930558533
197712619,463
199712619,463
Table 6. Evolution of the number of demolished dwellings and total area demolished on Babilonia Beach (Guardamar del Segura) (1997–2023).
YearNumber of DwellingsTotal Built-Up Area
(m2)
1997–20051131
2005–2012142218
2012–202261003
20233 (in progress)425 (in progress)
Total243777
Table 7. Number of existing dwellings and the built-up area on Babilonia Beach (Guardamar del Segura) in 2023.
Number of DwellingsTotal Built-Up Area
(m2)
Dwellings built12619,463
Demolished dwellings243777
Total10215,686
Disclaimer/Publisher’s Note: The statements, opinions and data contained in all publications are solely those of the individual author(s) and contributor(s) and not of MDPI and/or the editor(s). MDPI and/or the editor(s) disclaim responsibility for any injury to people or property resulting from any ideas, methods, instructions or products referred to in the content.

