
Characterizing Seiches Oscillations in a Macro-Tidal Estuary


Abstract
:1. Introduction
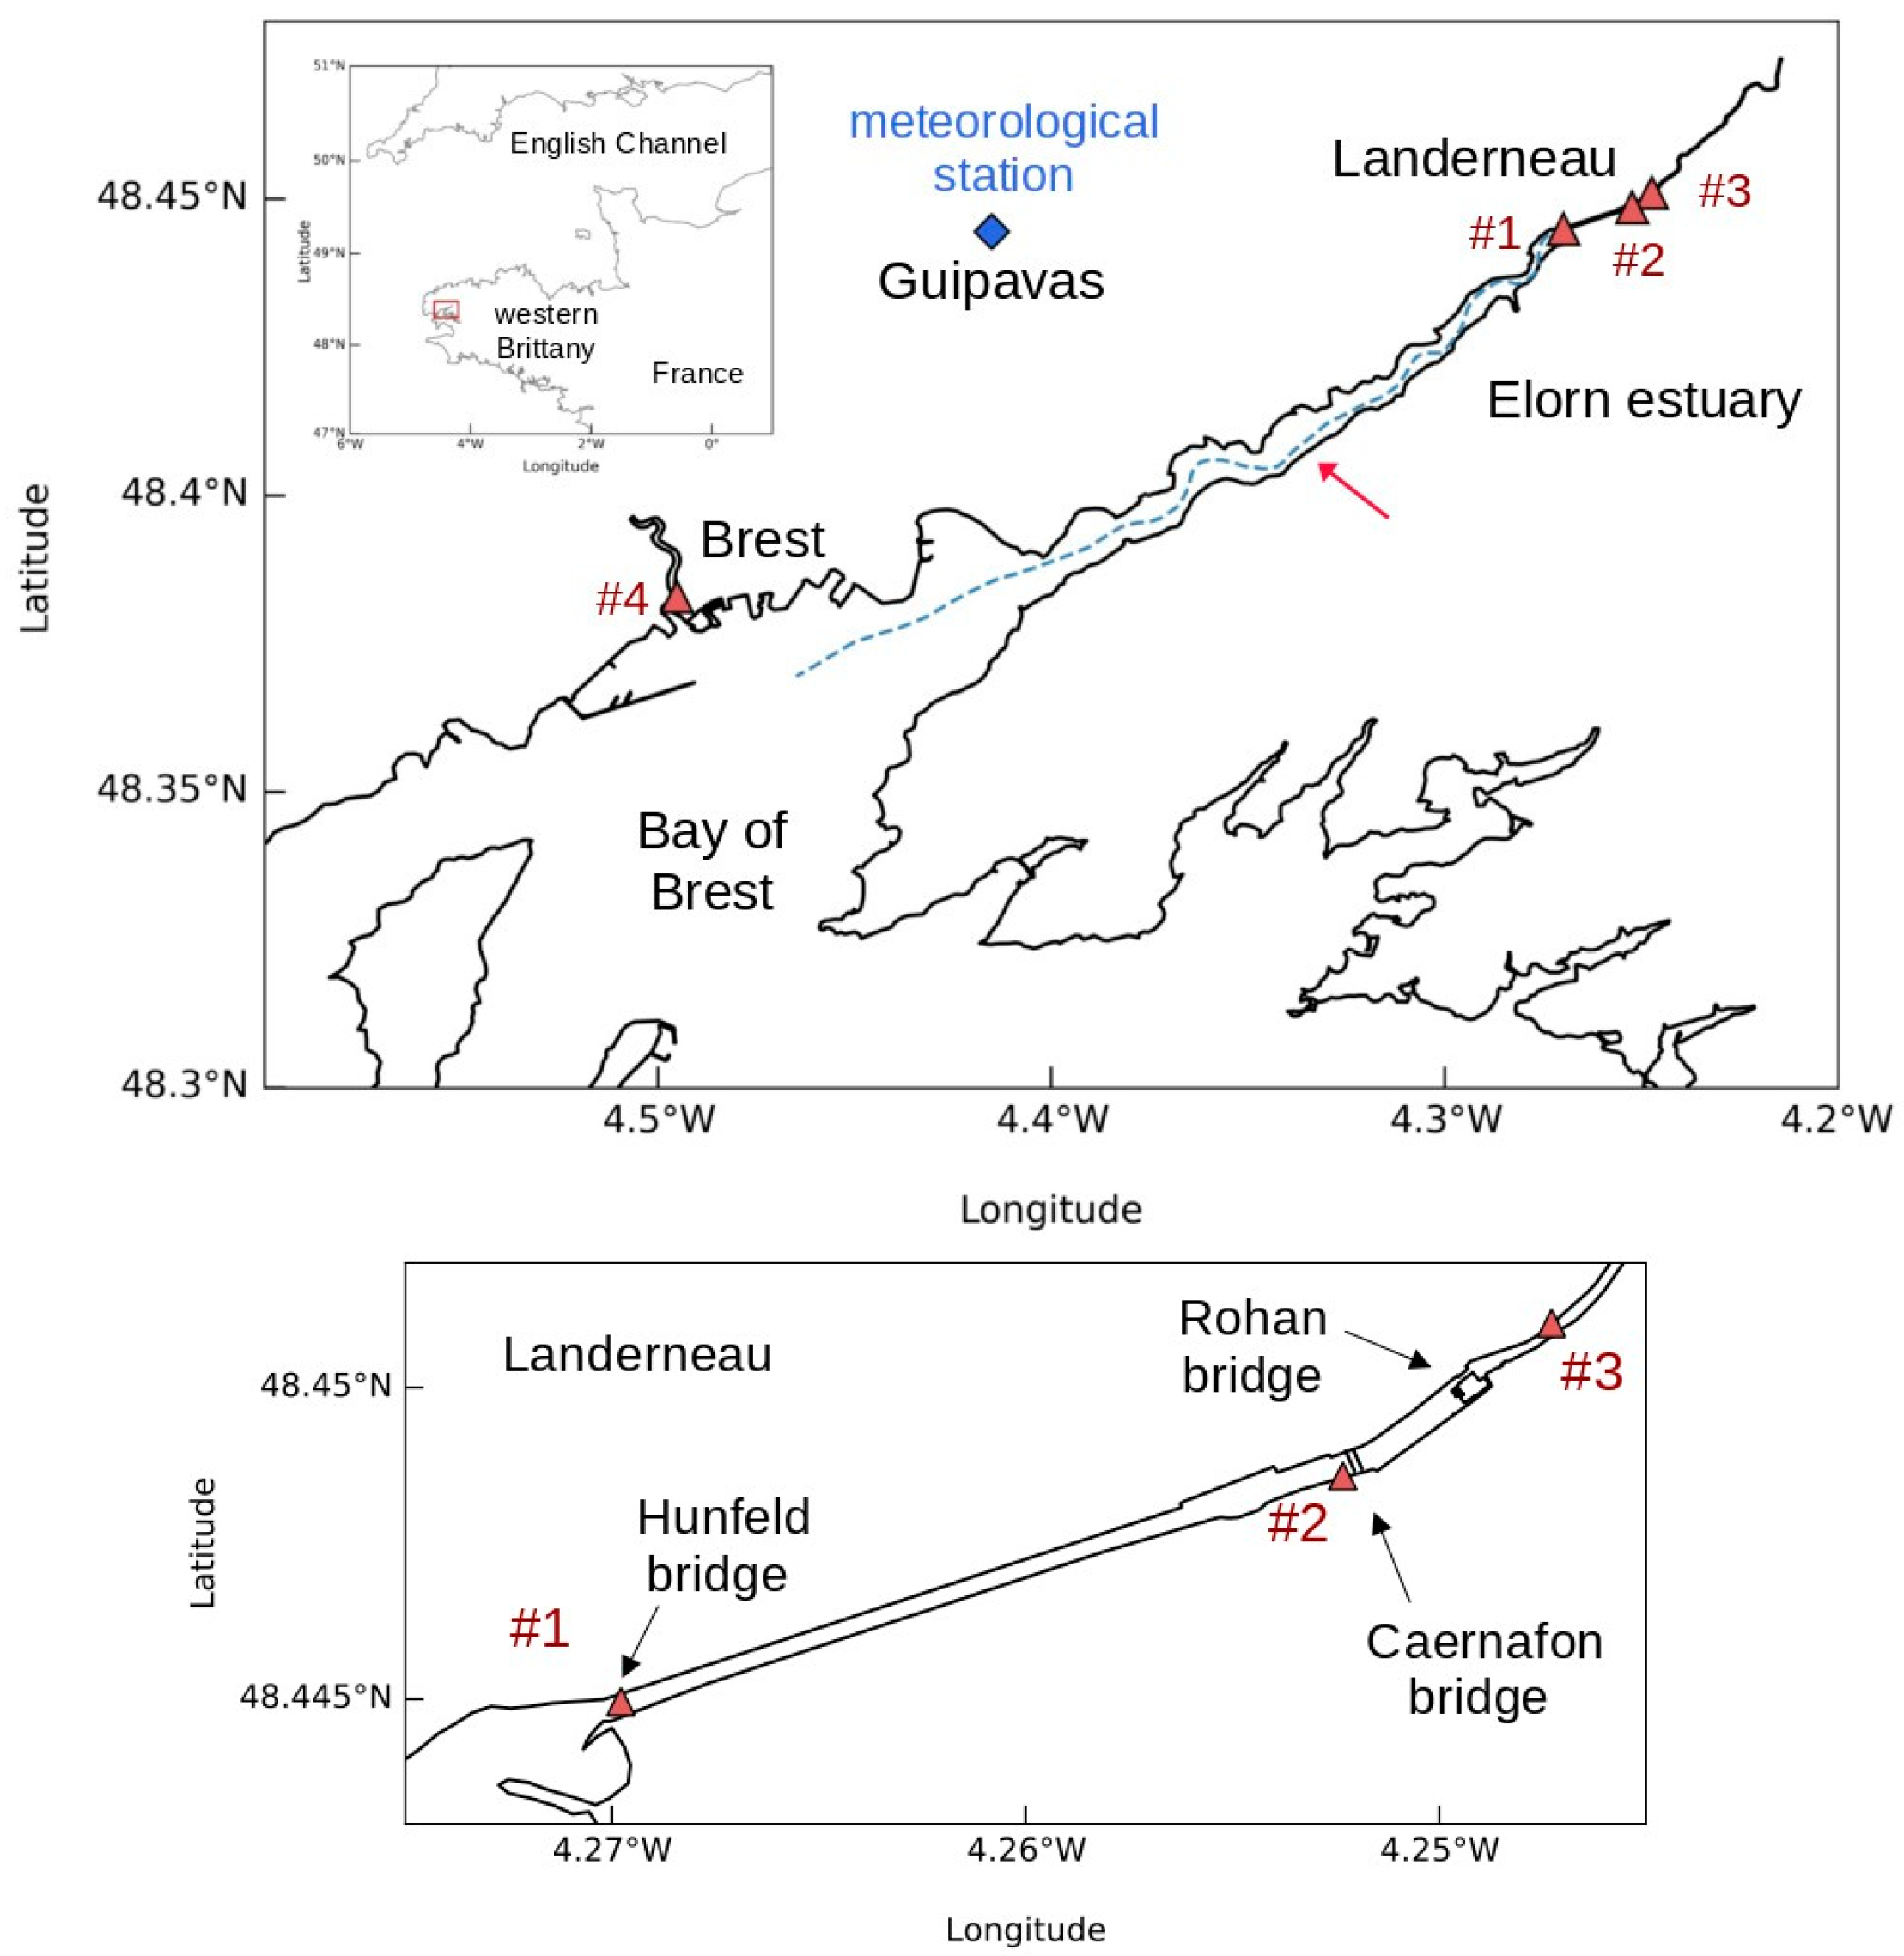
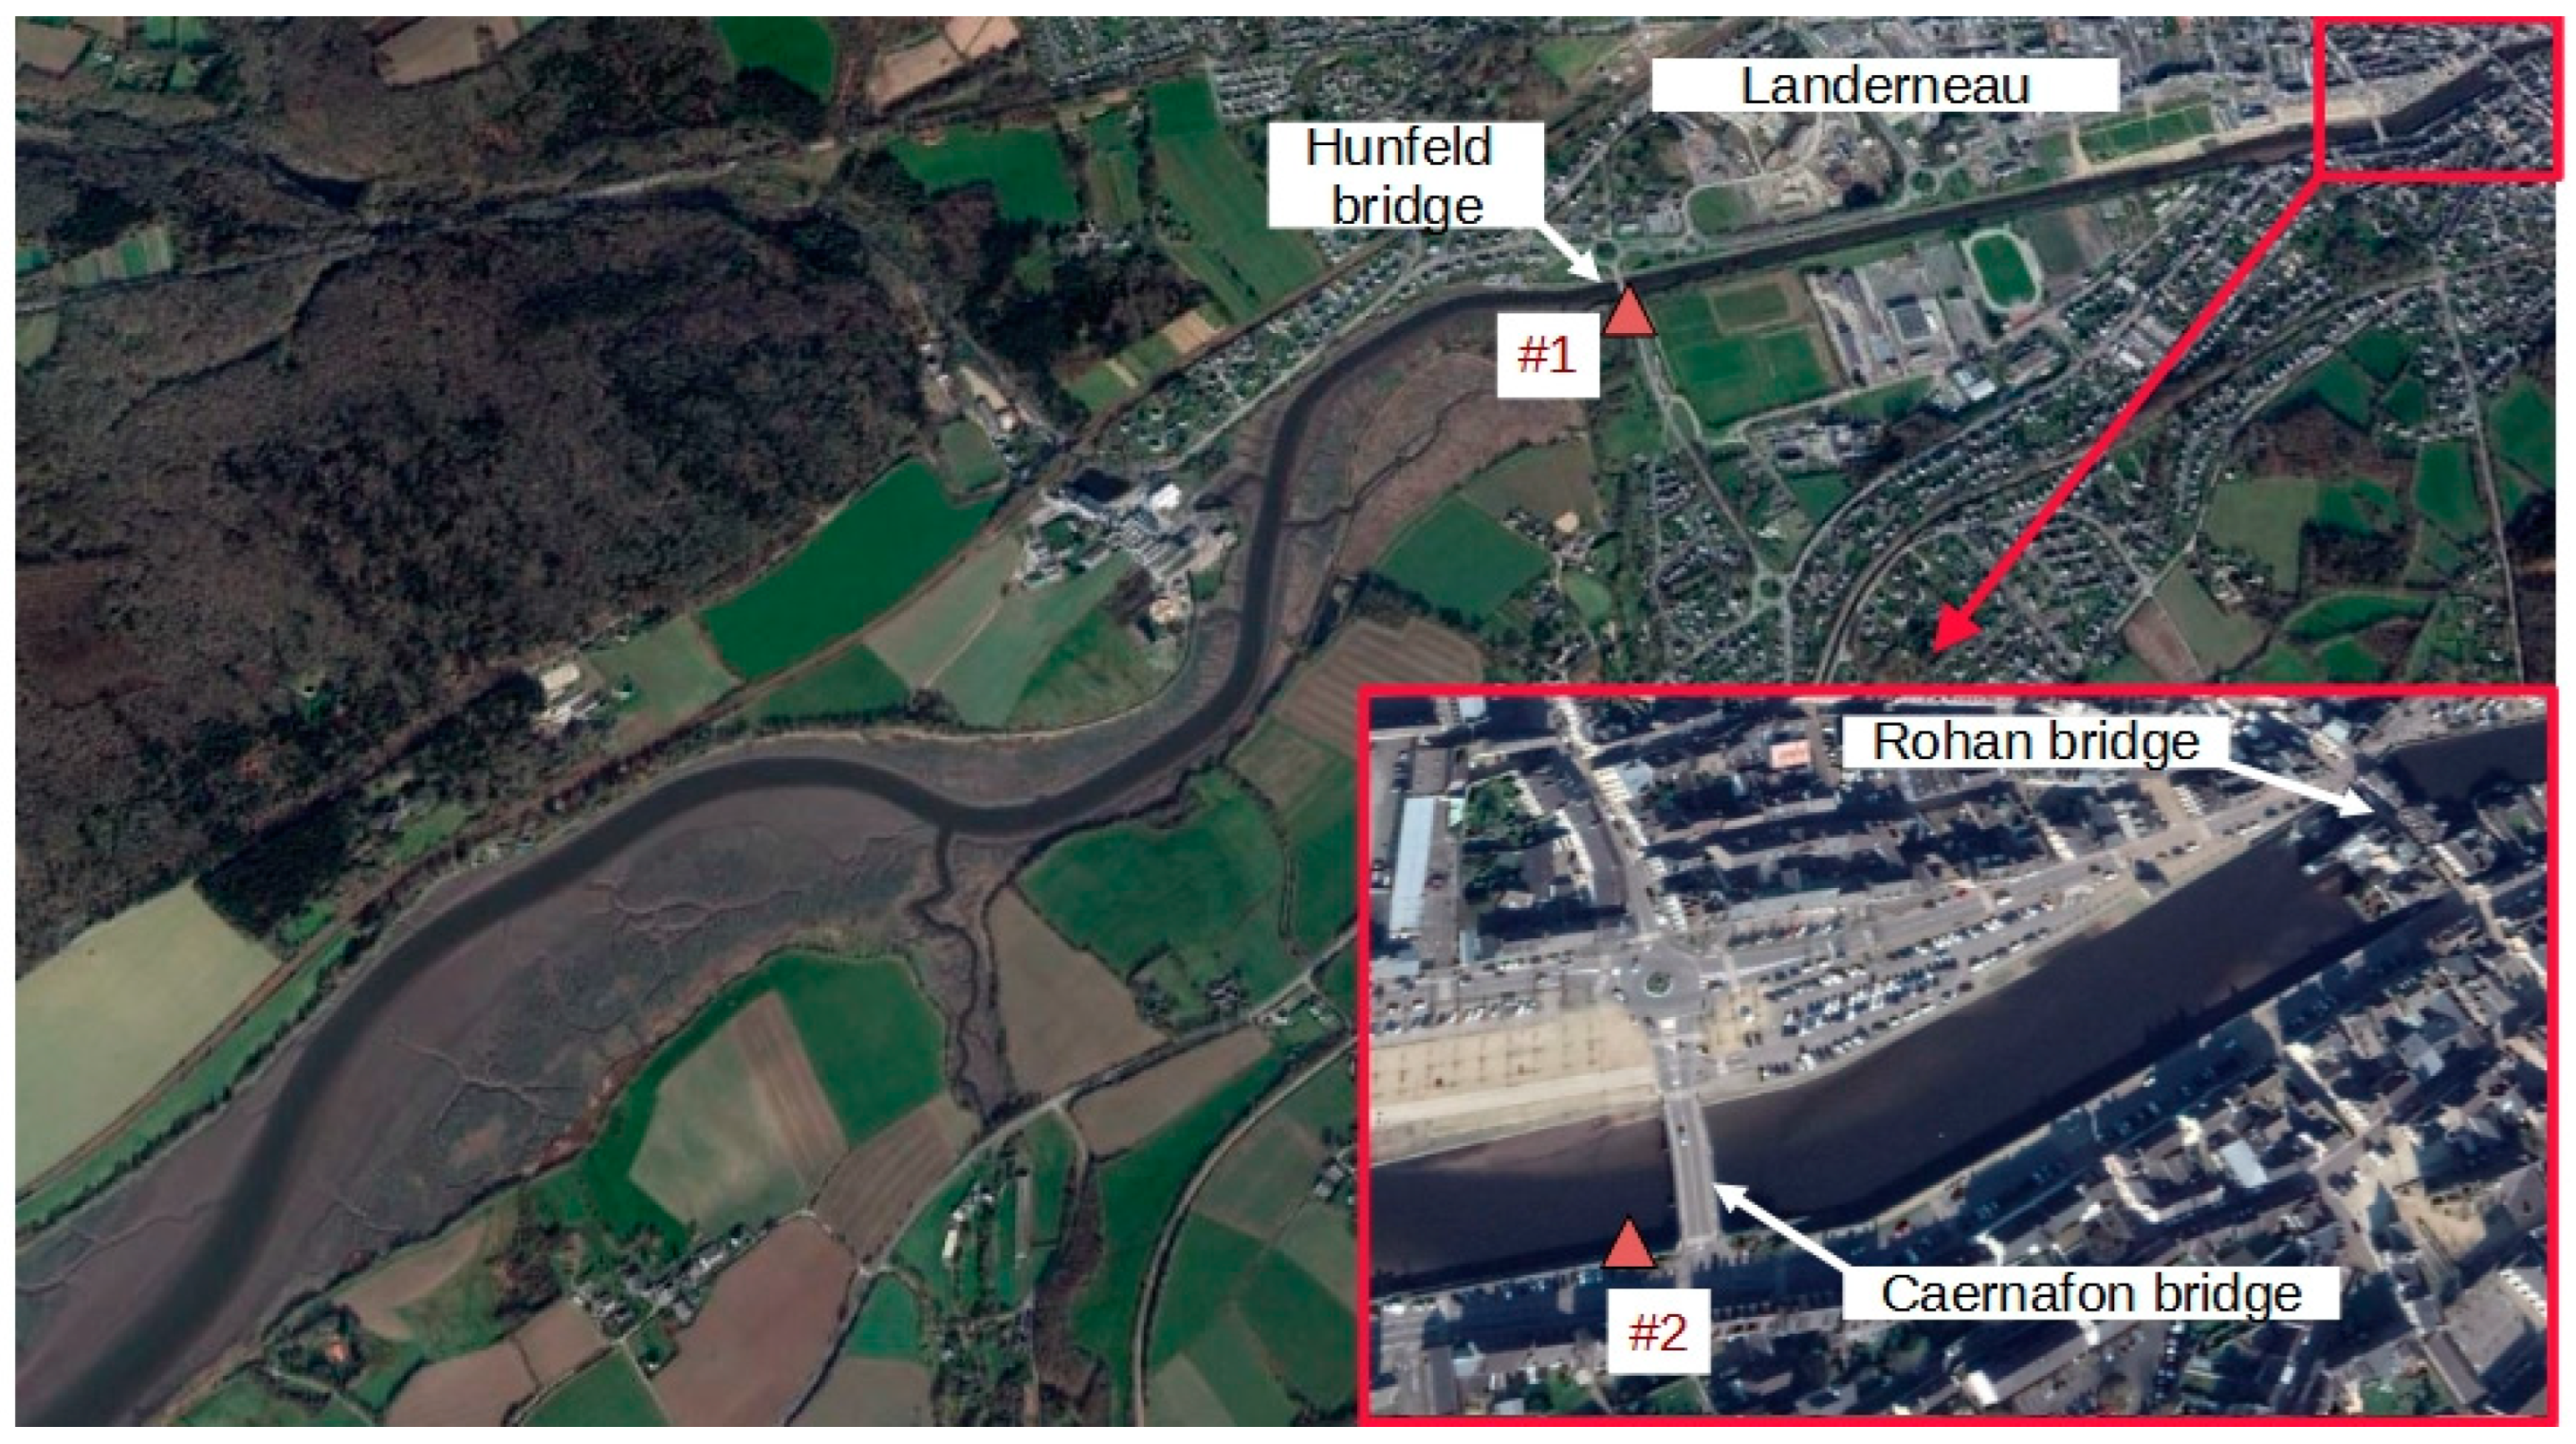
2. Study Area
3. Materials and Methods
3.1. Measurements
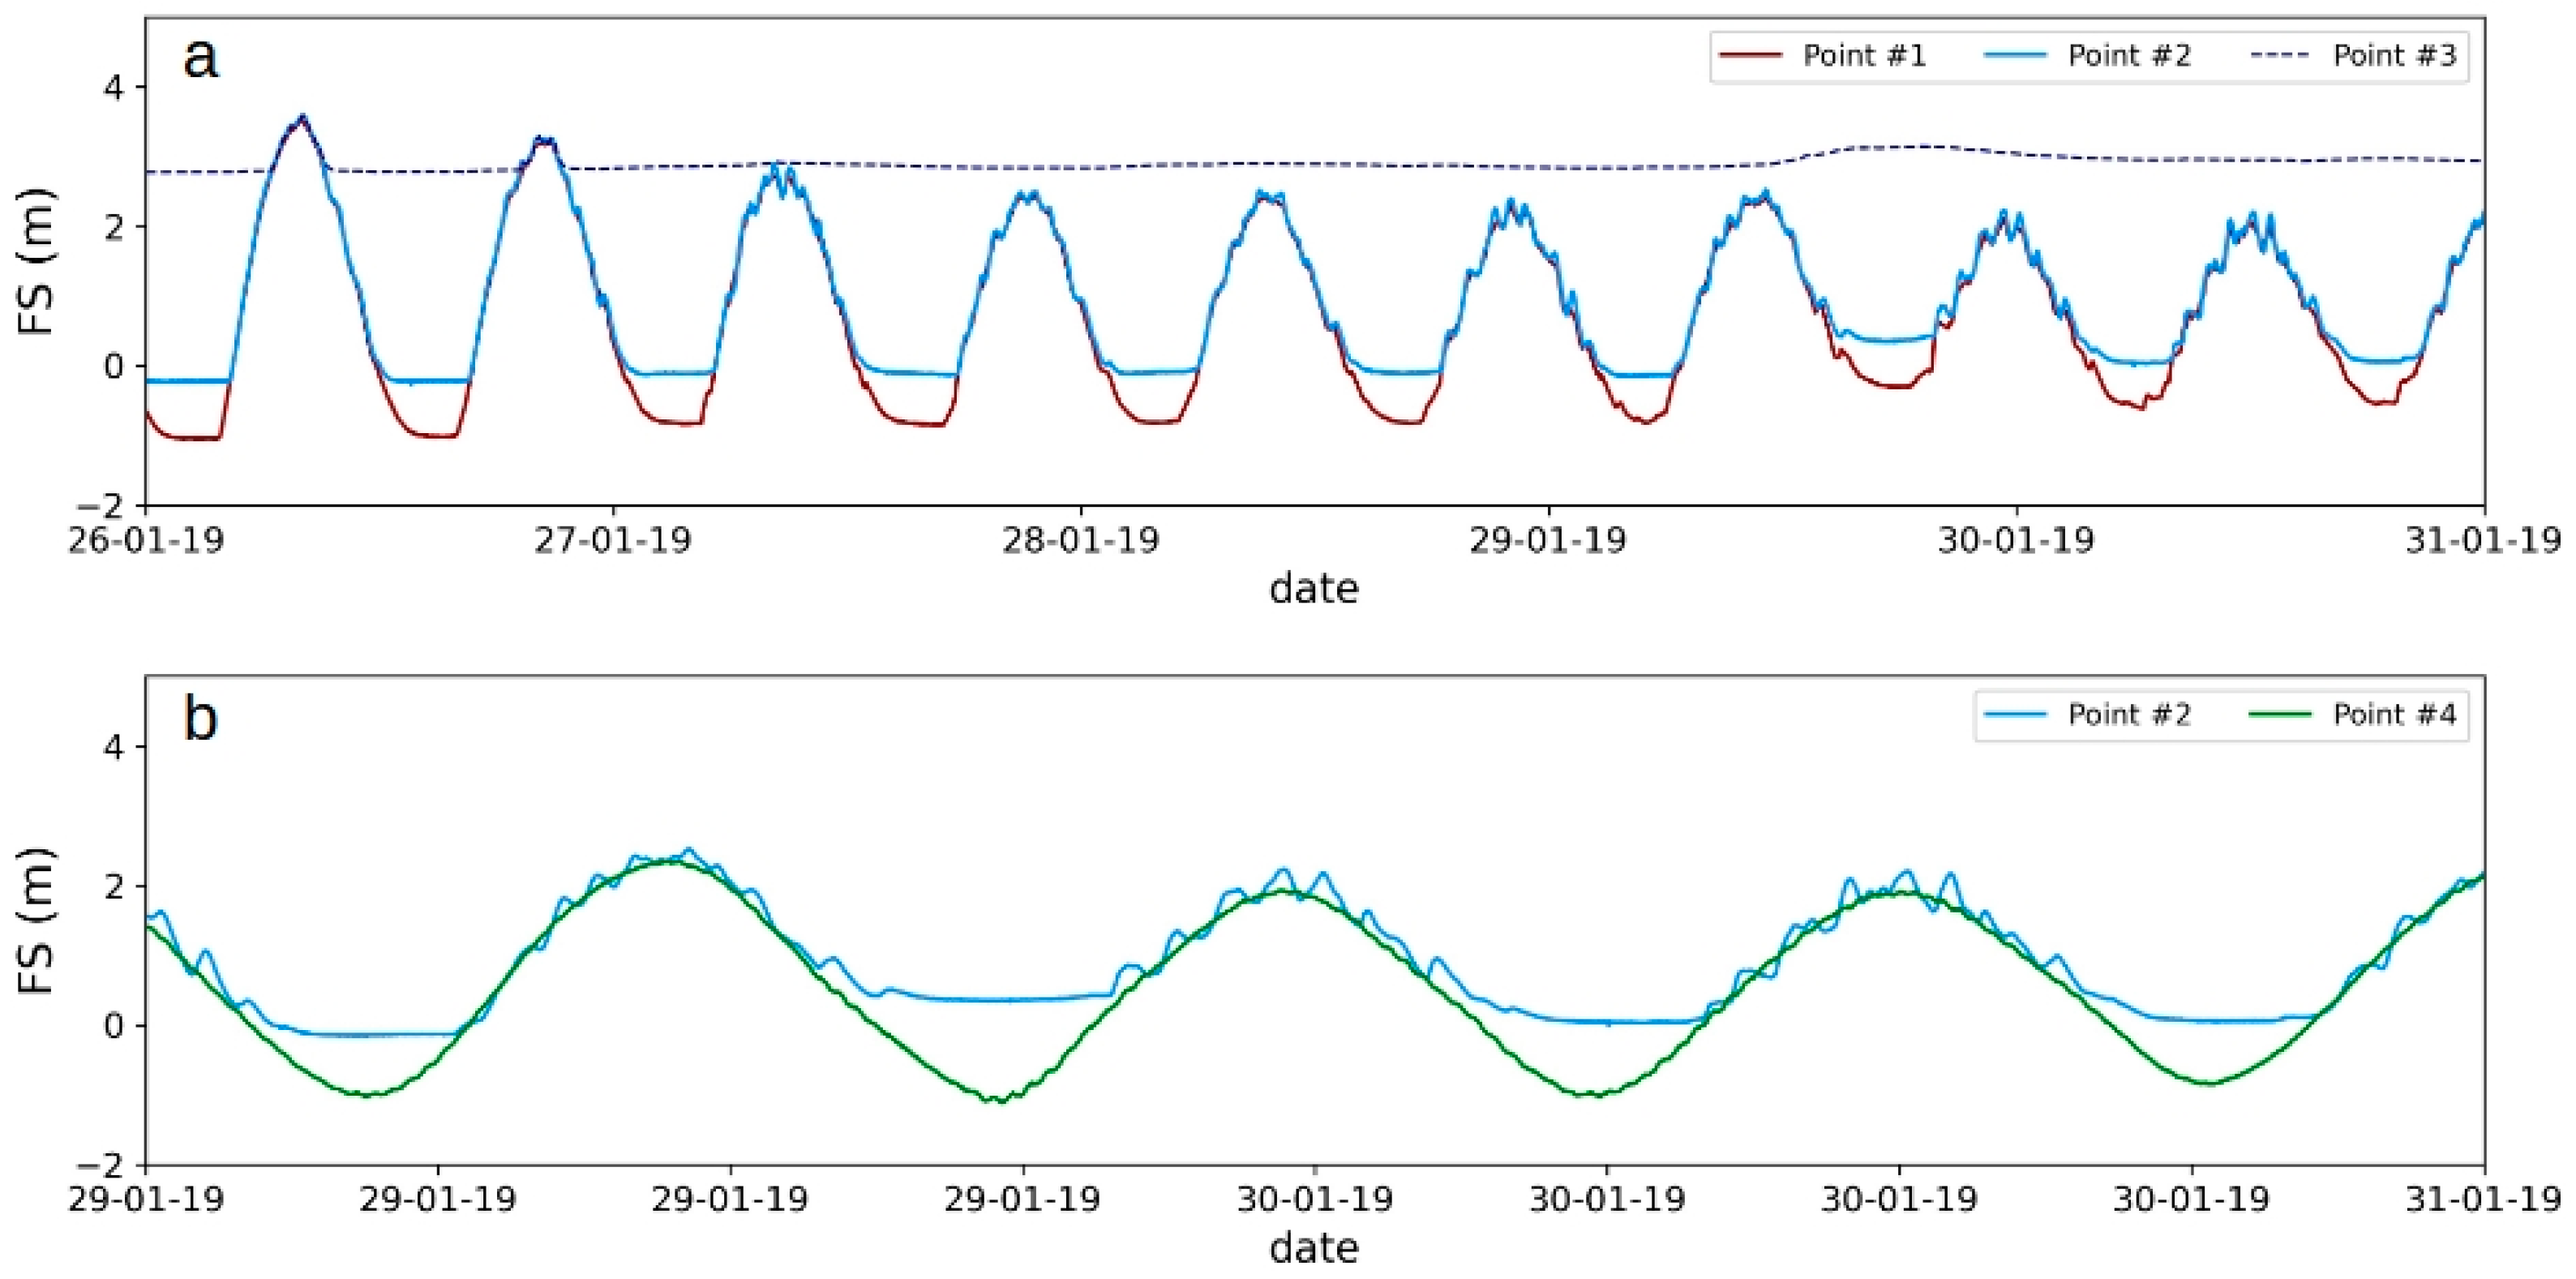
3.1.1. Free-Surface Elevation
3.1.2. Meteorological Conditions
3.2. Data Analysis Techniques
3.2.1. Analysis of Seiches with Respect to Tidal Cycles
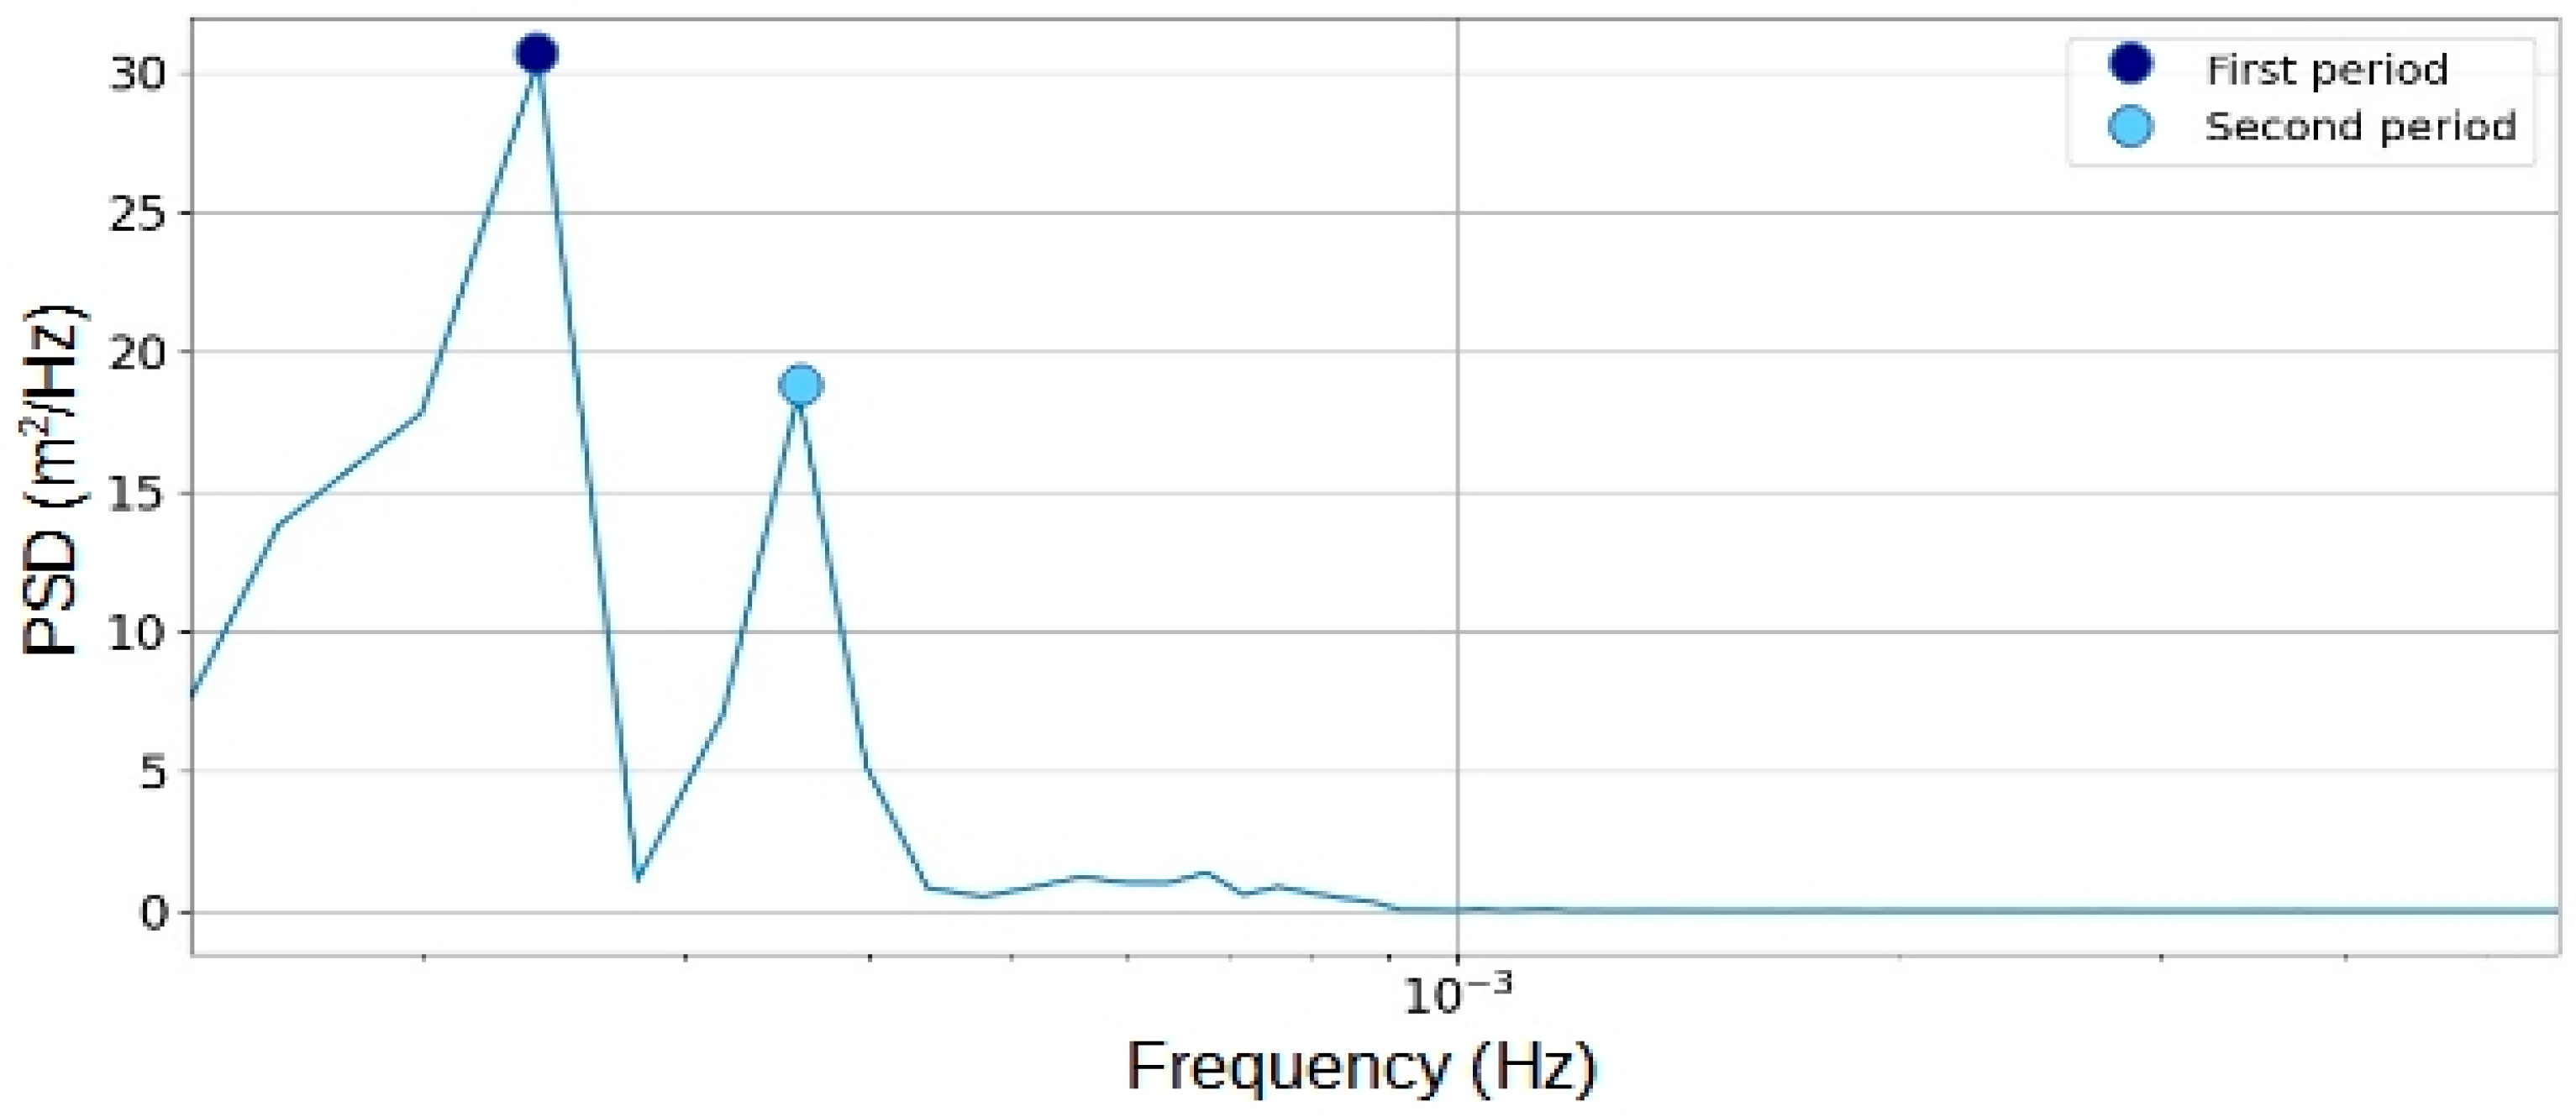
3.2.2. Spectral Analysis Technique
4. Results and Discussion
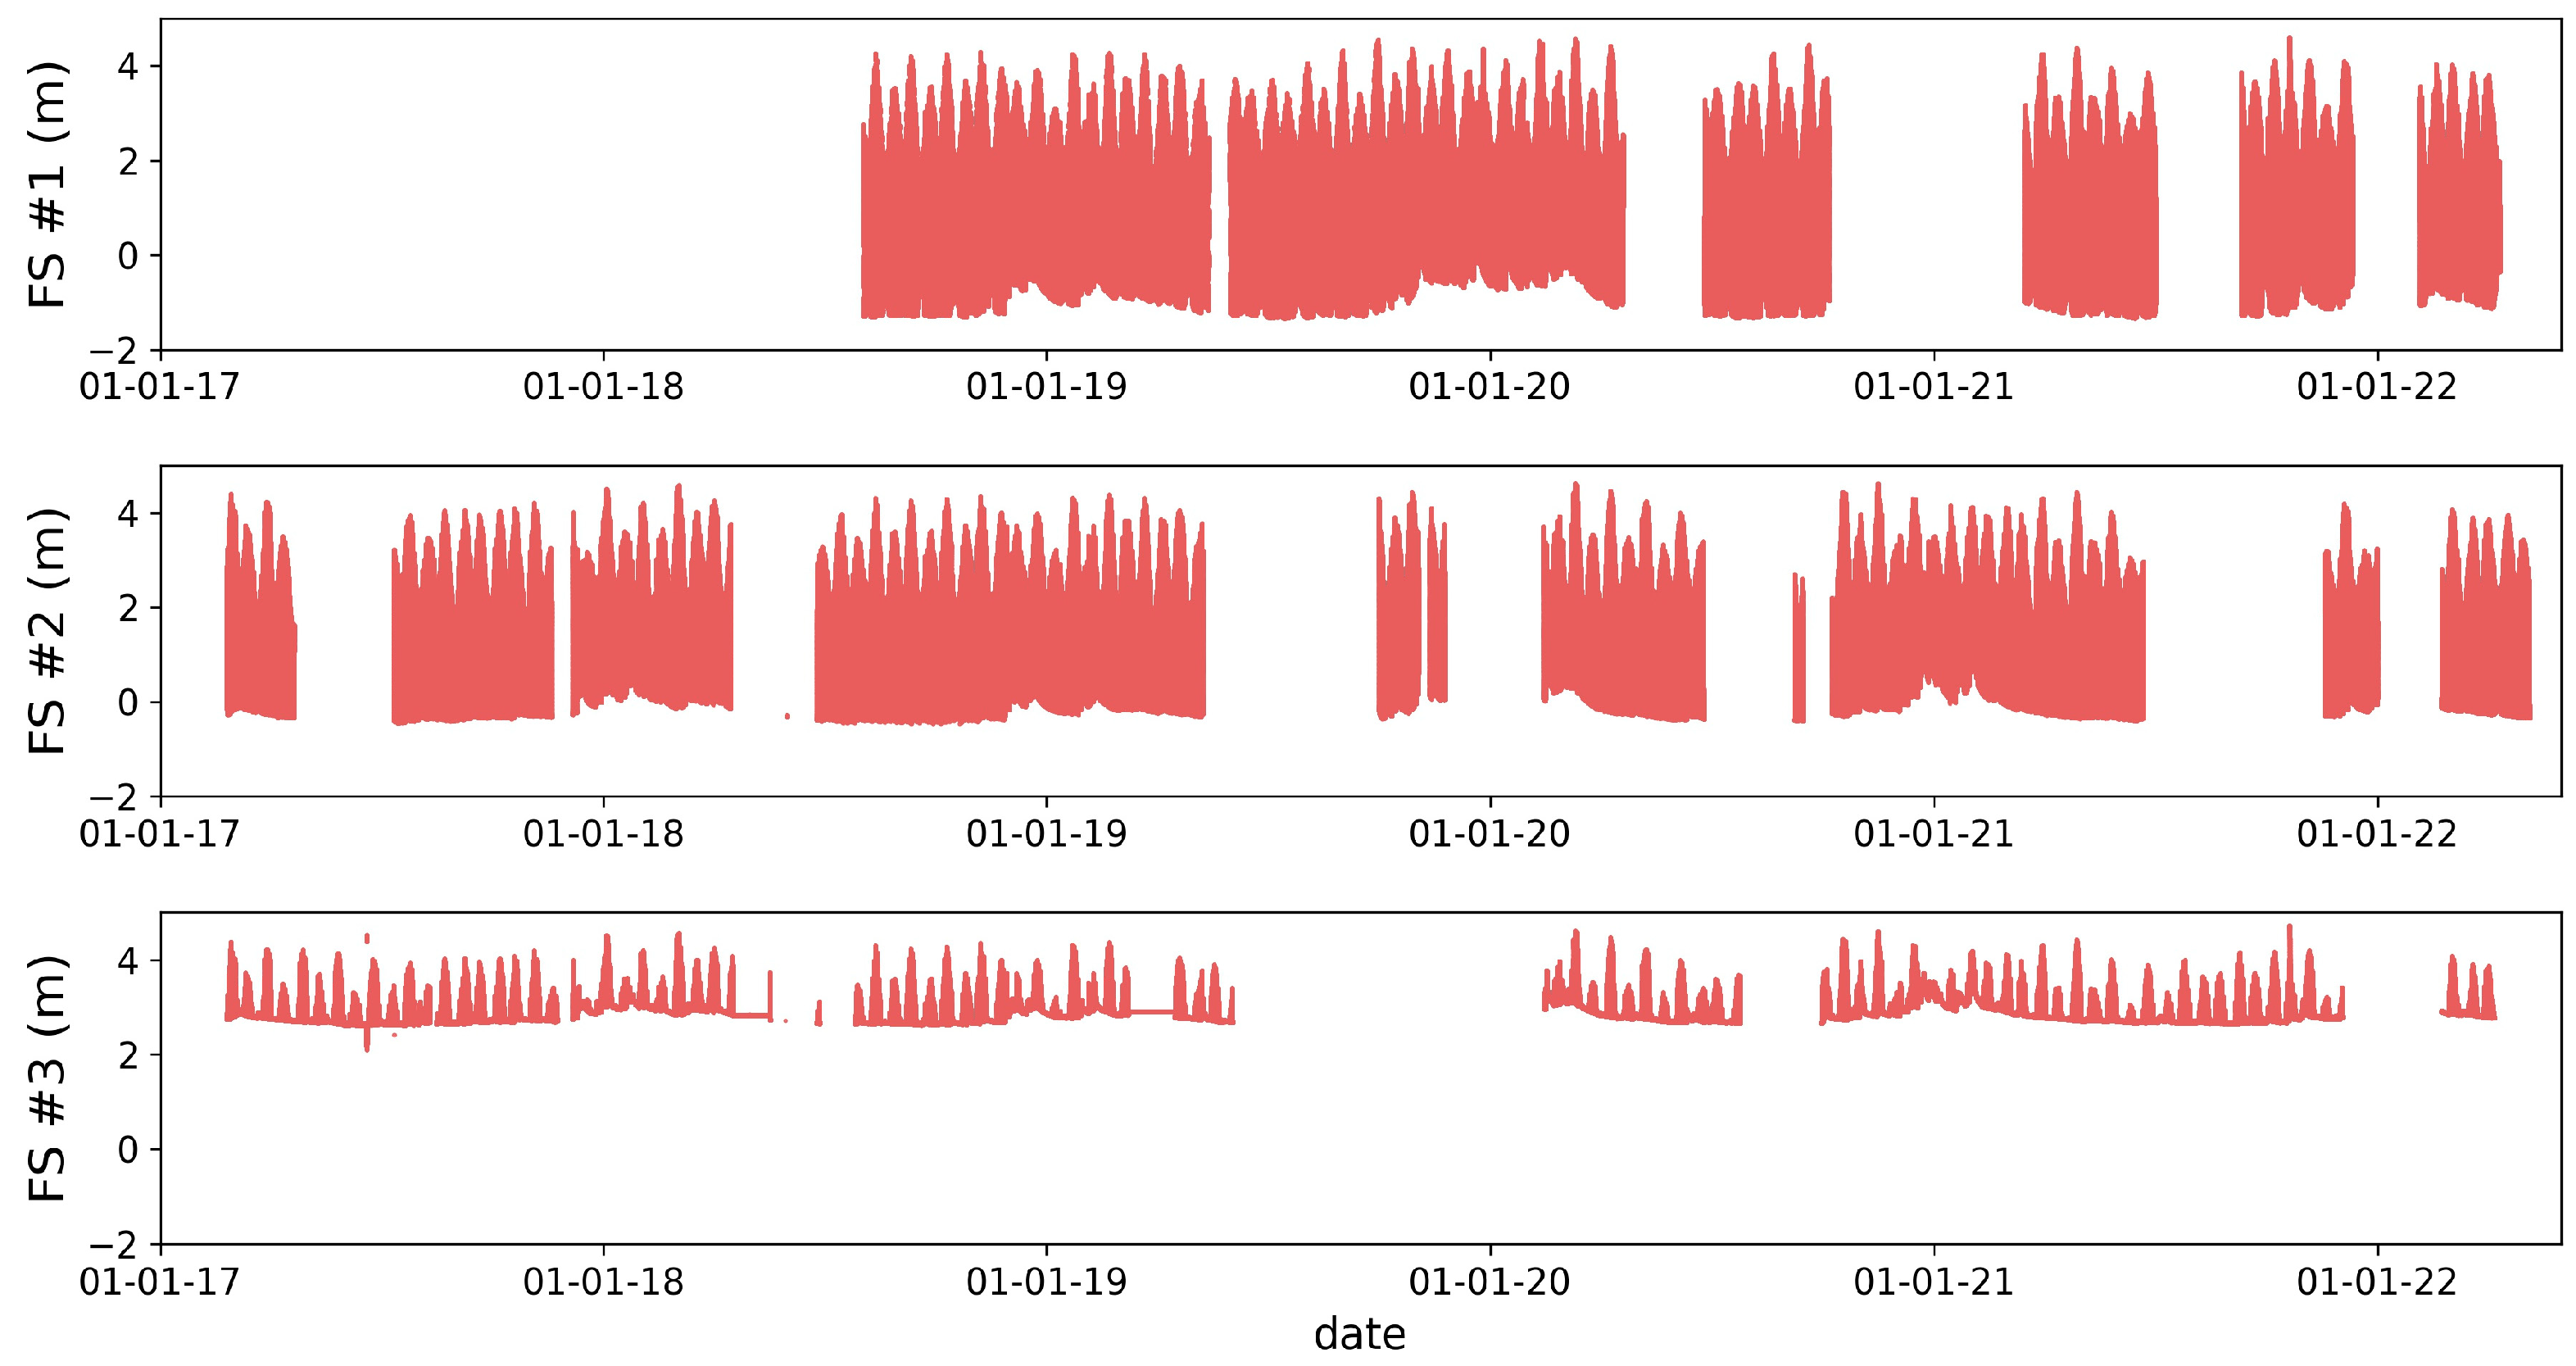
4.1. Seiches Oscillations along the Elorn Estuary
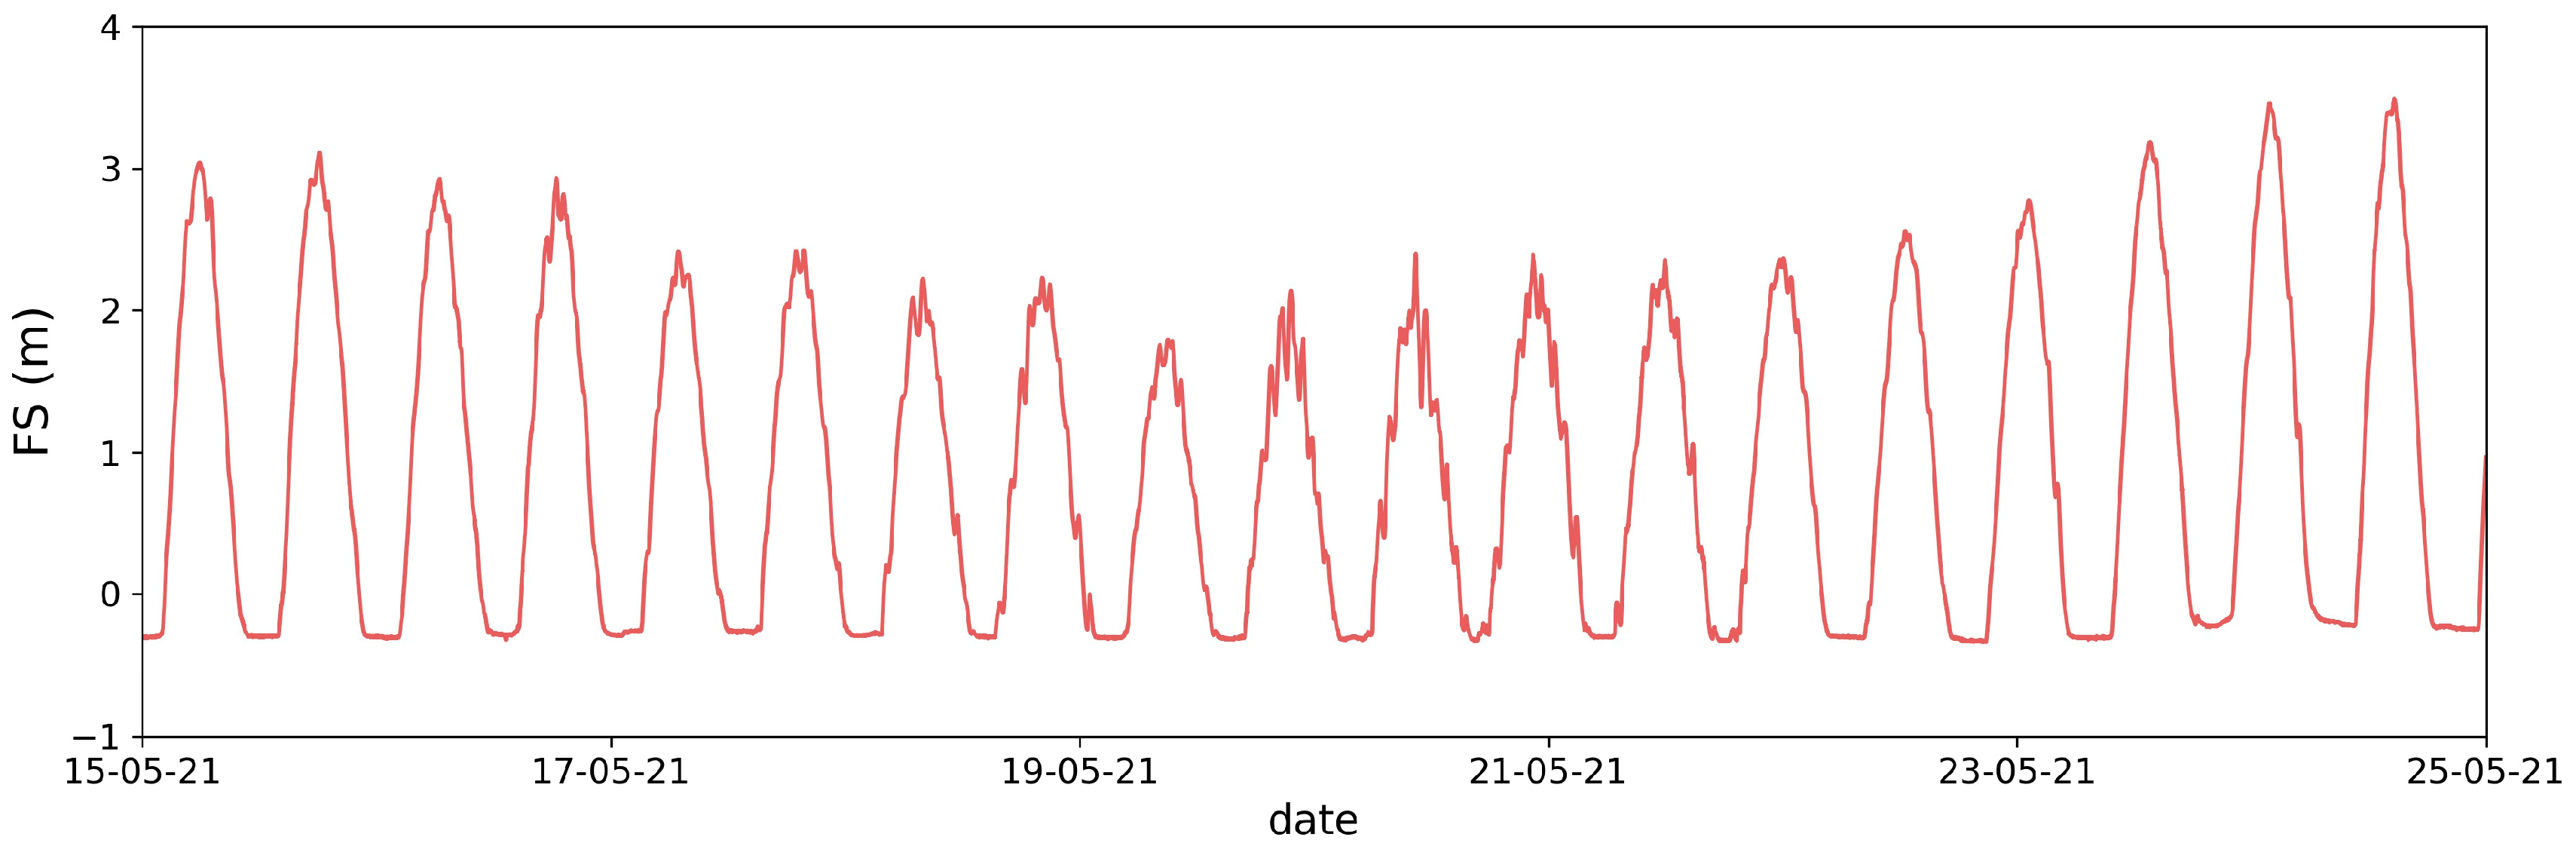
4.2. Seiches Evolution with respect to Tidal Conditions
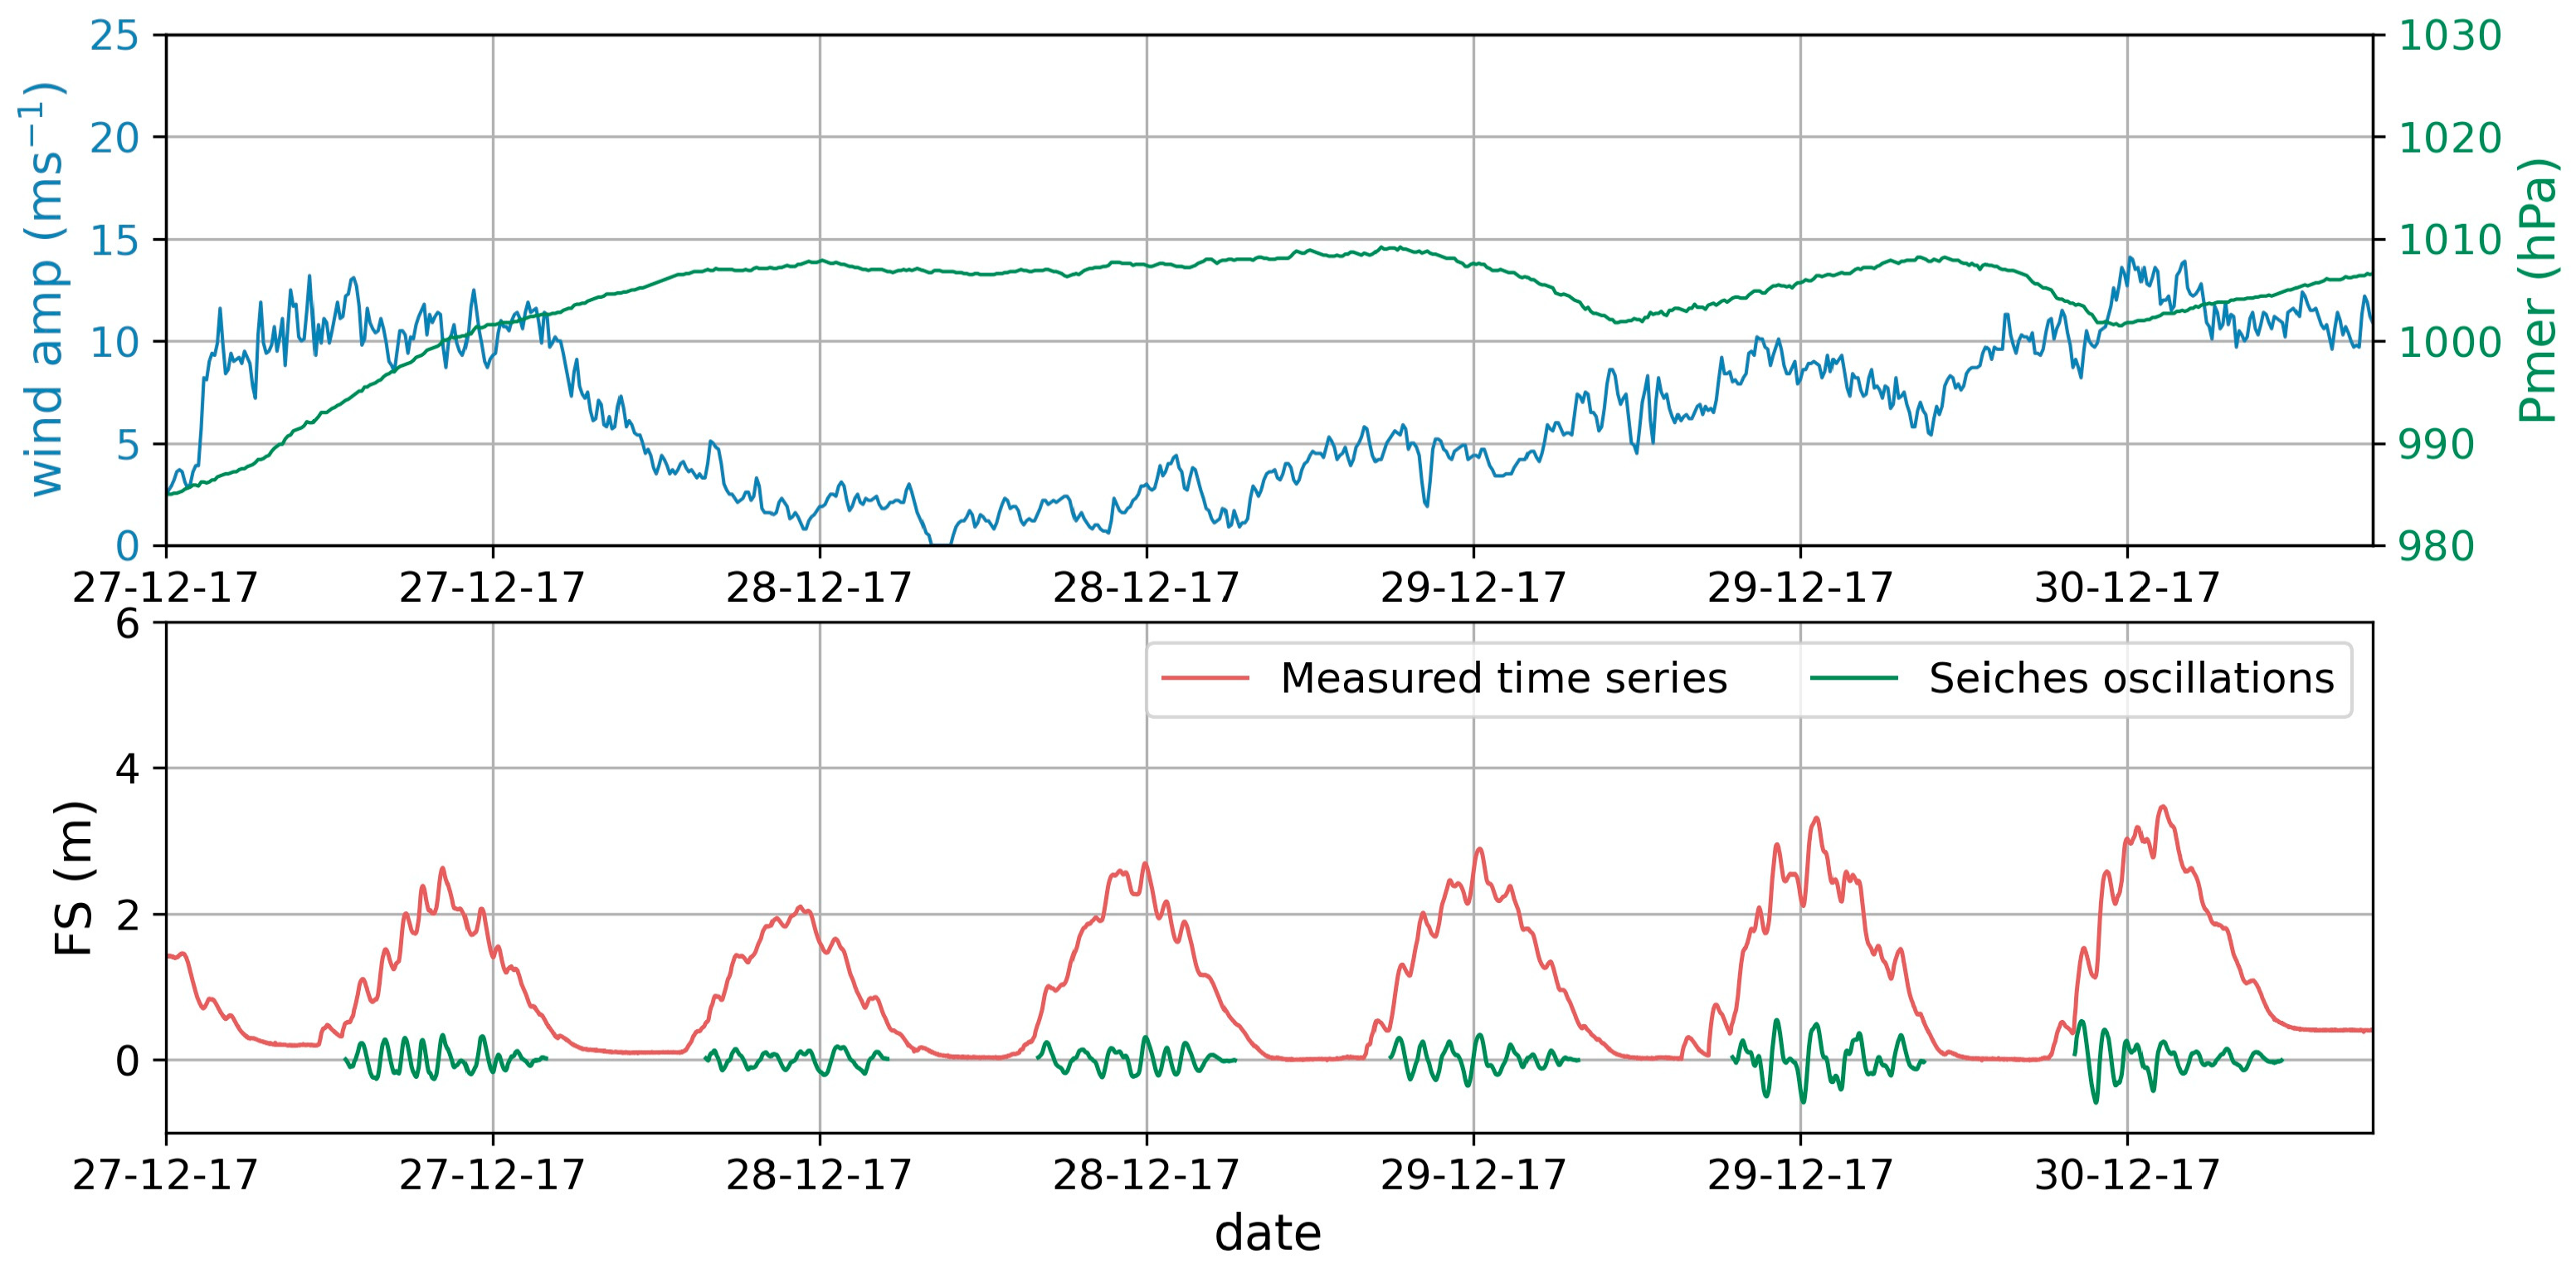
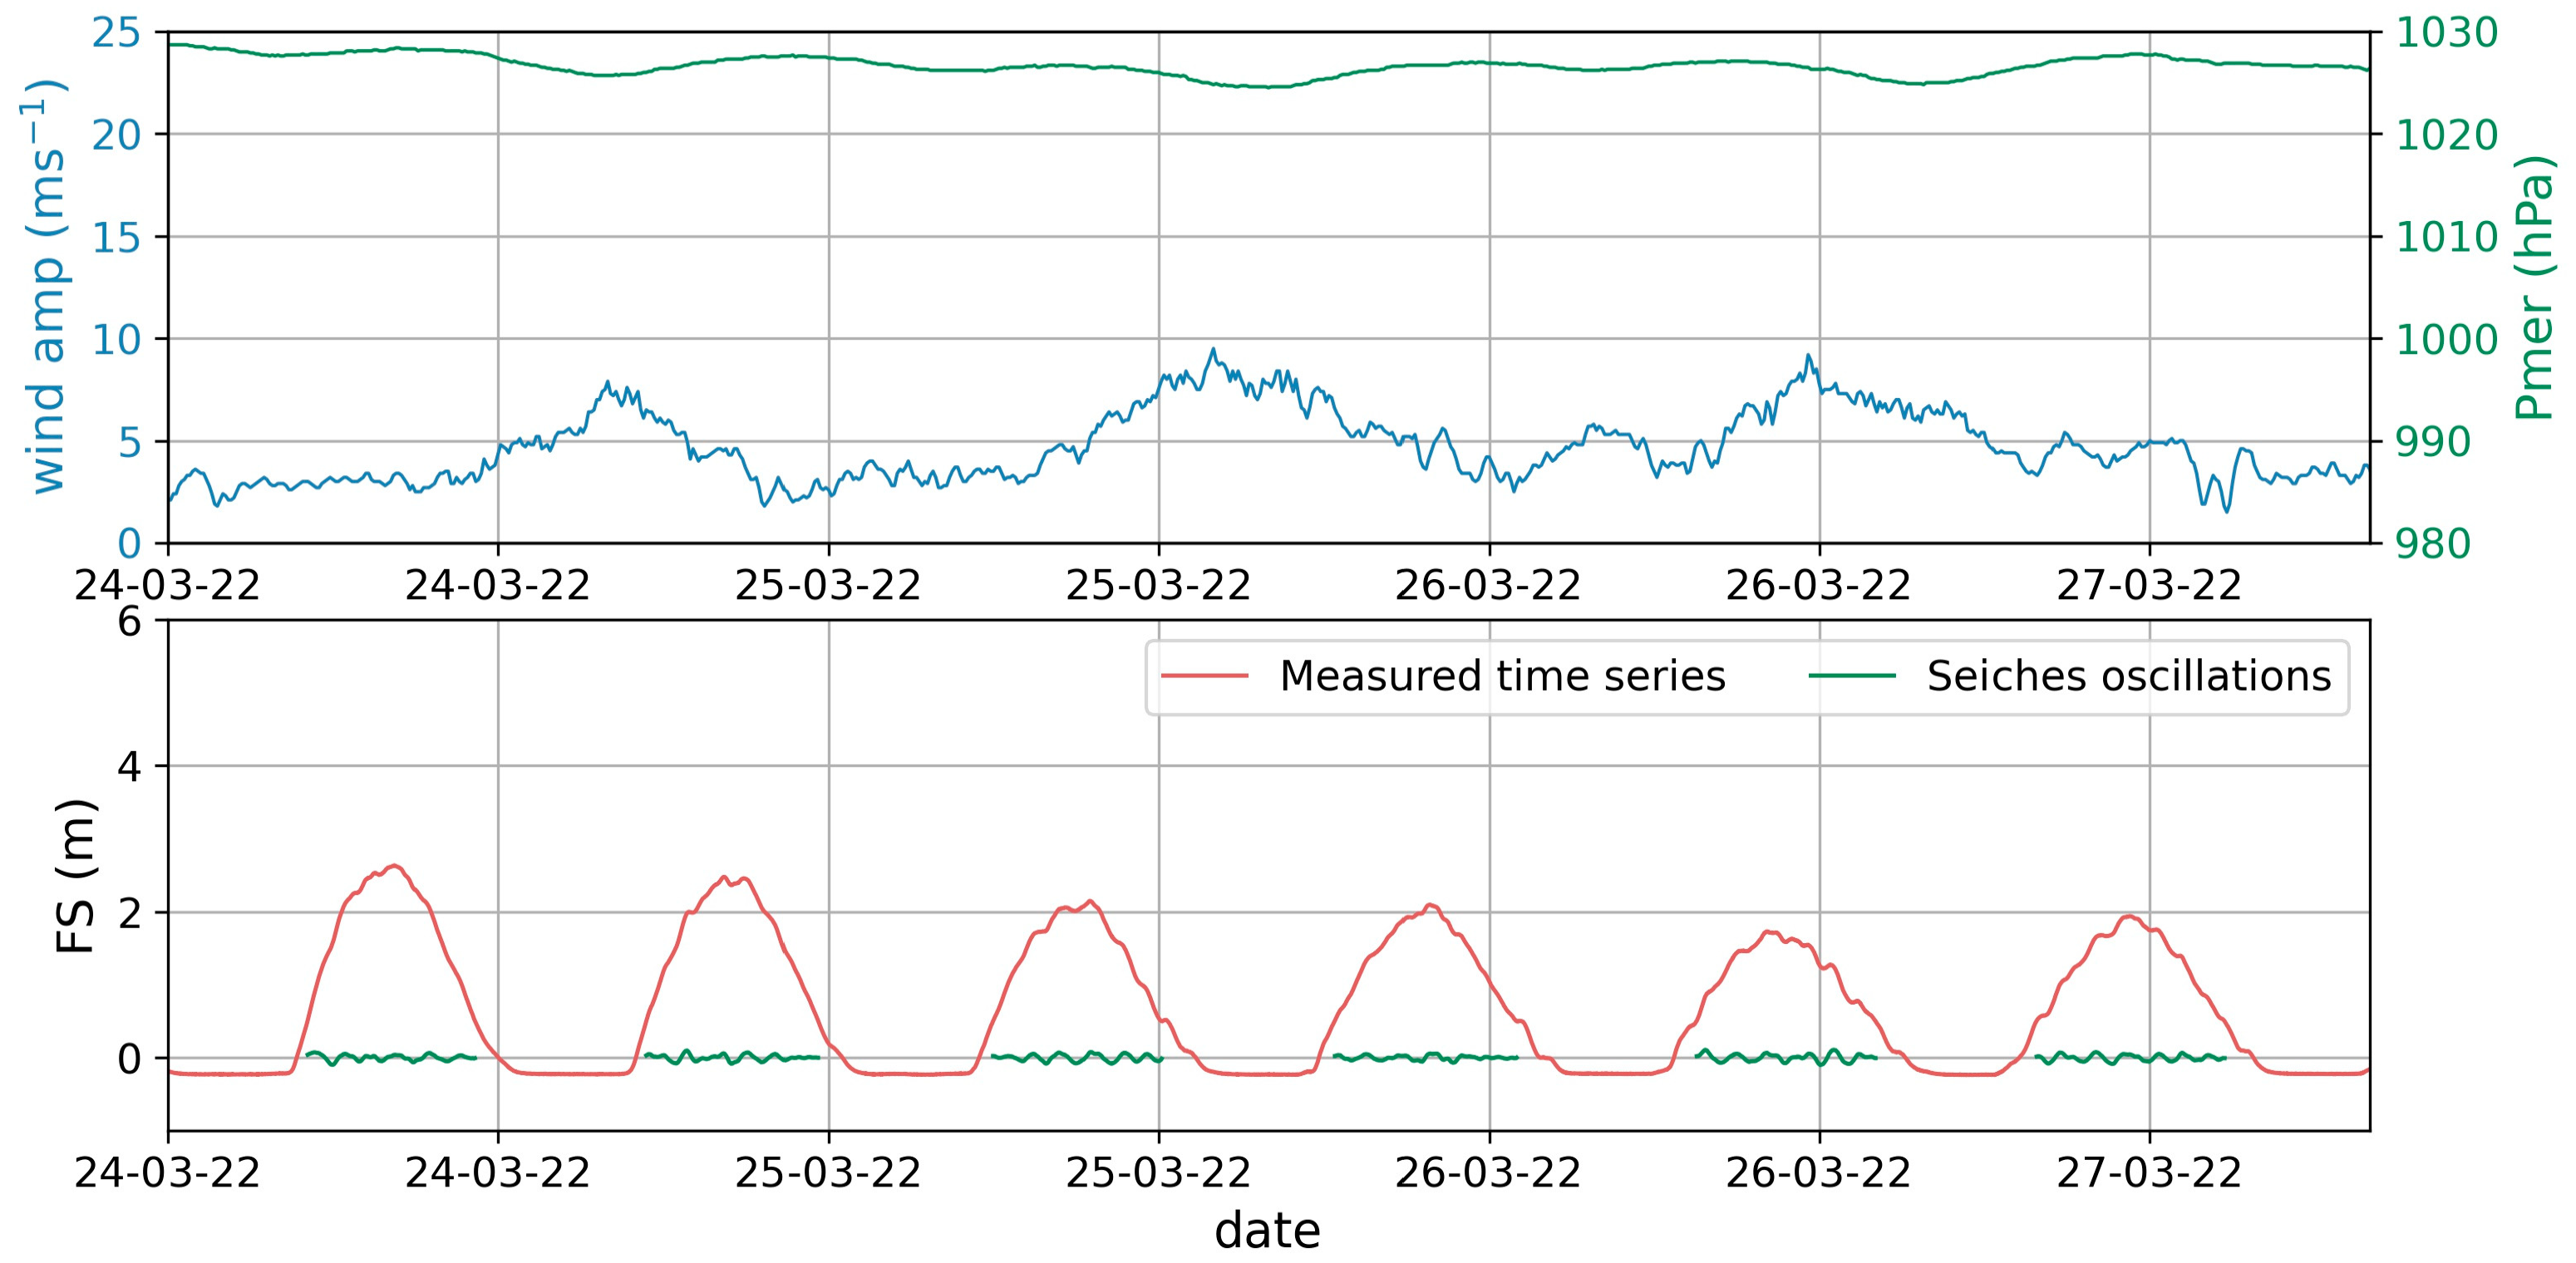
4.3. Relationship with Meteorological Data
5. Conclusions
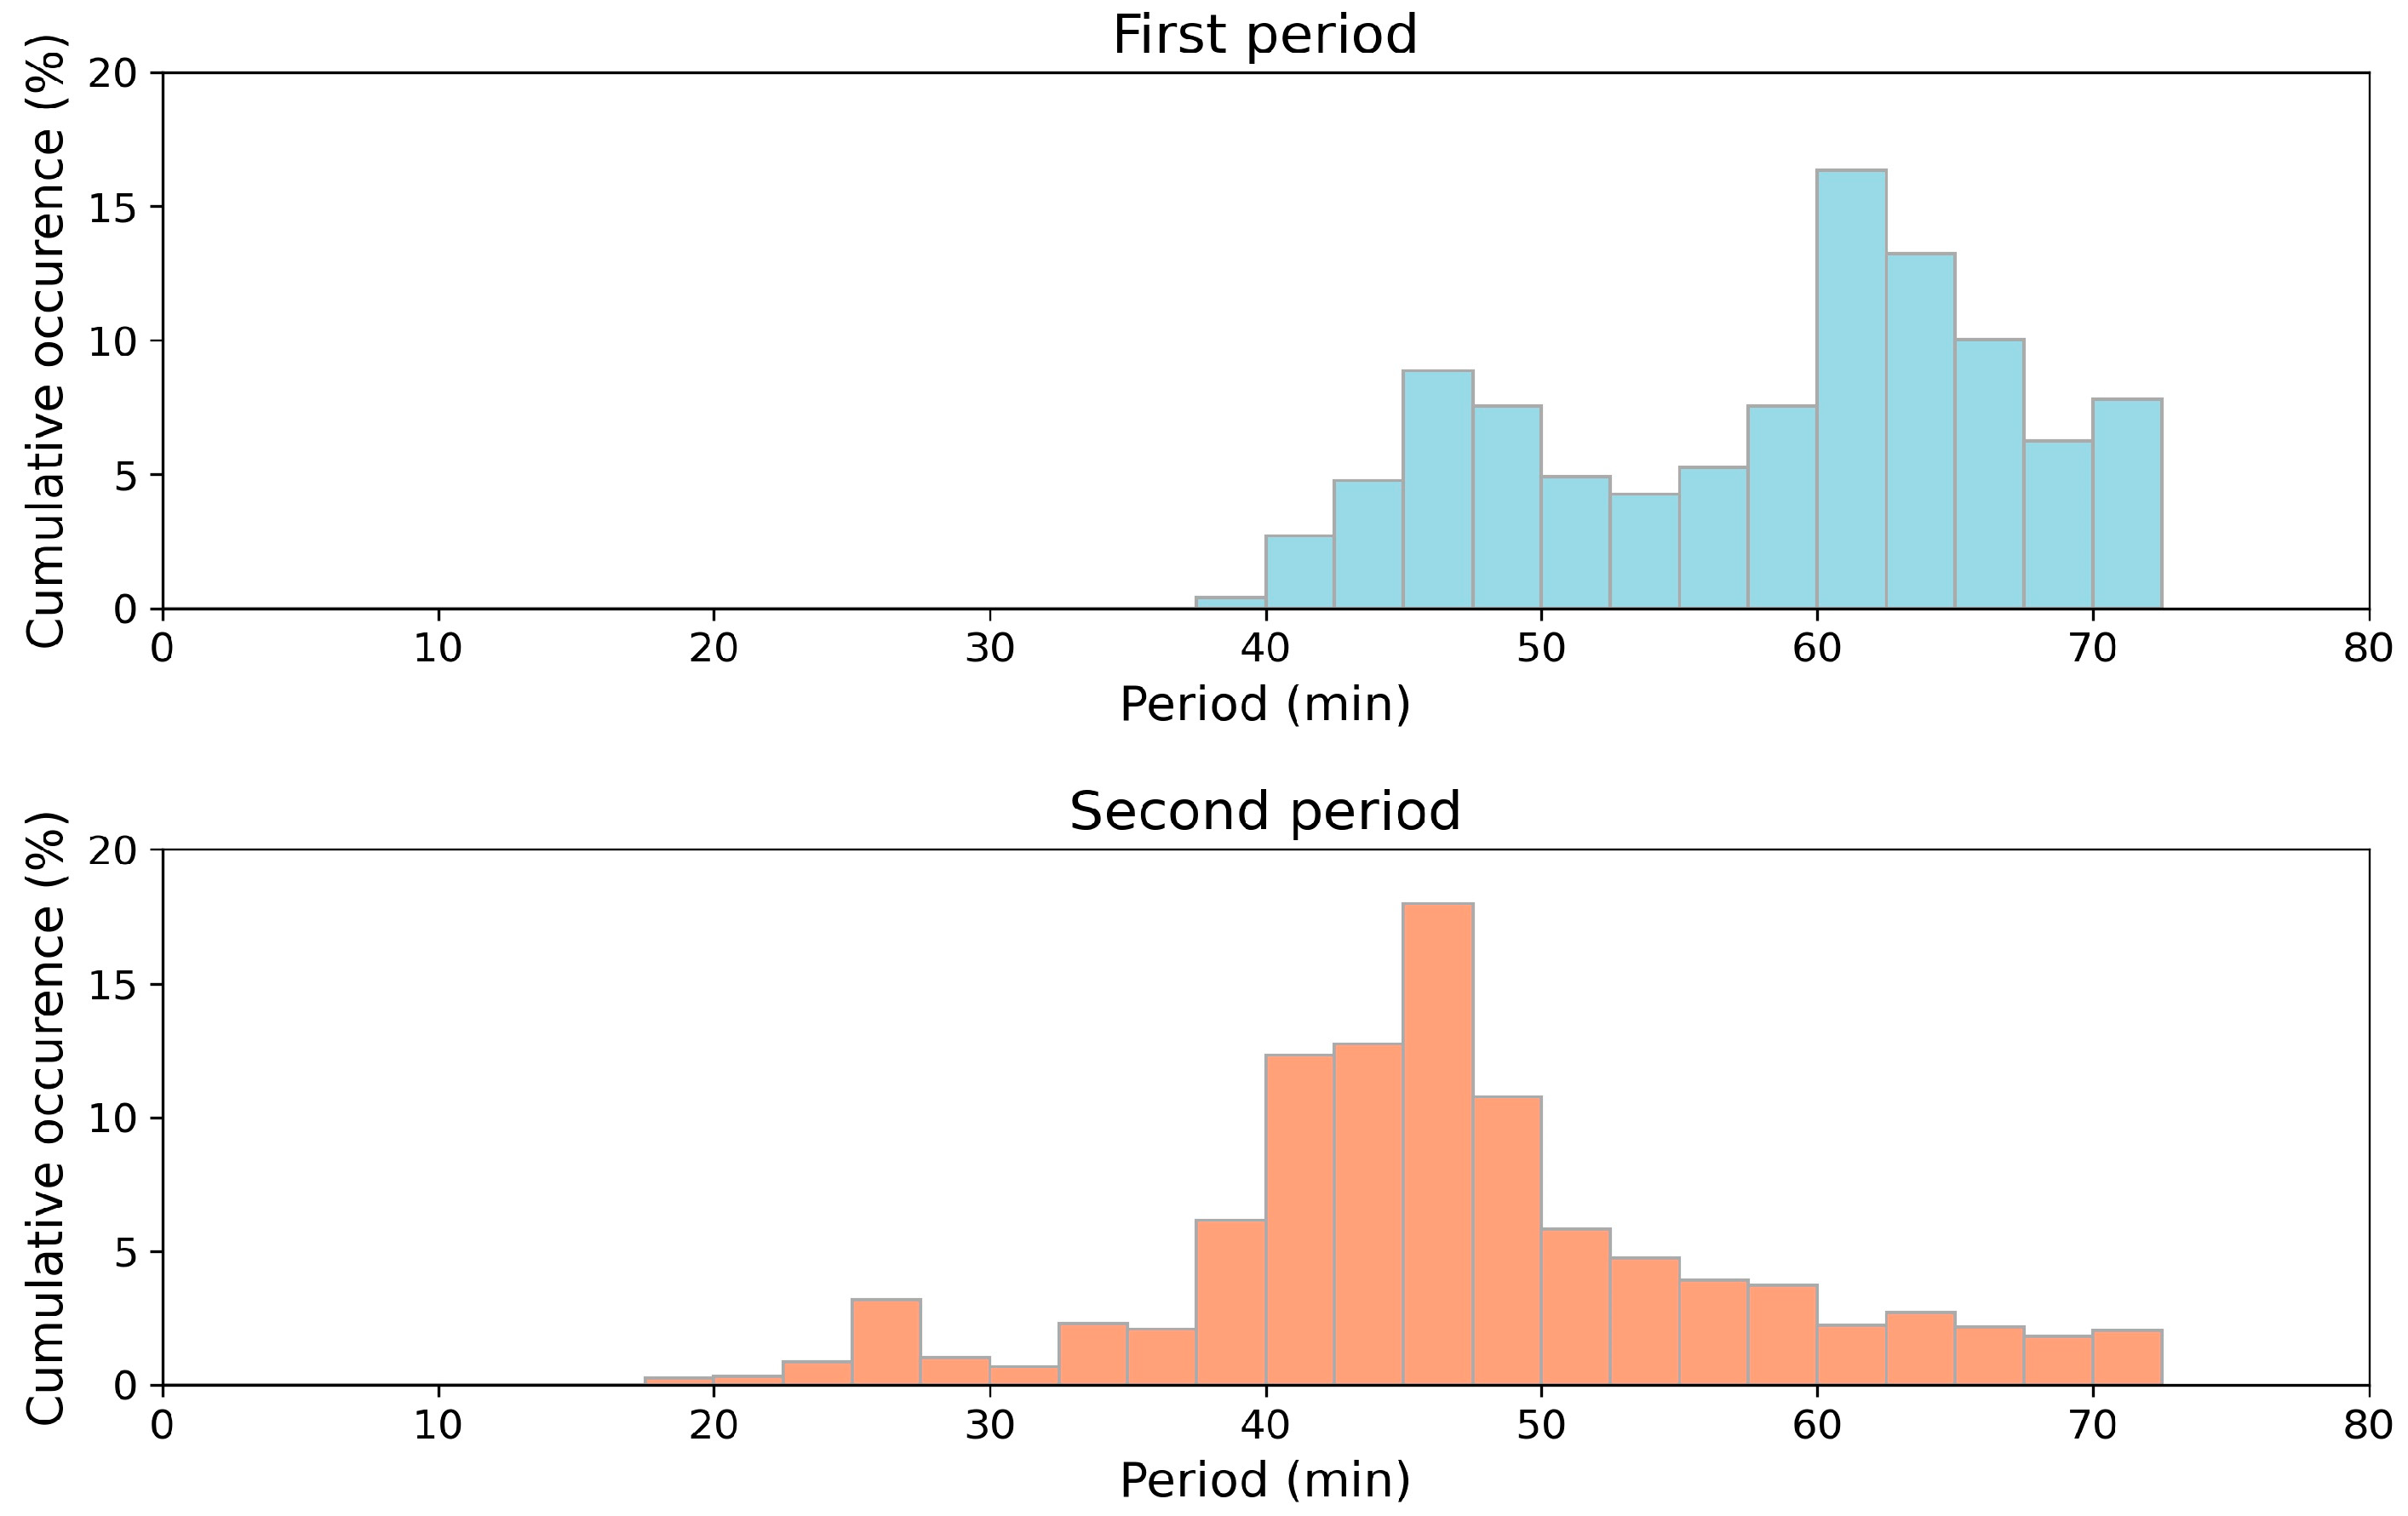
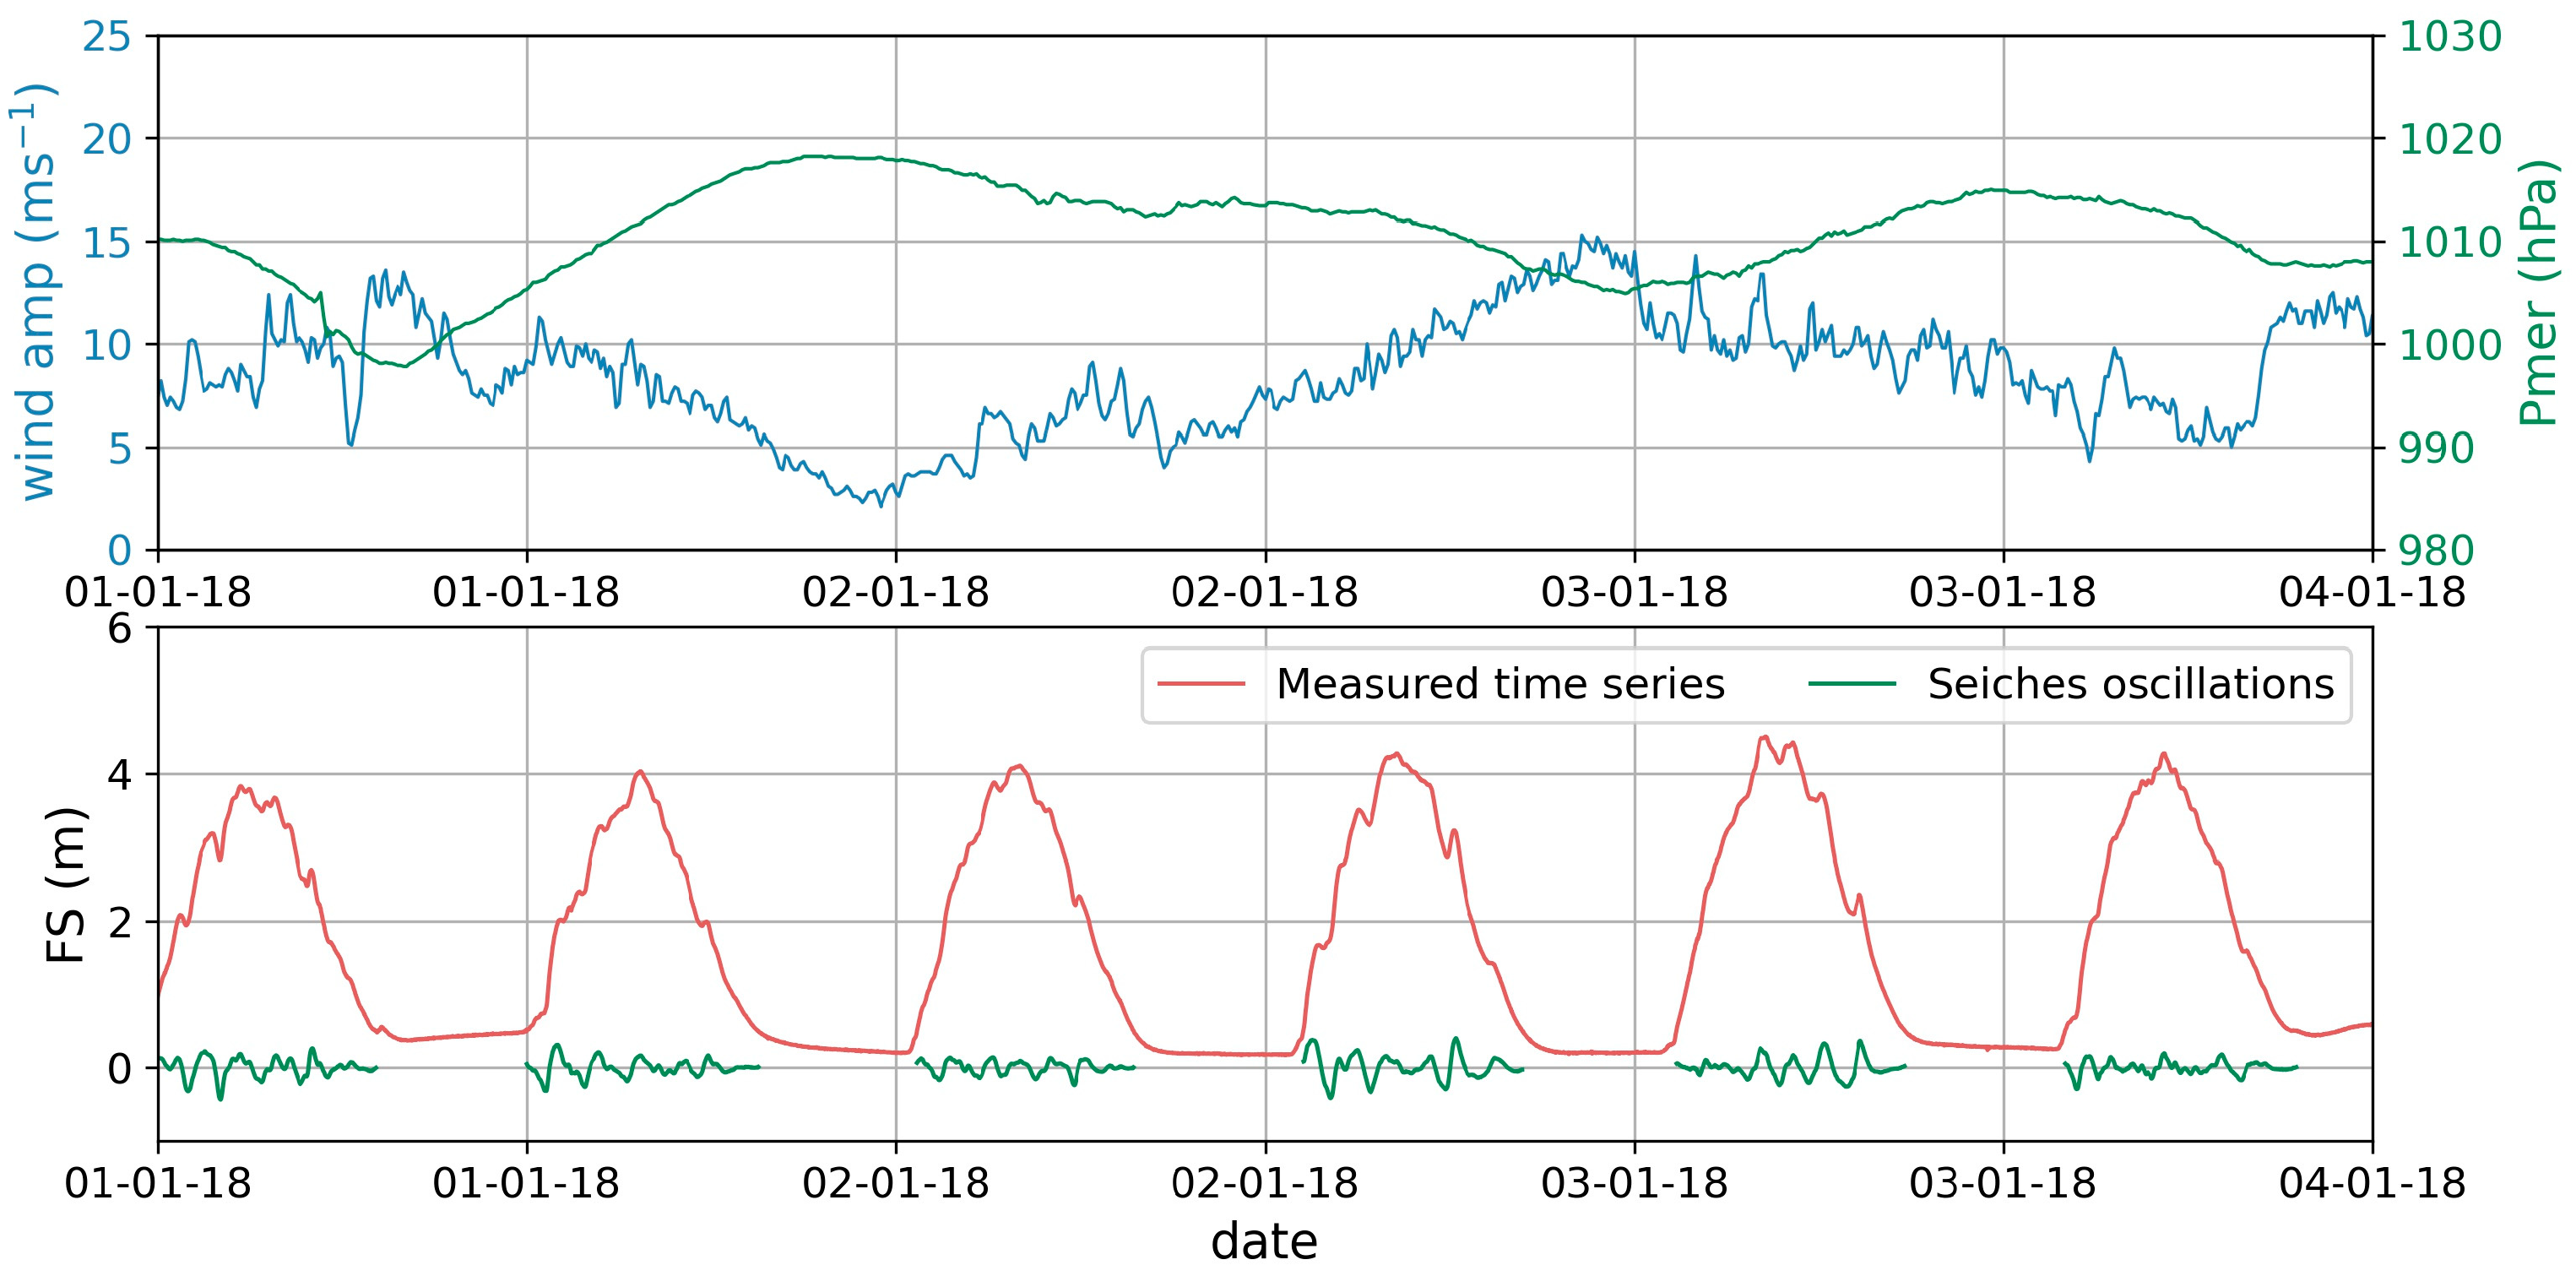
- Seiches oscillations were mainly identified in the upper part of the Elorn estuary, around high tide, with heights liable to exceed 0.6 m and apparent periods of around 45–70 min in the city of Landerneau.
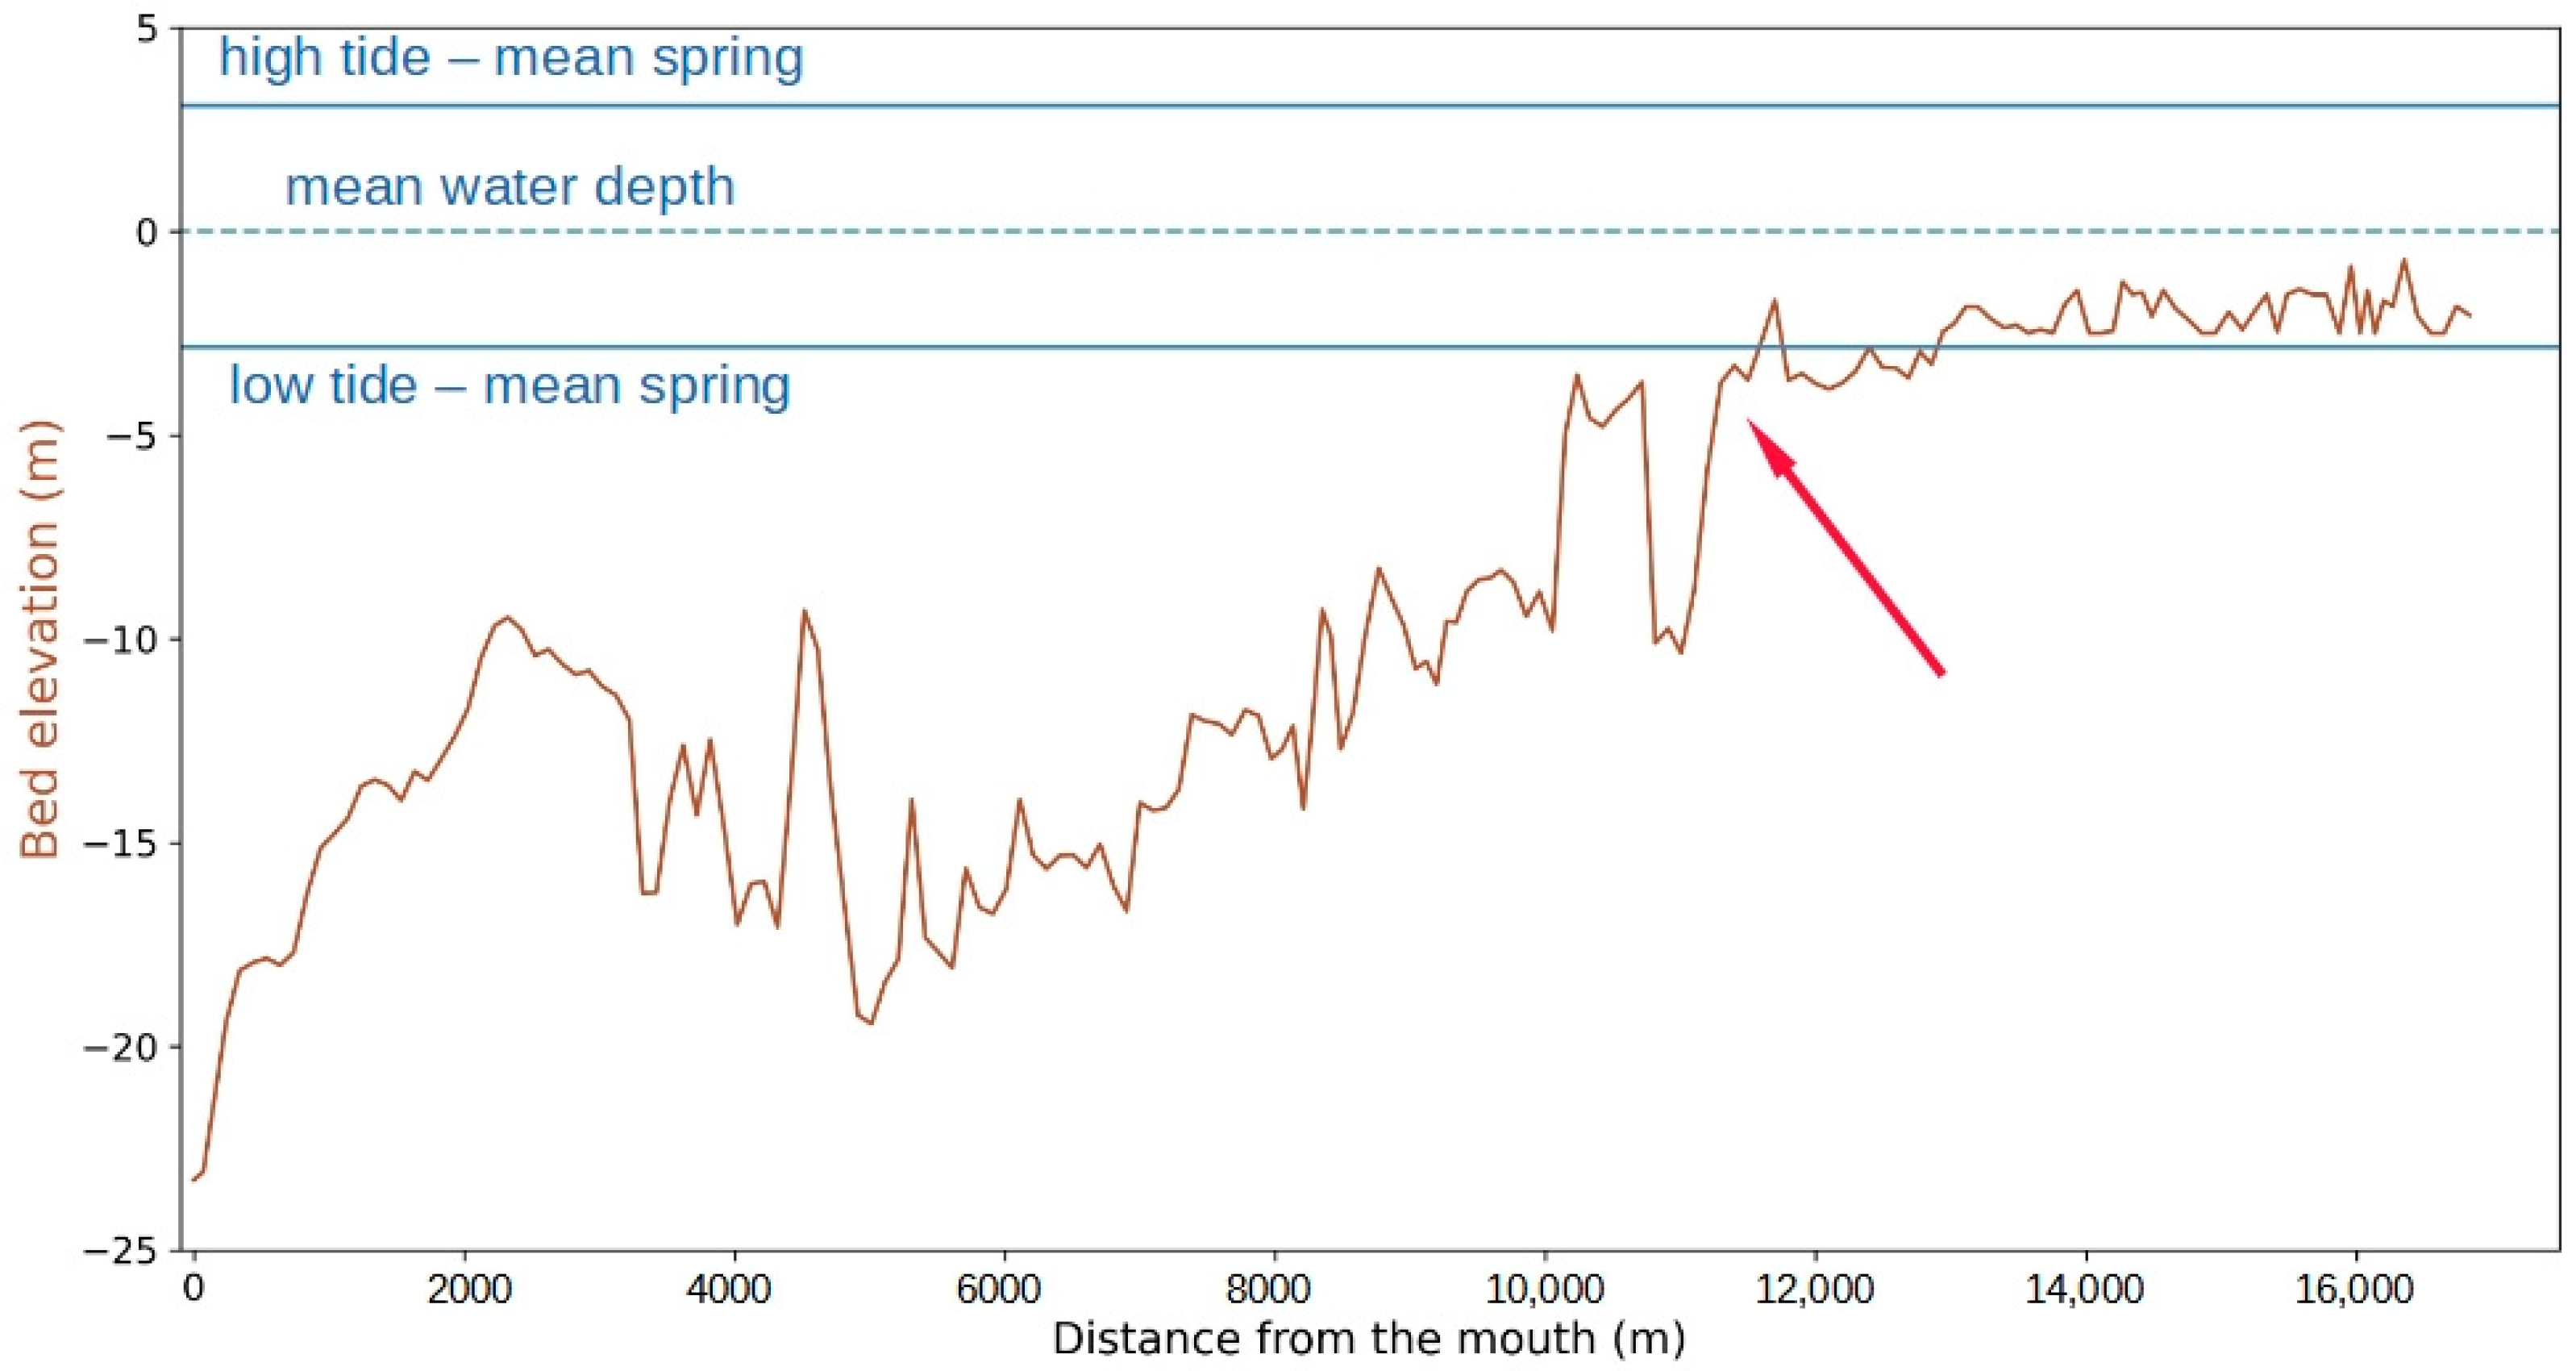
- The estuarine bathymetry is characterized by a bottom slope break at around 5.5 km from the entrance of the city, which may explain a part of seiches oscillations. Thus, it was suggested that the upper estuary was operating as a “quarter-wave” resonator, increasing short-period oscillations such as seiches.
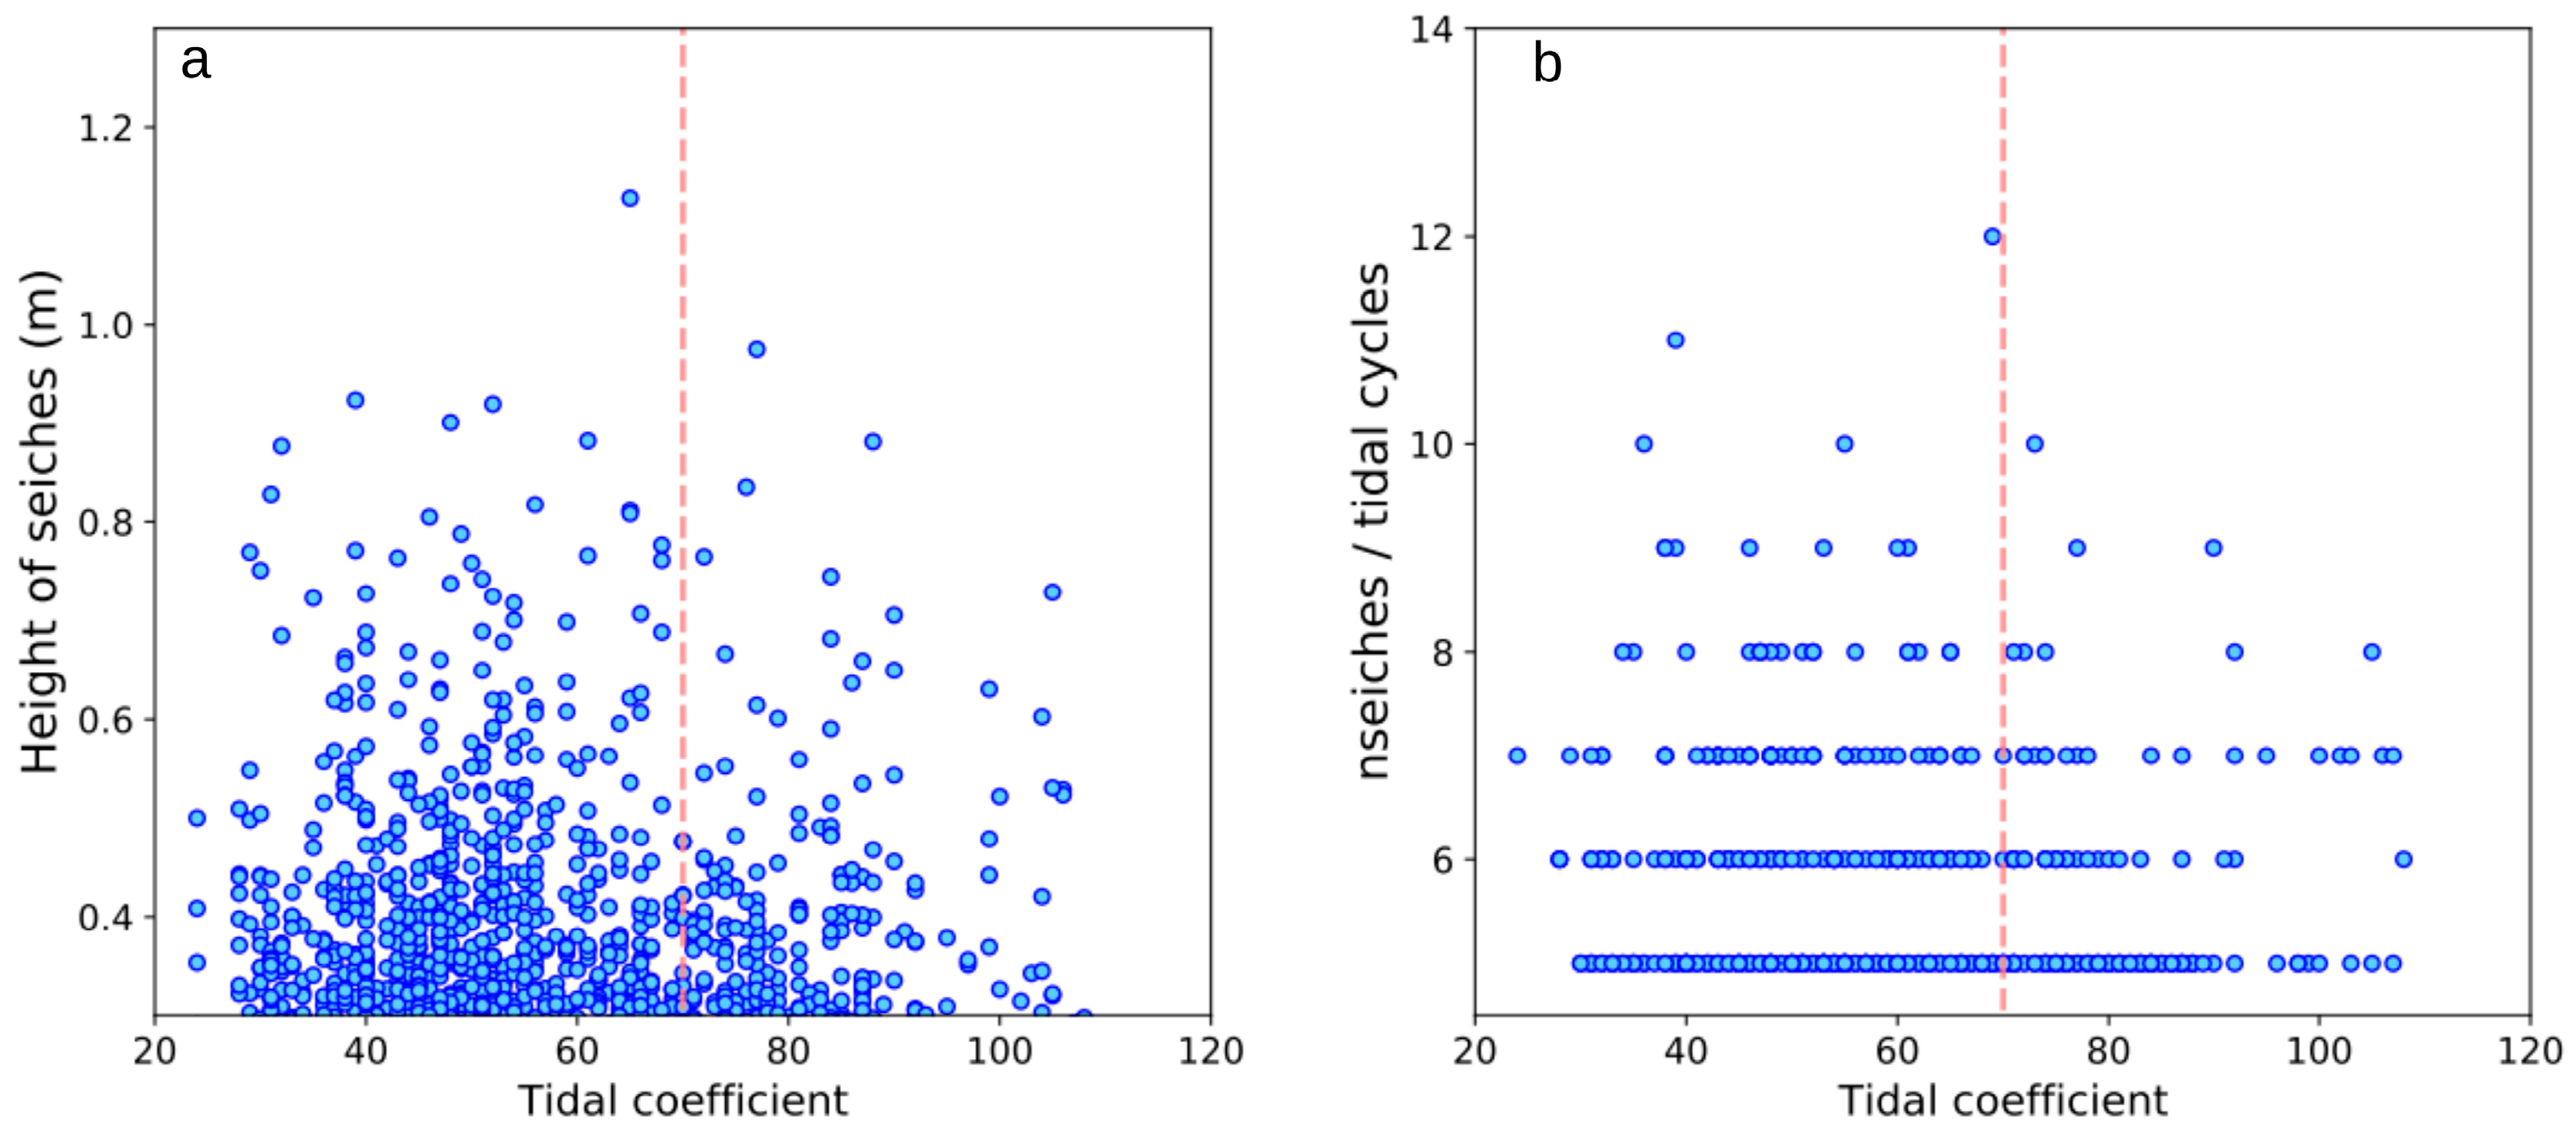
- Seiches were characterized by a fortnightly periodicity with a tendency for an increased number of oscillations and associated heights liable to exceed 0.8 m during neap tides. A clear contrast was, however, exhibited between (i) our investigation in a nearshore estuarine environment and (ii) previous studies that exhibited such neap-spring variations in seiches oscillations in coastal open locations, seemingly attributed to tide-generated internal waves from distant sources (typically the shelf break).
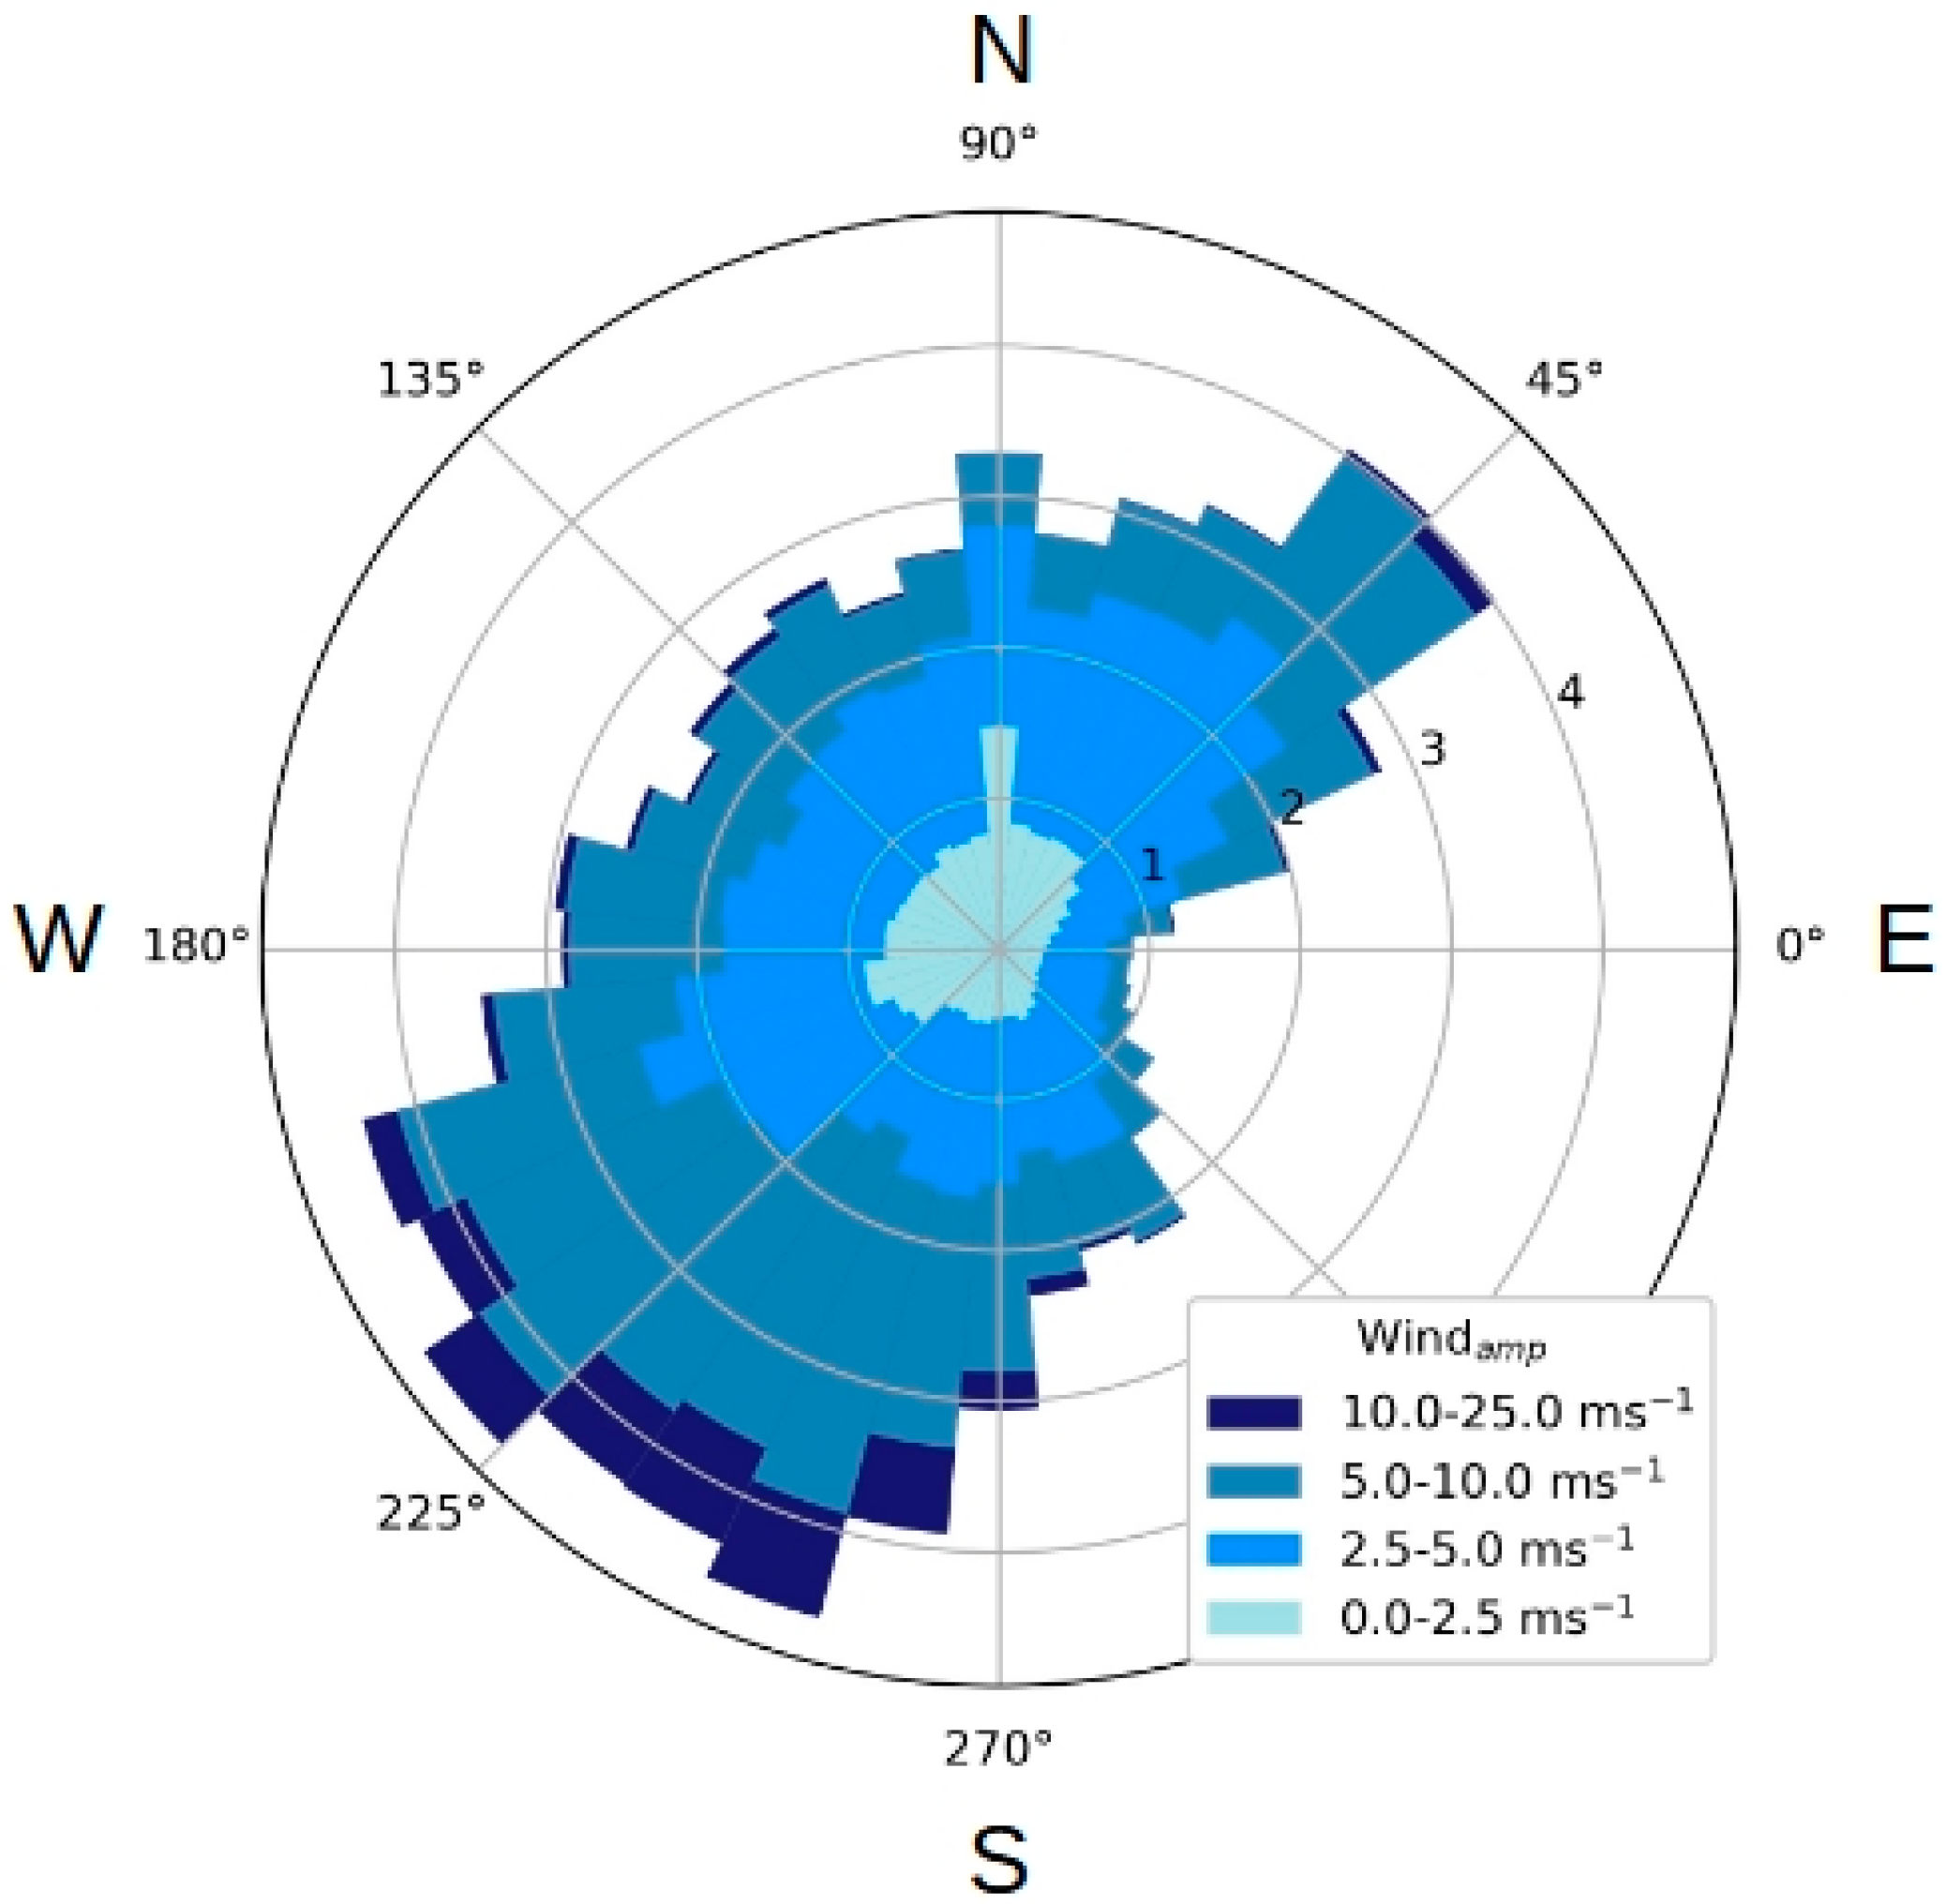
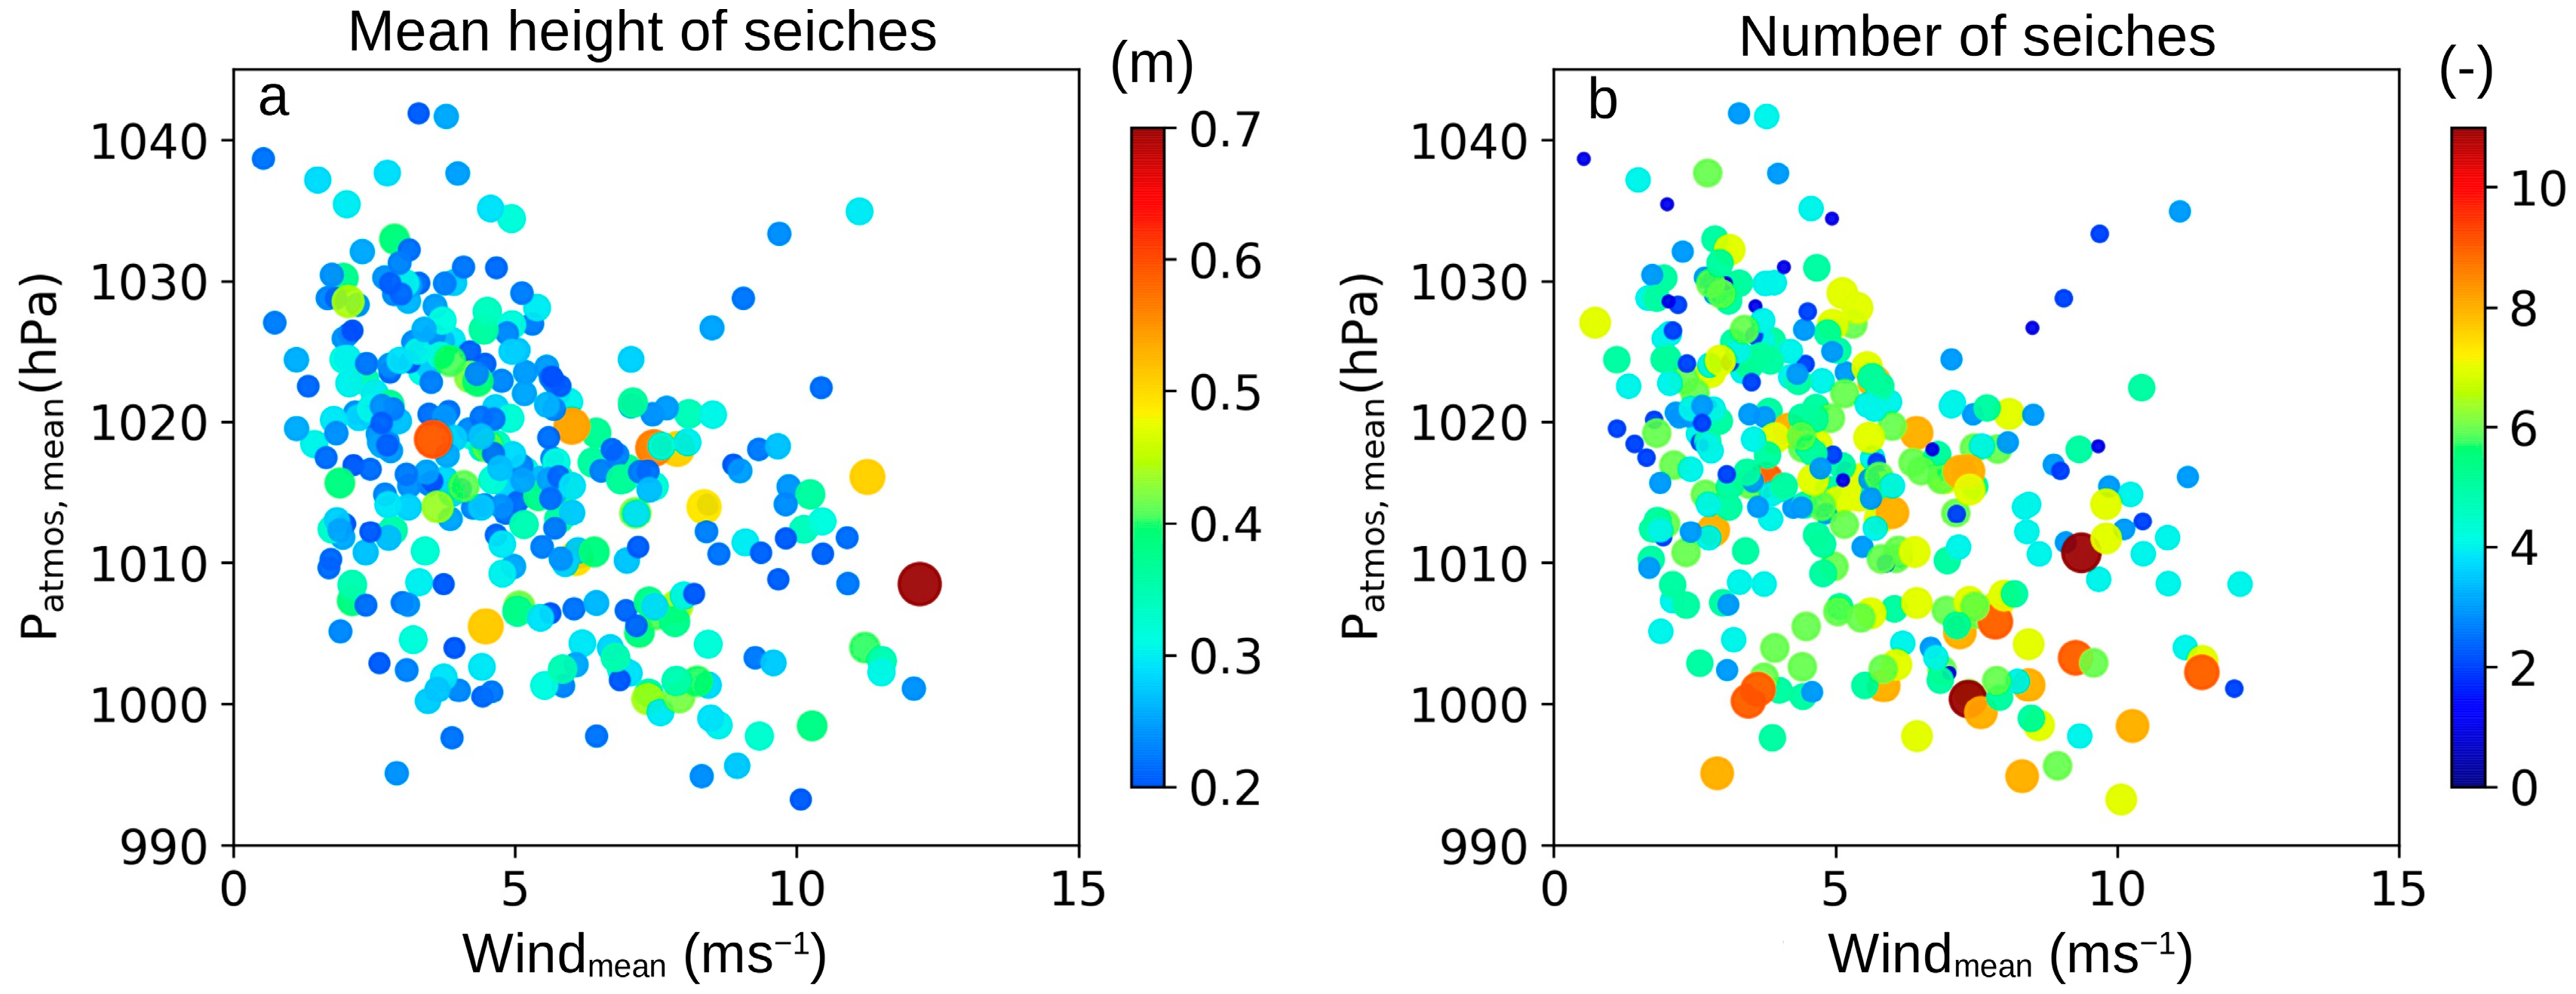
- Fortnightly seiches variations appeared further disturbed by additional exciting sources, including especially the effects of meteorological conditions. Thus, we obtained an increased number of oscillations in strong wind conditions.
- These effects were particularly noticeable in low atmospheric pressure regimes, suggesting that cyclonic events were propitious to the occurrence of seiches in this estuarine environment.
Author Contributions
Funding
Institutional Review Board Statement
Informed Consent Statement
Data Availability Statement
Acknowledgments
Conflicts of Interest
References
- Biesel, F.; Le Méhauté, B. Preliminary Remarks on Seiches and Seiche Waves—The Problem of Their Origin. Houille Blanche 1955, 41, 759–774. [Google Scholar] [CrossRef]
- Uncles, R.J.; Stephens, J.A.; Harris, C. Infragravity Currents in a Small Ría: Estuary-Amplified Coastal Edge Waves? Estuar. Coast. Shelf Sci. 2014, 150, 242–251. [Google Scholar] [CrossRef]
- Monserrat, S.; Ibbetson, A.; Thorpe, A.J. Atmospheric Gravity Waves and the ‘Rissaga’ Phenomenon. Q. J. Royal. Meteorol. Soc. 1991, 117, 553–570. [Google Scholar] [CrossRef]
- Cerralbo, P.; Grifoll, M.; Espino, M. Hydrodynamic Response in a Microtidal and Shallow Bay under Energetic Wind and Seiche Episodes. J. Mar. Syst. 2015, 149, 1–13. [Google Scholar] [CrossRef]
- Harrow-Lyle, T.J.; Chomicki, K.M.; Kirkwood, A.E. Modelling the Influence of Seiche-Events on Phosphorous-Loading Dynamics in Three Lake Ontario Coastal Wetlands. J. Great Lakes Res. 2023, 49, 429–439. [Google Scholar] [CrossRef]
- Jordi, A.; Basterretxea, G.; Casas, B.; Anglès, S.; Garcés, E. Seiche-Forced Resuspension Events in a Mediterranean Harbour. Cont. Shelf Res. 2008, 28, 505–515. [Google Scholar] [CrossRef]
- Juez, C.; Navas-Montilla, A. Numerical Characterization of Seiche Waves Energy Potential in River Bank Lateral Embayments. Renew. Energy 2022, 186, 143–156. [Google Scholar] [CrossRef]
- Mortimer, C.H. Water Movements in Lakes during Summer Stratification; Evidence from the Distribution of Temperature in Windermere. Phil. Trans. R. Soc. Lond. B 1952, 236, 355–398. [Google Scholar] [CrossRef]
- Alpar, B.; Yüce, H. Sea-Level Variations in the Eastern Coasts of the Aegean Sea. Estuar. Coast. Shelf Sci. 1996, 42, 509–521. [Google Scholar] [CrossRef]
- Giese, G.S.; Hollander, R.B.; Fancher, J.E.; Giese, B.S. Evidence of Coastal Seiche Excitation by Tide-Generated Internal Solitary Waves. Geophys. Res. Lett. 1982, 9, 1305. [Google Scholar] [CrossRef]
- Chapman, D.C.; Giese, G.S. A Model for the Generation of Coastal Seiches by Deep-Sea Internal Waves. J. Phys. Oceanogr. 1990, 20, 1459–1467. [Google Scholar] [CrossRef]
- Cushman-Roisin, B.; Willmott, A.J.; Biggs, N.R.T. Influence of Stratification on Decaying Surface Seiche Modes. Cont. Shelf Res. 2005, 25, 227–242. [Google Scholar] [CrossRef]
- Ardhuin, F.; Devaux, E.; Pineau-Guillou, L. Observation et Prévision Des Seiches Sur La Côte Atlantique Française | Semantic Scholar. In Proceedings of the XIèmes Journées Nationales Génie Côtier—Génie Civil, Les Sables d’Olonne, France, 22–25 June 2010. [Google Scholar]
- De Jong, M.P.C.; Battjes, J.A. Seiche Characteristics of Rotterdam Harbour. Coast. Eng. 2004, 51, 373–386. [Google Scholar] [CrossRef]
- Okihiro, M.; Guza, R.T.; Seymour, R.J. Excitation of Seiche Observed in a Small Harbor. J. Geophys. Res. 1993, 98, 18201. [Google Scholar] [CrossRef]
- Okihiro, M.; Guza, R.T. Observations of Seiche Forcing and Amplification in Three Small Harbors. J. Waterw. Port Coast. Ocean Eng. 1996, 122, 232–238. [Google Scholar] [CrossRef]
- Wu, J.; Tsanis, I.K.; Chiocchio, F. Observed Currents and Water Levels in Hamilton Harbour. J. Great Lakes Res. 1996, 22, 224–240. [Google Scholar] [CrossRef]
- Cerralbo, P.; Grifoll, M.; Valle-Levinson, A.; Espino, M. Tidal Transformation and Resonance in a Short, Microtidal Mediterranean Estuary (Alfacs Bay in Ebre Delta). Estuar. Coast. Shelf Sci. 2014, 145, 57–68. [Google Scholar] [CrossRef]
- Chaigneau, A.; Okpeitcha, O.V.; Morel, Y.; Stieglitz, T.; Assogba, A.; Benoist, M.; Allamel, P.; Honfo, J.; Awoulmbang Sakpak, T.D.; Rétif, F.; et al. From Seasonal Flood Pulse to Seiche: Multi-Frequency Water-Level Fluctuations in a Large Shallow Tropical Lagoon (Nokoué Lagoon, Benin). Estuar. Coast. Shelf Sci. 2022, 267, 107767. [Google Scholar] [CrossRef]
- Niedda, M.; Greppi, M. Tidal, Seiche and Wind Dynamics in a Small Lagoon in the Mediterranean Sea. Estuar. Coast. Shelf Sci. 2007, 74, 21–30. [Google Scholar] [CrossRef]
- Reynolds-Fleming, J.V.; Luettich, R.A. Wind-Driven Lateral Variability in a Partially Mixed Estuary. Estuar. Coast. Shelf Sci. 2004, 60, 395–407. [Google Scholar] [CrossRef]
- Suara, K.; Brown, R.; Chanson, H. Characteristics of Flow Fluctuations in a Tide-Dominated Estuary: Application of Triple Decomposition Technique. Estuar. Coast. Shelf Sci. 2019, 218, 119–130. [Google Scholar] [CrossRef]
- Le Hir, P.; Breton, M.; L’Yavanc, J. Amélioration de La Salubrité Des Eaux Conchylicoles de l’Estuaire de l’Elorn et Du Nord de La Rade de Brest-Etude Du Milieu Marin; IFREMER: Plouzané, France, 1987; p. 221. [Google Scholar]
- Beudin, A.; Chapalain, G.; Guillou, N. Modelling Dynamics and Exchanges of Fine Sediments in the Bay of Brest. Houille Blanche 2014, 6, 47–53. [Google Scholar] [CrossRef]
- HydroPortail. 2023. Available online: https://www.Hydro.Eaufrance.Fr/Sitehydro/J3413030/Synthese (accessed on 28 June 2023).
- Tréguer, P.; Goberville, E.; Barrier, N.; L’Helguen, S.; Morin, P.; Bozec, Y.; Rimmelin-Maury, P.; Czamanski, M.; Grossteffan, E.; Cariou, T.; et al. Large and Local-Scale Influences on Physical and Chemical Characteristics of Coastal Waters of Western Europe during Winter. J. Mar. Syst. 2014, 139, 79–90. [Google Scholar] [CrossRef]
- Quéméneur, M.; Kerouel, R.; Aminot, A. Cycle de La Matière Organique Dans l’estuaire de l’Elorn et Relations Avec Les Bactéries; IFREMER: Plouzané, France, 1984; p. 46. [Google Scholar]
- Guillou, N. Rôles de l’Hétérogénéité Des Sédiments de Fond et Des Interactions Houle-Courant Sur l’Hydrodynamique et La Dynamique Sédimentaire En Zone Subtidale—Applications En Manche Orientale et à La Pointe de La Bretagne. Ph.D. Thesis, Université de Bretagne Occidentale, Brest, France, 2007. [Google Scholar]
- Bouligand, R.; Pirazzoli, P.A. Les surcotes et les décotes marines à Brest, étude statistique et évolution. Oceanol. Acta 1999, 22, 153–166. [Google Scholar] [CrossRef]
- Guillou, N.; Chapalain, G. Machine Learning Methods Applied to Sea Level Predictions in the Upper Part of a Tidal Estuary. Oceanologia 2021, 63, 531–544. [Google Scholar] [CrossRef]
- SHOM. 2023. Available online: https://www.Data.Shom.Fr (accessed on 6 May 2023).
- Simon, B. La Marée Océanique Côtière; Institut Océanographique: Paris, France, 2007. [Google Scholar]
- Wijeratne, E.M.S.; Woodworth, P.L.; Pugh, D.T. Meteorological and Internal Wave Forcing of Seiches along the Sri Lanka Coast. J. Geophys. Res. 2010, 115, C03014. [Google Scholar] [CrossRef]
- Devaux, E. Analyse Des Seiches à Partir de l’Exploitation de Données Marégraphiques—Exploitation Graphique, Analyse Fréquentielle et Recherche d’Éléments Déclencheurs; ENTPE-SHOM: Lyon, France, 2009; p. 68. [Google Scholar]
- Bowers, D.G.; Macdonald, R.G.; McKee, D.; Nimmo-Smith, W.A.M.; Graham, G.W. On the Formation of Tide-Produced Seiches and Double High Waters in Coastal Seas. Estuar. Coast. Shelf Sci. 2013, 134, 108–116. [Google Scholar] [CrossRef]
- Breaker, L.C.; Broenkow, W.W.; Watson, W.E.; Jo, Y.-H. Tidal and Nontidal Oscillations in Elkhorn Slough, CA. Estuaries Coasts J. CERF 2008, 31, 239–257. [Google Scholar] [CrossRef]
- Alfonso-Sosa, E. Tide-Generated Internal Solitary Waves in the Nicobar Islands Passages Excite Coastal Seiches in the Maldives Islands. 2016. Available online: https://www.researchgate.net/publication/309673376_Tide-Generated_Internal_Solitary_Waves_in_the_Nicobar_Islands_Passages_excite_Coastal_Seiches_in_the_Maldives_Islands (accessed on 3 February 2024).
- Pichon, A.; Mazé, R. Internal Tides over a Shelf Break: Analytical Model and Observations. J. Phys. Oceanogr. 1990, 20, 657–671. [Google Scholar] [CrossRef]
- Mattias Green, J.A.; Simpson, J.H.; Legg, S.; Palmer, M.R. Internal Waves, Baroclinic Energy Fluxes and Mixing at the European Shelf Edge. Cont. Shelf Res. 2008, 28, 937–950. [Google Scholar] [CrossRef]
- Pairaud, I.L.; Auclair, F.; Marsaleix, P.; Lyard, F.; Pichon, A. Dynamics of the Semi-Diurnal and Quarter-Diurnal Internal Tides in the Bay of Biscay. Part 2: Baroclinic Tides. Cont. Shelf Res. 2010, 30, 253–269. [Google Scholar] [CrossRef]
- Xie, D.; Gao, S.; Wang, Z.B.; Pan, C.; Wu, X.; Wang, Q. Morphodynamic Modeling of a Large inside Sandbar and Its Dextral Morphology in a Convergent Estuary: Qiantang Estuary, China. J. Geophys. Res. Earth Surf. 2017, 122, 1553–1572. [Google Scholar] [CrossRef]
- Xie, D.; Bing Wang, Z.; Huang, J.; Zeng, J. River, Tide and Morphology Interaction in a Macro-Tidal Estuary with Active Morphological Evolutions. Catena 2022, 212, 106131. [Google Scholar] [CrossRef]
- Luettich, R.A.; Carr, S.D.; Reynolds-Fleming, J.V.; Fulcher, C.W.; McNinch, J.E. Semi-Diurnal Seiching in a Shallow, Micro-Tidal Lagoonal Estuary. Cont. Shelf Res. 2002, 22, 1669–1681. [Google Scholar] [CrossRef]


Disclaimer/Publisher’s Note: The statements, opinions and data contained in all publications are solely those of the individual author(s) and contributor(s) and not of MDPI and/or the editor(s). MDPI and/or the editor(s) disclaim responsibility for any injury to people or property resulting from any ideas, methods, instructions or products referred to in the content. |
© 2024 by the authors. Licensee MDPI, Basel, Switzerland. This article is an open access article distributed under the terms and conditions of the Creative Commons Attribution (CC BY) license (https://creativecommons.org/licenses/by/4.0/).
Share and Cite
Guillou, N.; Chapalain, G. Characterizing Seiches Oscillations in a Macro-Tidal Estuary. Coasts 2024, 4, 108-126. https://doi.org/10.3390/coasts4010007
Guillou N, Chapalain G. Characterizing Seiches Oscillations in a Macro-Tidal Estuary. Coasts. 2024; 4(1):108-126. https://doi.org/10.3390/coasts4010007
Chicago/Turabian StyleGuillou, Nicolas, and Georges Chapalain. 2024. "Characterizing Seiches Oscillations in a Macro-Tidal Estuary" Coasts 4, no. 1: 108-126. https://doi.org/10.3390/coasts4010007