Article

Design of a Cyclodextrin Bioproduction Process Using Bacillus pseudofirmus and Paenibacillus macerans

by
Alexandre Miguel Guedes
1,†,
Tiago Filipe Santos Alves
1,†,
Paulo J. Salústio
1,2,*,
Helena M. Cabral-Marques
1,2 and
Maria H. L. Ribeiro
1,2
1
Faculty of Pharmacy, University of Lisbon, Av. Prof. Gama Pinto, 1649-003 Lisbon, Portugal
2
Research Institute for Medicines and Pharmaceutical Sciences (iMed.UL), Faculty of Pharmacy, Universidade de Lisboa, Av. Prof. Gama Pinto, 1649-003 Lisbon, Portugal
*
Author to whom correspondence should be addressed.
These authors contributed equally to this work.
Future Pharmacol. 2023, 3(3), 568-584; https://doi.org/10.3390/futurepharmacol3030035
Submission received: 1 May 2023 / Revised: 10 June 2023 / Accepted: 3 July 2023 / Published: 11 July 2023
(This article belongs to the Special Issue Cyclodextrin-Based Approach in Biotechnology)

Abstract

:
Cyclodextrin (CD) drug delivery systems offer the potential to enhance the desired physicochemical properties and pharmacokinetic parameters of drugs while maintaining their safety. Cyclodextrin-glucosyl-transferase (CGTase) is amongst the most important enzymes used in CD biosynthesis. However, the bioproduction of CDs still faces challenges in terms of optimization and process complexity. This study proposes a novel CD bioproduction system in a batch mode to increase yield and reduce costs. Two bacterial strains were selected: the alkalophilic Bacillus pseudofirmus DSM2517 strain and the neutrophilic Paenibacillus macerans DSM1574 strain. Three different culture media, two temperatures (30 °C and 37 °C), and three scales (shake flasks 20 mL and 100 mL, and bioreactor 3.2 L) were evaluated with respect to bacterial growth kinetics, protein production, and CGTase biosynthesis and activity for β-CD production. Bacterial growth was monitored by measuring optical density (OD600 nm), while CGTase activity was assessed by measuring β-CD production directly in the medium after filtration or in samples after concentration (using a Vivaspin 500® ultrafiltration spin column with a 10 kDa cut-off). β-CD quantification was performed using the phenolphthalein colorimetric method and HPLC. The best conditions for combined growth and protein production, for both microorganisms, in shake flasks were achieved with a medium containing 2% dextrin as the carbohydrate source. Scale-up to the bioreactor displayed improved growth kinetics for both bacteria and higher protein production and CGTase activity for Paenibacillus macerans.

1. Introduction

Cyclodextrins (CDs) have garnered significant interest in biotechnology due to their chemical properties and their wide range of industrial and pharmaceutical applications, particularly in drug delivery and biosynthesis strategies involving enzymes and natural bacterial producers [1,2,3]. CDs are cyclic oligosaccharides composed of glucose units connected by 1,4-glycosidic linkages. The three primary types of CDs are α-, β-, and γ-cyclodextrin, which consist of six, seven, and eight glucose units, respectively (Figure 1) [4,5,6].
One of the most important characteristics of cyclodextrins (CDs) lies in their ring structure, which features an outer hydrophilic surface due to the presence of hydroxyl groups, as well as a nonpolar internal cavity. This unique structure facilitates the inclusion of guest molecules that are less polar than water through non-covalent interactions, forming what is known as an inclusion complex. These complexes offer protection to the guest molecules from various chemical and reactive species that could otherwise cause their degradation [7,8,9,10].
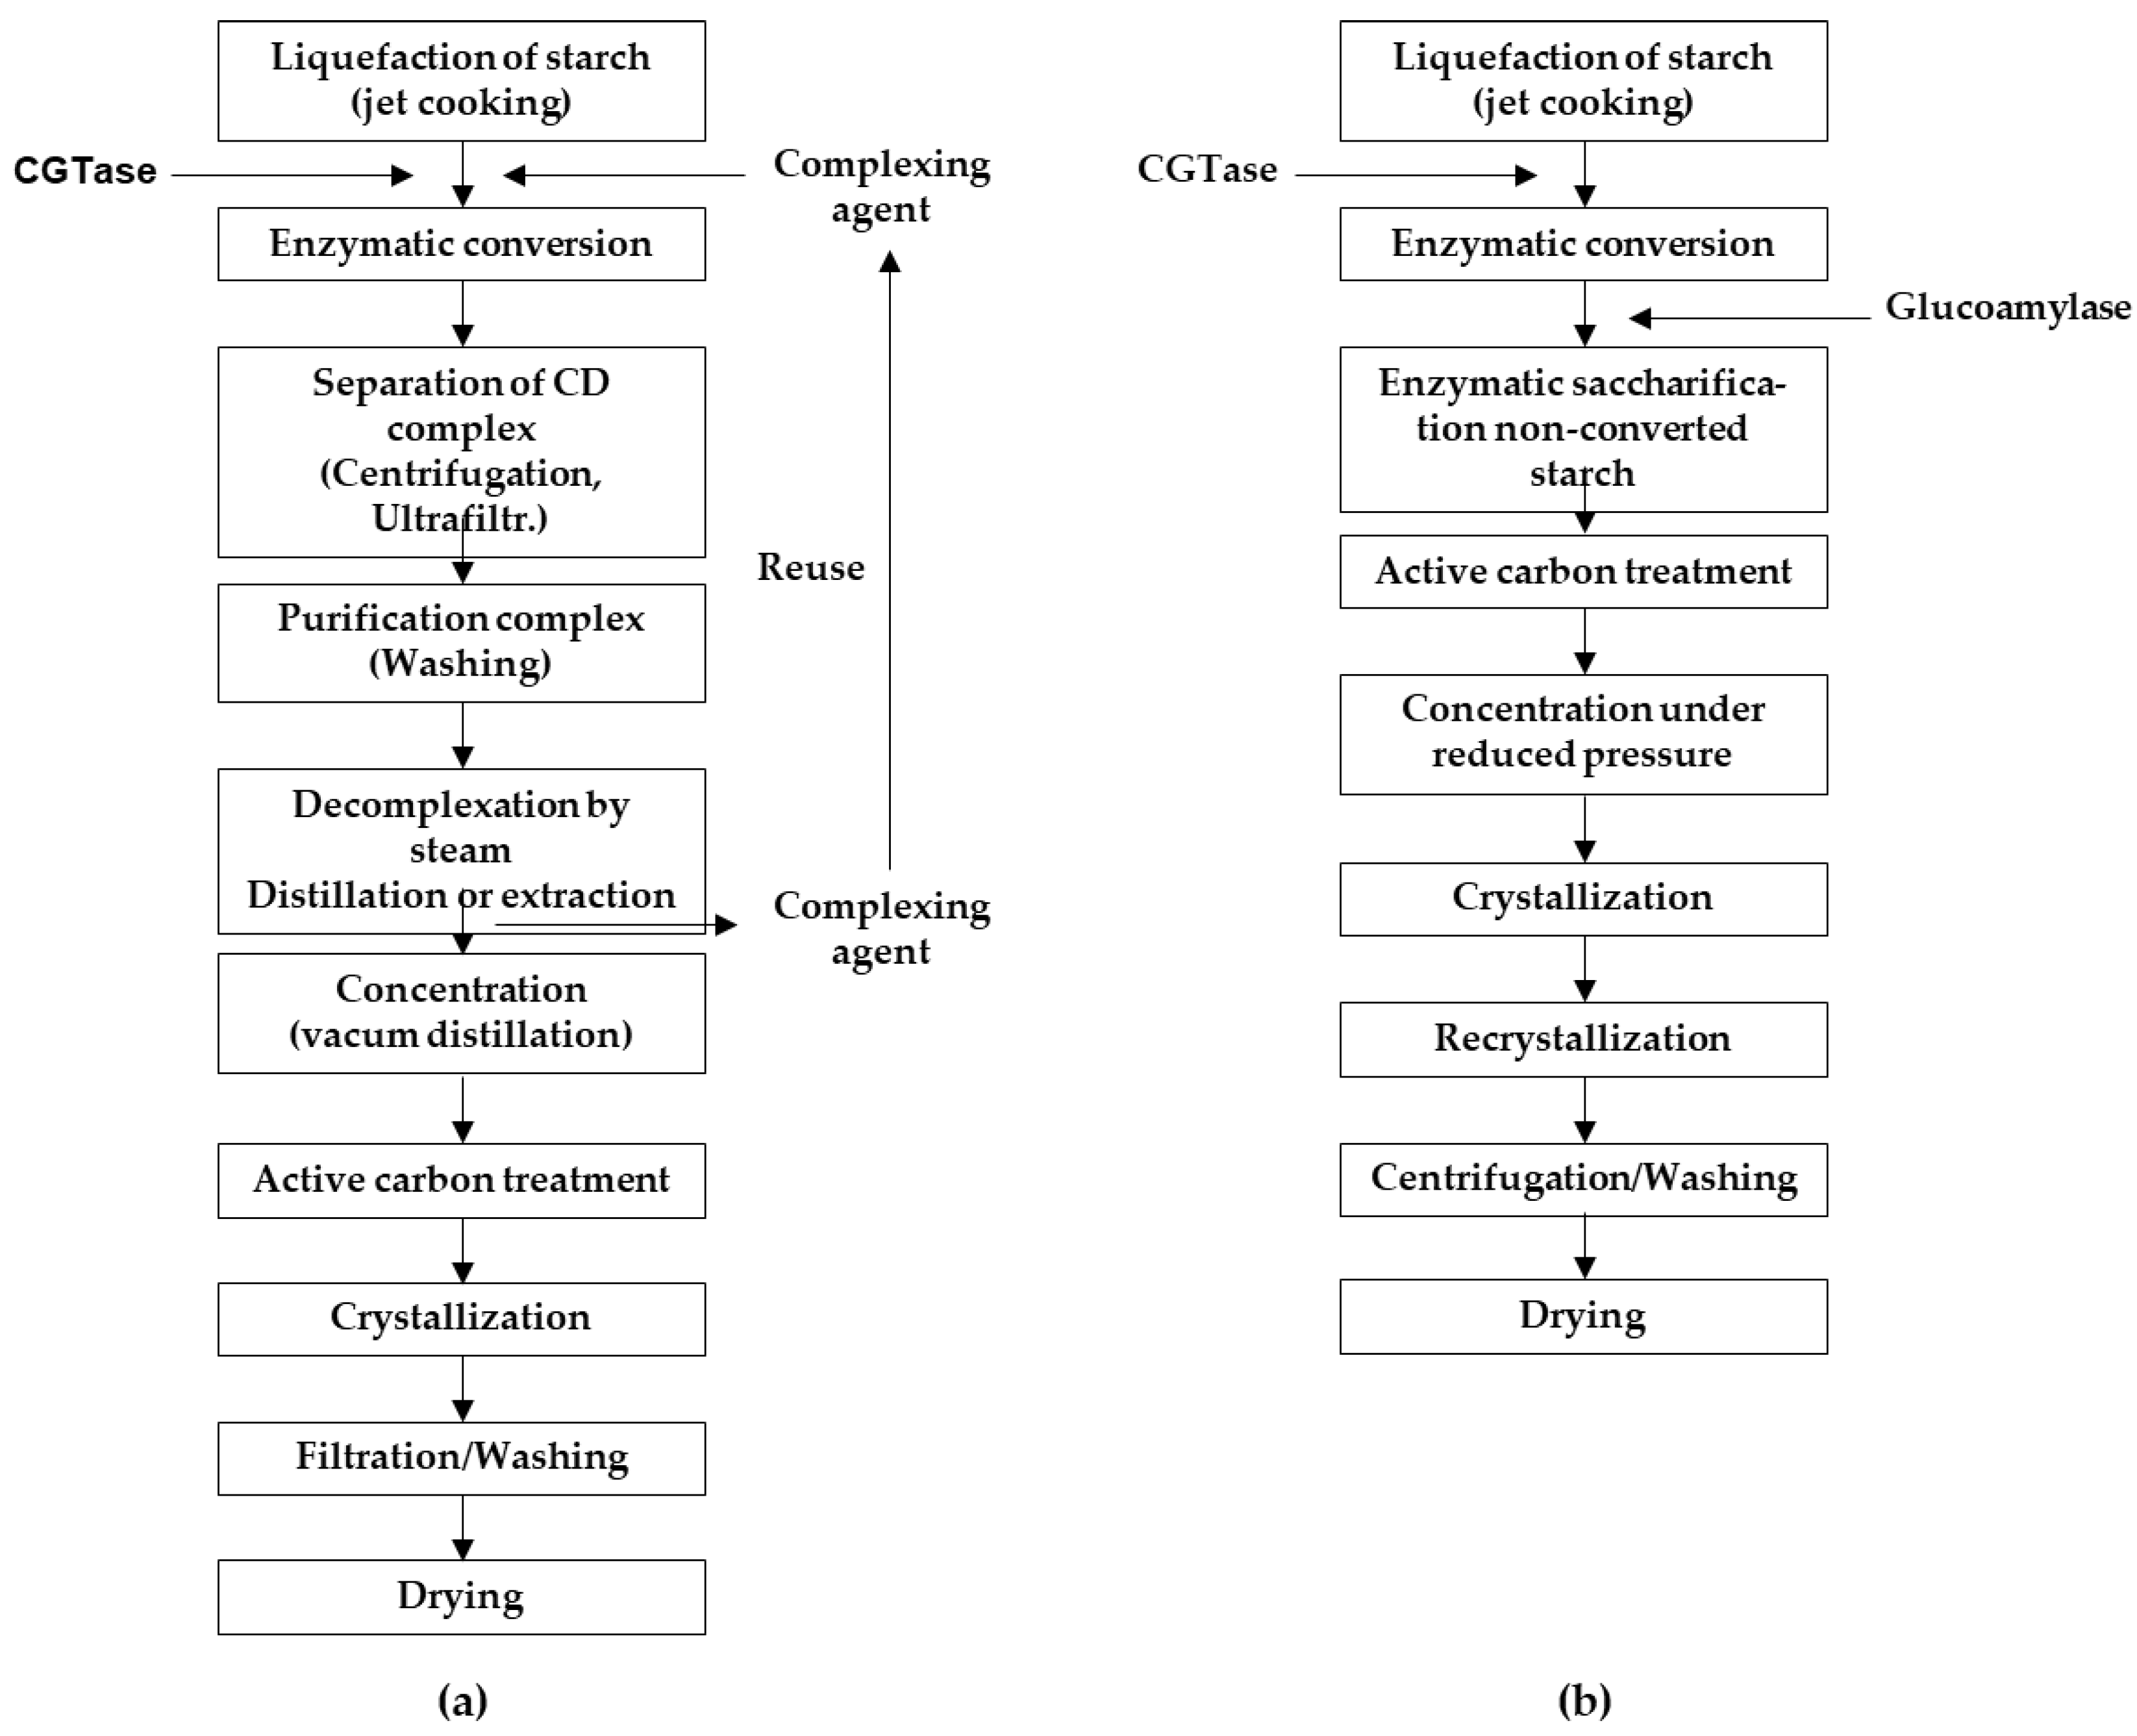
As the industrial demand for CDs continues to grow, their production has increased year after year, with significant efforts focused on achieving cost-effective production methods [11]. However, the processes and strategies employed in their industrial production are often kept confidential [12]. Generally, two different types of CD production processes are utilized [13,14]: (i) the solvent process, where an organic complexing agent selectively precipitates a specific type of CD, and (ii) the non-solvent process, where no complexing agent is added, and the ratio of CDs produced is solely dependent on the Cyclodextrin Glucosyltransferase (CGTase) enzyme used and the reaction conditions (Figure 2).
CGTases are a member of the largest family of glycoside hydrolases acting on starch and related α-glucans, the glycoside hydrolase family 13. Enzymes belonging to this group show a wide diversity in reaction specificities, CGTases mainly catalyze transglycosylation reactions, with hydrolysis being a minor activity (Figure 3) [12,15,16].
The first 3D structure of the CGTase enzyme [17] revealed that it consists of five domain proteins, with the active site located at the bottom of a (β/α) 8-barrel in the A domain. CGTases cleave the α-1,4-glycosyl bonds between subsites −1 and +1 in α-glucans, resulting in a stable covalent glycosyl intermediate bound at the donor subsites. This glycosyl intermediate is then transferred to the 4-hydroxyl of its own non-reducing end, forming a new α-1,4-glycosidic bond and yielding a cyclic product. CGTases can also transfer the glycosyl intermediate to a second α-glucan, resulting in a linear product (disproportionation), or to water (hydrolysis). Additionally, CGTases have the ability to degrade CDs by opening the CD ring and transferring the linearized CD to a sugar acceptor, leading to the formation of a linear oligosaccharide (coupling) [12].
While the majority of bacterial species known for producing CGTase belong to the genus Bacillus, other bacterial species such as Klebsiella pneumonia [18], Klebsiella oxytoca [19], anaerobic thermophile bacteria like Thermoanaerobacter sp and Thermoanaerobacter thermosulfurigenes [20], and Thermoactinomyces sp [21,22] have also been mentioned.
The application and study of alkalophilic Bacillus species for industrial production of extracellular enzymes is extensive due to their widespread presence, non-pathogenic nature, and high production capacity of extracellular enzymes. These enzymes, when easily isolated, exhibit specific characteristics such as activity and stability in extremely alkaline environments, and they often demonstrate activity or thermostability over a broad pH range compared to enzymes from neutralophiles [11,23,24,25].
The strain DSM 2517 of Bacillus pseudofirmus is an alkalophilic Bacillus strain also referred to as ATCC 21593, BCRC 10412, CCRC 10,412, and 124-1 [26]. Initially, it was classified as a variant of the alkalophilic strain of Bacillus firmus in a taxonomic study involving 174 alkalophilic strains of the genus Bacillus [27]. In a more recent taxonomic study that investigated the guanine-plus-cytosine (G + C) content variation among alkalophilic Bacillus strains and their relatedness to the type strain of B. alcalophilus through DNA-DNA hybridization experiments, the G + C content of strain DSM 2517 was determined to be 39.5% [28]. Nielsen et al. [29] included the same strain in taxon cluster 1 and concluded that it was phylogenetically unrelated to Bacillus firmus, as its DNA base composition was slightly lower. Furthermore, unlike Bacillus firmus, most strains in cluster 1 were unable to grow at pH 7 and were tolerant of high levels of NaCl and deaminated phenylalanine. As a result, they proposed a new species named Bacillus pseudofirmus [29].
For production of CGTase [30] studied several culture conditions with an alkalophilic Bacillus sp., achieving highest yields of production with the medium consisting on 1% soluble starch, 5% corn steep liquor, 0.1% K2HPO4, 0.02% MgSO4.7H2O and 1% Na2CO3. However, the most cited and chosen medium amongst researchers is the medium usually referred as Horikoshi Medium II, containing 2% soluble starch, 0.5% polypeptone, 0.5% yeast extract, 0.1% K2HPO4, 0.02% MgSO4.7H2O and 1% Na2CO3, mainly for alkalophilic species of the genus Bacillus. Further studies carried on by Jacob A. Rendleman [31], using commercial CGTase from Bacillus macerans, gives more insights about the characteristics of this enzyme. The overall yield of CD production is usually in the range of 35–50%, being normally favored the formation of noncyclic products in the absence of inclusion compounds (complexes). CGTase from B. macerans initially favors α-CD production [31]. The stability of this CGTase has shown to be high at and above pH 7.0, decreasing rapidly below pH 6.0. Its highest activity occurred between pH 5.0 and 7.0, decreasing rapidly outside this range. The thermostablity, at pH 7.0, was high at 25 °C (CGTase remained active for at least one month), but low at 60 °C (the enzyme became virtually inactive after 12 h) [31,32].
The bacterial species Paenibacillus macerans (phylum Firmicutes, family Paenibacillaceae, genus Paenibacillus) was initially described as Bacillus macerans by Schardinger in 1905 [33]. Over time, it has undergone taxonomic reclassification, and the current classification places this species in the Paenibacillus genus and Paenibacillaceae family. The P. macerans DSM 1574 strain, also reported as IFO3490, is mentioned as CGTase producing bacterium. This enzyme has a molecular weight of 74,008 Da [34,35,36].
Qi and Zimmermann [37], while characterizing the CGTase from a neutrophilic Paenibacillus sp., prepared a CGTase production medium consisting of 2% (w/v) whole rice, 0.5% yeast extract, 0.5% tryptone, 0.2% K2HPO4, 0.2% Na2HPO4, 0.02% MgSO4·7H2O, 0.02% CaCl2·2H2O, and 0.1% (NH4)2SO4. The culture was incubated for 24 h at 37 °C in a shaking incubator at 200 rpm. Previous studies on various microorganisms have shown that the CGTase produced from the IFO3490 strain has an optimum temperature of 55 °C and heat stability of 55 °C (without Ca). The enzyme’s optimal pH falls between 5.2–5.7, and it remains stable within a pH range of 8.0–10.0 [37].
The main purpose of this work was to evaluate and characterize the bioproduction of CGTase towards β-cyclodextrins, using different microorganisms, conditions and scale-up.

2. Materials and Methods

2.1. Microrganisms

Bacillus pseudofirmus DSM2517 and Paenibacillus macerans were from DSMZ (Deutsche Sammlung von Mikroorganismen und Zellkulturen) GmbH.
The growth medium for B. pseudofirmus DSM2517 was the alkaline nutrient agar, mentioned as medium 31 by DSMZ [38], which was made of 5 g of peptone, 3 g of meat extract per 1 L of distilled water. For the preparation of a solid medium, 7.5 g of agar was added to the previous formulation. A buffer solution containing sodium sesquicarbonate 1 M, 4.2 g of NaHCO3, 5.3 g of Na2CO3 anhydrous was prepared in 100 mL of distilled water, sterilized (20 min, 121 °C), and 50 mL added to the previous medium to achieve a pH of 9.7. The growth medium for Paenibacillus macerans DSM1574 (Medium 1 [38]) comprised per 1 L of distilled water: peptone, 5 g, and meat extract, 3 g. The solid medium was prepared with the same composition with the addition of 7.5 g of agar. They were sterilized in an autoclave for 20 min, 121 °C.
Both bacterial strains were obtained in a vacuum dried form. Afterwards they were suspended in 1.5 mL of liquid medium 31 (B. pseudofirmus) or medium 1 (P. macerans), and then divided for test tubes with medium 31 and Petri dishes and keep growing at 30 °C during 3 days. After the initial growth, macroscopic and microscopic characterization of the bacteria was done. Additionally, isolated colonies in Petri dishes were inoculated in several tubes with 1 mL of medium BHI and 15% glycerol, which were stored at −80 °C for future work (master cell bank). The remaining dish plates were sealed with parafilm and preserved at 4 °C until use (work cell bank).

2.2. CGTase Production Media

For the purpose of characterization CGTase production, three different media [39] were tested. The media were identified as A, B, and C, and prepared as follow:
(i)
Nutrient solutions
Medium A: 5 g (1%) of soluble starch; 2.5 g (0.5%) of peptone; 2.5 g (0.5%) of yeast extract and distilled water for 500 mL.
Medium B: 10 g (2%) of dextrin (from potato starch, 31400 Millipore, Burlington, MA, USA); 2.5 g (0.5%) of peptone; 2.5 g (0.5%) of yeast extract and distilled water for 500 mL.
Medium C: 25 mL (5%) of corn steep liquor; 5 g (1%) of soluble starch and distilled water for 500 mL.
(ii)
Preparation of the saline and buffer solutions:
3.3 g of K2HPO4 in 500 mL of distilled water; 0.65 g of MgSO4.7H2O in 500 mL of distilled water; 25 g of Na2CO3 anhydrous in 250 mL of distilled water (alkaline buffer solution—required for B. pseudofirmus).
Each solution was sterilized in autoclave (121 °C, 21 min), afterwards, 75 mL of MgSO4.7H2O solution and 75 mL of K2HPO4 solution were added to all nutrient solutions, to achieve a final concentration of, respectively, 0.02% and 0.1%.
For B. pseudofirmus media 50 mL of the Na2CO3 solution was added to a final concentration of 1%, in a final volume of 500 mL, with a pH of 9.7.
For P. macerans the final volume of the culture media was 500 mL, with a pH of 7.0.

2.3. CGTase Production Assays

The preliminary CGTase production assay started with the preparation of the media A, B and C, as previously described, for both bacteria.
A pre-inoculum was prepared. After each bacterium, was inoculated and incubated at 30 °C and 37 °C, on an orbital shaker at 160 rpm, for 48 h. 2 mL of pre-inoculum was transferred to flasks containing 18 mL of respective medium and were incubated for more 4 days.
The final cultures were centrifuged at 6000× g for 15 min, and the cell-free supernatant was preserved at 4 °C, used later on, as crude enzyme preparations for protein quantification assay (Bradford method) [40] and CGTase activity assay.
To study the bacterial growth kinetics and protein production through the culture time, an intermediate assay of CGTase production was performed.
For each bacterium, a full loop of bacterial colonies was put separately in the media A, B or C, and then incubated at 30 °C and 37 °C on an orbital shaker at 160 rpm for 2 days. 10 mL of each pre-inoculum were then added to flasks with 90 mL of respective medium and kept in their initial temperatures and shaking conditions. At regular intervals during the next 4 days, samples were collected from all the cultures and measured bacterial growth by optical density, and protein content with the Bradford method. The final cultures media were centrifuged at 6000 G for 15 min, and the cell free supernatant was preserved and used as crude enzyme preparations for analysis of CGTase activity.
To study the bacterial growth kinetics and protein production on a larger scale, a laboratory-scale batch reactor (3.2 L) was used. A pre-inoculum of each bacteria and 200 mL of medium B was incubated at 30 °C on an orbital shaker at 160 rpm. The bioreactor was sterilized, previously filled with 1800 mL of medium B, followed by the addition of 200 mL of pre-inoculum. The growth conditions were set to a temperature of 30 °C, pH 9.7, and agitation speed of 200 rpm. At regular intervals during 70 hs, samples were collected from the bioreactor, for bacterial growth evaluation, protein content and CGTase activity.

2.4. Analytical Methods

The bacterial growth in liquid media was followed by measuring the optical density at 600 nm (OD 600).
The total protein concentration on enzymatic samples was estimated according to the Bio-Rad Protein assay, based on the Bradford method of [40], adapted to a micromethod [41] for a faster multiple sample processing, using bovine serum albumin (BSA) as standard.
The concentration of β-CD on samples was analysed by the phenolphthalein (PHE) colorimetric method, at 562 nm. This assay is based on the decrease in absorbance at 562 nm due to formation of a relatively specific complex between PHE and β-CD [42]. The decolorization of the indicator is due to the destruction of the planar conjugated structure of the PHE molecule [43]. The protocol described by Moriwaki et al. [30] was adapted for this study. Briefly, a stock solution of PHE (3 mmol/L), in ethanol 95%, an aqueous buffer solution of sodium carbonate (0.6 mol/L) and sodium bicarbonate, and standard solutions of β-CD (2 mmol/L), in 20% (v/v) tris-HCl 50 mmol/L, 10% (v/v) CaCl2, 50 mmol/L, and water [25].
β C D = a · 1 A b s A b s 0 · 1 + A b s 0 K · a · A b s
Abs is the absorbance registered for the sample, Abs0 is the absorbance registered for the blank, CβCD is the value of the concentration of β -CD in the samples in mmol/L, a is the concentration of PHE, K is the β-CD + PHE complexation constant (82 394 M−1) [44].
The enzymatic activity of the CGTase was measured by the β-CD production over a period of time in standard conditions, following a similar protocol applied by Moriwaki et al. [30]. One unit of enzymatic activity (U) is equal to the amount of CGTase that produces 1 μmol of β-CD per minute in the applied conditions [30].
The assay has been made as follow: preparation of a substrate solution with 1% of dextrin, 10 mmol/L of tris-HCl and 5 mmol/L of CaCl2, the zero-point was set with 1 mL of enzyme solution in a bath at 100 °C for inactivation, after 10 min, 1 mL of substrate solution was kept at 100 °C for 10 min. After the β-CD analysis followed the protocol previously described. For each sample several sealed tubes with 1 mL of substrate solution, was prepared, one tube for each measuring time was chosen, 5, 10, 15, 20, 25 and 30 min for example, and kept at 50 °C until the temperature stabilization. 1 mL of enzyme solution was added to the respective tube, starting from the tube for 30 min reaction and finishing with the 5 min tube, keeping the tubes at 50 °C through the reaction time. To stop the reaction the tubes are put at 100 °C for 10 min. After the β-CD content of in each sample are evaluated. The CGTase activity was determined by the Equation (2) [30]:
    A = K × V r × C e V e                    
A—Enzymatic activity in μmol of β-CD (min x mL), K’ is the slope of the graphic line of the β-CD concentration over the time inclination; Vr is the total reaction volume, Ce the enzyme concentration; Ve is the enzyme volume added.

2.5. Analysis

All experiments were performed at least in triplicate. The standard deviation (SD) was evaluated for each value and was ±0.05 unless stated otherwise.

3. Results and Discussion

3.1. Macroscopic and Microscopic Characterization

The initial bacterial growth was followed by the macroscopic and microscopicharacterization of the bacteria. The observed characteristics of both bacteria correspond to the ones cited on the literature.
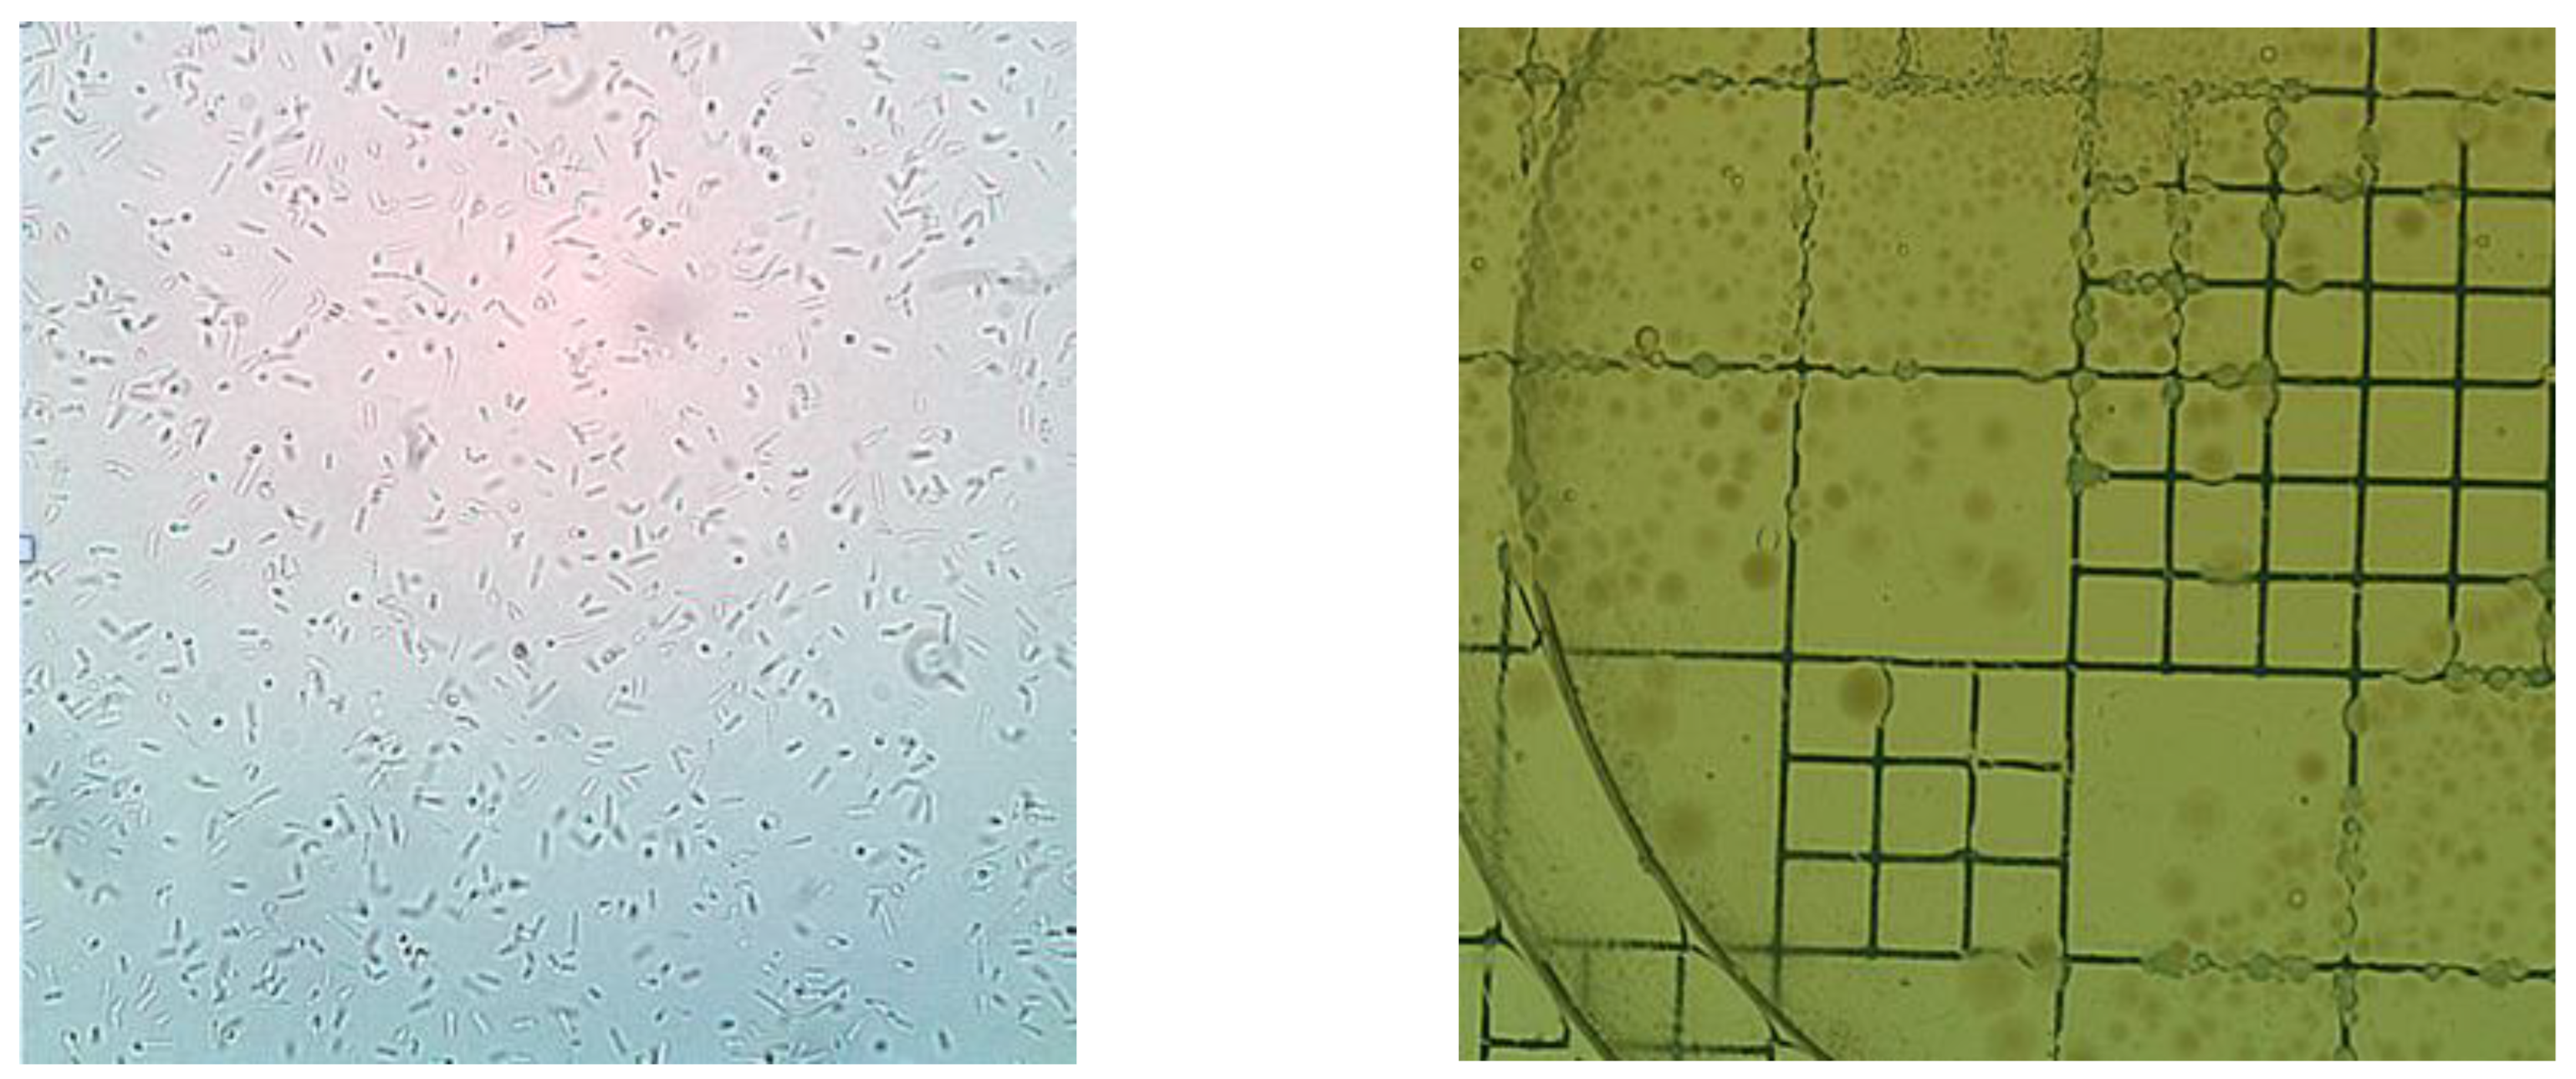
The B. pseudofirmus, as shown in Figure 4, was characterized macroscopically as yellow, round colonies with irregular borders. Microscopically (microscope Carl Zeiss, Jena, Germany, magnification 1000×), the bacteria appeared rod-shaped, with observed endospore formation. Furthermore, as reported by Nielsen et al. [45], this strain shown to be strictly alkalophilic, since no evident growth was observed in pH 7 agar medium.
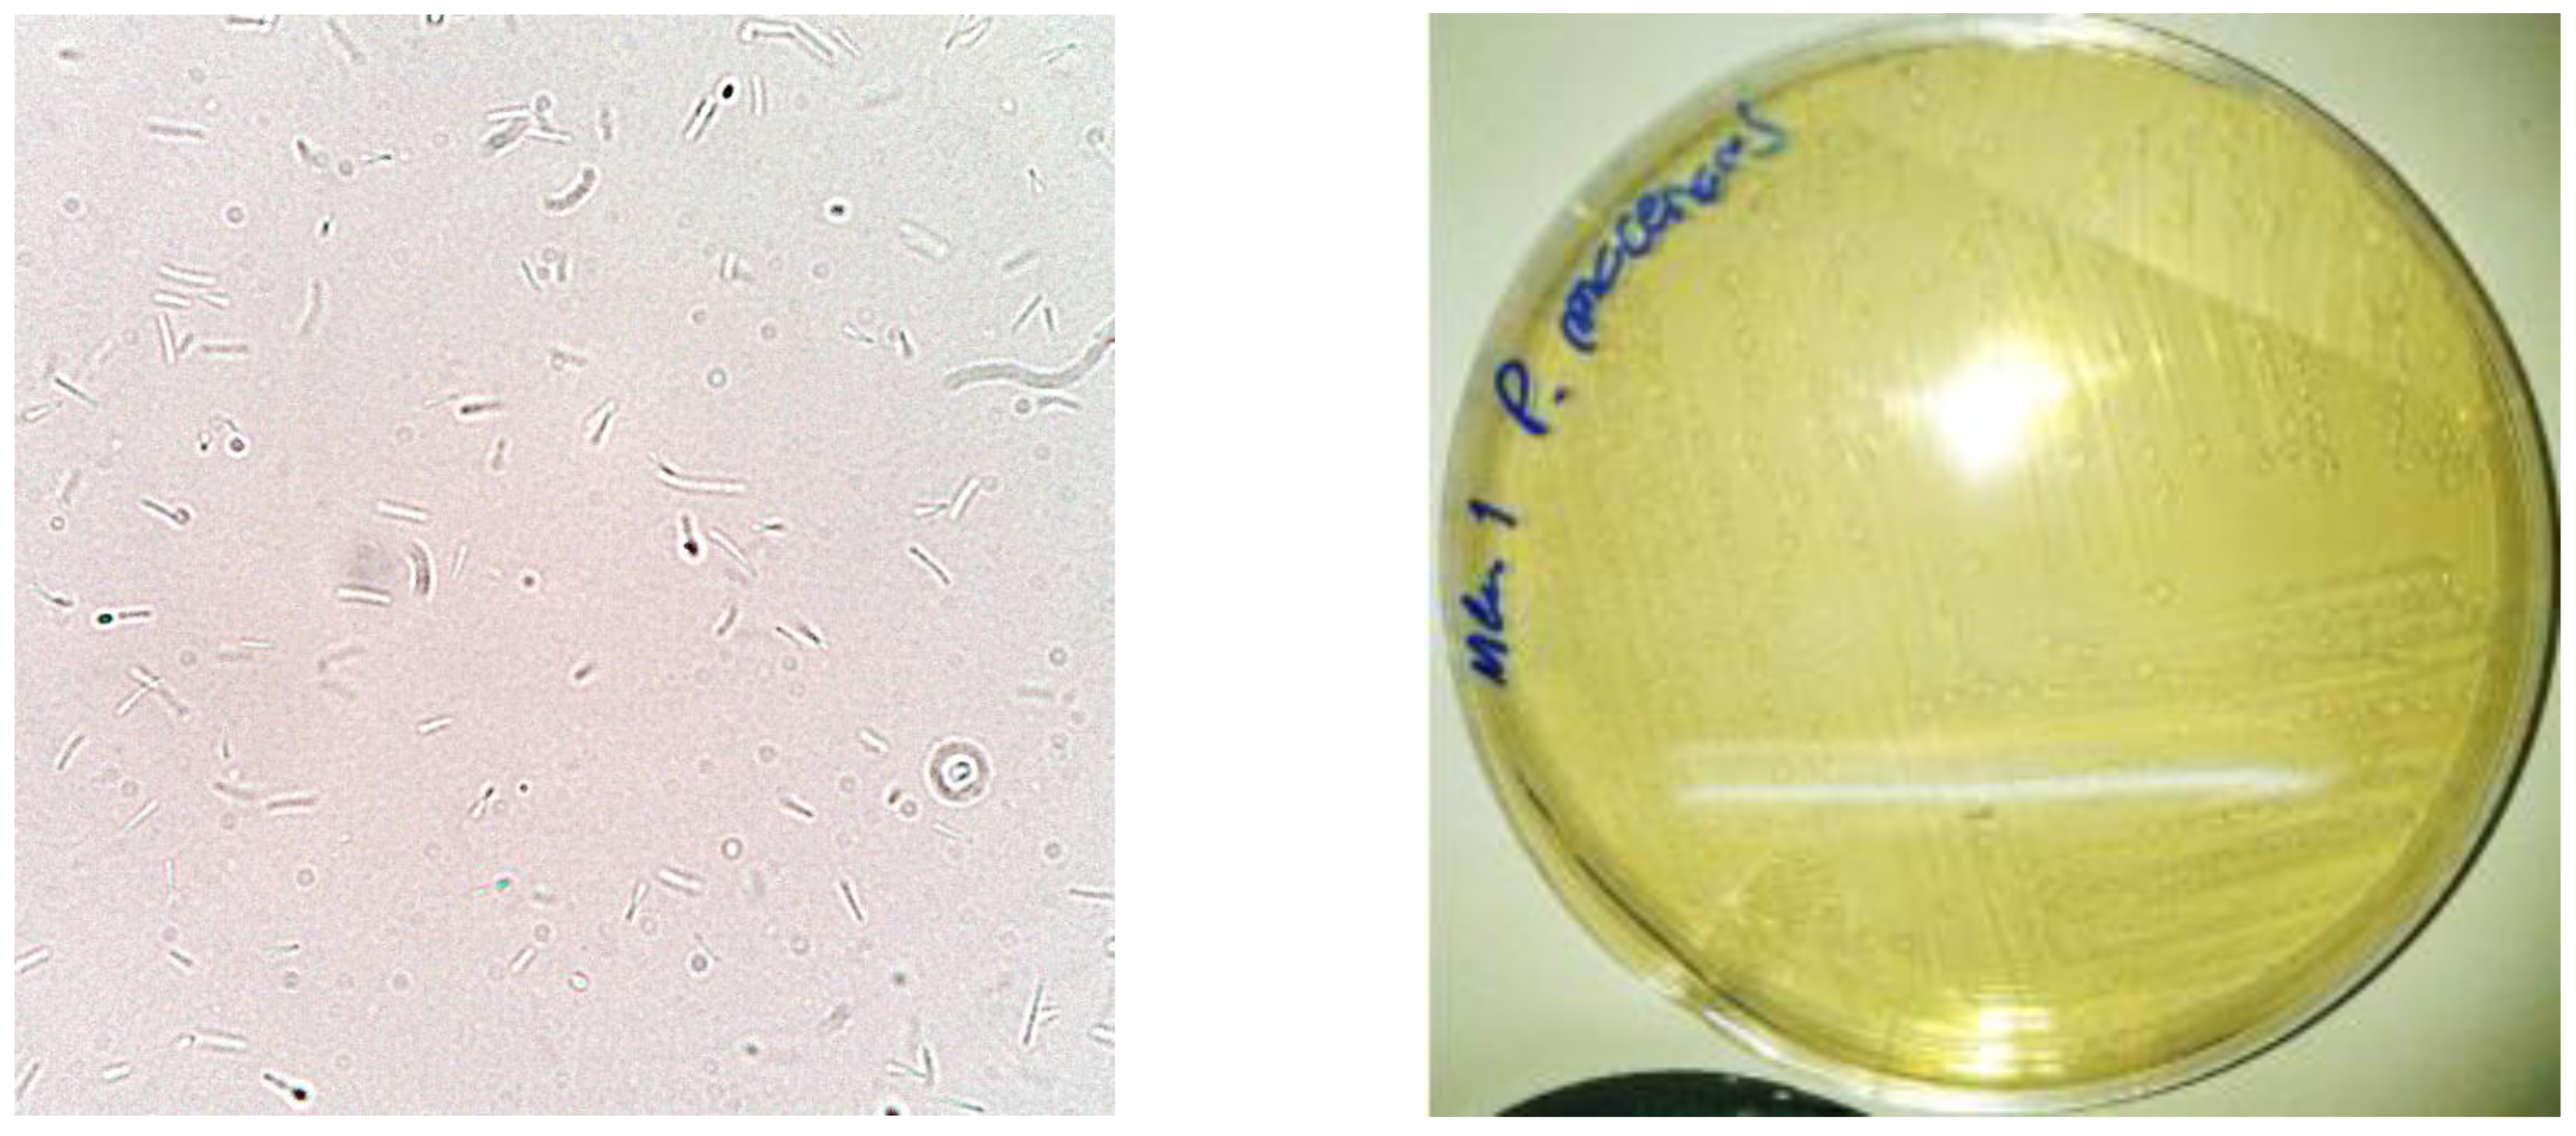
The macroscopic observation of the plate cultures of Paenibacillus macerans revealed smooth, oval-shaped white colonies (Figure 5). Microscopically (microscope Carl Zeiss, Jena, Germany, magnification 1000×), it was observed rod-shaped bacteria, with some visible endospores (Figure 5).

3.2. Small Size Bioprocessing

The preliminary assays, conducted in 20 mL of medium, aimed to study the effect of nutrient and temperature on CGTase production. The main objectives of these assays were to optimize and evaluate the chosen techniques.
The selection of variables, such as nutrient composition, growth temperature, and incubation time, was based on the diverse conditions cited in various studies regarding the production of CGTase.
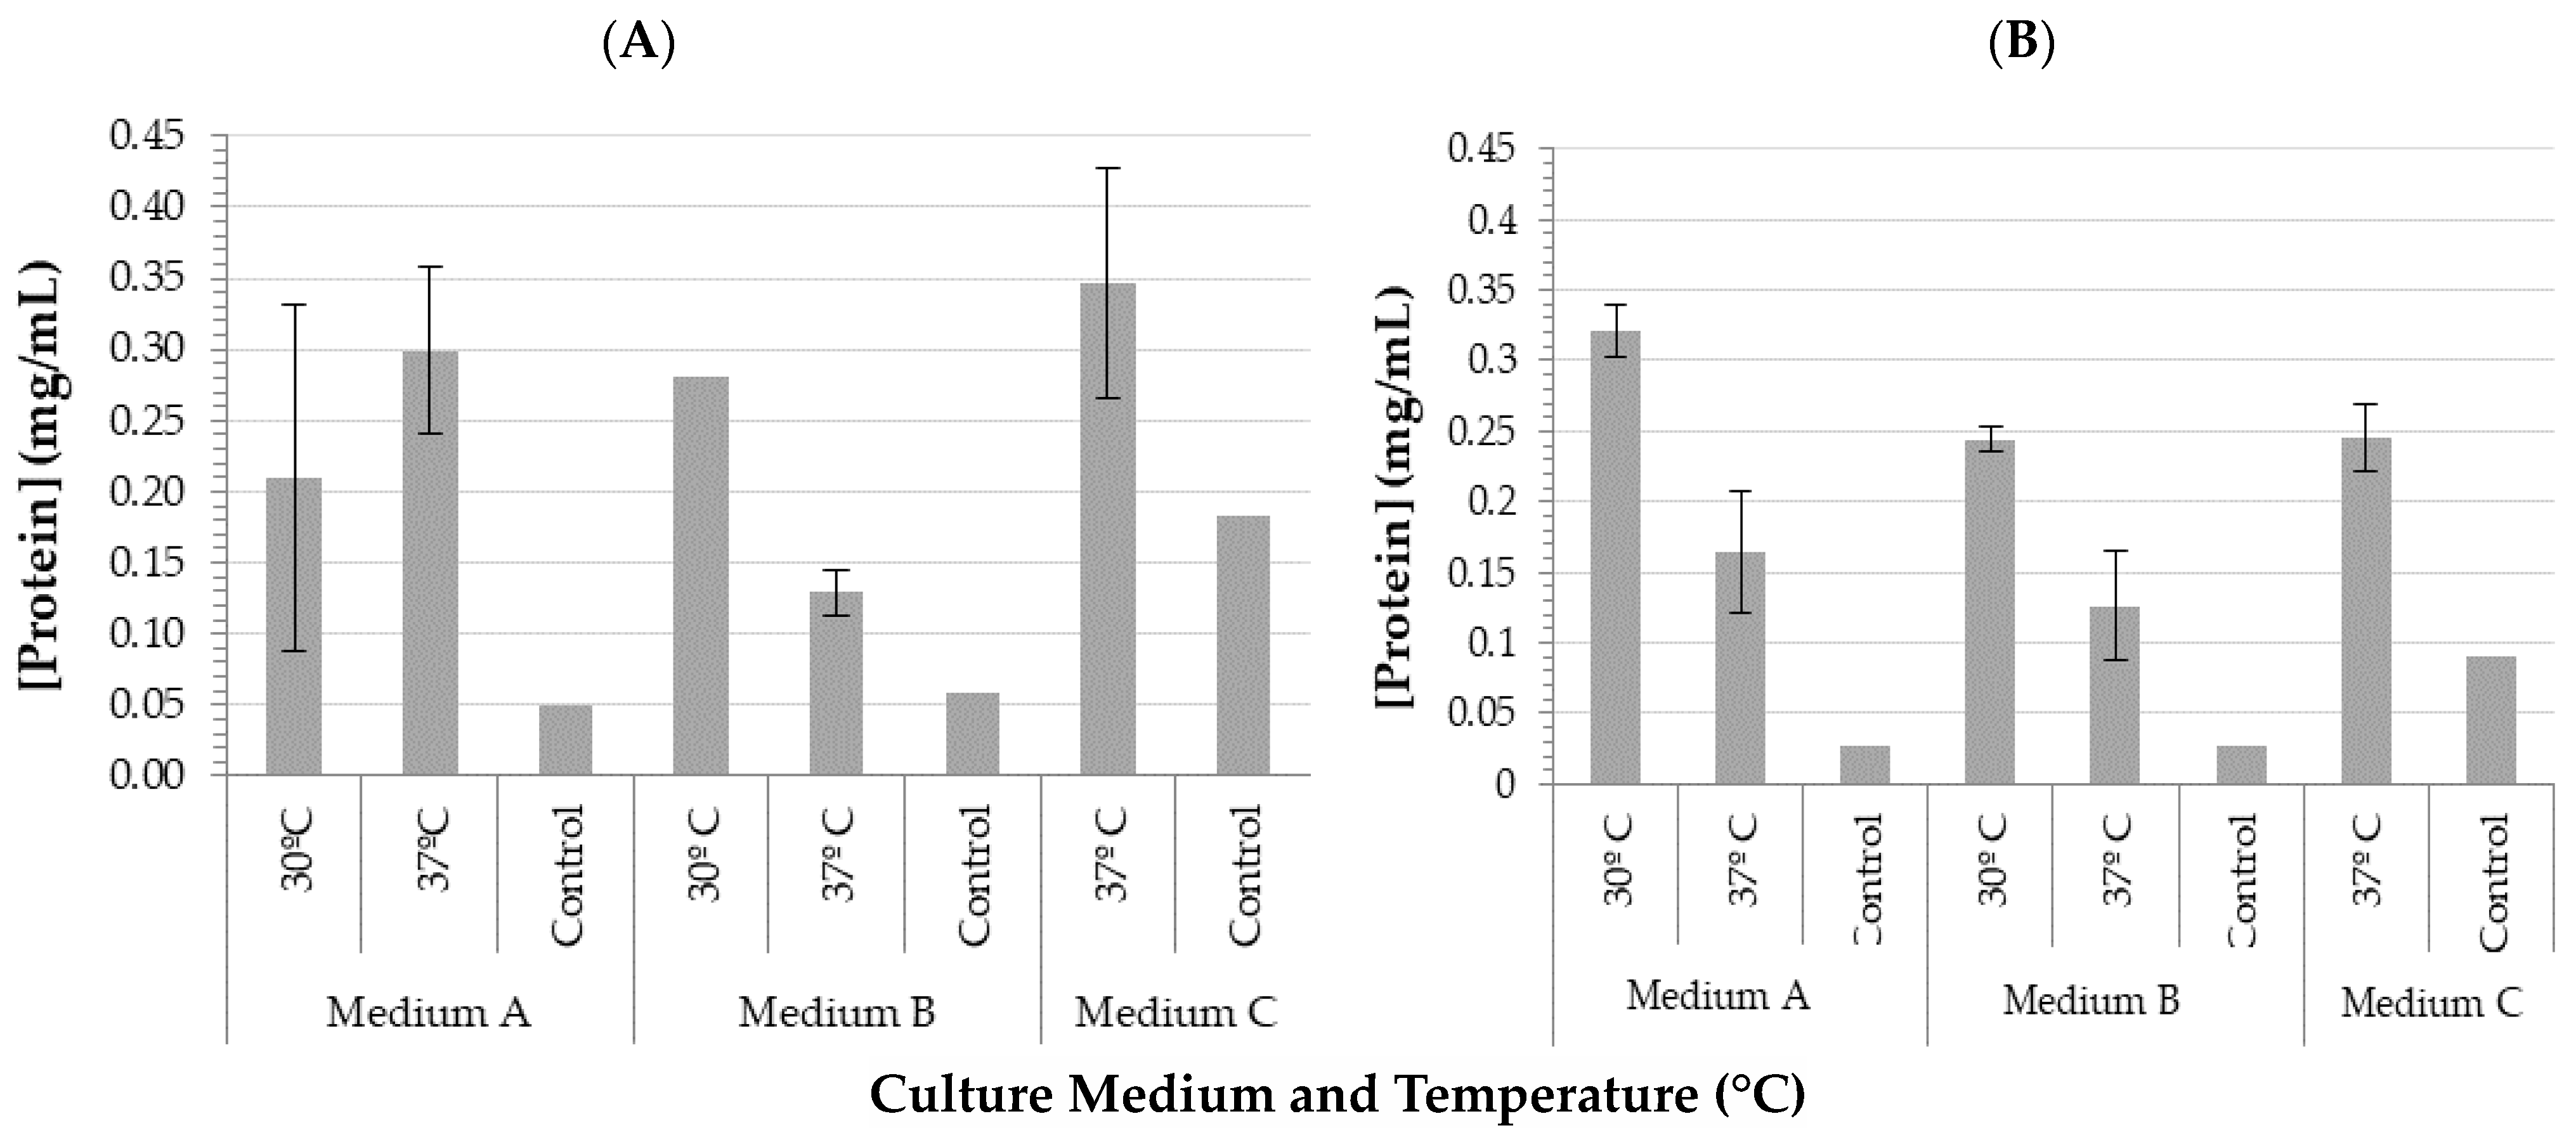
The growth temperature recommended from the DSMZ catalogue for B. pseudofirmus DSM 2517 was 30 °C, however, in ATCC catalogue it is recommended to grown the same strain at 37 °C [45,46]. For P.macerans the optimal temperature reported in DSMZ catalogue was 30 °C [38]. So in this work both temperatures 30 °C and 37 °C were tested for B. pseudofirmus and P.macerans. For B. pseudofirmus it was tested 1% and 2% of starch (Horikoshi Medium II) and the best results were obtained with 1% of starch. The results achieved for total protein production in all the conditions studied, measured at the end of the culture, are indicated in Figure 6A,B for each microrganism.
The analysis of the results obtained for both bacteria indicated that media A and B (respectively with 1% starch and 2% dextrin) do not interfere with the Bradford method, when compared to the controls. However, the composition of medium C, corn steep liquor greatly interfered with the measurements using Bradford and optical density methods, being therefore excluded from the protocols for the next assays. In addition, there is also clear evidence of the biosynthesis and release of proteins to the supernatant for both bacteria in all the media used.
For B. pseudofirmus, high values of protein are attained at 37 °C with media A and C, while for medium B the high concentrations are attained at 30 °C (Figure 6A). For P. macerans it was observed that the total protein production was higher at 30 °C, using the medium B (Figure 6B).
In addition to the total protein analysis, the CGTase activity in the samples supernatant was also measured by the method previously described. However, no β-CD was detected.

3.3. Intermediate Assays of CGTase Production

The culture volume increase allowed sampling during the process and OD600 nm evaluation and protein quantification. These assays had the main goal of studying the kinetics of bacterial growth and the protein production along time.
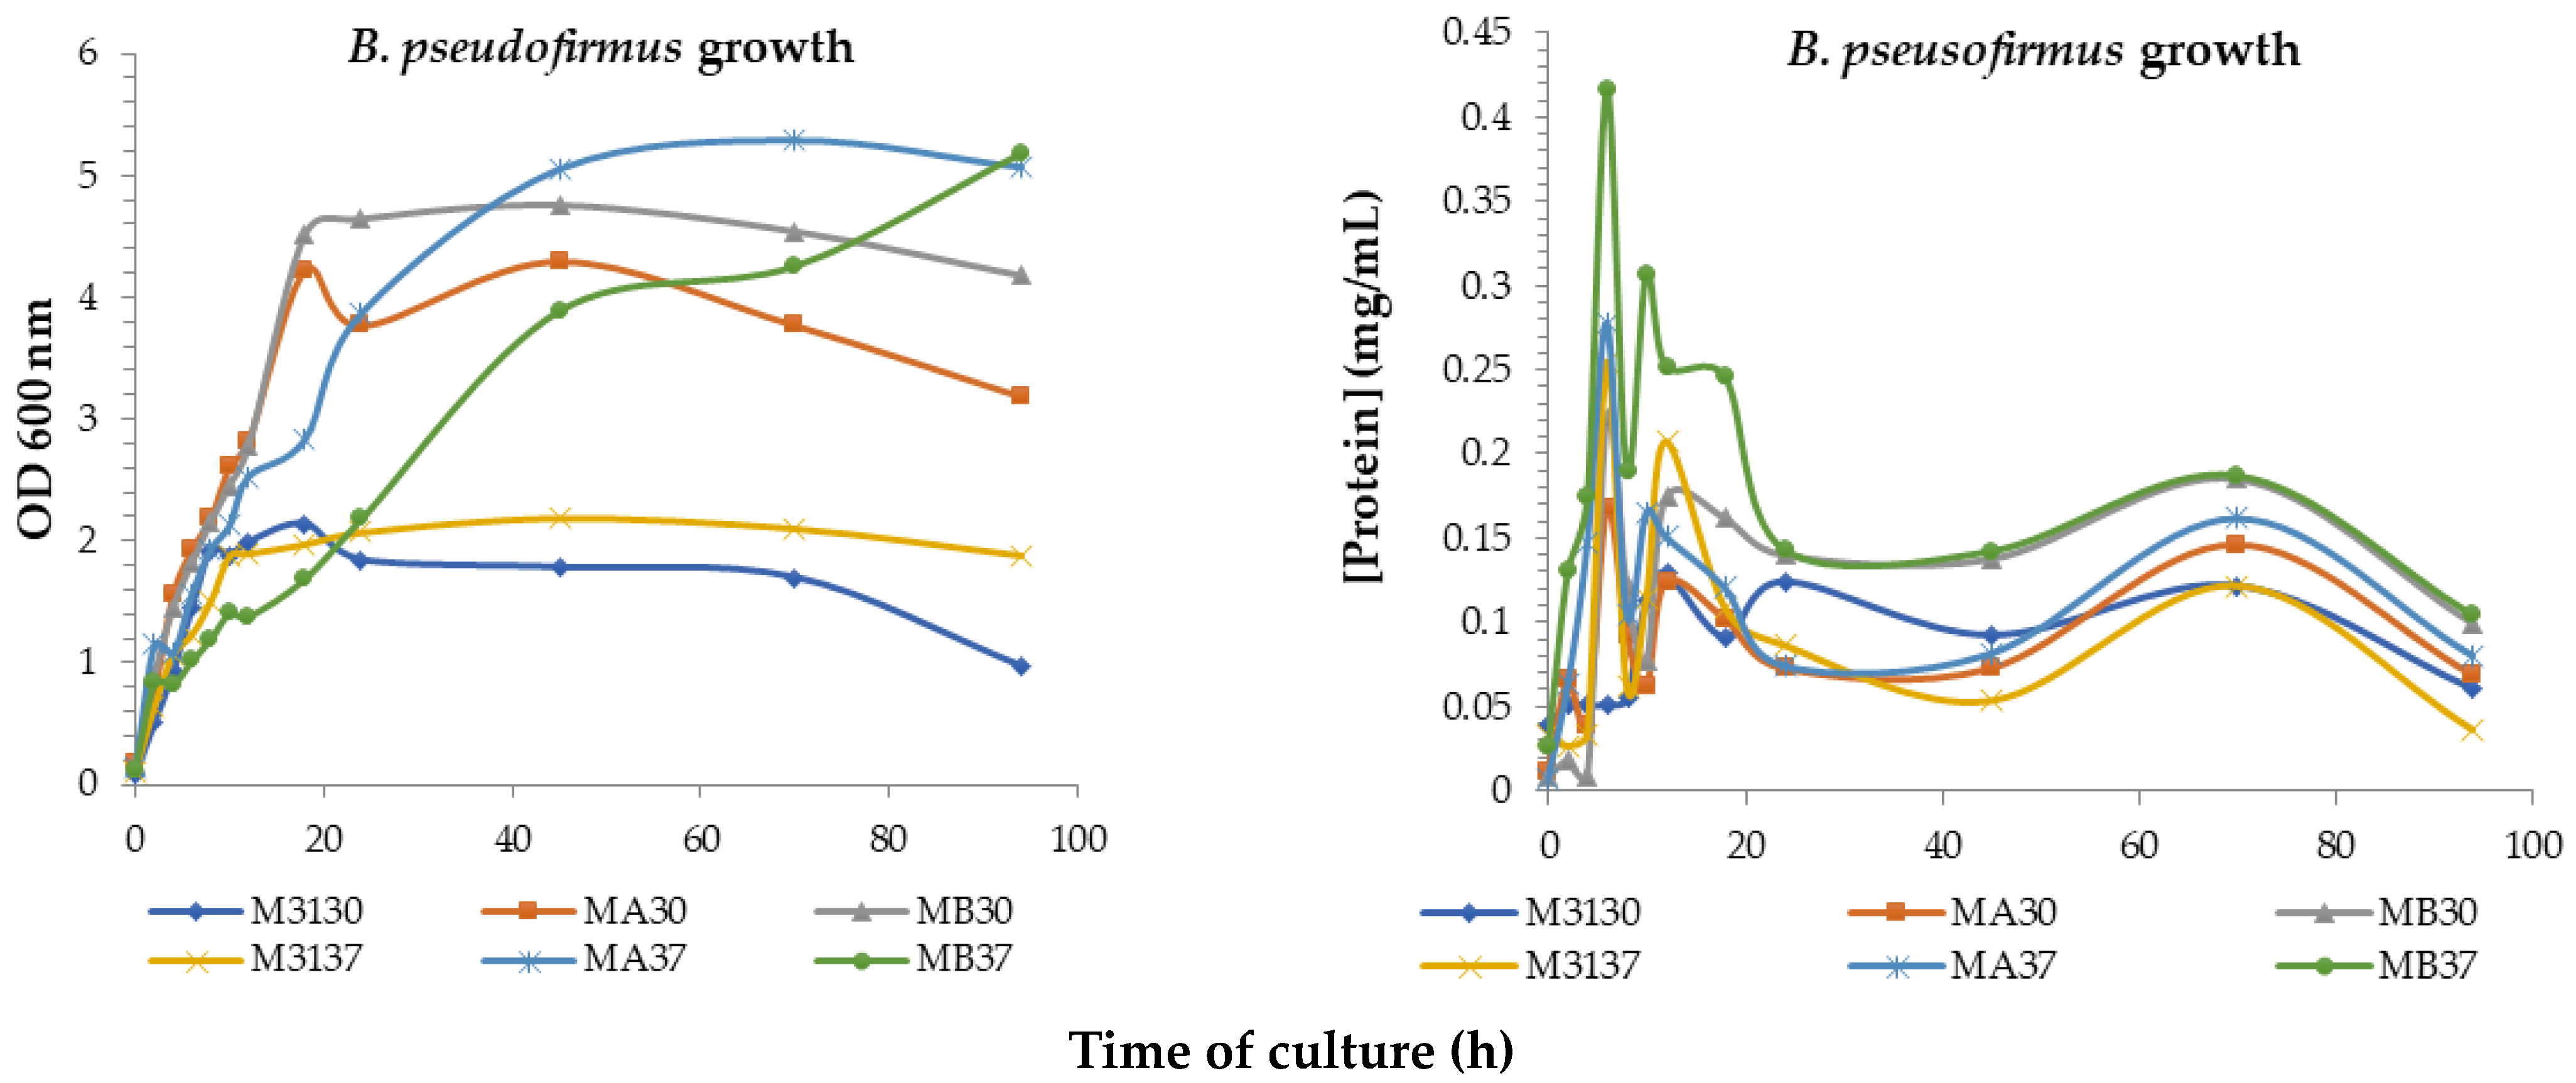
The results obtained for B. pseudofirmus are shown in Figure 7.
The results obtained enabled the determination of the kinetic parameters of bacterial growth (Specific growth rate—μ and duplication time—Td) and volumetric protein productivity (rP), Table 1.
In general, B. pseudofirmus exhibited (Figure 7) a rapid initial growth, without an observed lag phase. However, the growth slowed down around 20 h of culture, except for the cultures in media A and B at 37 °C, which maintained their growth rate. Between the 40 h and 70 h, most of the cultures entered in the decline phase.
The protein concentration followed a similar pattern in all the samples; with the values starting to stabilize after 20 h of culture, with a slight increase until the 70 h. The highest values of volumetric productivity (0.021 mg/mL h) were obtained in the medium B assays, at 37 °C.
The temperature had an influence on the growth behaviour of the bacteria. At 30 °C, a higher specific growth rate was observed, resulting a lower duplication time, an early onset early stationary and decline phase. Conversely, at 37 °C, the specific growth rate was lower, but the bacteria entered the stationary phase later. As CGTase production, no evidence of temperature influence found.
The growth medium 31, composed of meat extract and peptone, was intended to serve as a reference for comparison in CGTase production with medium A and B. This choice was made because medium 31 does not contain polysaccharides, which theoretically inhibit the synthesis of the enzyme. The differences between medium 31 and the other two mediums are more noticeable in terms of bacterial growth extent, with a significantly lower duplication time compared to that observed in medium A and B.
The best conditions for CGTase production were found to be in medium B at 30 °C. This choice was justified by the higher specific growth rate and the early onset of the stationary phase observed in this condition. Additionally, medium B yielded better results in terms of high protein values.
At the end of this phase of the study, additional measurements of CGTase activity were performed on the supernatant samples at bioreaction times 0, 1, 2, and 26 h, along with the final sample collected from the culture in the bioreactor.
The results obtained for Paenibacillus macerans are shown in Figure 8.
For all curves, except for the growth on Medium 1 at 37 °C, the lagtime was around 10 h, except for Medium 1 at 37 °C, which had a lagtime of 24 h. This difference in lagtime may be due to sub-optimal growth conditions, as the curve on Medium 1 at 30 °C, described by DSMZ as the optimal growth medium for this strain, did not exhibit a lagtime.
All growth curves showed a plateau, as expected after the exponential phase, indicating the onset of the stationary phase. However, all curves, except for Medium A at 37 °C, showed an unexpected increase after the stationary phase. This increase can be attributed to the fact that unlike Medium 1, both Medium A and B were supplemented with a saline solution to promote spore formation. It has been suggested that bacterial endospores have higher light retractability than their originating cells, resulting in increased optical density.
Although MnSO4, a salt referred to by DSMZ and Decker et al. [47], was not included in the medium description for spore formation, a few spores were observed during microscopic examination, indicating that MnSO4 might facilitate the speed and extent of spore formation but is not essential for the process to occur [47,48,49].
Based on the experimental results the growth variable were successfully evaluated (Table 2).
These results provide a mathematical understanding of the differences in growth kinetics associated with different media and temperatures. The variations observed in different media are likely related to the affinity of P. macerans enzymes for the substrate. On the other hand, temperature variations in bacilli cultures have been linked to changes in the metabolic pathway followed by the microorganism, leading to alterations in energy acquisition and growth kinetics [16,50,51].
In terms of protein concentration, a consistent pattern can be observed across all figures. During the exponential growth phase, there was an exponential increase in protein concentration, followed by a relatively constant concentration during the stationary growth phase. However, the variations in the initial performances may be attributed to intrinsic variations in the Bradford method or the presence of interfering metabolites.
The cross-analysis of both variables, optical density (OD 600 nm) and protein concentration, disclosed a distinct pattern. In the case of Medium 1, there was a decrease in both optical density and protein concentration, indicating cell death after the depletion of all nutrient sources and extracellular proteins. In contrast, the pattern was temperature-dependent rather than medium-dependent for Media A and B. At 30 °C, during sporulation, there was an increase in solubilized proteins due to the loss of intracellular proteins during the endospore release process. However, at 37 °C, the higher temperature seemed to affect the released proteins and underwent degradation.

3.4. Bioprocessing Scale up on the Bioreactor

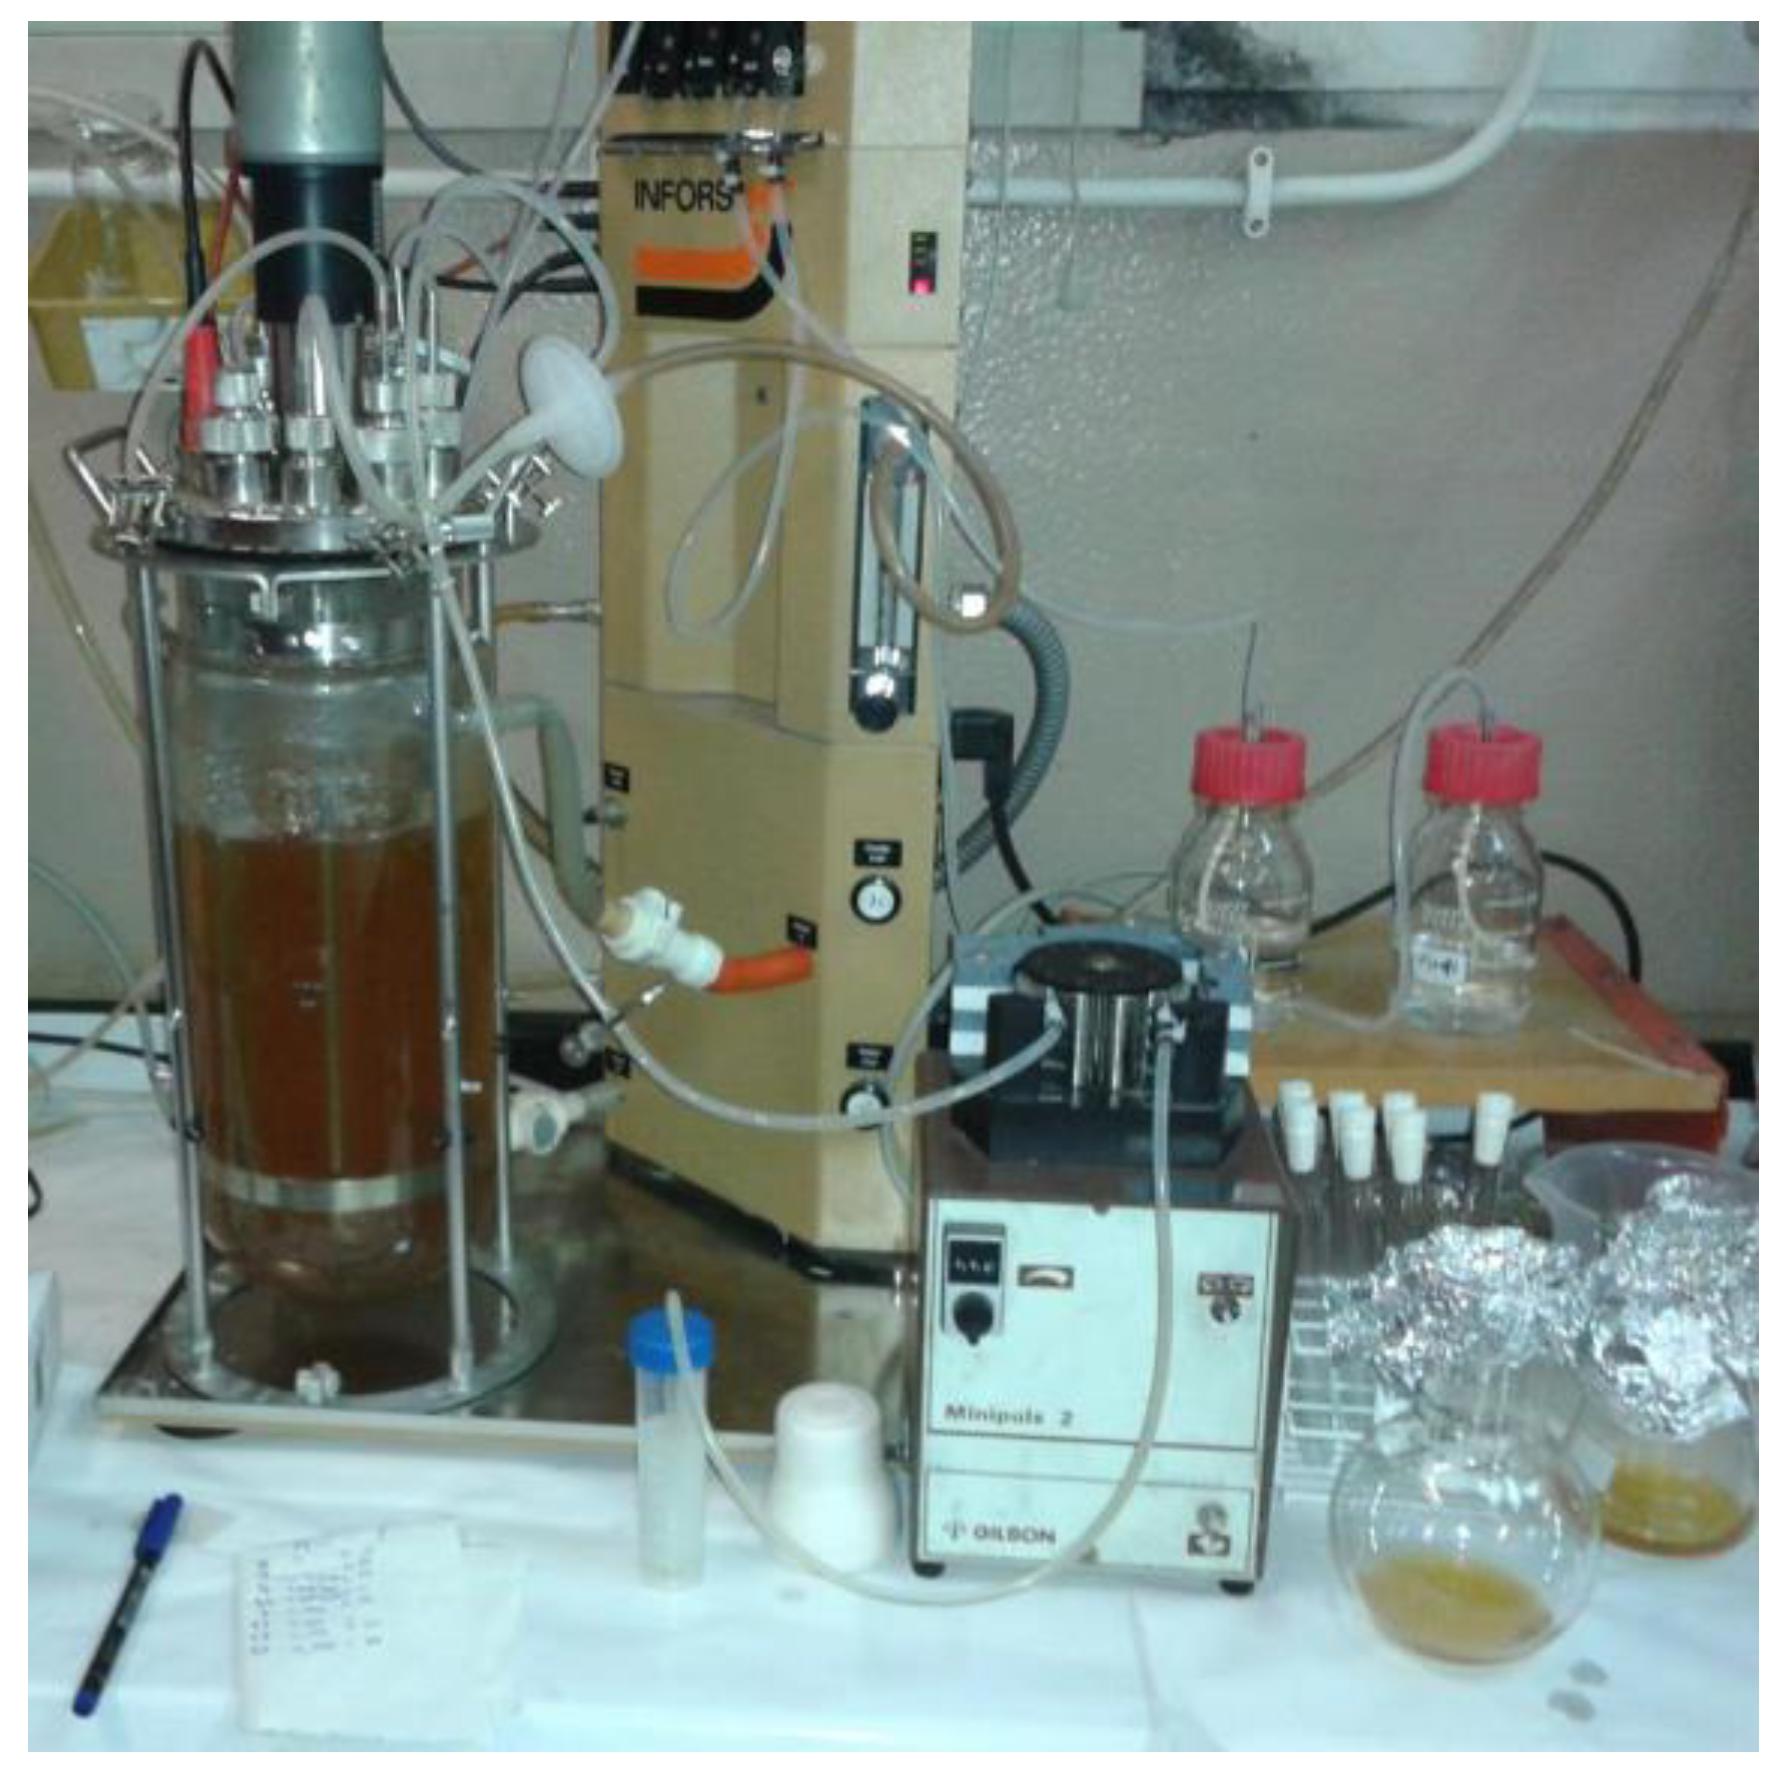
The main goal of this assay was to enhance bacterial growth and CGTase production over time in a bioreactor under controlled conditions, including pH, temperature, oxygen, and anti-foam measures (Figure 9). The optimal conditions from previous experiments were chosen for this particular assay, which comprised using medium B at 30 °C.
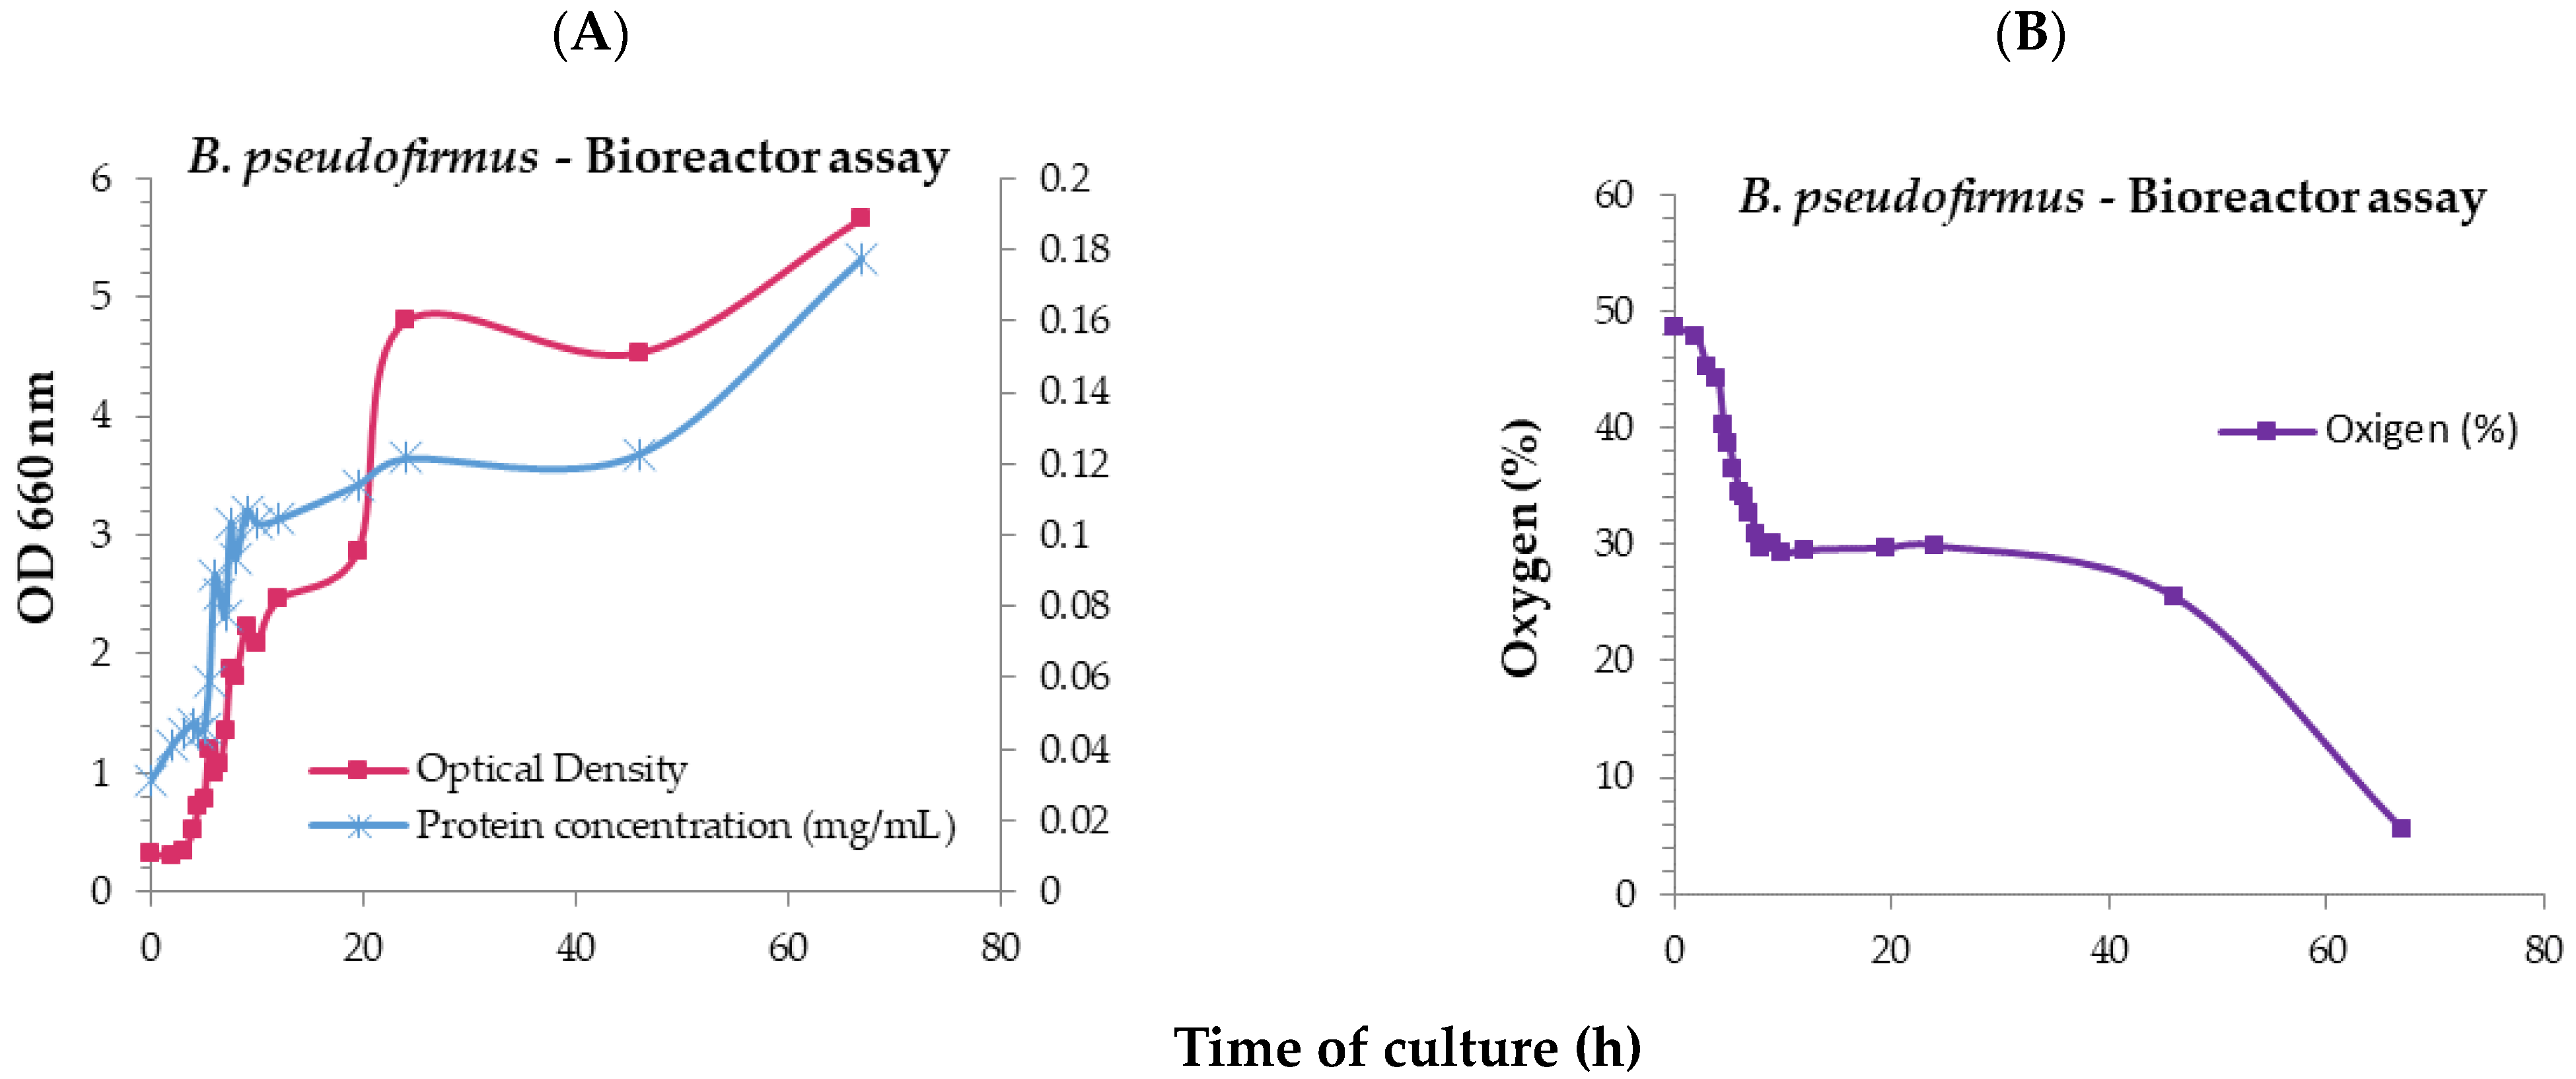
The results obtained for B. pseudofirmus are shown in the Figure 10.
The kinetic parameters were also determined and are shown in the Table 3.
The analysis of the results reveals that the culture in the batch bioreactor exhibited a higher specific growth rate and a lower duplication time compared to the flask culture under the same assay conditions. However, the volumetric protein productivity remained the same for both cultures. The oxygen levels generally decreased as bacterial growth became active, in a proportional manner, which was automatically controlled in the bioreactor.
The protein concentration values began to increase around the midpoint of the exponential phase, stabilizing during the stationary phase, and then starting to rise again after 45 h of culture, coinciding with the observed increase in optical density during the same period. One possible explanation for this behavior was the sporulation of the bacteria, likely due to nutrient depletion, as McCormick mentioned [48]. This sporulation process can increase optical density values, and the subsequent release of intracellular content into the culture could contribute to elevated protein concentration levels [48].
The results obtained for P. macerans are shown in Figure 11.
The growth of P. macerans followed a consistent pattern, exhibiting the main growth phases exponential and stationary (Figure 11). The protein concentration also followed a similar trend as observed in the flask assay experiments. However, it did not exhibit the same oscillations observed in the flask-based assay. This difference can be attributed to the more efficient mixing and oxygenation provided by the bioreactor’s axillar rotating paddles. In fact, the bioreactor experiment showed an increase in specific growth rate (μ) and a decrease in duplication time (Td).
From the analysis of the growth kinetics (Table 3), it was possible to conclude that scale transposition played an important role in the interaction between medium and temperature, resulting in an increased growth rate and volumetric protein productivity.

3.5. CGTase Activity and β-CD Production

The evaluation of β-CD production was carried out following the same procedures described for the CGTase activity assay. Initially, due to the low protein concentrations, the CGTase was concentrated using a Vivaspin 500® ultrafiltration spin column with a 10 kDa cut-off before the assay. Both the concentrate and the filtrate were assayed separately.
The absorbance values obtained for measuring the β-CD present in the samples of B. pseudofirmus are presented in Table 4, and the corresponding β-CD concentrations were determined using the equation mentioned in the analytical methods. Higuti et al. [44], Gawande et al. [52], and Moriwaki et al. [30] employed temperatures of 28 °C, 30 °C, and 37 °C, respectively, using a medium containing soluble starch (similar to medium A of this study) to produce CGTase [30,44,52]. Ibrahim et al. [53] found that the CGTase produced by the alkalophilic Bacillus G1 rapidly increased after 12 h of culture, stabilized after 36 h, and remained stable throughout the 120 h experiment [53]. Moriwaki et al. [30] utilized a 5-day incubation period to produce CGTase from B. firmus [30].
Due to the lack of literature information on the selected species of this work, Bacillus pseudofirmus, and its close physiological similarities to Bacillus firmus, the latter was chosen as the primary reference for information on CGTase and its production in this study. The most commonly mentioned Bacillus firmus strain in the literature is NCIM 5119. Gawande et al. [52] investigated this strain as a producer of cyclodextrins (CD) and observed that the CGTase produced by this alkalophilic Bacillus strain exhibited one of the highest reported yields and best ratios for β-CD production. The purified enzyme had a molecular weight of approximately 80 kDa, an optimal pH range between 5.5 and 8.5, and an optimal temperature for enzyme activity of 65 °C. It demonstrates stability below 30 °C (without substrate) and outside the pH range of 7–11 at 10 °C [52].
The β-CD was quantified in the samples collected after 24 and 48 h of culture for B. pseudofirmus. The values obtained from both the filtrate and concentrate of each sample indicate an increase in β-CD levels. The growth behavior and protein concentration progression observed in the majority of the samples also indicate that a culture time of 48 h is sufficient to have a maximum of β-CD level.
Regarding P. macerans, the β-CD was quantified in samples collected at 9, 15, and 33 h during the bioreactor culture cycle. The results clearly demonstrate the presence of of β-CD in all concentrated samples, indicating the presence of CGTase at the different times of analysis. The highest β-CD concentration (240 mg/mL) was obtained in the concentrate from 9 h. Chen et al. [54] produced 17.5 g/L of β-CD using immobilised CGTase, from B. circulans STBO1, while Solanki et al. [55] produced CGTase from Bacillus sp. with an improvement of 16% (93.42 U/mL).
There is a reduction in β-CD concentration from the earlier sample to the later ones. This reduction may be attributed to the denaturation of the enzyme during the culture cycle or concentration, which is consistent with the observations for B. pseudofirmus. It provides further evidence that the maximum activity of the enzyme, CGTase, occurs at an earlier stage of the culture.

4. Conclusions

The current work provided valuable insights into the ability of B. pseudofirmus and P.macerans to produce CGTase and, consequently, cyclodextrins (CDs). The conditions that yielded the best results in terms of protein concentrations were Medium B, which include in its composition dextrin (2%), peptone (0.5%) and yeast extract (0.5%), at 30 °C, making it the most suitable choice for CGTase biosynthesis. The scale of the system also played a crucial role, as growth kinetics improved with an increased medium volume in the controlled conditions of the bioreactor.
The amount of protein produced during the culture cycle is an indirect measure to assess CGTase production. A qualitative analysis was conducted on CGTase production. This analysis revealed significant amounts of β-CD in the concentrated solutions of CGTase for P. macerans, indicating the presence of actively synthesized enzyme in the culture medium.
To determine the optimal culture time for monitoring CGTase activity before the enzyme’s activity starts to decline, CGTase activity assays should be performed at additional time points during the culture cycle. Additionally, new quantitative methods for analyzing CDs should be developed to enhance the activity assays, enabling the quantitative analysis of alpha- and gamma-CDs as well. One proposed method is the use of an HPLC-IR apparatus with an aminopropyl-silan SGE column, as described by Moriwaki et al. [37]. Once the CGTase biosynthesis was optimized, further molecular properties, such as molecular weight and 3D structure, can be studied. The developed β-CD will be applied in drug delivery studies of model drugs, namely for the increase of solubility/dissolution such as ibuprofen, indomethacin and limonin [56,57,58]; and compared with the results already obtained with commercial β-CD.

Author Contributions

Conceptualization, M.H.L.R., A.M.G., T.F.S.A. and H.M.C.-M.; methodology, M.H.L.R., A.M.G., T.F.S.A. and H.M.C.-M..; validation, A.M.G., T.F.S.A.; formal analysis, M.H.L.R., A.M.G., T.F.S.A. and H.M.C.-M.; investigation, A.M.G., T.F.S.A..; resources, M.H.L.R.; writing—original draft preparation, A.M.G., T.F.S.A.; writing—review and editing, M.H.L.R., H.M.C.-M., P.J.S.; visualization, M.H.L.R., H.M.C.-M., P.J.S.; supervision, M.H.L.R., H.M.C.-M.; project administration, M.H.L.R.; funding acquisition, M.H.L.R. All authors have read and agreed to the published version of the manuscript.

Funding

This research was supported by FCT—Foundation for Science and Technology, I.P., through National Funds, under the projects UID/DTP/04138/2021.

Institutional Review Board Statement

Not applicable for studies not involving humans or animals.

Informed Consent Statement

Not applicable.

Data Availability Statement

Data is unavailable due to privacy.

Conflicts of Interest

The authors declare no conflict of interest.

References

  1. Loftsson, T.; Brewster, M.E. Pharmaceutical Applications of Cyclodextrins: Basic Science and Product Development. J. Pharm. Pharmacol. 2010, 62, 1607–1621. [Google Scholar] [CrossRef] [PubMed]
  2. Mario, J. Chapter Two-Cyclodextrin-Based Drug Delivery Systems. In Nanomaterials for Clinical Applications; Elsevier: Amsterdam, The Netherlands, 2020; pp. 29–69. [Google Scholar] [CrossRef]
  3. Adeoye, O.; Cabral-Marques, H. Cyclodextrin Nanosystems in Oral Drug Delivery: A Mini Review. Int. J. Pharm. 2017, 531, 521–531. [Google Scholar] [CrossRef] [PubMed]
  4. Szejtli, J.Z. Past, Present, and Future of Cyclodextrin Research. Pure Appl. Chem. 2004, 76, 1825–1845. [Google Scholar] [CrossRef] [Green Version]
  5. Oulson, B.G.; Alsulami, Q.A.; Sharfalddin, A.; El Agammy, E.F.; Mouffouk, F.; Emwas, A.-H.; Jaremko, L.; Jaremko, M. Cyclodextrins: Structural, Chemical, and Physical Properties, and Applications. Polysaccharides 2022, 3, 1–31. [Google Scholar] [CrossRef]
  6. Duchêne, D.; Bochot, A. Thirty Years with Cyclodextrins. Int. J. Pharm. 2016, 514, 58–72. [Google Scholar] [CrossRef] [PubMed]
  7. Szejtli, J. Introduction and General Overview of Cyclodextrin Chemistry. Chem. Rev. 1998, 98, 1743–1754. [Google Scholar] [CrossRef]
  8. Szente, L.; Szemán, J.; Sohajda, T. Analytical Characterization of Cyclodextrins: History, Official Methods and Recommended New Techniques. J. Pharm. Biomed. Anal. 2016, 130, 347–365. [Google Scholar] [CrossRef]
  9. Saokham, P.; Muankaew, C.; Jansook, P.; Loftsson, T. Solubility of Cyclodextrins and Drug/Cyclodextrin Complexes. Molecules 2018, 23, 1161. [Google Scholar] [CrossRef] [Green Version]
  10. Khalid, S.H.; Bashir, M.; Asghar, S.; Mallhi, T.H.; Khan, I.U. Effect of Cyclodextrin Derivatization on Solubility and Efficacy of Drugs. In Colloid Science in Pharmaceutical Nanotechnology; Intechopen: London, UK, 2019. [Google Scholar]
  11. Fujinami, S.; Fujisawa, M. Industrial Applications of Alkaliphiles and Their Enzymes--Past, Present and Future. Environ. Technol. 2010, 31, 845–856. [Google Scholar] [CrossRef]
  12. Leemhuis, H.; Kelly, R.M.; Dijkhuizen, L. Engineering of Cyclodextrin Glucanotransferases and the Impact for Biotechnological Applications. Appl. Microbiol. Biotechnol. 2010, 85, 823–835. [Google Scholar] [CrossRef] [Green Version]
  13. Schöffer, J.N.; Klein, M.P.; Rodrigues, R.C.; Hertz, P.F. Continuous Production of -Cyclodextrin from Starch by Highly Stable Cyclodextrin Glycosyltransferase Immobilized on Chitosan. Carbohydr. Polym. 2013, 98, 1311–1316. [Google Scholar] [CrossRef] [PubMed] [Green Version]
  14. Biwer, A.; Antranikian, G.; Heinzle, E. Enzymatic Production of Cyclodextrins. Appl. Microbiol. Biotechnol. 2002, 59, 609–617. [Google Scholar] [CrossRef] [PubMed]
  15. Rather, M.Y.; Ara, K.Z.G.; Nordberg Karlsson, E.; Adlercreutz, P. Characterization of Cyclodextrin Glycosyltransferases (Cgtases) and Their Application for Synthesis of Alkyl Glycosides with Oligomeric Head Group. Process Biochem. 2015, 50, 722–728. [Google Scholar] [CrossRef]
  16. Veen, B.A.V.D.; Uitdehaag, J.C.; Dijkstra, B.W.; Dijkhuizen, L. Engineering of Cyclodextrin Glycosyltransferase Reaction and Product Specificity. Biochim. Biophys. Acta 2000, 1543, 336–360. [Google Scholar] [CrossRef] [Green Version]
  17. Klein, C.; Schulz, G.E. Structure of Cyclodextrin Glycosyltransferase Refined at 2.0 Å Resolution. J. Mol. Biol. 1991, 217, 737–750. [Google Scholar] [CrossRef]
  18. Bender, H. Cyclodextrin Glucanotransferase from Klebsiella Pneumoniae. 2. Significance of the Enzyme for the Metabolism of Cyclodextrins by Klebsiella Pneumoniae M 5 Al (Author’s Transl). Arch. Microbiol. 1977, 113, 49–56. [Google Scholar] [CrossRef]
  19. Lee, J.-H.; Choi, K.; Choi, J.; Lee, I.-S.; Kwon, I.; Yu, J.-H. Enzymatic Production of A-Cuclodextrin with the Cyclomaltodextrin Gluconotransferase of Klebsiella Oxytoca 19–1. Enzym. Microb. Technol. 1992, 14, 1017–1020. [Google Scholar] [CrossRef]
  20. Wind, R.D.; Liebl, W.; Buitelaar, R.M.; Penningra, D.; Spreinat, A.; Dijkhuizen, L.; Bahl, H. Cyclodextrin Formation by The Thermostable Aamylase of Thermoanaerobacterium Thermosulfurigenes Em1 and Reclassification of the Enzyme as a Cyclodextrin Glycosyltransferase. Appl. Environ. Microbiol. 1995, 61, 1257–1265. [Google Scholar] [CrossRef] [Green Version]
  21. Kelly, R.M.; Dijkhuizen, L.; Leemhuis, H. The Evolution of Cyclodextrin Glucanotransferase Product Specificity. Appl. Microbiol. Biotechnol. 2009, 84, 119–133. [Google Scholar] [CrossRef] [Green Version]
  22. Zheng, J.; Li, X.; Wu, H. High-Level Extracellular Secretion and Characterization of the Thermophilic Β-Cyclodextrin Glucanotranferase from Paenibacillus Campinasensis in Escherichia Coli. 3 Biotech. 2019, 9, 372. [Google Scholar] [CrossRef]
  23. Preiss, L.; Hicks, D.B.; Suzuki, S.; Meier, T.; Krulwich, T.A. Alkaliphilic Bacteria with Impact on Industrial Applications, Concepts of Early Life Forms, and Bioenergetics of Atp Synthesis. Front. Bioeng. Biotechnol. 2015, 3, 75. [Google Scholar] [CrossRef] [PubMed] [Green Version]
  24. Elbaz, A.F.; Sobhi, A.; Elmekawy, A. Purification and Characterization of Cyclodextrin Β-Glucanotransferase from Novel Alkalophilic Bacilli. Bioprocess Biosyst. Eng. 2015, 38, 767–776. [Google Scholar] [CrossRef] [PubMed]
  25. Wang, H.; Zhou, Z.; Li, H.; Bu, R. Optimization of the Fermentation Conditions for the Mutant Strain of Β-Cyclodextrin Glycosyltransferase H167c to Produce Cyclodextrins. 3 Biotech. 2018, 8, 165. [Google Scholar] [CrossRef] [PubMed]
  26. Strain Passport Bacillus Pseudofirmus Dsm2517. Available online: http://www.straininfo.net/strains/119820 (accessed on 28 December 2010).
  27. Gordon, R.E.; Hyde, J.L. The Bacillusfirmus-Bacillus Lentus Complex and Ph 7.0 Variants Of Some Alkalophilic Strains. Microbiology 1982, 128, 1109–1116. [Google Scholar]
  28. Fritze, D.; Flossdorf, J.; Claus, D. Taxonomy of Alkaliphilic Bacillus Strains. Int. J. Syst. Bacteriol. 1990, 40, 92–97. [Google Scholar] [CrossRef] [PubMed]
  29. Nieisen, P.; Fritze, D.; Priest, F.G. Phenetic Diversity of Alkaliphilic Bacillus Strains: Proposal for Nine New Species. Microbiology 1995, 141, 1745–1761. [Google Scholar] [CrossRef] [Green Version]
  30. Moriwaki, C.; Mazzer, C.; Pazzetto, R.; Matioli, G. Produção, Purificação e Aumento da Performance de Ciclodextrina Glicosiltransferase Para Produção de Ciclodextrinas. Quim. Nova 2009, 32, 2360–2366. [Google Scholar] [CrossRef] [Green Version]
  31. Rendleman, J.A. The Production of Cyclodextrins Using Cgtase from Bacillus Macerans. In Carbohydrate Biotechnology Protocols; Methods in Biotechnology; Springer: Berlin/Heidelberg, Germany, 2008; pp. 89–101. [Google Scholar]
  32. Yang, Y.-N.; Shan, W.-X.; Wang, P.-W. Upscale Production of a Recombinant Cyclodextrin Glycosyltransferase from Paenibacillus Macerans in Escherichia Coli. 3 Biotech. 2017, 7, 207. [Google Scholar] [CrossRef]
  33. Schardinger, F. Bacillus Macerans Ein Aceton Bildender Rottebacillus. Zbl Bakteriol Parasitenkd Infektionskr Hyg Abt Ii 1905, 14, 772–781. [Google Scholar]
  34. Ash, C.; Priest, F.G.; Collins, M.D. Molecular Identification Of Rrna Group 3 Bacilli (Ash, Farrow, Wallbanks And Collins) Using A Pcr Probe Test. Antonie Van Leeuwenhoek 1993, 64, 253–260. [Google Scholar] [CrossRef]
  35. Fujiwara, S.; Kakihara, H.; Woo, K.B.; Lejeune, A.; Kanemoto, M.; Sakaguchi, K.; Imanaka, T. Cyclization Characteristics of Cyclodextrin Glucanotransferase Are Conferred by the Nh2-Terminal Region of the Enzyme. Appl. Environ. Microbiol. 1992, 58, 4016–4025. [Google Scholar] [CrossRef] [PubMed] [Green Version]
  36. Jiang, Y.; Zhou, J.; Wu, R.; Xin, F.; Zhang, W.; Fang, Y.; Ma, J.; Dong, W.; Jiang, M. Heterologous Expression of Cyclodextrin Glycosyltransferase from Paenibacillus Macerans in Escherichia Coli and Its Application in 2-O-A-D-Glucopyranosyl-Lascorbic Acid Production. Bmc Biotechnol. 2018, 18, 53. [Google Scholar] [CrossRef] [PubMed]
  37. Qi, Q.; Zimmermann, W. Cyclodextrin Glucanotransferase: From Gene to Applications. Appl. Microbiol. Biotechnol. 2005, 66, 475–485. [Google Scholar] [PubMed]
  38. Dsmz Catalogue Paenibacillus Macerans (Schardinger 1905), Ash Et Al. 1994. Available online: http://www.dsmz.de/catalogues/details/culture/DSM-1574.html (accessed on 28 December 2010).
  39. Nakamura, N.; Horikoshi, K. Characterization and Some Cultural Conditions of a Cyclodextrin Glycosyltransferase-Producing Alkalophilic Bacillus Sp. Agr. Bioi. Chem. 1976, 40, 753–775. [Google Scholar] [CrossRef]
  40. Bradford, M.M. A Rapid and Sensitive Method for the Quantitation of Microgram Quantities of Protein Utilizing the Principle of Protein-Dye Binding. Anal. Biochem. 1976, 72, 248–254. [Google Scholar] [CrossRef]
  41. Nunes, M.A.P.; Vila-Real, H.; Fernandes, P.C.B.; Ribeiro, M.H.L. Immobilization of Naringinase in Pva–Alginate Matrix Using an Innovative Technique. Appl. Biochem. Biotechnol. 2010, 160, 2129–2147. [Google Scholar] [CrossRef]
  42. Kuwabara, T.; Takamura, M.; Matsushita, A.; Ikeda, H.; Nakamura, A.; Ueno, A.; Toda, F. Phenolphthalein-Modifíed Β-Cyclodextrin as A Molecule-Responsive Colorless-to-Color Change Indicator. J. Org. Chem. 1998, 63, 8729–8735. [Google Scholar] [CrossRef]
  43. Nakatani, H.; Hiromi, K. Kinetic Study of Beta-Cyclodextrin-Dye System by High-Pressure Temperature-Jump Method. J. Biochem. 1984, 96, 69–72. [Google Scholar] [CrossRef]
  44. Higuti, I.H.; Anunciação Da Silva, P.; Papp, J.; Okiyama, V.M.E.; Andrade, E.A.; Aluizio De Abreu Marcondes, A.A.; Nascimento, A.J. Colorimetric Determination of α and β-Cyclodextrins and Studies on Optimization OF Cgtase Production from B. Firmus Using Factorial Designs. Braz. Arch. Biol. Technol. 2004, 47, 837–841. [Google Scholar] [CrossRef] [Green Version]
  45. Dsmz Catalogue Bacillus Pseudofirmus Nielsen Et Al. 1995. Available online: http://www.dsmz.de/catalogues/details/culture/DSM-2517.html (accessed on 28 December 2010).
  46. Atcc Catalogue, B. Pseudofirmus Atcc21593. Available online: http://www.atcc.org/ATCCAdvancedCatalogSearch/ProductDetails/tabid/452/Default.aspx?ATCCNum=21593&Template=bacteria (accessed on 4 February 2010).
  47. Decker, S.; Maier, S. Fine Structure of Mesosomal Involvement during Bacillus Macerans Sporulation. J. Bacteriol. 1975, 121, 363–372. [Google Scholar] [CrossRef] [Green Version]
  48. Mccormick, N.G. Kinetics of Spore Germination. J. Bacteriol. 1965, 89, 1180–1185. [Google Scholar] [CrossRef] [PubMed] [Green Version]
  49. Prescott, L.M.; Harley, J.P.; Klein, D.A. Microbiology, 6th ed.; Mcgraw-Hill Higher Education: Dubuque, IA, USA, 2005. [Google Scholar]
  50. Rosso, A.M.; Rosso, A.M.; Ferrarotti, S.A.; Krymkiewicz, N.; Nudel, B. Optimisation of Batch Culture Conditions for Cyclodextrin Glucanotransferase Production from Bacillus Circulans Df 9r. Microbial. Cell. Factories 2002, 1, 3. [Google Scholar] [CrossRef] [PubMed]
  51. Chung, B.H.; Cannon, R.Y.; Smith, R.C. Influence of Growth Temperature on Glucose Metabolism of a Psychotrophic Strain of Bacillus Cereus. Appl. Environ. Microbiol. 1976, 31, 39–45. [Google Scholar] [CrossRef] [PubMed] [Green Version]
  52. Gawande, B.N.; Goel, A.; Patkar, A.Y.; Nene, S.N. Purification and Properties of a Novel Raw Starch Degradingcyclomaltodextrin Glucanotransferase from Bacillus Firmus. Appl. Microbiol. Biotechnol. 1999, 51, 504–509. [Google Scholar] [CrossRef]
  53. Ibrahim, H.M.; Yusoff, W.M.W.; Hamid, A.A.; Illias, R.M.; Hassan, O.; Omar, O. Optimization of Medium for The Production Of Β-Cyclodextrin Glucanotransferase Using Central Composite Design (Ccd). Process Biochem. 2005, 40, 753–758. [Google Scholar] [CrossRef]
  54. Chen, S.; Li, Z.; Gu, Z.; Ban, X.; Hong, Y.; Cheng, L.; Li, C. Immobilization of Β-Cyclodextrin Glycosyltransferase on Gelatin Enhances β-Cyclodextrin Production. Process Biochem. 2022, 113, 216–223. [Google Scholar] [CrossRef]
  55. Solanki, P.; Awadhiya, P.; Banerjee, T. Conventional Production Optimization of Cyclodextrin Glucosyl Transferase by a Novel Isolate of Bacillus Sp. Pbs1 from Potato Rhizosphere. J. Microbiol. Biotech. Food Sci. 2022, 12, E5130. [Google Scholar] [CrossRef]
  56. Salústio, P.J.; Feio, G.; Figueirinhas, J.L.; Pinto, J.F.; Cabral-Marques, H.M. The Influence of The Preparation Methods on the Inclusion of Model Drugs in a β-Cyclodextrin Cavity. Eur. J. Pharm. Biopharm. 2009, 71, 377–386. [Google Scholar] [CrossRef] [Green Version]
  57. Salústio, P.J.; Cabral-Marques, H.M.; Costa, P.C.; Pinto, J.F. Release Profiles of Indometacin IN ß-Cyclodextrin Complexes from Hpmc Capsules. J. Incl. Phenom. Macrocycl. Chem. 2013, 75, 101–109. [Google Scholar] [CrossRef]
  58. Vieira Da Silva, S.A.; Clemente, A.; Rocha, J.; Direito, R.; Cabral-Marques, H.M.; Sepodes, B.; Figueira, M.-E.; Ribeiro, M.H. Anti-Inflammatory Effect of Limonin from Cyclodextrin (Un)Processed Orange Juices in In Vivo Acute Inflammation and Chronic Rheumatoid Arthritis Models. J. Funct. Foods 2018, 49, 146–153. [Google Scholar] [CrossRef]
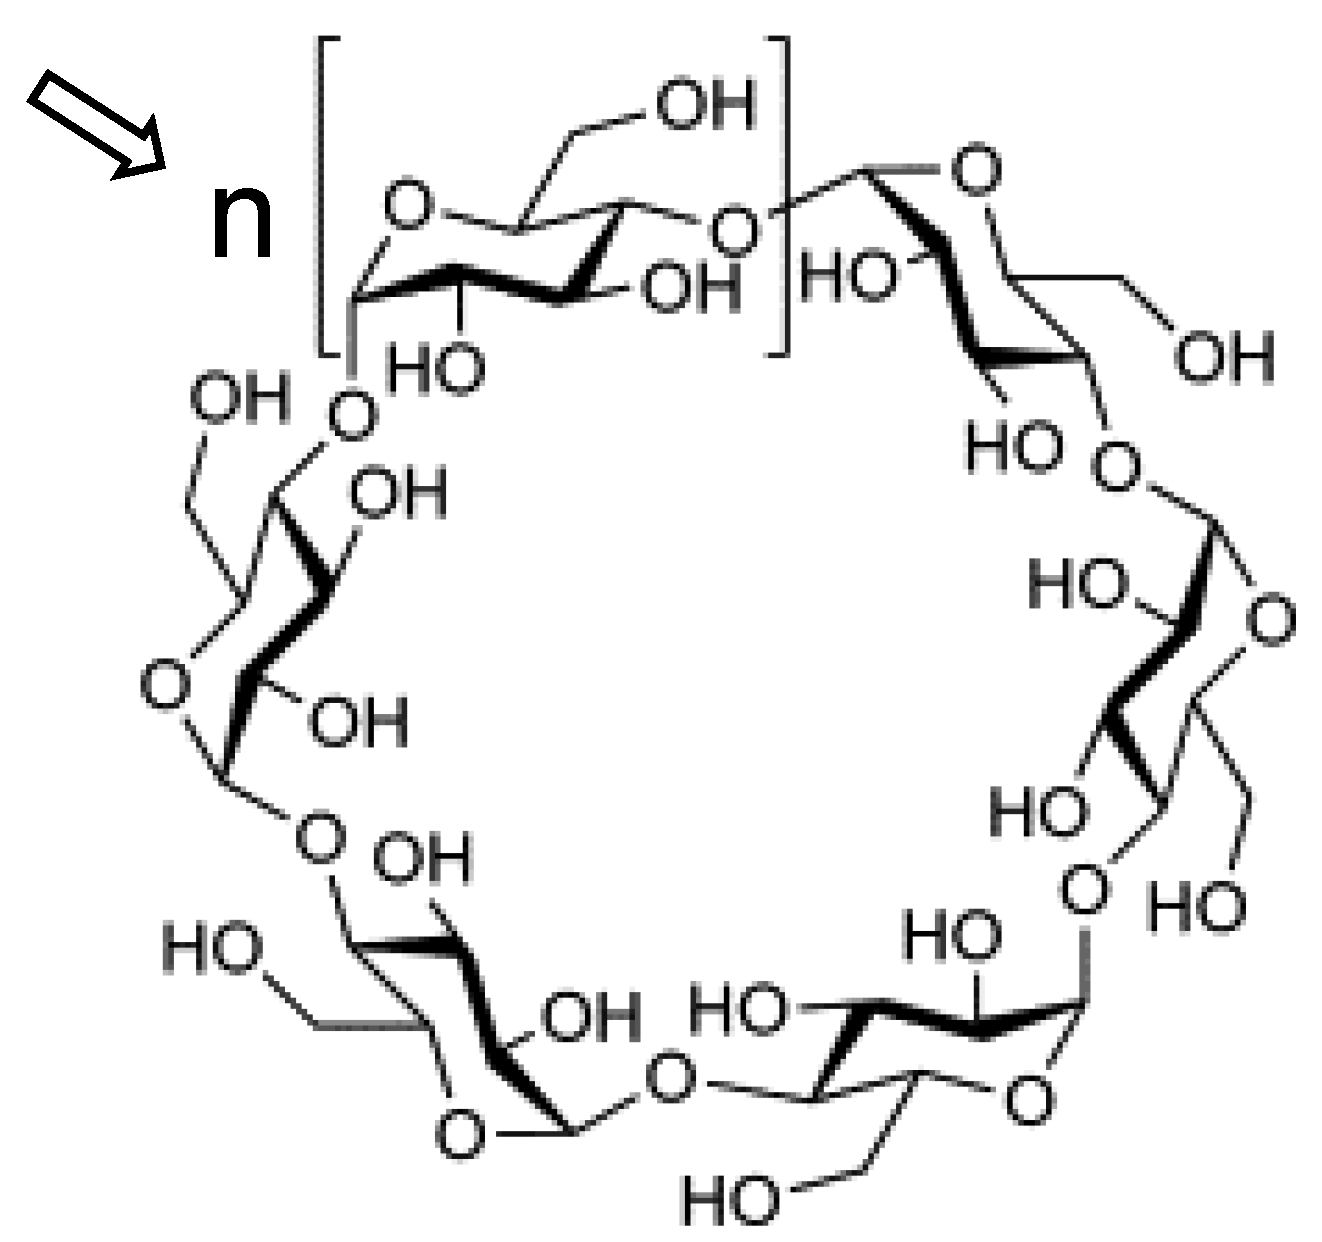
Figure 1. Molecular Structure of α-, β-, and γ-cyclodextrin, (n = 1, n = 2, n = 3, respectively).
Futurepharmacol 03 00035 g001
Figure 2. (a) Solvent process for cyclodextrin production; (b) Non-solvent process for CD production (here for βCD production).
Futurepharmacol 03 00035 g002
Figure 3. Action of enzymes involved in the production of dextrin, including cyclodextrins from starch. (●) Glucose molecule with a reducing end; (○) glucose molecule without a reducing end. Arrows indicate preferred cleaving points in the starch molecule, adapted from [16].
Futurepharmacol 03 00035 g003
Figure 4. Microscopic and macroscopic observation of B. pseudofirmus DSM2517.
Futurepharmacol 03 00035 g004
Figure 5. Microscopic and macroscopic observation of P. macerans DSM 1574.
Futurepharmacol 03 00035 g005
Figure 6. Results of total protein production for B. pseudofirmus (A) and P. macerans DSM 1574 (B). The control assays refer to the sterile culture media.
Futurepharmacol 03 00035 g006
Figure 7. B. pseudofirmus growth (OD 600 nm) and protein concentration in CGTase production assays, at 30 °C and 37 °C, using different media (Medium 31—M 31, Medium A—MA and Medium B—MB).
Futurepharmacol 03 00035 g007
Figure 8. Growth curve of Paenibacillus macerans for Medium 1 (30 and 37° C); Growth Curve for Medium A (1% Starch, at 30 and 37 °C); Growth Curve for Medium B (2% Dextrins, 30 and 37 °C); Protein Concentration for Medium 1 (30 and 37 °C); Protein Concentration for Medium A (1% Starch, at 30 and 37 °C); Protein Concentration for Medium B (2% Dextrin, 30 and 37 °C); Concentration and Optical Density (OD 600 nm) in Medium B and Temperature (30 and 37 °C).
Futurepharmacol 03 00035 g008
Figure 9. The Bioreactor INFORS AG CH-4103 used for the growth assays of Bacillus pseudofirmus and CGTase and β-cyclodextrin production.
Futurepharmacol 03 00035 g009
Figure 10. Bacterial growth (OD 600 nm), and protein concentration (A) and oxygen (%) (B), in large-scale assay of CGTase production with B. pseudofirmus, in a batch bioreactor.
Futurepharmacol 03 00035 g010
Figure 11. P. macerans growth in a bioreactor, using medium B, at 30 °C, protein concentration ((blue line) and Optical Density (OD600 nm) (orange line).
Futurepharmacol 03 00035 g011
Table 1. Growth Kinetic Parameters for B. pseudofirmus (shake flask) (μ—Specific growth rate, Td—duplication time, rP—volumetric protein productivity).
Culture Mediaμ (h−1)Td (h)rP (mg/mL h)
30 °C37 °C30 °C37 °C30 °C37 °C
Medium 310.2240.1263.095.500.0110.017
Medium A0.1690.0914.107.610.0100.013
Medium B0.1450.0714.789.760.0140.021
Table 2. Growth Kinetic Parameters for P. macerans (shake flask) (μ—Specific growth rate, Td—duplication time, rP—volumetric protein productivity).
Culture Mediaμ (h−1)Td (h)rP (mg/mL h)
30 °C37 °C30 °C37 °C30 °C37 °C
Medium 10.1380.7355.024.000.0050.007
Medium A0.1710.2174.057.610.0060.013
Medium B0.2030.2693.419.760.0100.021
Table 3. Growth kinetic parameters for B. pseudofirmus and P. macerans (Medium B), in bioreactor, at 30 °C (μ—specific growth rate, Td—duplication time, rP—volumetric protein productivity).
Medium Bμ (h−1)Td (h)rP (mg/mL h)
B. pseudofirmus0.3052.270.014
P. macerans0.2512.760.014
Table 4. β-CD production after CGTase assays for B. pseudofirmus, and P. macerans, at 30 °C in Medium B.
SamplesAbsorbance[β-CD] (mmol/mL)
Blank (PHE + H2O)1.5640
MicrorganismsFiltrateConcentrateFiltrateConcentrate
B. pseudofirmus T24h1.5171.4480.0140.035
B. pseudofirmus T48h1.4881.4640.0230.030
P. macerans T9h1.5110.8780.0160.211
P. macerans T15h1.4730.9620.0280.186
P. macerans T33h-1.252-0.100
Disclaimer/Publisher’s Note: The statements, opinions and data contained in all publications are solely those of the individual author(s) and contributor(s) and not of MDPI and/or the editor(s). MDPI and/or the editor(s) disclaim responsibility for any injury to people or property resulting from any ideas, methods, instructions or products referred to in the content.