1. Introduction
Coronavirus disease 2019 (COVID-19) has evolved into a global pandemic following the emergence of a novel coronavirus, severe acute respiratory syndrome coronavirus 2 (SARS-CoV-2). As of 10 December 2022, the World Health Organization (WHO) has reported over 643 million confirmed cases and a lamentable toll of over 6.6 million deaths worldwide [
1]. Effectively mitigating the impact of COVID-19 necessitates collaborative efforts to comprehend and predict the multifaceted aspects of this complex phenomenon. This includes the development of accurate epidemic-spreading models and the exploration of both non-pharmaceutical and pharmaceutical intervention policies [
2,
3,
4,
5,
6,
7,
8,
9].
Despite stringent measures such as travel bans, mask mandates, gathering restrictions, and the closure of public transport and schools, coupled with vaccination efforts and novel antiviral drugs, the pandemic has persisted with an alarming increase in cases in the United States and globally [
10]. Since December 2021, the emergence of new Omicron variants has propelled the COVID-19 pandemic to a new peak, surpassing the previous apex of April 2021 [
11,
12,
13]. By July 2022, BA.5, an Omicron subvariant, had become one of the dominant strains in the United States [
14,
15]. Although global infection cases and deaths have recently shown a decline, some regions, countries, and cities are grappling with an unprecedented surge. China, for instance, is contending with a surge in infections, following the easing of COVID-19 policies in early December 2022.
A fundamental goal of epidemiological modeling is the development of an efficient risk prediction model. This model empowers public health workers and governments to assess the efficacy of public health protocols and predict the risk of COVID-19 infection at regional and national levels. However, the complexities of infection spread render prominent compartmental models unreliable [
16,
17,
18]. Challenges arise due to limited data, making it difficult to model population density, the impact of viral mutations, human mobility under varying lockdown levels, and qualitative social aspects such as culture and lifestyle [
19,
20]. Despite these challenges, research indicates that region-based mitigation factors, including lockdown levels and monitoring, significantly influence infection rates [
21,
22,
23].
A noteworthy gap exists in the literature regarding the combined use of compartmental and deep learning-based prediction approaches for COVID-19. Our work seeks to address this gap by demonstrating the utility of parsimonious differential equations models and deep learning methods. By employing parsimoniously designed models, we aim to identify critical pandemic features and make policy-relevant discoveries, even with limited data. This approach provides a robust framework for a broader cohort of quantitative researchers to predict COVID-19 infections and enhance our understanding of the ongoing pandemic.
In this study, we underscore the pivotal role of spatial heterogeneity in computational epidemiology. Our focus centers on the development of a hybrid spatiotemporal epidemic model aimed at forecasting infection numbers. This model combines the susceptible–infectious–recovered–deceased (SIRD) compartmental model with a long short-term memory (LSTM) network, addressing the need for a comprehensive approach in predicting the dynamics of infectious diseases. Notably, our spatiotemporal model integrates human mobility by incorporating infection rates from neighboring regions, thus surpassing the predictive capabilities of standalone conventional epidemiological or machine learning-based models. This integration results in enhanced prediction accuracy, mitigating tendencies to over- or under-fit, as evidenced by our findings [
24].
The key contributions of this study include the following:
Introduction of the SIRD–eRNN (edge recurrent neural network) model, a hybrid combining the compartmental model with the RNN model, tailored for predicting infection numbers.
Demonstration of significantly reduced model prediction errors, compared to a pure RNN model.
Enhancement of precision and accuracy in short- and medium-term trend forecasting by the SIRD–eRNN model.
Compatibility and generalizability of the proposed model, allowing for the seamless addition of more compartments.
Preliminary results indicate that integrating compartmental and RNN models effectively heightens epidemic trend prediction accuracy, aligning closely with real-world data and holding valuable implications for practical epidemic forecasting.
The paper’s structure unfolds as follows:
Section 2 reviews related research, providing context for our contributions. In
Section 3, we articulate the problem statement and detail our approaches.
Section 4 delves into experiential details, evaluation criteria, performance comparison, and insightful conclusions drawn from the analysis. Finally,
Section 5 offers concluding remarks and outlines avenues for future studies, ensuring a comprehensive understanding of the implications and potential advancements in computational epidemiology.
2. Related Works
A plethora of epidemic models has recently emerged to capture the dynamics of COVID-19 and evaluate the efficacy of countermeasures like social distancing, contact tracing, and testing. Two prominent categories of methodologies in epidemiological modeling include mechanistic modeling, rooted in mathematical literature on dynamical systems, and data science methodologies in medicine and public health [
25,
26]. Compartmental models, a simplified form of infectious disease mathematical modeling, are often governed by ordinary differential equations, exemplified by the SIRD model. This model encapsulates the basic mechanisms of an epidemic, categorizing individuals in a population as susceptible, infected, recovered, or deceased. However, challenges arise when certain variables, such as those related to asymptomatic carriers, are not empirically available, necessitating estimation through statistical models or optimization procedures based on observed data.
While the SIRD model is efficient for temporal data, it shares critical limitations with similar compartmental models. Firstly, the choice of variables is crucial and must adequately characterize the spreading mechanisms of a particular disease, posing challenges when understanding these mechanisms is incomplete. Secondly, SIRD simplifies human mobility or contact structures for mathematical tractability, neglecting the complexity introduced by spatiotemporal data, as evident in the case of COVID-19 [
27,
28].
In response to these challenges, machine learning models have been proposed to estimate the dynamics of COVID-19 transmission. For example, Huang et al. [
29] employed a convolutional neural network to predict the cumulative number of COVID-19 deaths, while Bock et al. [
30] explored the performance of different deep learning models with varying input data. El Hajji et al. [
31] proposed a dynamical system involving both deterministic (with or without delay) and stochastic “SIR” epidemic models with nonlinear incidence rates in a continuous reactor is considered. Bousquet et al. [
32] introduced an algorithm combining the SIR model with the LSTM neural network, allowing real-time forecasting and time-dependent parameter estimates. Ma et al. [
33] proposed an LSTM–Markov model, integrating the LSTM model’s output with the prediction errors of the Markov model to reduce errors. However, existing models often consider only the number of confirmed cases without incorporating other factors such as human mobility.
As the epidemic progresses, surveillance data become more detailed, raising the question of extending the SIRD temporal model to a spatiotemporal model. This extension would enable the inclusion of information from spatially neighboring regions, enhancing risk prediction. Notably, deep learning models, while powerful, require substantial training data. In the case of the novel SARS-CoV-2 virus, data scarcity leads to gradient vanishing and explosion problems, making the direct application of spatiotemporal LSTM models to COVID-19 challenging [
34].
In this study, we introduce the SIRD-eRNN hybrid model, which integrates time-dependent features from the SIRD model with the incorporation of human mobility effects through LSTM. A discrete-time function is derived specifically for the infectious (I) component of the SIRD model. The construction of the SIRD-eRNN model is inherently parsimonious, offering enhanced interpretability, computational efficiency, and resistance to overfitting. Notably, these models can operate in real-time and demonstrate effectiveness even with relatively modest amounts of training data. A notable advantage of our hybrid model is its ability to estimate parameters, including those within the mechanistic model, without reliance on subjectively chosen prior information. This flexibility enhances the adaptability of the model to diverse scenarios. Our approach is scalable and robust, effectively extracting crucial dynamics underlying disease transmission mechanisms from publicly available surveillance data. This scalability ensures accurate predictions of future disease infections, reinforcing the utility and reliability of our proposed model in forecasting and understanding the trajectory of the ongoing pandemic.
3. Proposed Model
To achieve precise and efficient forecasting of the COVID-19 spread, we present a hybrid model that seamlessly integrates the SIRD time-dependent features with the influence of human mobility through an LSTM network. The intricacies of this hybrid model are elucidated in the following sections.
3.1. Susceptible–Infectious–Recovered–Deceased Compartmental Epidemiology Process Model
A modification of the Kermack–McKendrick equations offers a robust framework for capturing the dynamics of disease. The classical SIR model delineates a population into susceptible, infected, and recovered compartments to depict the progression of a contagious ailment. Expanding upon this, the SIRD model introduces a mortality compartment, providing a nuanced representation by distinguishing deaths from recoveries. Particularly valuable for addressing the challenges posed by severe diseases such as COVID-19, the SIRD model facilitates a more realistic portrayal of outbreaks.
By segregating deaths and recoveries, the SIRD model enhances the capacity for in-depth analysis of the entire disease burden and its impact on the population. This comprehensive understanding, integral for informed public health planning and interventions, contributes significantly to refining strategies in the face of the ongoing pandemic.
Furthermore, our consideration extends to a specific geographical region, assumed to have connections with proximate neighbors and isolation from other regions. Within this context, we define key quantities that form the basis of our analytical exploration.
: the number of susceptible individuals at time for any ;
: the number of infected individuals at time for any ;
: the cumulative number of recovered individuals up to time for any ;
: the number of deceased as a result of the disease up to time for any .
We introduce an innovative spatiotemporal model that amalgamates spatial information with a discrete-time infection equation (I-equation) derived from the SIRD differential equations. The I-equation adeptly captures observed temporal dynamics, while a recurrent neural network (RNN) is deployed to capture latent spatial information. Distinct from the original method [
22], our model, termed SIRD–eRNN, distinguishes itself by utilizing a differential equation with only three parameters (the I-equation) to accommodate limited temporal data. This characteristic renders the I-equation notably more concise than the RNN.
The following equations describe the proposed SIRD–eRNN model:
where
β is the transmission rate,
γ is the recovery rate, and
μ is the death rate. In this model, the underlying hypothesis is that the recovered people are no longer susceptible to infection. The classic SIRD epidemiological model assumes a closed population and does not account for the importation of infections from outside the modeled region. It conserves the total population size, normalized to
Theorem 1. For any non-negative initial condition, the solution of system (1)–(4) remains non-negative and bounded.
Proof. Rewrite Equation (1) as follows:
Let
be the integrating factor of Equation (5), and rewrite it as
which implies
Hence, is non-negative for In a similar process, we show that and are non-negative for
Next, we show the solutions of system (1)–(4) are closed inside region , where ; here, is a constant.
Indeed, by adding (1)–(4), we have the following:
which implies
for all
Hence the solution is positively bounded. □
3.2. Derivation of Discrete-Time I-Equation
We add a novel feature,
, which represents the external infection in a result of human mobility from the neighbors of a region where
for any
. The SIRD epidemic system, with
as external forcing, becomes the following:
We first prove that the solutions are uniformly bounded in a positive invariant region through the following theorem.
Theorem 2. For any non-negative initial condition, the solution of system (6)–(9) remains non-negative and bounded.
Proof. Equation (6) can be rewritten as follows:
Let
be the integrating factor of Equation (10), and rewrite it as follows:
Hence, is non-negative for In a similar process, we show that and are non-negative for
Similarly to the previous theorem, we can show that the solutions of system (6)–(9) are closed inside region , where ; here, is a constant.
Indeed, by adding (6)–(9), we obtain the following:
which implies
for all
Hence, the solution is positively bounded. □
It follows, from (8) and (9), that the following is true:
By substituting
into (7) we have,
Approximating the integral by Riemann sum and applying the forward Euler method, the discrete approximation is written as follows:
where
p is the number of days that are considered before day
t.
At the beginning of the infection of the model, when
,
and
, I discrete-time I-equation is simplified as follows:
If we let
, then we have an approximation of
for the original SIRD model, which is a pure temporal model, named
I-model:
It is difficult to predict how a region’s population interacts with those of adjacent areas, which affects the infection speed. As a result, is latent information that is difficult to model mathematically. We use recurrent neural networks with LSTM cells of RNN to extract latent spatial information .
3.3. Edge Feature and Latent
The spatial information is used to define the latent information
in a region
. Let C be the neighbors of region
v. The spatial feature of
at time
t is defined as follows:
where the vector
represents the values for the preceding p days, where each element is computed as the average of the case numbers in the neighboring regions for each respective day.
is the infection population of the region
at time
t. An RNN is employed to estimate the value of
based on its spatial feature
. We feed
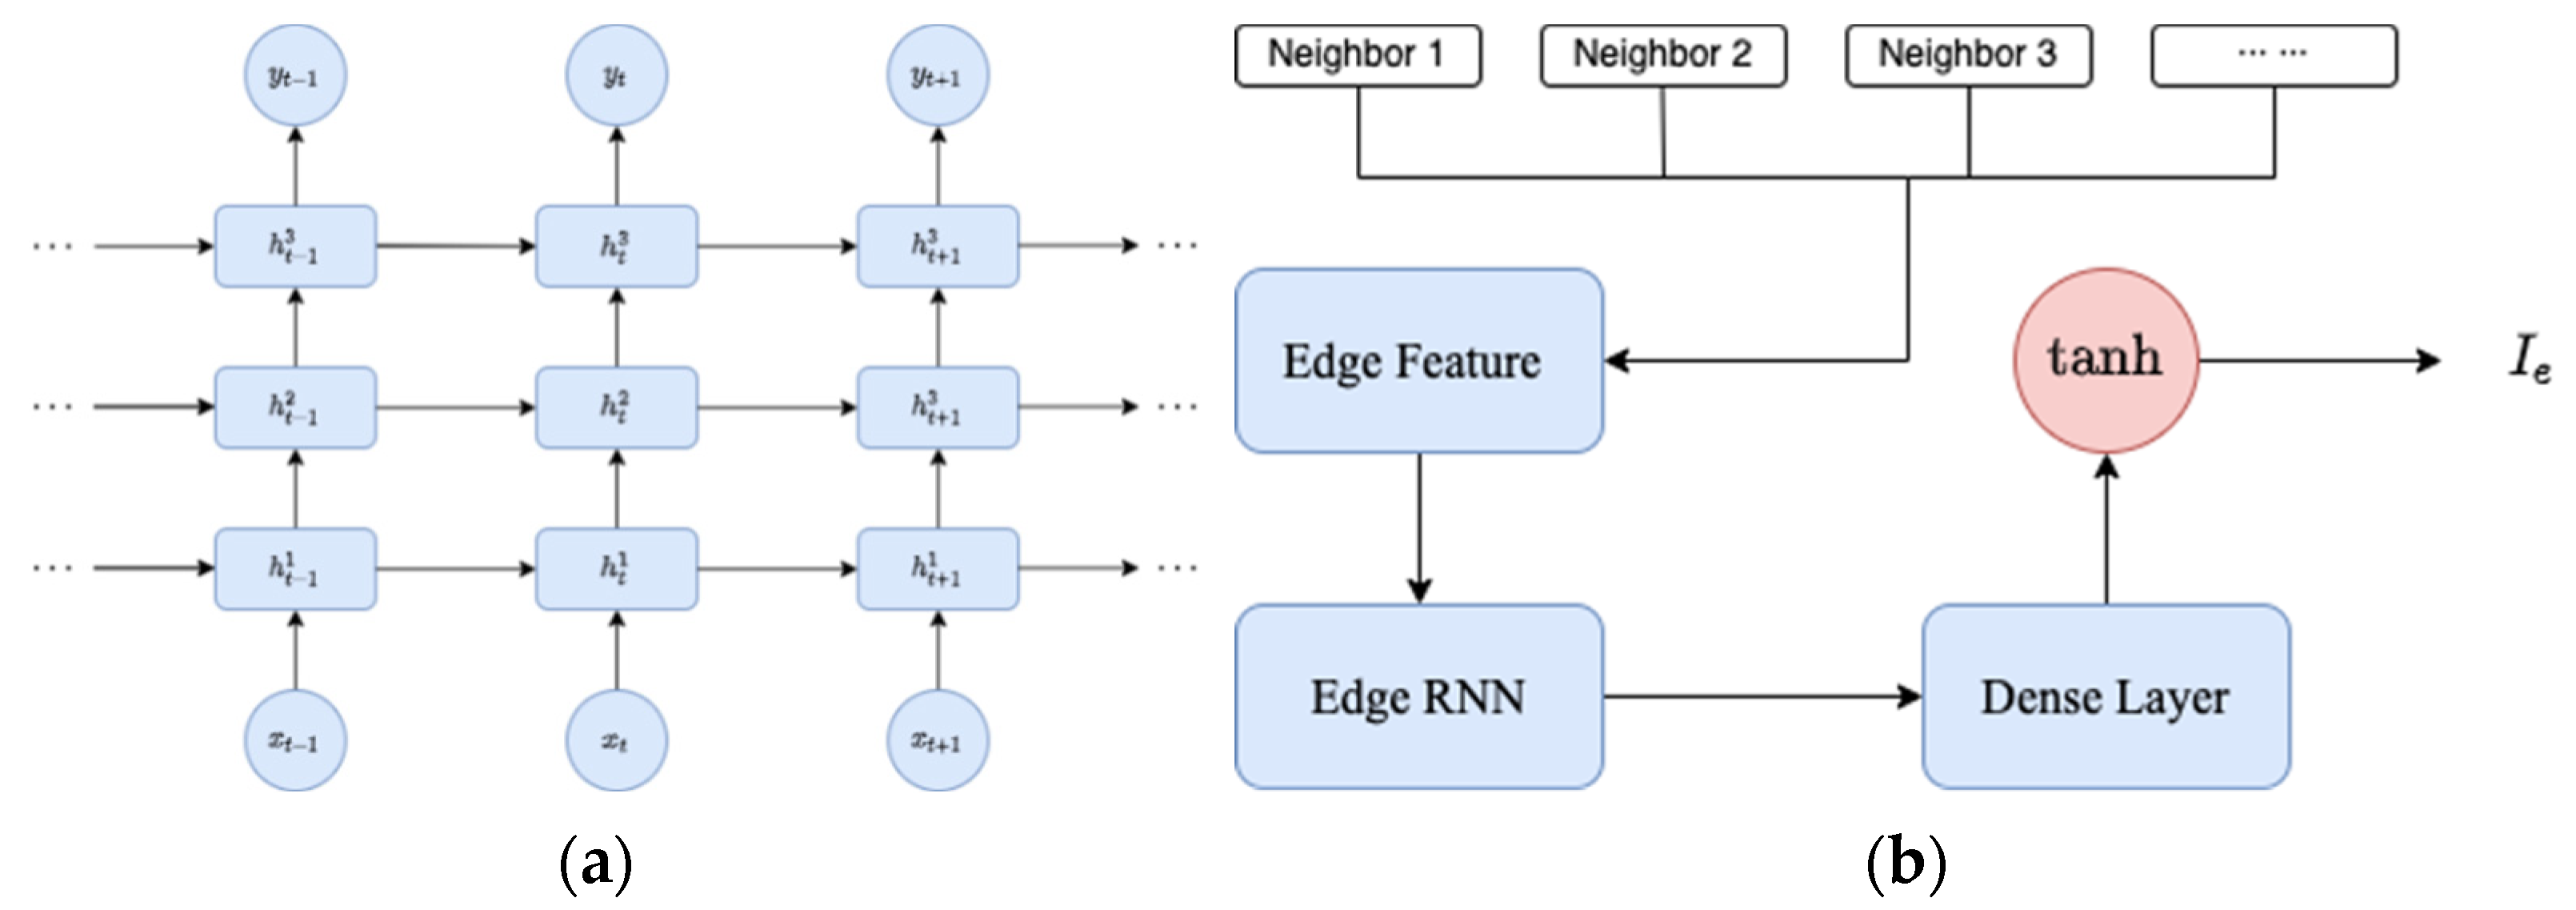
into an edge RNN, which includes three stacked LSTM cells (see
Figure 1a) with a following dense layer to output
. The integrated procedure to generate edge features is demonstrated by
Figure 1b. We named our model SIRD–eRNN as a result of its integrated design of SIRD equations and edge RNN.
In
Figure 1a, a set of three stacked LSTM cells is configured as a RNN. The term “stacked LSTM network” refers to a specific RNN architecture characterized by multiple LSTM layers arranged sequentially. This design allows the network to comprehend intricate patterns and dependencies within sequential data.
Each LSTM layer within the stack processes input sequences and maintains its independent hidden state, facilitating the capture of complex temporal dependencies in the data. The input sequences are initially introduced into the first LSTM layer in the stack. Subsequently, each LSTM layer retains a hidden state that captures pertinent information from the input sequence. This hidden state undergoes continual updates and is propagated to the subsequent time step. The output from the initial LSTM layer serves as input for the subsequent layer in the stack. As the input sequences progress through each LSTM layer, the network achieves the capability to discern hierarchical and abstract representations of the input data, with each layer capturing distinct levels of abstraction. The final LSTM layer in the stack either produces the output sequence or connects to additional layers for specific tasks like classification, regression, or sequence generation.
The stacking of LSTM layers is instrumental in empowering the network to learn hierarchical features and representations from input sequences. This proves particularly advantageous in tasks involving time-series data, natural language processing, and other sequential data analyses where a nuanced understanding of context across multiple levels is paramount.
3.4. Training the Proposed Model
The discrete approximation of the proposed model is written as follows:
To train the RNN model, the loss function is defined using the mean squared error (MSE) of data and the model’s outputs as follows:
where
T is the total number of the days.
Training consists of minimizing the loss function over parameters in both the infection equation and the recurrent neural network, hence the two components (I-equation and RNN) of the model are fully coupled while learning from data. Weights of the RNN and the dense layer, in addition to I-equation parameters and , are learned using Adam gradient descent.
4. Experimental Results
Retrospective estimates of COVID-19 activity were generated utilizing our SIRD–eRNN model for the timeframe spanning from 24 February 2020 to 18 June 2020, across 20 Italian regions, as illustrated in
Figure 2. The data are organized in a tabular format, encompassing columns for date, the 20 distinct regions of Italy, and the new confirmed cases reported on each date in every region. Regions with fewer than three neighboring regions were excluded from the analysis, leaving the following seven regions for experimentation: Campania, Emilia-Romagna, Lazio, Lombardia (Lombardy), Molise, Piemonte (Piedmont), and Umbria.
To assess the model’s performance, we compare the estimates produced by SIRD–eRNN with the ground truth: the daily reported COVID-19 new cases [
35]. The root mean squared error (RMSE) serves as the evaluation metric. Setting
p = 3 in Equation (12), we partitioned the available data for 113 days into an 80-day training set and a 33-day testing set, adhering to an approximate 7:3 training/testing ratio.
All experiments were conducted using Python 3.7 and TensorFlow 1.5, executed on a server equipped with an Intel Xeon processor boasting 128 GB memory (Intel Corporation, Santa Clara, CA, USA) and an NVIDIA Tesla K40 GPU with 12 GB memory (Nvidia Corporation, Santa Clara, CA, USA).
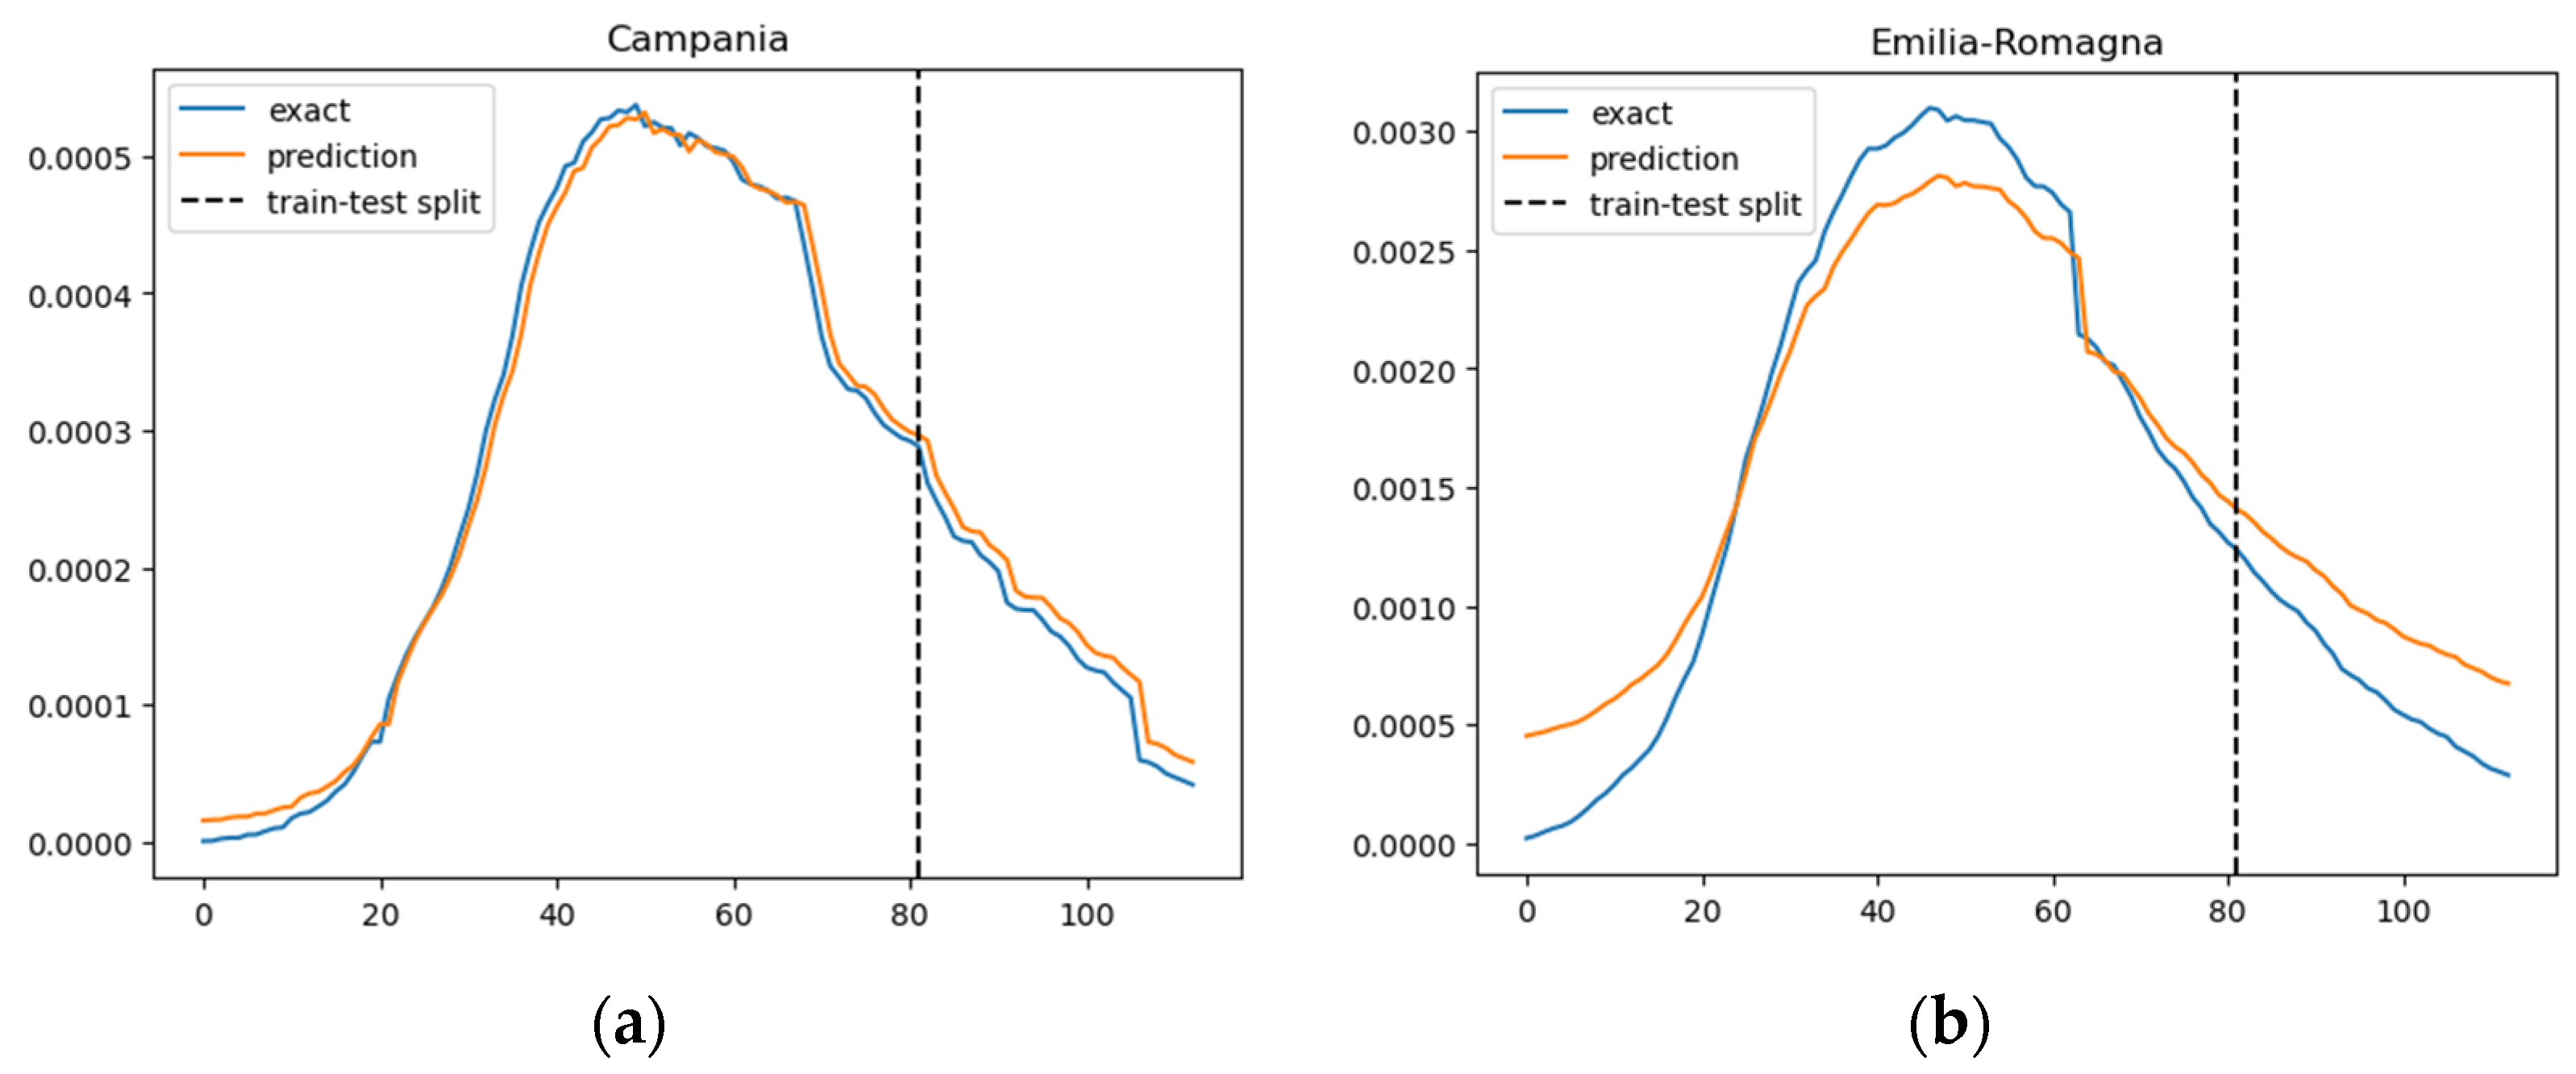
In
Figure 3, we illustrate the ratio of daily confirmed COVID-19 cases per total population, juxtaposed with the projected case numbers, across nine regions. The graphical representation spans over time to provide a comprehensive view of the trends. The predictions derived from our SIRD–eRNN model are depicted by the solid orange line. Notably, the model demonstrates its proficiency in accurately estimating the infection rate during both the training and testing stages, effectively capturing the nuanced dynamics of transmission akin to the real ground truth rate.
A comparative analysis with the prediction results of the IeRNN model [
22], as illustrated in
Figure 4, reveals that the SIRD–eRNN aligns more closely with the ground truth rate across most regions, with the exception of the Umbria region. This observation underscores the effectiveness of our proposed model in providing reliable and realistic predictions, showcasing its potential for robust applications in forecasting COVID-19 transmission dynamics.
We examined our model predictions using the root mean square error (RMSE), which is defined as follows:
where
and
are real and predicted values at time
t, respectively.
is the total number of samples. The smaller the RMSE, the better the prediction results.
In
Table 1, depicting the three-day ahead forecast, SIRD–eRNN consistently outperforms the IeRNN model, yielding smaller RMSE values across most regions. The average RMSE in the testing stage for all regions is 3.19314 × 10
−4, which is notably lower than the corresponding result for IeRNN, which stands at 3.23159 × 10
−4. Excluding the Umbria region, where the RMSE for SIRD–eRNN is 3.62327 × 10
−4 and for IeRNN is 3.72205 × 10
−4, the proposed model consistently demonstrates superior performance.
The discrepancy in performance is particularly noteworthy given the compact and simple nature of the I-Model with its three parameters. Despite this simplicity, it is apparent that the I-Model falls short in delivering accurate three-day ahead predictions compared to the sophistication of the proposed SIRD–eRNN model. It is crucial to emphasize that the infection population rate is a percentage figure, and considering its substantial base number, even minor differences in RMSE values can translate into significant disparities in the estimated rate.
Given the inherent nonlinearity in the evolution of infectious diseases, we specifically compare nonlinear modes for three-day ahead predictions. The presented results unequivocally establish the superior accuracy of our model in contrast to IeRNN. Our SIRD–eRNN model consistently outperforms other models, demonstrating its efficacy in achieving precise and reliable predictions.
Our proposed SIRD–eRNN model demonstrates marginally better performance compared to IeRNN, as shown in
Table 1. At first glance, the improvement may seem small. However, this incremental gain highlights the efficacy of the modifications we have incorporated into our approach. These enhancements enable our model to make more precise predictions, generalize more robustly, and capture the intricate dynamics of the system more accurately. In short, the modest bump in performance reflects meaningful improvements in the model’s capabilities.
5. Discussion and Future Work
This study proposed a novel hybrid model that combines classic epidemic equations with a recurrent neural network (RNN) to predict the spread of the COVID-19 pandemic. The model integrates time-dependent features, namely the numbers of individuals classified as susceptible, infectious, recovered, and deceased (SIRD), and incorporates human mobility from neighboring regions as a crucial spatial feature. The model was validated using a publicly available COVID-19 dataset sourced from Italy and showed exceptional performance, surpassing existing spatiotemporal models in three-day ahead forecasting. The main research question of this study was as follows: how can the predictive capabilities of COVID-19 spread models be enhanced by integrating epidemic differential equations and recurrent neural networks? The results of this study provide a positive answer to this question and demonstrate the feasibility and effectiveness of the proposed hybrid model.
The results of this study are consistent with previous research that suggests the importance of incorporating time-dependent and spatial features in epidemic modeling. The proposed hybrid model builds on the strengths of both classic epidemic equations and RNNs, which have been widely used in infectious disease modeling and forecasting. The model leverages the SIRD equations to capture the dynamics of the disease transmission and the RNN to learn the nonlinear patterns and temporal dependencies of the data. The model also considers the impact of human mobility on the disease spread, which is often neglected or oversimplified in conventional models. By incorporating these features, the model can account for the heterogeneity and complexity of the COVID-19 pandemic and provide more accurate and reliable predictions.
The implications and benefits of this research are manifold for both society and the research community. For society, the proposed hybrid model can provide timely and precise forecasts of the COVID-19 spread, which can inform and support public health planning and the allocation of healthcare resources at all levels of governance, both nationally and globally. The model can also help policymakers and healthcare professionals to evaluate the effectiveness of different intervention strategies and to design optimal policies to manage and mitigate the impact of the pandemic. For the research community, the proposed hybrid model can contribute to the field of epidemic modeling by introducing a novel and robust approach that combines mathematical and deep learning methods. The model can also serve as a reference and a benchmark for future studies that aim to develop and improve COVID-19 spread models.
However, this research also has some limitations and challenges that need to be acknowledged and addressed. One limitation is the quality and availability of the data used to train and test the model. The COVID-19 dataset sourced from Italy may not be representative of other countries or regions that have different demographic, geographic, and socio-economic characteristics. The data may also contain errors, inconsistencies, or biases due to the variability and uncertainty of the testing and reporting procedures. These factors may affect the validity and generalizability of the model and its predictions. Another challenge is the dynamic and evolving nature of the COVID-19 pandemic, which may require constant updating and fine-tuning of the model parameters and features. The model may not be able to capture the effects of new variants, mutations, or outbreaks of the virus, or the changes in human behavior, mobility, and compliance with public health measures. These factors may reduce the accuracy and reliability of the model and its predictions over time.
Therefore, based on the discussion, some recommendations can be made for practical implementation and further research. For practical implementation, the proposed hybrid model should be applied and validated in different countries or regions that have different COVID-19 situations and data sources. The model should also be regularly monitored and adjusted to reflect the latest data and information on the pandemic. For further research, the proposed hybrid model can be extended and improved by incorporating more features and variables that may affect the spread of COVID-19, such as weather, climate, vaccination, testing, contact tracing, and social distancing. The model can also be compared with other models that use different methods or data to predict the COVID-19 spread. These efforts can help to enhance the predictive capabilities of COVID-19 spread models and to provide more insights and solutions for tackling the pandemic.


