Abstract
Several youth volleyball tournaments are played across multiple consecutive days with athletes averaging 3–4 matches/day. This study evaluated the differences in workload of female youth volleyball athletes across days and by position during multi-day tournaments. Athletes (n = 22, 16.4 ± 0.4 years) wore an accelerometer during 12 two- and three-day tournaments. Workload was measured via kinetic energy (KE, J/lb), total jumps (TJ), high jumps (HJ, >51 cm), average jump height (cm), and percentage of high stress movements (%) via VERT accelerometers. Data were analyzed across days and by position as an average per day and analyzed via repeated measures analyses of variance. Across days, workload averages ranged 484.8–558.0 J/lb for KE, 27.3–31.2 TJ/match, 37.5–37.9 cm/jump, 5.2–6.5 HJ/match, and 20.1–20.7% high stress movements/match, with no difference (p = 0.300). Setters (49.2 ± 24.3 jumps) jumped more than liberos (13.0 ± 6.8 TJ, p = 0.005), and middles (45.8 ± 4.1 cm) jumped higher than all other positions (setters: 28.8 ± 3.6 cm, outside hitters: 41.3 ± 4.2 cm, and liberos: 27.0 ± 4.1 cm, p = 0.000–0.044). Athletes appeared to perform and recover sufficiently between days of play such that their external load was not affected. The level of competition tends to become more evenly matched as the tournament progresses, thus there may have been less physical demand early in the tournaments due to unequal competition levels compared to the final day of the tournament.
1. Introduction
In volleyball, play consists of periods of short, high-intensity energy expenditure via jumping, sprinting, shuffling, and diving, followed by brief rest periods [1]. Each position fulfills different duties that involve maximal and submaximal jumps based on the game scenario [2] resulting in positional differences in jump volume and jump fatigue [3,4]. In Division I collegiate volleyball, 53% of outside hitter (OH) jumps are attacks, 55% of middle blocker (MB) jumps are blocks, and 54% of setter (SET) jumps are jump sets [3]. SET jump more than OH and MB, although SET jumps are less intense, sub-maximal jumps [3]. The number of jumps also varies with the competition, with a more evenly matched competition requiring greater external load (e.g., number of jumps, energy expended) [5].
Youth volleyball has gained popularity along with club volleyball opportunities and tournaments, creating a nearly year-round schedule for competition [5]. These teams compete outside of the regular school season and engage in separate practices, training, and tournament play. An average club volleyball season can be described as training twice a week over approximately eight months, with four of the eight months containing a crowded tournament schedule across multiple weekends [6]. These tournaments often require travel to different cities where athletes can compete in 3–4 matches per day for three days, playing more competitive matches as the tournament progresses. This extensive training and tournament play can likely lead to fatigue in these athletes. Physiological data gathered on youth volleyball athletes in a high school volleyball season showed that match workload was the lowest in the beginning of the season and increased towards the end of the season during more competitive play with evenly matched opponents or when playoffs were at stake [5]. This increased competition resulted in greater output by the athletes and may also be applicable to club volleyball tournaments.
The effects of increased training and competition on performance should be considered. With fatigue, volleyball athletes experience slower contraction times, resulting in reduced peak power and jump height [7]. Specifically, repeated maximal jump efforts will reduce vertical jump height [7], negatively impacting physical performance for MB and OH positions who perform a high volume of maximal jumps [4]. It is unknown if this affects SET who perform a large number of submaximal jumps. Furthermore, it is unknown if these athletes experience accumulating fatigue across consecutive days of play, which is often required in youth club volleyball tournaments. As youth volleyball athletes become more specialized in their sport, it is important to understand their physiological and mechanical workload, as well as the potential effects of fatigue across multiple days of competing. The purpose of this study was to evaluate the differences in external load of female youth volleyball athletes across days and by position during multi-day tournaments. We hypothesize that the number of jumps and the average height of jumps will decline with consecutive days of play.
2. Materials and Methods
2.1. Study Design
This study was a prospective observational study design evaluating the external workload incurred by youth female volleyball athletes over multi-day competitions. Data were collected over a two-year period (2022–2023), with athletes participating for only one season. Each club season ran from November through June. Data were collected from seven 2-day tournaments and five 3-day tournaments. This study was approved by the local institutional review board (IRB-2021-202) and conducted in alignment with the Declaration of Helsinki.
2.2. Participants
Participants (n = 22, age = 16.4 ± 0.4 years) were included in the study if they were female youth volleyball athletes playing on the top team for their age group for a local club. They were excluded from participation if they were injured or chose to leave the team. Athletes were grouped by their primary position: OH (n = 8), MB (n = 6), SET (n = 4), and defensive specialists/liberos (DS/L, n = 4). Athletes trained twice weekly and played tournaments intermittently on the weekends. All participants completed an informed consent with parental permission.
2.3. Measures
Athletes wore the VERT model KMT (VERT Team System, Fort Lauderdale, FL, USA) during all tournaments. The devices contain a tri-axial accelerometer and a tri-axial gyroscope. The VERT devices are accurate and reliable in measuring jump count, jump height, and kinetic energy in an indoor setting [8,9]. The devices were worn according to best practice standards developed by VERT and as described by Schuman et al. [6]. Data were uploaded and processed through the VERT Team System application available on an iOS device.
External load was measured via kinetic energy (KE, J/lb), total jumps (TJ), total high jumps (HJ, >51 cm), average jump height (cm), and percentage of high stress movements relative to total movements (stress %). TJ, HJ, and jump height use flight time for the calculation, but the exact algorithm is proprietary. The VERT calculation for KE is ½ Δv2, where v represents velocity [9], and stress % is calculated using the number of high surge movements relative to the total movements, but this algorithm is proprietary to VERT. The total number of matches each day of the tournament were tallied, and each external load variable, except stress %, was divided by the total number of matches on the day to control for schedule variations. All matches were played in a best of three sets format.
2.4. Statistical Analysis
A daily average for the workload variables per match played was calculated for each athlete across each tournament day: 1, 2, and 3. All analyses were conducted using SPSS version 27.0 (IBM, Armonk, NY, USA), and an alpha level of 0.05 was used to determine differences. A Shapiro–Wilks test determined that the KE, TJ, average jump height, and stress % were normally distributed. A 4 position × 3 days repeated-measures multivariate analysis of variance (RM-MANOVA) was used to evaluate differences for these workload variables. Partial eta squared effect sizes (ES) were calculated to determine the magnitude of the effect. ES were interpreted as small (0.01), moderate (0.06), and large (0.14) [10]. An LSD post hoc test was used to determine positional differences if there was a main effect by position. If the main effect of time was significant or had a large ES, univariate analyses were used to determine the specific workload variable, and pairwise comparisons were used to compare the workload variable across days to determine specific differences. Differences by day for HJ were determined using a Friedman’s test, and a Kruskall–Wallis test was used to assess differences in HJ across positions.
3. Results
Table 1 shows the means and standard deviations for each workload variable by position across all three days of analyses, and Figure 1 provides a visual depiction of these data. The RM-MANOVA showed a main effect difference in workload by position (Lambda(12,40) = 6.206, p < 0.001, ES = 0.604, large). There were positional differences in TJ (F = 3.387, p = 0.041, ES = 0.361, large, Figure 1A) and average jump height (F = 28.508, p < 0.001. ES = 0.826, large, Figure 1B), but no difference in KE (F = 0.224, p = 0.878, ES = 0.036, moderate, Figure 1C) or stress % (F = 1.205, p = 0.336, ES = 0.167, large, Figure 1D). SET had more TJ than DS/L (p = 0.005), and MB had a higher average jump height than SET (p < 0.001), DS/L (p < 0.001) and OH (p = 0.044). OH also had a higher average jump height than SET (p < 0.001) and DS/L (p < 0.001). Analysis of HJ indicated a difference between positions (KW = 8.846–13.4446, p = 0.004–0.031, Figure 1E), with DS/L having fewer HJs than OH and MB (p = 0.003–0.028), and SET also had fewer HJs than OH and MB (p = 0.012–0.047).

Table 1.
Mean ± standard deviation for each variable of interest across all three days of tournament play for each position.
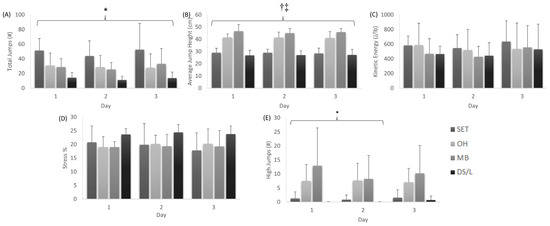
Figure 1.
Means and standard deviations for (A) total jumps, (B) average jump height, (C) kinetic energy, (D) stress percent (%), and (E) high jumps. * indicates a difference between SET and DS/L, † indicates a difference from MB and all other positions, ‡ indicates a difference between OH and SET and DS/L, and ‣ indicates that MB and OH were different from SET; all p < 0.05. Note: SET = setters, OH = outside hitters, MB = middle blockers, and DS/L = defensive specialists/liberos.
The RM-MANOVA showed no main effect for daily differences in workload (Lambda (8,11) = 1.475, p = 0.269, ES = 0.518, large), but because the ES was large, univariate analyses were explored. Univariate analyses indicated no differences in workload variables by tournament day: KE (F = 2.030, p = 0.146, ES = 0.101, large), TJ (F = 2.108, p = 0.143, ES = 0.105, large), average jump height (F = 0.266, p = 0.746, ES = 0.015, small), stress % (F = 0.489, p = 0.617, ES = 0.026, small). There was also no difference in HJ across days (Friedman = 2.055, p = 0.358).
The day by position analysis of the RM-MANOVA showed no main effect (Lambda (24,32) = 0.725, p = 0.791, ES = 0.339, large), but with a large ES. Univariate analysis showed no interaction for KE (F = 0.457, p = 0.835, ES = 0.071, moderate), TJ (F = 0.615, p = 0.697, ES = 0.093, moderate), average jump height (F = 0.650, p = 0.890, ES = 0.055, moderate), or stress % (F = 0.819, p = 0.563, ES = 0.120, large). The only notable interaction with HJ was that OH and MB showed more HJs than SET and DS/L for the first two days of a tournament (p = 0.021–0.038), but not on the third (p = 0.075, Figure 1E).
4. Discussion
This study evaluated differences in external workload across multiple days of tournament play and by position in youth female volleyball players. The results showed no differences across days but a varying workload by position, with OH and MB exhibiting the highest average jump height and SET exhibiting the greatest TJ. The current data are consistent with the previous literature in collegiate athletes showing positional differences for different types of jumps during competition [2,3,4,11,12]. The nature of the study revolving around club volleyball players presents unique scenarios involving game length, recovery time, and varied game load intensity throughout tournament duration.
Major findings include differences in workload by position in TJ, HJ, and average jump height, but no positional differences in KE. These positional differences are consistent with findings by Vescovi and Dunning in a study where they evaluated positional jump characteristics of NCAA Division I collegiate female athletes. Like the current study, they found that SET engage in more TJ at the submaximal level compared to other positions that engage in less TJ but at a higher intensity [3]. García-de-Alcaraz et al. also showed that SET engaged in the most jumps at the submaximal level compared to the most max jumps and highest jumps coming from MB in eleven professional male volleyball players [1]. These similarities between studies are likely due to the game’s nature, with OH and MB performing higher intensity jump efforts less frequently for attacking and SET performing low intensity jumps more frequently to execute a deceptive offensive strategy [12]. Liberos also registered mostly submaximal jumps, which most likely occurred during serving and celebratory activities. KE is considered a measure of total load; thus no positional differences suggests that athletes across jumping and non-jumping positions were moving and engaged in play. This variable has been shown to change similarly to jumping measurements across phases of a season in youth female volleyball players [5]. KE may be a useful variable in assessing the external load of athletes who do not engage in a high volume or jumping, and it may be used to compare workloads across positions.
There was no difference by day for workload in jumps, and the only notable interaction with HJ was that SET and OH showed a difference for the first two days of a tournament, but not on the third. This is likely due to the unique conditions of club volleyball tournaments associated with gap recovery. In these tournaments, athletes play about three matches per day with a variable break between matches and large overnight break between days. This could have provided a sufficient between-day recovery to avoid cumulative fatigue across days. To date, studies have addressed workload in competitive matches and practices in the youth population [5,6] and elite athletes [13,14,15], but have not looked at the accumulating effect of consecutive days of play. Future research should consider evaluating changes in external workload through each match of the day to assess the daily accumulation of fatigue. Recovery between days may also have been enhanced by the regular workload endured by the athletes. The annual and weekly schedule of youth volleyball athletes may have provided them with the physical preparation necessary for daily performance at this level [5,6].
Club volleyball tournaments present a unique environment that could have impacted the data obtained from the study. To date, club tournaments presented unknown competition levels that were anticipated to vary based on team finish or pool placement. Munoz and Bunn noted that high school volleyball players experience the highest match workload near the end of the season as competition increases and the season progresses [5]. Research has also indicated that volleyball athletes experience a higher subjective workload during congested weeks [16]. The structure of the tournaments is designed in such a way that the teams become more evenly matched with each day, and the previous literature from other sports suggests that external workload increases with more evenly matched opponents [17,18].
The present study did not consider any substitution strategies across the multi-day tournaments; thus, it remains unknown if alterations in playing time across the three days affected these results. Volleyball does not have a set clock; however, the number of sets played should be considered for future research to help discern performance differences by day. Additionally, the present study did not collect any measures of internal workload (e.g., ratings of perceived exertion, heart rate, or training impulse). Future research should consider collecting these measures to provide a more holistic approach in assessing athlete workload and tolerance of the competition schedule.
5. Conclusions
Youth volleyball athletes did not experience a reduction in external workload across multiple days of tournament play, suggesting sufficient overnight recovery between days. These data can be used for coaches to have an enhanced understanding of workload differences with their athletes, with SET having the highest TJ, albeit at a submaximal level. OHs and MBs are required to jump at a lower frequency, but at near maximal capabilities. Coaches should consider monitoring between-game recovery to ensure a consistent level of performance. Recovery should emphasize rest and healthy nutrition for the athlete and could include subjective assessments of athlete exertion and recovery. All these factors should be considered when creating lineups and ensuring athletes engage in appropriate recovery strategies.
Author Contributions
Conceptualization, J.A.B.; methodology, E.F. and J.A.B.; formal analysis, J.A.B.; writing—original draft preparation, E.F. and J.A.B.; writing—review and editing, E.F. and J.A.B. All authors have read and agreed to the published version of the manuscript.
Funding
This research received no external funding.
Institutional Review Board Statement
The study was conducted in accordance with the Declaration of Helsinki, and approved by the Institutional Review Board of Sam Houston State University (IRB-2021-202, 21 July 2021).
Informed Consent Statement
Informed consent was obtained from all subjects involved in the study.
Data Availability Statement
Data are available by email request to the corresponding author.
Conflicts of Interest
The authors declare no conflicts of interest.
References
- García-de-Alcaraz, A.; Ramírez-Campillo, R.; Rivera-Rodríguez, M.; Romero-Moraleda, B. Analysis of jump load during a volleyball season in terms of player role. J. Sci. Med. Sport 2020, 23, 973–978. [Google Scholar] [CrossRef] [PubMed]
- Piatti, M.; Ambrosi, E.; Dedda, G.; Omeljaniuk, R.J.; Turati, M.; Bigoni, M.; Gaddi, D. Jump performance during a season in elite volleyball players. J. Sports Med. Phys. Fit. 2022, 62, 602–608. [Google Scholar] [CrossRef] [PubMed]
- Rush, M.E.; Littlefield, T.; McInnis, A.K.; Donahue, P.T. Positional Comparison of Jump Performance in NCAA Division I Female Volleyball Athletes. Int. J. Kinesiol. Sports Sci. 2022, 10, 1–6. [Google Scholar] [CrossRef]
- Vescovi, J.D.; Dunning, L.T. A Comparison of Positional jumping characteristics of NCAA Division I female volleyball teams: A Follow-up study. Int. J. Volleyb. Res. 2004, 7, 10–16. [Google Scholar]
- Munoz, M.A.; Bunn, J.A. Season phase comparison of training and game volume in female high school volleyball athletes. Women Sport Phys. Act. J. 2024, 32, 2023–2026. [Google Scholar] [CrossRef]
- Schumann, C.; Wojciechowski, M.; Bunn, J.A. Comparing two methods of acute: Chronic workload calculations in girls youth volleyball. Sports 2023, 11, 51. [Google Scholar] [CrossRef] [PubMed]
- Rodacki, A.L.F.; Fowler, N.E.; Bennett, S.J. Multi-segment coordination: Fatigue effects. Med. Sci. Sports Exerc. 2001, 33, 1157–1167. [Google Scholar] [CrossRef] [PubMed]
- Charlton, P.C.; Kenneally-Dabrowski, C.; Sheppard, J.; Spratford, W. A simple method for quantifying jump loads in volleyball athletes. J. Sci. Med. Sport 2017, 20, 241–245. [Google Scholar] [CrossRef] [PubMed]
- Brooks, E.R.; Benson, A.C.; Fox, A.S.; Bruce, L.M. Quantifying jumps and external load in netball using VERT inertial measurement units. Sports Biomech. 2021, 1–10. [Google Scholar] [CrossRef] [PubMed]
- Cohen, J. Statistical Power Analysis for the Behavioural Science, 2nd ed.; Routledge: New York, NY, USA, 1988. [Google Scholar]
- Mori, Y.; Yamada, Y.; Umezaki, S.; Kida, N.; Nomura, T. A study on the number of jumps and jump height in volleyball: From a mock game of college men players. Adv. Phys. Educ. 2022, 12, 1–10. [Google Scholar] [CrossRef]
- Skazalski, C.; Whiteley, R.; Bahr, R. High jump demands in professional volleyball—Large variability exists between players and player positions. Scand. J. Med. Sci. Sports 2018, 28, 2293–2298. [Google Scholar] [CrossRef] [PubMed]
- Lima, R.F.; Palao, J.M.; Clemente, F.M. Jump performance during official matches in elite volleyball players: A pilot study. J. Hum. Kinet. 2019, 67, 259. [Google Scholar] [CrossRef] [PubMed]
- Silva, M.; Sattler, T.; Lacerda, D.; João, P.V. Match analysis according to the performance of team rotations in Volleyball. Int. J. Perform. Anal. Sport 2016, 16, 1076–1086. [Google Scholar] [CrossRef]
- Hank, M.; Maly, T.; Zahalka, F.; Novotny, D.; Gryc, T.; Hrasky, P. Movement direction analysis in elite indoor volleyball match. Acta Kinesiol. 2019, 13, 22–28. [Google Scholar]
- Mendes, B.; Palao, J.M.; Silvério, A.; Owen, A.; Carriço, S.; Calvete, F.; Clemente, F.M. Daily and weekly training load and wellness status in preparatory, regular and congested weeks: A season-long study in elite volleyball players. Res. Sports Med. 2018, 26, 462–473. [Google Scholar] [CrossRef] [PubMed]
- Bozzini, B.N.; McFadden, B.A.; Walker, A.J.; Arent, S.M. Varying demands and quality of play between in-conference and out-of-conference games in Division I collegiate women’s soccer. J. Strength Cond. Res. 2020, 34, 3364–3368. [Google Scholar] [CrossRef] [PubMed]
- Thornton, A.; Myers, B.J.; Bunn, J.A. Comparison of in vs. out of conference game demands in collegiate Division I women’s lacrosse. J. Athl. Enhanc. 2021, 10, 1–4. [Google Scholar]

Disclaimer/Publisher’s Note: The statements, opinions and data contained in all publications are solely those of the individual author(s) and contributor(s) and not of MDPI and/or the editor(s). MDPI and/or the editor(s) disclaim responsibility for any injury to people or property resulting from any ideas, methods, instructions or products referred to in the content. |
© 2024 by the authors. Licensee MDPI, Basel, Switzerland. This article is an open access article distributed under the terms and conditions of the Creative Commons Attribution (CC BY) license (https://creativecommons.org/licenses/by/4.0/).