Proceeding Paper

Evaluation of Alternative Models for Respiration Rate of Ready-to-Eat Strawberry (cv. ‘Ágata’) †

1
Departamento de Química del Litoral, Cenur Litoral Norte, Universidad de la República, Paysandú 60000, CP, Uruguay
2
Licenciatura en Análisis Alimentario, Instituto Tecnológico Regional Suroeste, Universidad Tecnológica, Paysandú 60000, CP, Uruguay
3
Instituto Ingeniería Química, Facultad de Ingeniería, Universidad de la República, Montevideo 11300, CP, Uruguay
*
Author to whom correspondence should be addressed.
Presented at the 5th International Electronic Conference on Foods, 28–30 October 2024; Available online: https://sciforum.net/event/Foods2024.
Biol. Life Sci. Forum 2024, 40(1), 54; https://doi.org/10.3390/blsf2024040054
Published: 16 April 2025
(This article belongs to the Proceedings of The 5th International Electronic Conference on Foods)

Abstract

:
Alternative models for the respiration rate (RR) of ready-to-eat strawberries were evaluated as a function of O2 and CO2 concentration and temperature. The effect of the gaseous atmosphere and temperature on RR was determined in a total factorial experiment where 45 treatments were applied by combining factors: oxygen (0–21%) and carbon dioxide (0–15%) concentration at three levels and temperature (4–26 °C) at five levels. Both phenomenological (Michaelis–Menten, Langmuir) and non-phenomenological (Generalized linear and Quadratic) approaches were used to fit RR data. The temperature effect was modeled by Arrhenius, exponential, and power models. Model selection was performed based on R2-adjusted, RMSE, and IAC indicators. Models with R2 greater than 0.80, lower RMSE, and AIC were selected. The quadratic model and Michaelis–Menten Uncompetitive-with power model for temperature dependence were the best predictors of the experimental data. An integrated mathematical model based on strawberry respiration activity considering the influence of oxygen, carbon dioxide, and temperature was obtained, allowing its use for MAP modeling.

1. Introduction

Strawberries are a popular fruit due to their appearance, flavor, and taste, as well as their abundance of beneficial bioactive compounds [1]. It is a non-climacteric fruit, delicate and with a high respiration rate (RR), often susceptible to mechanical injury, physiological disorders, and postharvest decay during storage. All these factors contribute to the high perishability of strawberries, posing a great challenge to extending shelf life and maintaining their freshness throughout storage and commercialization [2]. In Uruguay, strawberries are primarily sold fresh, although, during spring, surplus production is processed by the industry. Strawberry production offers economic opportunities to rural regions due to its high market value, both fresh and processed [3].
The increasing demand for ready-to-eat (RTE) fruit and vegetables highlights the need for technologies such as modified atmosphere packaging (MAP) to extend shelf life. Effective MAP design requires understanding the effects of internal gaseous concentration (O2 and CO2) and temperature on metabolism, allowing the prediction of the best conditions for shelf-life extension [4,5]. Although RR models exist for various strawberry cultivars, limited information is available for fresh-cut strawberries, especially for the ’Ágata’ variety [6,7,8], which is a cultivar developed and largely cultivated in the north of Uruguay. This study aimed to evaluate alternative models for predicting RR of ready-to-eat ‘Agata’ strawberries to predict O2 and CO2 concentrations throughout storage in MAP conditions and also to help select adequate conditions for MAP.

2. Material and Methods

2.1. Strawberries

Strawberries (cv. ‘Ágata’) were purchased from a local grower in Salto (Uruguay). Within 12 h of harvest, they were transported to the laboratory and processed. Fruits at a ripe stage (over 90% of the surface showing red color) with uniform size and no defects were used, dehulled and sanitized with 80 mg L−1 peracetic acid for 5 min. A domestic spinner was used to remove the excess of water.

2.2. Experimental Setup

Respiration rate was assessed in a closed system, as previously reported in the literature [9,10]. A full factorial design was used to test three oxygen levels (5, 12, and 21 kPa), three carbon dioxide levels (0, 7, and 14 kPa), and five temperature levels (4, 10, 14, 20, and 26 °C). These ranges were chosen to cover the typical atmospheric conditions that strawberries are exposed to during MAP conditions. A total of 45 factor combinations were carried out, and four replicates per condition were performed.

2.3. Respiration Rate Assessment

150 to 200 g of fresh-cut strawberries were placed in glass jars (1 L capacity). The jars were equilibrated for 30 min at the tested temperature and flushed with a humidified gas mixture at controlled temperatures (± 1 °C). After fluxing the jars with the gas mixture, the jars were closed. The evolution of O2 and CO2 concentrations in the headspace of the jars was measured with a gas analyzer (Oxybaby 6.1, WITT-Gasetechnik, Witten, Germany). Temperature and relative humidity inside the reactors were recorded using a Lascar-EL-USB-2 (Lascar Electronics, Erie, PN, USA). RR was determined as the rate of O2 consumption (RRO2) or CO2 production (RRCO2), calculated using the following Equations (1) and (2):
R R O 2 ( m L   k g 1 h 1 ) = C O 2 t   *   V f r e e   *   1 m   *   1 0 4 ,
R R C O 2 ( m L   k g 1 h 1 ) = C C O 2 t   *   V f r e e   *   1 m   *   1 0 4 ,
where C O 2 and C C O 2 stand for O2 and CO2 concentrations inside reactors (kPa), respectively; t is time (h); m is product mass (kg); and Vfree is the free volume inside the container (m3). Vfree was calculated considering a reactor’s total volume (m3), the product mass enclosed, and strawberry density.

2.4. Statistical Analysis, Respiration Rate Modelling and Selection

ANOVA test was performed considering oxygen, carbon dioxide, temperature, and their interactions as variation factors. Significant differences between mean values were determined by applying the Tukey test. Differences were considered significant when p < 0.05. Statistical analyses were performed using R Studio. An NLS_Multistart package R software (version R 4.0.3) was used to fit the different models. The goodness of fit of the different models was assessed using the coefficient of determination (R2), the root means square error (RMSE), and the Akaike information criterion (AIC). Different phenomenological (Langmuir, Michaelis–Menten models with and without inhibition) and non-phenomenological (Generalized linear and Quadratic) approaches were considered as reported in the literature to evaluate the effect of gas composition on the oxygen consumption rate (RRO2), as it can be seen in Table 1 [10,11].
The effect of temperature for phenomenological models was evaluated on the maximum rate of oxygen consumption ( v m ,   O 2 ) [12] and modeled using the exponential, power, and Arrhenius models (Equations (11)–(13)) as follows:
k T C = E   *   e c T c ,
k T C = b 1   *   T C b 2 ,
k T K = A   *   e E a R T K ,
In these equations, E and c are parameters associated with the exponential model, b 1 and b 2 are parameters associated with power model and A , E a , R are pre-exponential, activation energy and the ideal gas constant, respectively. T c and T K are temperatures expressed in °C and K, respectively.

2.5. Validation Experiments

Mass balances for oxygen and carbon dioxide were applied to validate the kinetic model. O2 consumption was predicted by combining Equation (1) and the selected RRO2 model. CO2 production was predicted by combining Equation (2) and the RRCO2 model, which takes into account both fermentative and oxidative CO2 production (this model was calibrated using experimental respiration data obtained as mentioned in Section 2.2 [13]. Numeric resolution of the differential equations was performed using the Runga-Kutta algorithm (ode45) from the deSolve package in R software (version R 4.0.3). 192.7 ± 1.0 g of fresh-cut strawberries were stored in closed jars at 12 °C for 45 h. O2 and CO2 evolution was measured as described in Section 2.3. Differences between simulated and experimental results for O2 and CO2 were evaluated by RMSE.

3. Results and Discussion

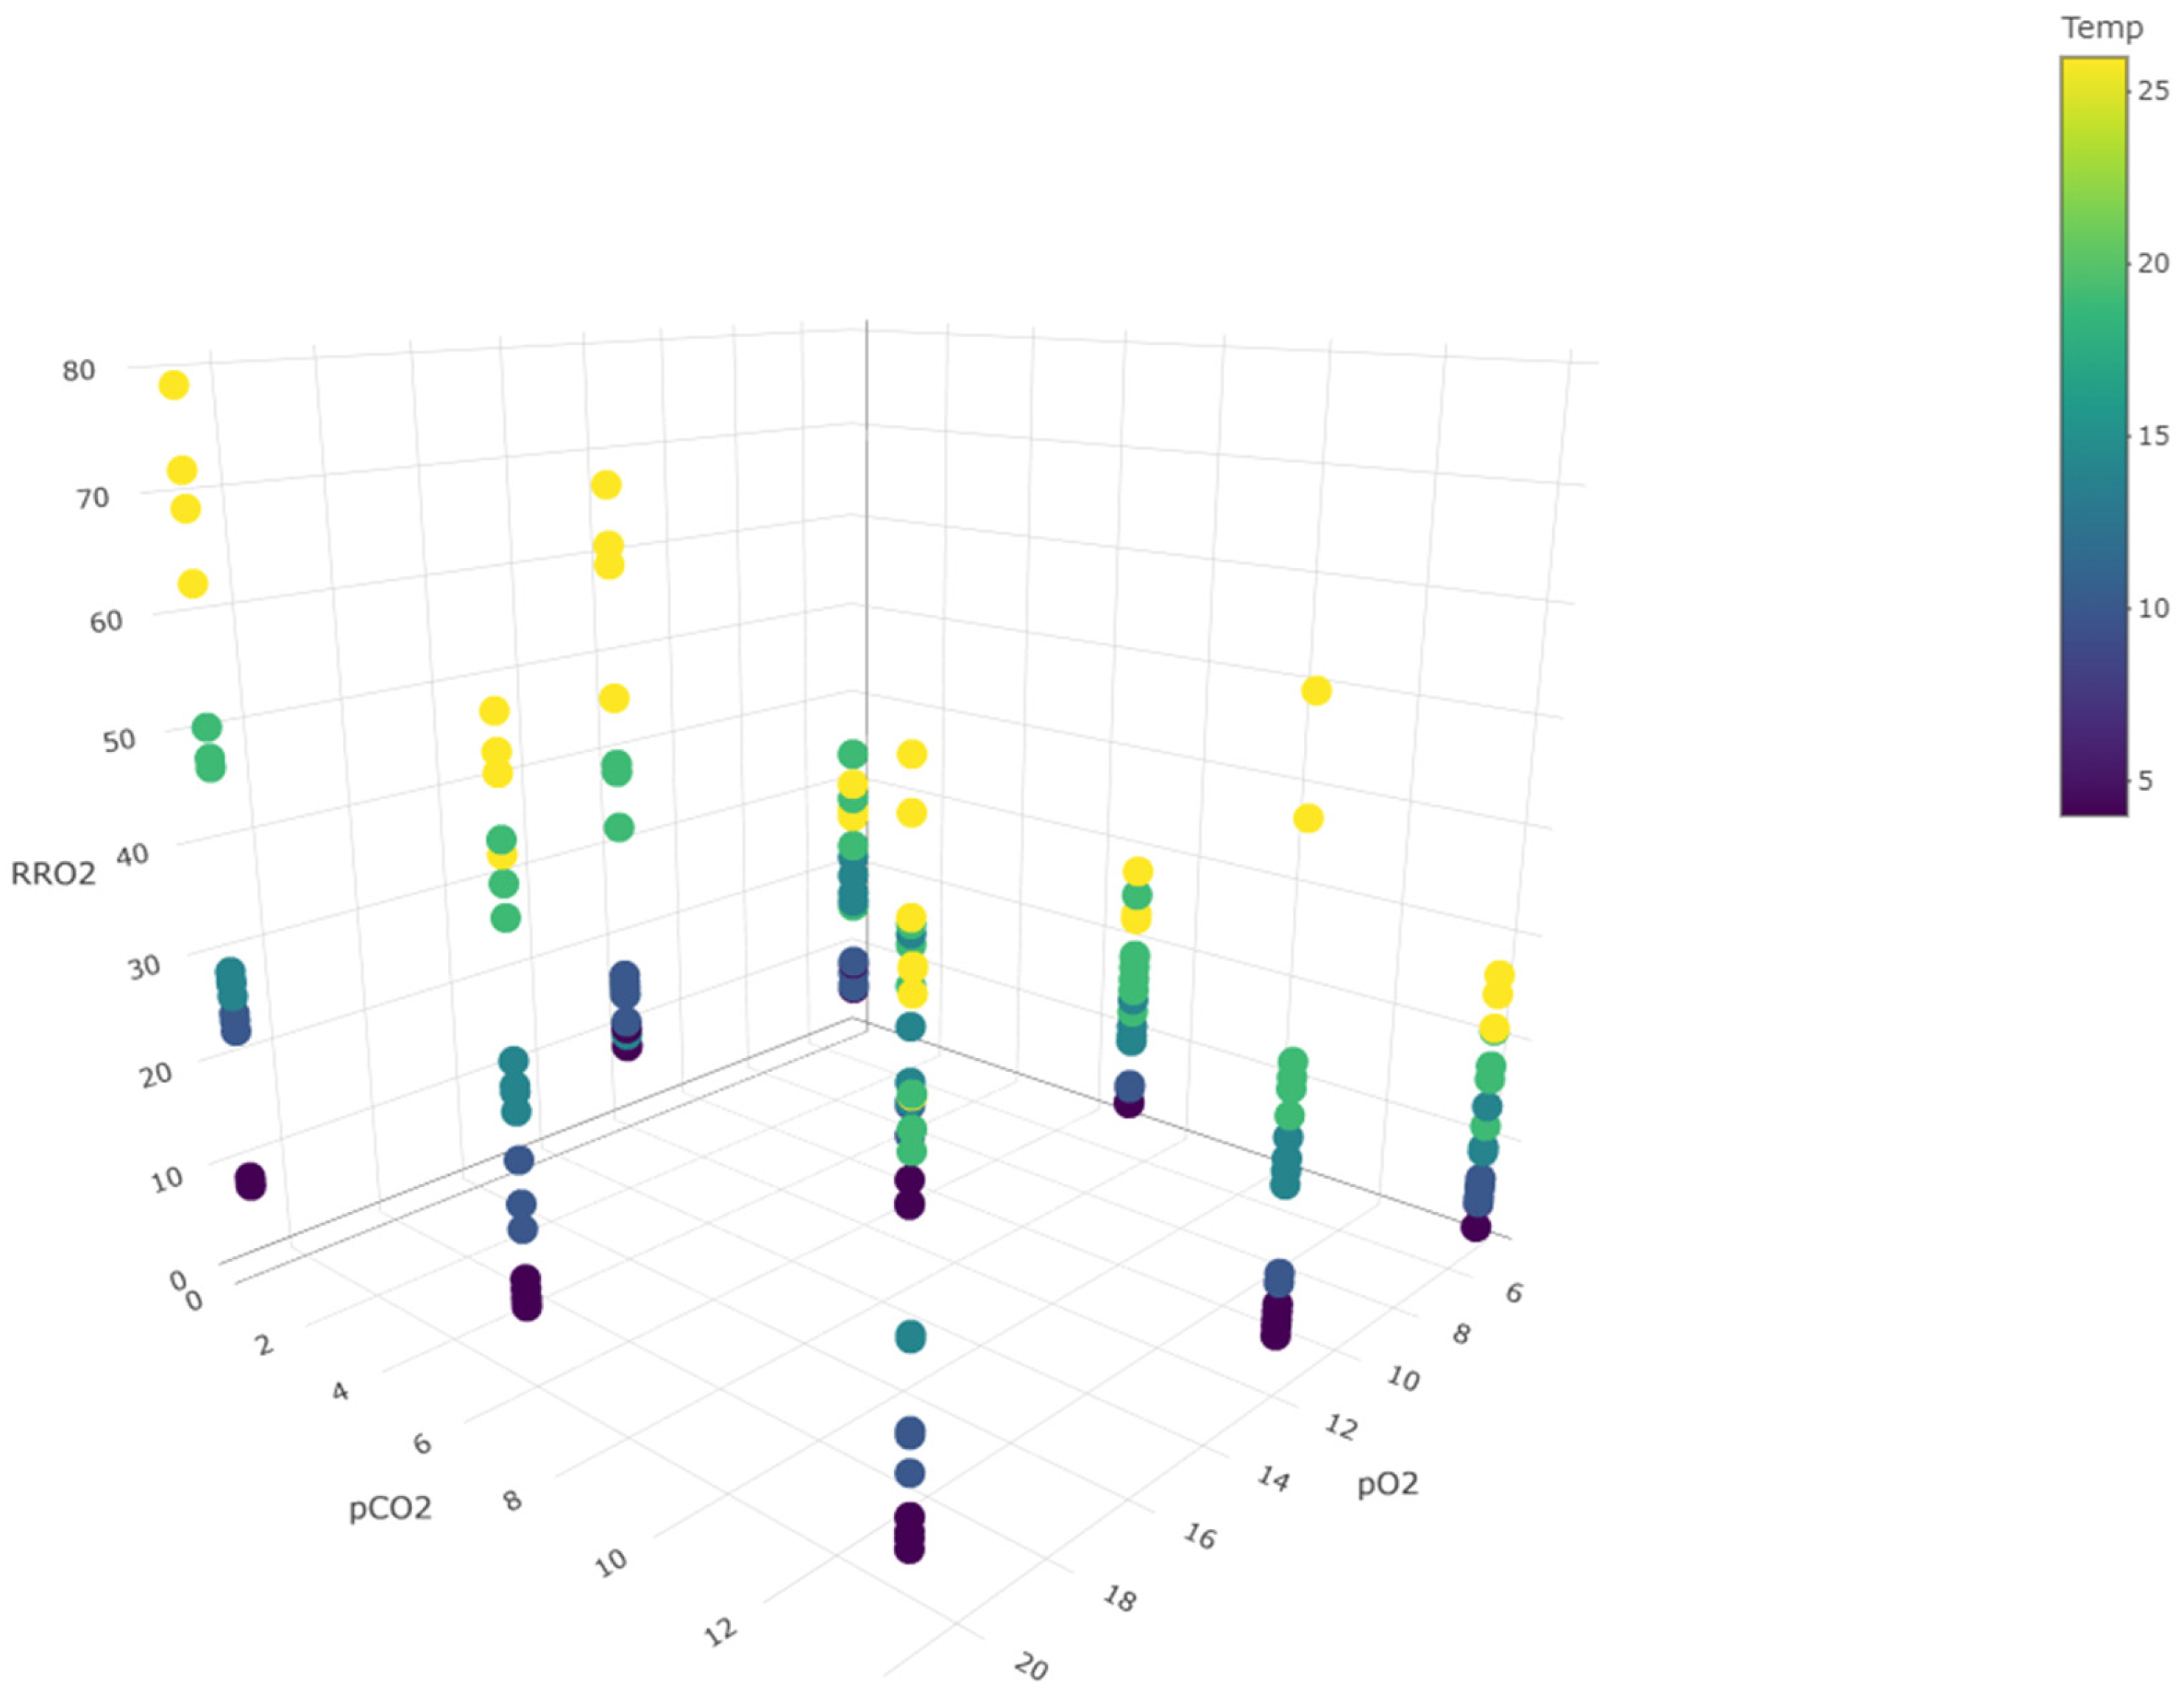
3.1. Gaseous Composition and Temperature Influence on Respiration Rate

Figure 1 shows experimental respiration rates for fresh-cut strawberries. A significant effect of O2 and CO2 concentrations and temperature, including their interactions, was observed on RRO2. Temperature had a strong impact, especially above 10 °C, where the respiration rate is significantly lowered by reducing oxygen or increasing carbon dioxide. O2 composition also showed relevant incidence on RRO2: reducing oxygen from 21 kPa to 12 kPa decreased RRO2 1.7 times, while a reduction from 21 kPa to 5 kPa decreased RRO2 3.6 times. Barrios, Lema, & Lareo (2014) found similar effects in ‘San Andreas’ strawberries, while Talasila et al. (1992) reported higher respiration rates for ‘Selva’ cultivars, underscoring the need to evaluate responses for different varieties and postharvest conditions [6,8].
Carbon dioxide inhibition showed a slightly lower effect on RRO2. A significant effect of CO2 concentration on RR was observed only at high CO2 concentrations (14 kPa), with RRO2 decreasing from 0.9 to 1.6 times the original value. At temperatures above 14 °C and low oxygen concentrations, elevated RQ values were observed, indicating a potential switch between aerobic and anaerobic respiration [9].

3.2. RRO2 Models: Influence of O2, CO2 and Temperature

All models tested could explain over 87% of the experimental data variance. When comparing models that account for the influence of temperature, the Arrhenius model provided slightly better fits than the exponential model but lower than the power model. Despite this, the three models showed a high R2. The Arrhenius model has the advantage of being well-documented in the literature, allowing easier comparison of constants’ values. However, this model has been revisited in the last years for its suitability for application in complex biochemical reactions because it assumes, among other observations, that during non-isothermal processes or storage, the reaction rate constant depends solely on the current temperature and is unaffected by the product’s previous thermal history [14]. As for models accounting for the influence of gaseous composition on RR, the quadratic model had the lower RMSE (4.90) and the highest R2 (0.914), while the Michaelis–Menten model with no CO2 inhibition had the highest RMSE (35.02) and the lowest R2 (0.874). Langmuir and Michaelis–Menten, with CO2 inhibition, had very similar values of R2 (0.900–0.911), RMSE (4.96–5.32), and AIC (1043–1067).
Table 2 shows the parameters and statistics associated to best fits obtained for phenomenological and empirical models. Although best fit was achieved with the quadratic empirical model, which is simple and easy to construct, its parameters lack physical or biological meaning, limiting its applicability [14]. Among the phenomenological models (enzyme-based), the UMM (or its Langmuir equivalent) provided the best fit.
When comparing parameters between cultivars, activation energies (Ea) for minimally processed ‘Ágata’ strawberries ranged from 52.1 to 52.4 kJ mol−1. These values are slightly lower than those reported for whole ‘San Andreas’ strawberries (64.2 kJ mol−1) or whole ‘Elsanta’ strawberries (74.8 kJ mol−1); while for the ‘Kent’ variety, a range of 55.3 to 57.3 kJ mol−1 was reported [8,9,15]. The Michaelis–Menten constants (Km) obtained were significantly higher than those reported by other authors. Hertog et al. (1999) reported Km values of 2.63%, while Geysen et al. (2005) found values of 1.2% for whole ‘San Andrea’ strawberries [8,16]. These differences are likely due to variations in strawberry variety, physiological state, and differences in processing (whole vs. minimally processed strawberries).

3.3. Model Validation

Figure 2 shows experimental and predicted O2 and CO2 evolution throughout 45 h storage for fresh-cut strawberries in closed system (jars). Simulated results presented correspond to UMM model with power temperature dependance.
The model gives a correct description of the evolution of oxygen and carbon dioxide inside the reactors. RMSE values obtained for O2 and CO2 curves were 0.257 and 0.398, respectively, being close to zero. The kinetic model developed for strawberry respiration rate was thus validated for fresh-cut ‘Ágata’ strawberries, enabling its use in dynamic shelf-life modeling throughout cold-chain studies, as reported by Matar et al. (2018) and Jalali et al. (2020) [17,18].

4. Conclusions

The suitability of different phenomenological and empiric models for predicting the respiration rate of fresh-cut strawberries (cv. ‘Ágata’) was assessed using a complete factorial design. Taking into account temperature and gaseous atmosphere (pO2 and pCO2) and their interactions as principal factors that influence respiration rate, the quadratic model and Michaelis–Menten Uncompetitive-with-power model for temperature dependence were the best predictors of the experimental data. These submodels are essential for dynamic studies on the evolution of gas composition and temperature, enabling more accurate predictions of shelf life in minimally processed products.

Author Contributions

Conceptualization, methodology, software, and validation M.I.; writing—original draft preparation, M.I.; writing—review and editing, S.B.; visualization, S.B.; supervision, P.L. All authors have read and agreed to the published version of the manuscript.

Funding

This research was funded by Comisión Sectorial de Investigación Científica (CSIC, Universidad de la República) through the GRUPOS I + D Programme.

Institutional Review Board Statement

Not applicable.

Informed Consent Statement

Not applicable.

Acknowledgments

We would like to thank the strawberry producer Miguel Baldassini and Mauro Dubois, the supplier, as well as Esteban Vicente and Joanna Lado from INIA Salto for providing valuable information about the ‘Ágata’ cultivar.

Conflicts of Interest

The authors declare no conflicts of interest.

References

  1. Giampieri, F.; Tulipani, S.; Alvarez-Suarez, J.M.; Quiles, J.L.; Mezzetti, B.; Battino, M. The strawberry: Composition, nutritional quality, and impact on human health. Nutrition 2012, 28, 9–19. [Google Scholar] [CrossRef] [PubMed]
  2. Parvez, S.; Wani, I.A. Postharvest Biology and Technology of Strawberry. In Postharvest Biology and Technology of Temperate Fruits; Mir, S., Shah, M., Mir, M., Eds.; Springer Cham: Gewerbestrasse, Switzerland, 2018; pp. 331–348. [Google Scholar] [CrossRef]
  3. Mezzetti, B.; Balducci, F.; Capocasa, F.; Zhong, C.-F.; Cappelletti, R.; Di Vittori, L.; Mazzoni, L.; Giampieri, F.; Battino, M. Breeding Strawberry for Higher Phytochemicals Content and Claim It: Is It Possible? Int. J. Fruit Sci. 2016, 16, 194–206. [Google Scholar] [CrossRef]
  4. Rashvand, M.; Matera, A.; Altieri, G.; Genovese, F.; Fadiji, T.; Opara, U.L.; Mohamadifar, M.A.; Feyissa, A.H.; Di Renzo, G.C. Recent advances in the potential of modeling and simulation to assess the performance of modified atmosphere packaging (MAP) systems for the fresh agricultural product: Challenges and development. Trends Food Sci. Technol. 2023, 136, 48–63. [Google Scholar] [CrossRef]
  5. Schudel, S.; Shrivastava, C.; Rebeaud, S.G.; Karafka, L.; Shoji, K.; Onwude, D.; Defraeye, T. Combining experiments and mechanistic modeling to compare ventilated packaging types for strawberries from farm to retailer. Food Packag. Shelf Life 2022, 34, 100944. [Google Scholar] [CrossRef]
  6. Talasila, P.C.; Chau, K.V.; Brecht, J.K. Effects of Gas Concentrations and Temperature on O2 Consumption of Strawberries. Trans. Am. Soc. Agric. Eng. 1992, 35, 221–224. [Google Scholar] [CrossRef]
  7. Hertog, M.L.A.T.M.; Boerrigter, H.A.M.; Boogaard, G.J.P.M.; Tijskens, L.M.M.; van Schaik, A.C.R. Predicting keeping quality of strawberries (cv. `Elsanta’) packed under modified atmospheres: An integrated model approach. Postharvest Biol. Technol. 1999, 15, 1–12. [Google Scholar] [CrossRef]
  8. Barrios, S.; Lema, P.; Lareo, C. Modeling respiration rate of strawberry (cv. San Andreas) for Modified Atmosphere Packaging Design. Int. J. Food Prop. 2014, 17, 2039–2051. [Google Scholar] [CrossRef]
  9. Fonseca, S.C.; Oliveira, F.A.; Brecht, J.K. Modelling respiration rate of fresh fruits and vegetables for modified atmosphere packages: A review. J. Food Eng. 2002, 52, 99–119. [Google Scholar] [CrossRef]
  10. Badillo, G.M.; Segura-Ponce, L.A. Classic and Reaction-Diffusion Models Used in Modified Atmosphere Packaging (MAP) of Fruit and Vegetables. Food Eng. Rev. 2020, 12, 209–228. [Google Scholar] [CrossRef]
  11. Hertog, M.L.A.T.M.; Peppelenbos, H.W.; Evelo, R.G.; Tijskens, L.M.M. A dynamic and generic model of gas exchange of respiring produce: The effects of oxygen, carbon dioxide and temperature. Postharvest Biol. Technol. 1998, 14, 335–349. [Google Scholar] [CrossRef]
  12. Peleg, M.; Corradini, M.G.; Normand, M.D. Kinetic models of complex biochemical reactions and biological processes. Chem. Ing. Tech. 2004, 76, 413–423. [Google Scholar] [CrossRef]
  13. Irazoqui, M. Experimental respiration data used for model calibration. Universidad de la República: Montevideo, Uruguay, 2024; unpublished data. [Google Scholar]
  14. Barbosa, N.C.; Vieira, R.A.M.; de Resende, E.D. Modeling the respiration rate of Golden papayas stored under different atmosphere conditions at room temperature. Postharvest Biol. Technol. 2018, 136, 152–160. [Google Scholar] [CrossRef]
  15. Tano, K.; Kamenan, A.; Arul, J. Respiration and transpiration characteristics of selected fresh fruits and vegetables. Agron. Afr. 2005, 17, 103–115. [Google Scholar] [CrossRef]
  16. Geysen, S.; Verlinden, B.E.; Conesa, A.; Leuven, K.U. Modelling Respiration of Strawberry (cv. ‘Elsanta’) as a Function of Temperature, Carbon Dioxide, Low and Superatmospheric Oxygen Concentrations. Respiration 2005, 5, 12–16. [Google Scholar]
  17. Jalali, A.; Linke, M.; Geyer, M.; Mahajan, P.V. Shelf life prediction model for strawberry based on respiration and transpiration processes. Food Packag. Shelf Life 2020, 25, 100525. [Google Scholar] [CrossRef]
  18. Matar, C.; Gaucel, S.; Gontard, N.; Guilbert, S.; Guillard, V. Predicting shelf life gain of fresh strawberries ‘ Charlotte cv’ in modified atmosphere packaging. Postharvest Biol. Technol. 2018, 142, 28–38. [Google Scholar] [CrossRef]
Figure 1. Respiration rate (as O2 consumption) and the effect of temperature, oxygen, and carbon dioxide.
Blsf 40 00054 g001
Figure 2. Experimental (dots with average ± standard deviation) and simulated values for O2 (left) and CO2 (right) evolution for fresh-cut strawberries throughout 42 h in a closed system. The model used for respiration rate (as O2 consumption) was UMM with a power temperature model (dashed lines).
Blsf 40 00054 g002
Table 1. Models tested for evaluation of oxygen, carbon dioxide, and temperature effect on respiration rate (RRO2, mL kg−1h−1) of ready-to-eat strawberries (cv. ‘Ágata’).
DescriptionEquation *Equation Number
Model 1—Langmuir adsorption
(L)
R R O 2 = a   *   v m ,   O 2   *   c O 2 1 + a   *   c O 2 + a   *   i   *   c O 2 c C O 2 (3)
Model 2—Michaelis–Menten with no CO2 Inhibition (MM) R R O 2 = v m ,   O 2   *   c O 2 k m ,   O 2 + c O 2 (4)
Model 3—Michaelis–Menten with competitive CO2 Inhibition (CMM) R R O 2 = v m ,   O 2   *   c O 2 k m , O 2 ( 1 + c C O 2 k i , C O 2 ) + c O 2 (5)
Model 4—Michaelis–Menten with uncompetitive CO2 Inhibition (UMM) R R O 2 = v m ,   O 2   *   c O 2 k m , O 2 + c O 2 ( 1 + c C O 2 k j , C O 2 ) (6)
Model 5—Michaelis–Menten with non-competitive CO2 Inhibition (NMM) R R O 2 = v m ,   O 2   *   c O 2 ( k m , O 2 + c O 2 ) ( 1 + c C O 2 k n , C O 2 ) (7)
Model 6—Michaelis–Menten with competitive-uncompetitive CO2 Inhibition (MixMM) R R O 2 = v m ,   O 2   *   c O 2 k m , O 2 ( 1 + c C O 2 k i , C O 2 ) + c O 2 ( 1 + c C O 2 k j , C O 2 ) (8)
Model 7—Generalized linear (GLM) R R O 2 = β 0 + β 1 c O 2 + β 2 c C O 2 + β 3 T C + β 4 c O 2 c C O 2 + β 5 T C   c C O 2 + β 6 T C c C O 2 + β 7 T C   c O 2 c C O 2 (9)
Model 8—Quadratic (QM) R R O 2 = α 0 + α 1 c O 2 + α 2 c C O 2 + α 3 T C + α 4 c O 2 2 + α 5 c C O 2 2 + α 6 T C 2 + α 7 c O 2 c C O 2 + α 8 T C   c C O 2 + α 9 T C c O 2 + α 10 T C   c O 2 c C O 2 (10)
* a , b ,   i Parameters associated with the Langmuir model. v m ,   O 2 the maximum oxygen consumption. k m , O 2 is the Michaelis–Menten constant for O2 and k i , C O 2 , k j , C O 2 , and k n , C O 2 are the Michaelis–Menten inhibition constants for: competitive, uncompetitive, and non-competitive inhibition, respectively. β i are parameters associated to Genelaized Linear model and α i are parameters associated with the Quadratic model. T C is the temperature in °C.
Table 2. Parameters for empirical models (quadratic) and phenomenological models (Langmuir; Michaelis–Menten uncompetitive-UMM, noncompetitive-NMM, and mixed-MixMM), considering power and Arrhenius models for temperature effect. Goodness of fit for O2 consumption rate is reported. Parameters are presented as mean ± standard deviation and p-value between brackets.
ParametersValueParametersValueParametersValue
Quadratic model α 0 0.67 ± 3.55 (0.849) α 1 0.64 ± 0.40 (0.111) α 2 −0.91 ± 0.40 (0.023)
α 3 −0.22 ± 0.428 (0.429) α 4 −0.031 ± 0.013 (0.177) α 5 0.030 ± 0.017 (0.0778)
α 6 0.0325 ± 0.0073
(1.78 × 10⁻⁵)
α 7 0.044 ± 0.022 (0.0492) α 8 0.026 ± 0.020 (0.194)
α 9 0.098 ± 0.012 (2.40 × 10⁻¹³) α 10 −0.0046 ± 0.0014 (0.00106)
R20.914
RMSE4.90
AIC1052.6
ParametersLangmuirParametersUMMNMMMixMM
Power
model
b 1 2.18 ± 0.36 (7.88 × 10⁻⁹) b 1 2.18 ± 0.36 (7.88 × 10⁻⁹)1.98 ± 0.31 (1.83 × 10⁻⁹)2.13 ± 0.37 (3.59 × 10⁻⁸)
b 2 1.237 ± 0.046
(<2 × 10⁻¹⁶)
b 2 1.237 ± 0.046
(<2 × 10⁻¹⁶)
1.232 ± 0.046
(<2 × 10⁻¹⁶)
1.235 ± 0.046
(<2 × 10⁻¹⁶)
a 0.0613 ± 0.0087 (3.97 × 10⁻¹¹) k m , O 2 16.3 ± 2.3
(3.97 × 10⁻¹¹)
13.0 ± 1.6
(3.51 × 10⁻¹³)
15.4 ± 2.9
(3.20 × 10⁻⁷)
i 0.0468 ± 0.0080 (2.52 × 10⁻⁸) k j , C O 2 21.4 ± 3.6
(2.52 × 10⁻⁸)
---191.3 (0.699)
k n , C O 2 ---43.9 ± 6.3 (1.01 × 10⁻¹⁰)---
k i , C O 2 ------24 ± 10 (0.016)
R20.911R20.9110.9110.912
RMSE4.96RMSE4.964.984.96
AIC1043.0AIC1043.01044.31044.8
Arrhenius model A 1.77 × 10¹¹ (0.166) A 1.77 × 10¹¹ (0.166)1.51 × 10¹¹ (0.168)1.74 × 10¹¹ (0.170)
E a
(kJ/mol)
52.4 ± 1.7
(<2 × 10⁻¹⁶)
E a
(kJ/mol)
52.4 ± 1.7
(<2 × 10⁻¹⁶)
52.3 ± 1.8
(<2 × 10⁻¹⁶)
52.39 ± 0.24
(<2 × 10⁻¹⁶)
a 0.0641 ± 0.0092
(8.57× 10⁻¹¹)
k m , O 2 15.6 ± 2.2
(8.57× 10⁻¹¹)
12.5 ± 1.6
(1.11 × 10⁻¹²)
15.2 ± 2.9
(4.46 × 10⁻⁷)
i 0.0460 ± 0.0080
(4.12 × 10⁻⁸)
k j , C O 2 21.7 ± 3.8 (4.12 × 10⁻⁸)---406 (0.855)
k n , C O 2 ---44.0 ± 6.6 (2.89 × 10⁻¹⁰)---
k i , C O 2 ------23.1 ± 9.1 (0.012)
R20.907R20.9070.9060.907
RMSE5.09RMSE5.095.115.09
AIC1051.7AIC1051.71053.61044.8
Disclaimer/Publisher’s Note: The statements, opinions and data contained in all publications are solely those of the individual author(s) and contributor(s) and not of MDPI and/or the editor(s). MDPI and/or the editor(s) disclaim responsibility for any injury to people or property resulting from any ideas, methods, instructions or products referred to in the content.

