Abstract
This paper proposed a standalone solar/wind/micro-hydro hybrid power generation system to electrify Ethiopian remote areas that are far from the national utility grid. The aim is that it will lead to the development of renewable energy sources, using a hybrid optimization model for energy renewables (HOMER) as an optimization and sensitivity tool and MATLAB as a design tool. The system uses 100% renewable energy. This system incorporated solar photo-voltaic (PV), wind turbines, micro-hydro systems, and battery systems. The net present cost of the system is $4,377,731, incorporating capital depreciation and levelized operation and maintenance costs. During the hybrid energy system’s lifetime, the cost of a grid extension power supply is $22.185 million, which is nearly $17,808,000 more than the cost of the proposed standalone system. So, developing solar/wind/micro-hydro hybrid power generation will save $17,808,000 versus extending the national utility grid. As a result of a thorough examination of renewable energy resources, standalone solar, wind, and micro-hydro hybrid power generation is a technically and economically viable option for the case study area of Maji town.
1. Introduction
Renewable energy is the main and most elemental element in our universe. In particular, in less developed countries like Ethiopia, the significance of energy is vital. It amplifies human efforts and enables humans to produce more, travel farther and faster, communicate more broadly and quickly, and to have a higher standard of living than is possible through human efforts alone. Hence, it can be said that, like the other basic needs for human beings, energy is a basic inevitability for survival [1].
Renewable sources are widely available and are capable sources of energy for emerging power generation, as evidenced by the rapid growth of stand-alone and grid-integrated solar, wind, and micro-hydroelectricity industries. Natural energy resources, on the other hand, are unpredictably infrequent and seasonally unbalanced. As a result, combining these three renewable resources may be able to meet a greater portion of electricity consumption, while also providing a stable and consistent supply of energy [2]. Previous studies have demonstrated the dependability of the stand-alone hybrid PV/wind/micro-hydro system in generating electricity. The purpose of this research is to consider alternative power supply solutions for Maji that do not rely on traditional fuel. The community is cut off from Ethiopia’s main energy grid. Furthermore, many renewable energy resources have existed, but the most promising resources are solar, wind, and micro-hydro. They depend on the variable natural conditions that provide sustainable and clean energy [3].
One reason might be that these places are either remote from the electric grid or have few inhabitants. Because of the significant expense of transmission and the low load factor in these locations, expanding the electric grid to these places is not within the country’s economic capability. These people rely on kerosene, which is becoming incredibly hard to obtain due to the high and steadily rising price of kerosene, as well as firewood, cow dung, and other conventional biomass resources, all of which contribute to deforestation and soil deterioration [4].
The majority of Ethiopians (approximately 85% of the population) live in rural areas with almost no access to energy (1%). A possible reason is that these areas are farther away from the national grid, and also the people are sparsely populated. Extending the national grid to these areas is not within the economic capacity of the country, because of the high cost of transmission and the very low load factor in these areas. To satisfy their energy needs, these people are using kerosene, which is becoming difficult to afford because of the high and day-to-day increasing price of kerosene, and fire wood, cow dung, and other traditional biomass resources, which are causing deforestation and soil degradation. People pay high prices for fuel mills because of the high running costs of fuel due to the lack of electricity mills in rural areas. Moreover, there is a lack of quality education and good health care in the towns due to electricity shortage.
1.1. Related Work
A literature review has been carried out to study this idea, which has already been carried out in this area. The selected criteria are based on the superiority of the proposed system as found all over the world. Numerous studies on hybrid off-grid energy production have been undertaken across the globe, including in Ethiopia. To analyze the multiple configurations of renewable resources, such as solar energy, wind energy, small hydropower, and their hybrid combinations, numerous researchers have utilized different technological options and strategies. A variety of study findings have been reported, and the next section reviews and evaluates a few of the research papers. In this paper, solar/wind/micro-hydro hybrid renewable energy resources are selected by reading and critically reviewing different research papers presented by different researchers [5,6,7].
The authors of [1] present a synergistic concept of an integrative photovoltaic/distillation solar network built on the nanofluid spectrum splitting method. The authors of [2] present research on optimum hybrid power systems in a remote area of Bangladesh using accessible sources of energy. The authors of [3] discuss the viability of implementing Illinois Solar for All (ILSFA) in the Bloomington normal water reclamation district. The evaluation of Ethiopia’s wind and solar power potential is reported in [5,6,7]. The authors of [8] focus on the design of an off-grid hybrid PV/wind electricity system for a distant mobile base station. The authors of [9] describe the energy hybridization of photovoltaic/diesel generator/pump storage hydroelectric management based on online optimal fuel consumption per kWh. This paper used fuel when photo-voltaic was unavailable, and it was very costly. The authors of [10] present a case study comparison between photovoltaic and fossil generation based on direct current hybrid micro-grids, which use traditional fuel generation systems, but have a CO2 emission limit for the greenhouse effect. Refer to [11] for a critical examination of hybrid renewable energy modeling tools—an emerging opportunity to include social indicators to optimize systems in small communities was done, but it had its own limitations as it did not show any modeling of renewable energy resources or feasibility analysis.
1.2. Research Gap
Almost every article by the aforementioned researchers illustrates a hybrid approach, whether PV/wind/hydro with a wind turbine or PV/wind. However, this research mixes PV and wind, which would be more realistic, and the chosen location is remote from the main grid system. This system arrangement is the finest of all, as Ethiopia has abundant solar resources and moderate wind capacity in practically every section of the nation. In contrast to the previous research evaluations, it is noted that few researchers have utilized RETScreen or other simulation software for hybrid micro power design, and nearly all of them were focused on feasibility studies. As a result, HOMER is frequently utilized in most RES-based technologies. Based on literature studies, HOMER software was chosen for the feasibility evaluation. However, we used HOMER for the feasibility study optimization and sensitivity, while MATLAB was utilized to simulate the intended system.
1.3. Contribution
The major goal of this research is to conduct a feasibility analysis and design for Maji town’s photovoltaic, wind, and micro-hydro hybrid power generation.
- Compare the possibilities of solar, wind, and micro-hydro hybrid renewable energy resources with grid extension.
- Design a hybrid energy source from solar, wind, or micro-hydro and supply sufficient electricity for the people living in Maji town.
- Make a comparison between the hybrid system’s capital costs and the cost of electrifying the regions by extending the electric grid.
2. Case Study Area Description
Maji Town, located at 12′ N 35′ E/ E, is one of the fastest growing towns in the Bench Maji Zone, SNNPRs. Currently, the population size of this town is 2930 people, with 586 households, and the way of life is based on agriculture and trade. In this town, there are government institutions (primary and secondary schools, a health center, and a municipality) and religious institutions. The demand for electricity in this town is increasing as the population grows. Due to the lack of electricity, the people living in this town face different socio-economic problems like women wasting their time collecting wood, deforestation of trees, environmental pollution due to the combustion of wood, poor education quality, less health care, and other problems, among others.
2.1. Renewable Energy Assessment
2.1.1. Solar Energy System
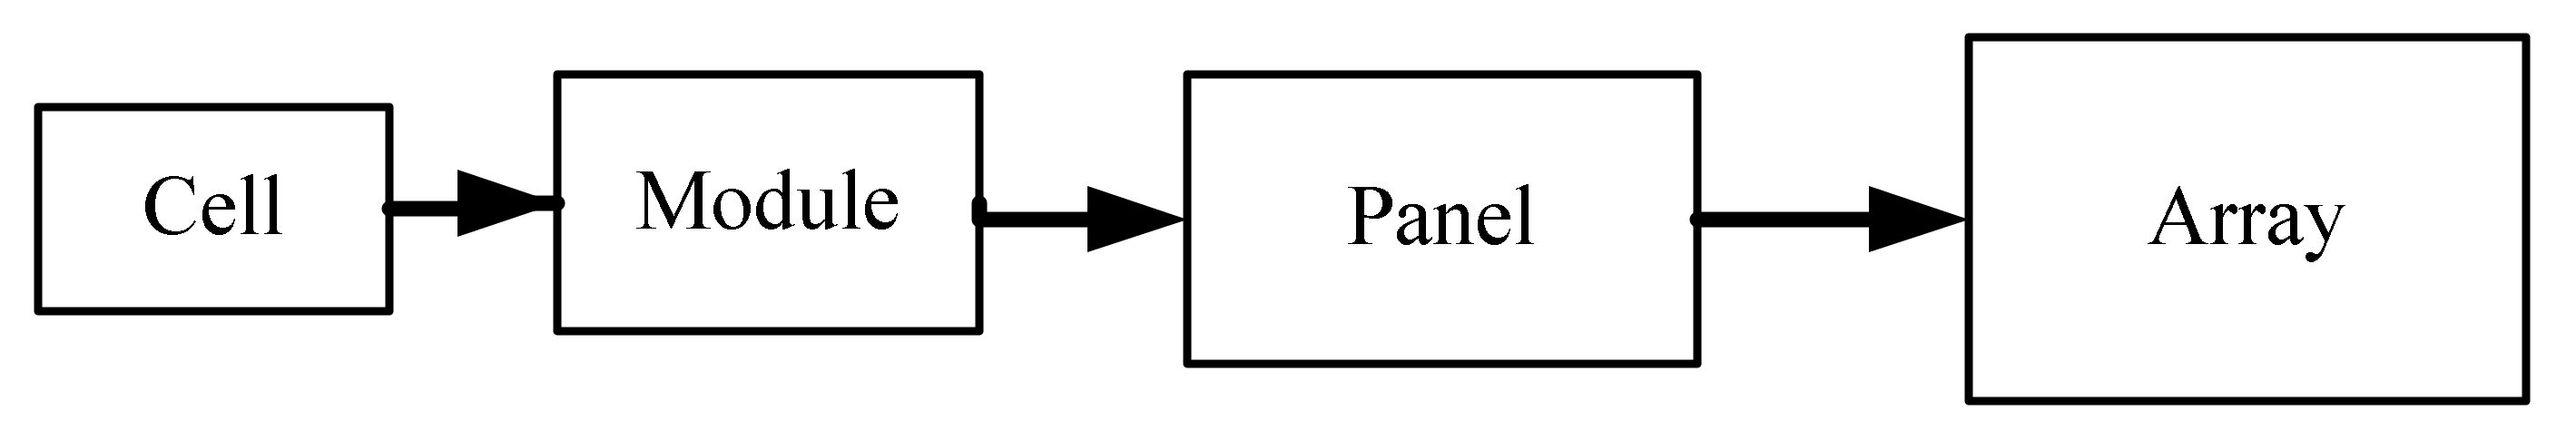
Photovoltaic cells, or modules, are the solar cells found in calculators and spacecraft. Numerous PV cells are wired in parallel to increase current and in sequence to boost voltage in this PV module [6,7]. Figure 1 presents the block diagram of the PV electric power generation arrangements.

Figure 1.
Block diagram of PV electric power generation arrangements.
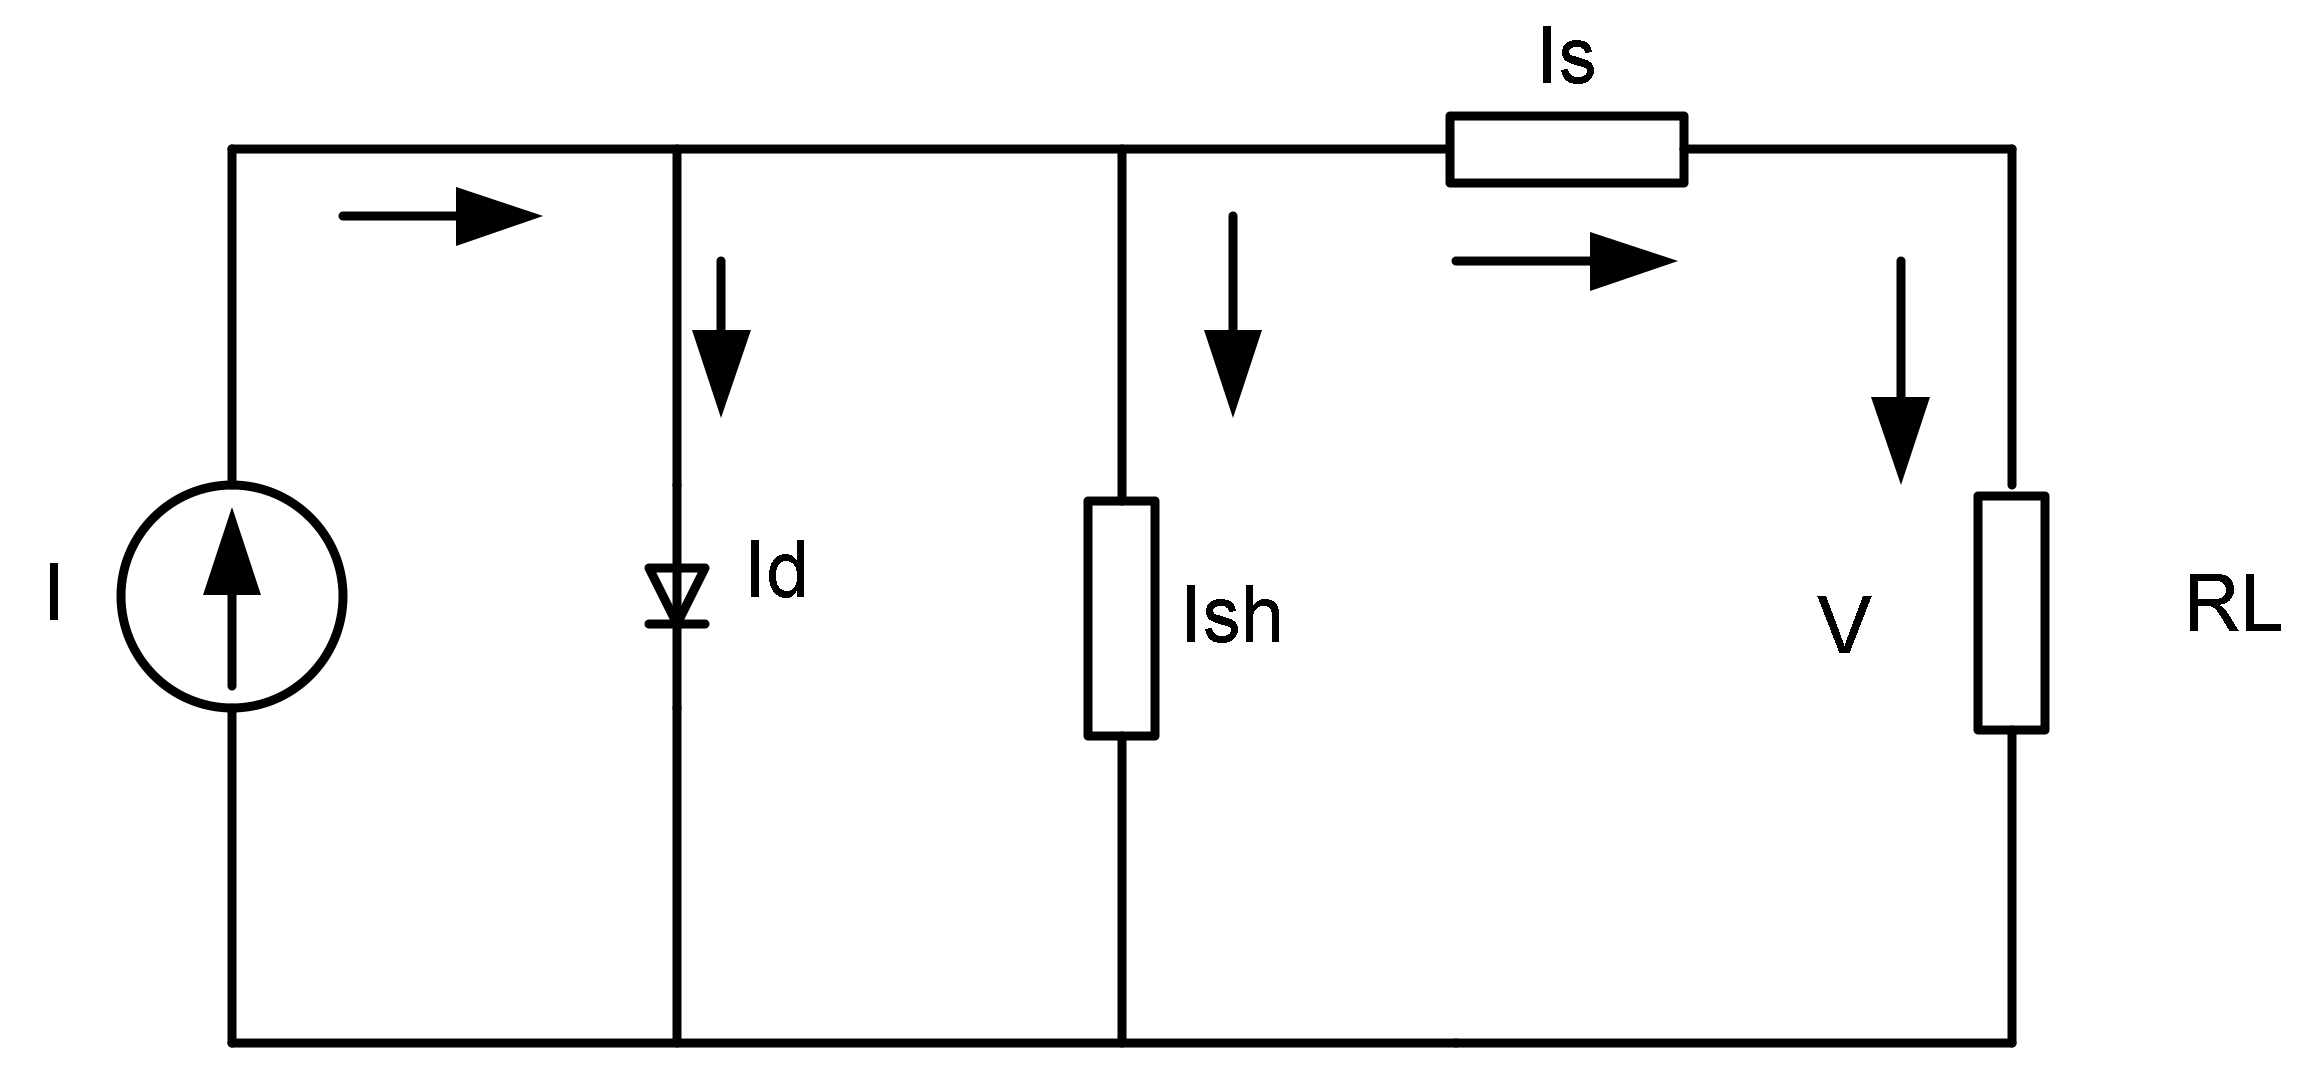
2.1.2. Equivalent Model of PV Cell
The equivalent electrical circuit shown in Figure 2 below represents the PV cell’s complex physics. The criteria listed below should be taken into account. Output current I is equal to the light-generated current IL minus the diode current ID and the shunt leakage current . The series resistance RS depends on the p–n junction depth, impurities, and contact resistance. In a perfect PV cell, RS = 0 and RSh = ∞.

Figure 2.
A PV cell equivalent electrical circuit [2].
Figure 3 presents a block diagram of the PV electric power generation system utilized in this work.
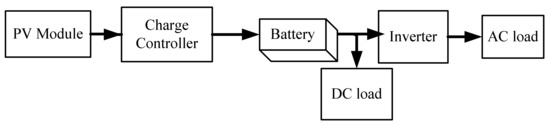
Figure 3.
Block diagram of the PV electric power generation arrangements.
2.2. Wind Energy System and Potential Assessment of Study Area
Weibull distribution over a length of time at a certain location is used to express the wind distribution. The equation below represents the Weibull probability density function (PDF) [2].
where, u is the wind speed, k is a constant known as the shape factor (when k increases the curve will have a sharper peak), and c is a scale parameter in m/s (the larger the scale parameter, the more spread out the distribution). The power density can in this case be expressed as [2]:
where, Vj is the median velocity in class j and fj is the frequency of occurrence in the same class. For k = 2, the Weibull PDF is commonly known as the Rayleigh density function, in which case Equation (2) may be rewritten as in Equation (3) [2]
Using the logarithmic law, the wind speed at a certain height above ground level can be given by [2]:
where, Zr is reference height (m), Z is height (m), Z0 is measure of surface roughness (0.1 to 0.25 for crop land), v(z) is wind speed at height of Z m (m/s), and v(zr) is wind speed at the reference height (m/s). Using the power law wind speed at a certain height above ground level can be given as follows [2]:
where, is wind speed measured at the reference height (m/s), is wind speed estimated at height (m/s), and α is ground surface friction coefficient.
The energy available in the wind can be expressed as
where, is the density of air (kg/m3), A is the swept area (m2), Pw is power in the wind (W), and v is instantaneous wind velocity (m/s)
The axial induction factor determines the power coefficient, Cp. The optimum (highest value for CP) of this function is 0.59 [2]. As a result, the wind turbine’s energy output can be stated as
where, Pw out is the output power of wind turbine, is the overall efficiency of the transmission system, and Cp is the power coefficient.
The air density ρ varies with temperature and pressure using the gas law, as follows [12]:
where, p is air pressure (Pa), R is the specific gas constant (287 Jkg−1 K−1), and T is air temperature in 0 K. If the elevation Z′ (m) and temperature T at a site are known, then the air density can be calculated by [9]:
If pressure and temperature data are not available, the following correlation may be used for estimating the air density [8]:
For the horizontal axis wind turbine, the rotor swept area is the area of a circle is given by:
where, D is the rotor diameter in meters.
2.3. Micro Hydro Power
In the future, it will be promising to deliver power to isolated rural populations. Hydropower is based on basic principles. Water flow turns a turbine that is mechanically coupled to a generator, resulting in the generation of energy. Many additional elements are necessary, but it all begins with water energy. For a long time, water flowing from a great height has been used as a type of power [13]. The properties of various renewable energy supplies are reported in Table 1.

Table 1.
Characteristics of different sources.
2.4. Electrical Load Calculation of Maji Town
The amount of energy consumed by demands over time is referred to as energy consumption. It is expressed in kWh. It is required to employ more effective, lower-demand appliances and to remove, partially or totally, the usage of other demands in order to minimize the cost of the PV and wind systems. Maji’s deferred load and energy demand are shown in Table 2.
Table 2.
Deferrable load and energy demand of Maji.
Table 3 presents the primary load and energy demand of Maji. The optimal design of this project is to meet the load demand of Maji town by a hybrid solar/wind/micro-hydro energy system. Total power demanded by the load is 972.89 kW, but this doesn’t consider the 18% system loss, including cable losses (2%). Therefore, the total power needed for Maji is 1168.67 kW. Furthermore, the daily energy requirement is 5455.35 kWh, but in order to design an optimal system, a total energy loss of 20% should be considered [14,15]. Therefore, the optimal energy required per day for Maji is 6546.42 kWh/day.
Table 3.
Primary load and energy demand of Maji.
2.5. Load Forecasting
Estimating the future load can be calculated as:
where, Pt is the total present power, R is the annual electric growth (load factor), and N is number of forecasted years.
For this work, forecasting for the ten years is performed. Therefore, the forecasted power is 1903.65 kW. Similarly, the forecasted energy is 10,663.43 kWh.
3. Overall System Design
3.1. Solar Energy System Design
To design the PV panels, consider a 20% loss of system component [16,17,18]. Therefore, the energy generated from solar power () is 3945.47 kWh/day.
The design has the following major steps
- The generated energy above showed the maximum load that will be used in the town. Therefore, the total AC load used is 5455.35 kWh/day.
- Multiply by 1.25 to correct for inverter loss and battery efficiency. So, the corrected energy generated is 4931.84 kWh/day
- Choose the inverter DC input voltage, usually 12 V, 24 V, or 48 V.For energy up to 1 kWh, 12 V is used; energy up to 4 kWh, 24 V is utilized; and for energy greater than 4 kWh, 48 V is utilized. Therefore, in this work, 48 V is utilized as the total energy generated from the PV panel is about 4931.8 kWh/day.
- Divide corrected by 48 V. This will provide the total amp hours per week used by AC loads, i.e., 102,746.55 Ah/day.
3.1.1. PV Modules Calculation
The average amp hours per day are 102,746.55 Ah/day. To compensate for losses from battery charging/discharging, multiply Edpv by 1.2–1.4. Therefore, the average amp hours per day are 123,295.86 Ah/day. The average sunshine hours per day are 8 h/day. The total solar array amps required is 15,411.98 A. Optimum or peak amps of the solar module used will be determined by the selected module specifications. Table 4 presents the PV module specifications.
Table 4.
PV module specifications.
The total number of solar modules required in parallel is 1986.59 panels (less than 1987 panels). The total number of modules in the series is 1. Therefore, the total number of modules required is 1987.
3.1.2. Steps for Sizing Battery
The batteries are sized and selected to store the power generated from solar power, which is proportional to the selected solar panel. The total average amp hours per day from the system loads are 123,295.86 Ah/day. So, the selected battery must be a lead−acid battery, because these batteries are perfect for solar systems. The models of the chosen batteries are:
- Lead acid batteries model S1900
- Rated capacity = 1900 Ah
- Battery voltage = 12 V
- Number of batteries in parallel = = = 121.67 batteries ≈ 122 batteries
- To determine the number of batteries required in series, divide the system voltage (48 V) by the voltage of the chosen battery (12 V).
- Number of batteries in series = = = 4
- Total number of the batteries needed = batteries in parallel × batteries in series =122 × 4 = 488 Batteries
Therefore, the total average amp hours per day from the system loads are 123,295.86 Ah/day. The minimum battery capacity computed is 231,179.74 Ah. Table 5 presents the battery specifications.
Table 5.
Battery specifications.
The number of batteries required in parallel is 122 batteries, while the number of batteries required in series is 4. Therefore, the total number of batteries needed is 488.
3.1.3. Charge Controller (MPPT)
The current rating (IT) is 14,673.93 A. The actual current rating is obtained by multiplying by the safety factor (1.25–1.3), i.e., 18,342.41 A. The charge controller current is 22,651.8 A. Therefore, an 80 A charge controller is selected. The number of charge controllers required is 284. Therefore, the arrays controlled by charge controllers are 65.
3.1.4. Inverter Sizing and Rating
For isolated systems, the inverter has to be big enough to manage the complete number of watts that will be used at one time [19,20,21]. The inverter capacity ought to be 25–30% larger than the total wattage (W) of the equipment. The peak demand at any given time is 1903.65 kW in this scenario. Therefore, the size of the inverter is 915.65 kW (≈916 kW).
3.1.5. Area Covered by PV Modules
To find out the efficiency of the panel, use the data presented below.
- Glass reflection factor or due to sun light striking panel straight is 5%;
- Allowance for panel being bellow specification and for aging is 5%;
- Dust particles are 10%.
Therefore, the efficacy of the panel is () 0.82. The panel generation factor (PGF) is 4. PGF is approximated to down, and is rounded off in order to get some reserved places to install properly. The total PV panel size is 986.37 kwp.
3.1.6. Area for PV Panel
To find out the area covered by PV modules, the total peak watt produced is needed, but the peak watt (WP) produced depends on the size of the PV module and the climate of the site location, which considers the panel generation factor.
The panel generation factor (PGF) is found through multiplying the collection efficiency by the average solar radiation in least sunny month (kW/m2/day). For this project, the data from NASA indicated that the average solar radiation in least sunny month is July, at 5.19 kWh/m2/day.
The efficiency of panel panel = 0.95 × 0.95 × 0.9 = 0.82.
PGF = × average solar radiation of least sunny season= 0.82 × 5.19 = 4.21 ≈ 4.
PGF is approximated to down round off in order to get some reserve places to install properly.
Installed power capacity = = = 986.37 kWp.
In East Africa, from most literature, 1 kwp covers 10 m2 area; therefore, the area required by the PV farm is 9863.67 m2.
3.2. Wind System Parameter Computation
The power required is () 167 kW. The rating of the SW Skystream3.7 wind turbine is 10 kW, as provided by the manufacturer. Therefore, the number of turbines required is 9.28 (). In this work, the wind turbine generator efficacy is considered to be 94%. The turbine power, or mechanical power, is equal to 177.66 kW. Therefore, the Cp is computed as 0.414. Based on the Cp, the calculated wind power (Pw) is 429.13 kW. The annual energy generation () and capacity factor for the proposed wind system are 569,310.49 kWh and 0.39, respectively [21]. Table 6 presents the computed parameters of the wind generation system.
Table 6.
Computed parameters of the wind generation system.
3.3. Micro-Hydro Power Generation Design
According to the survey conducted in 2008 [4] and the district energy office information, the area has a minimum flow of approximately 2045 L/s during the dry season. The flow volume varies from season to season. The net head for this hydro generation is 30 m and the type of turbine selected is the Turgo turbine [22].
Calculated Parameters of the Micro Hydro Power Plant
Table 7 presents the computed parameters of the micro hydropower system used for the development of the system.
Table 7.
Computed parameters of the micro hydropower system.
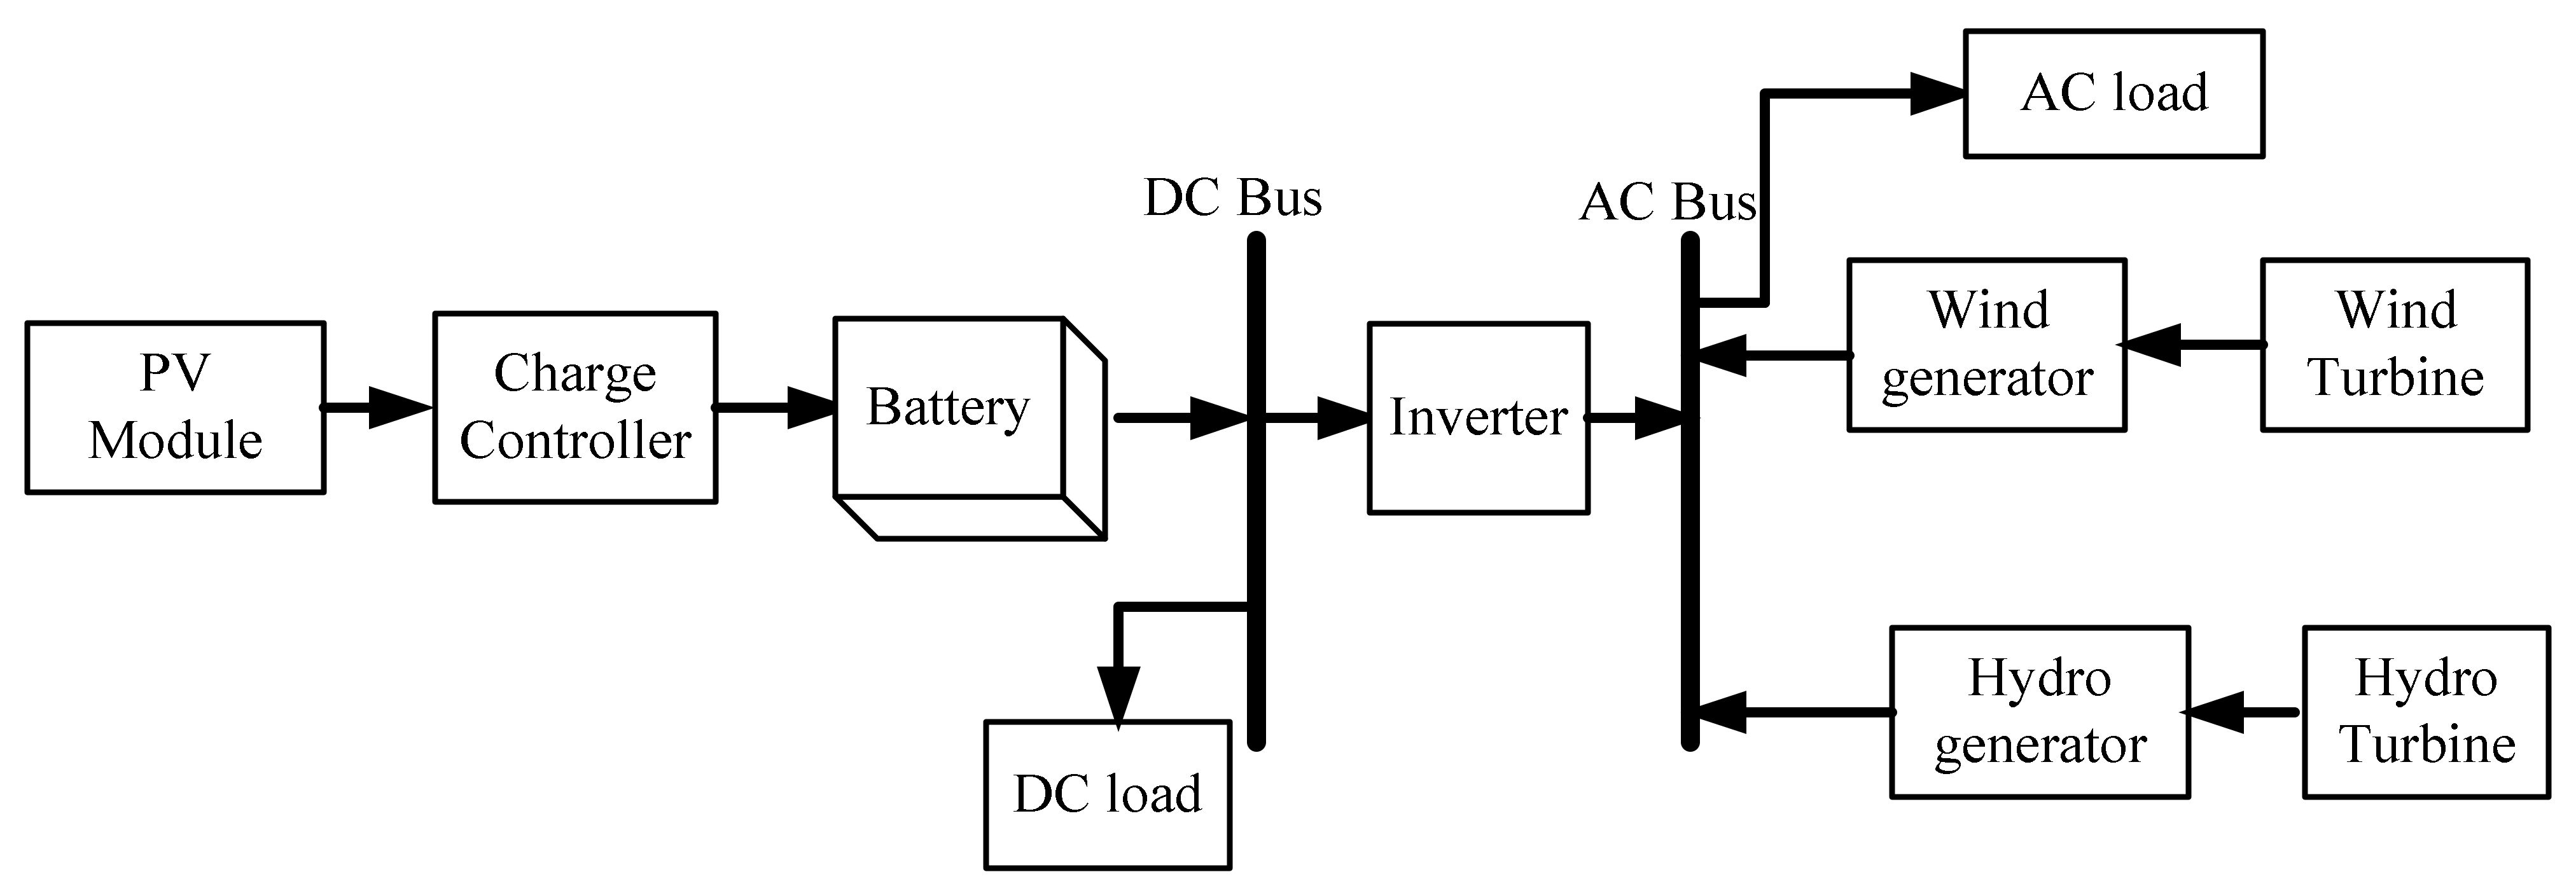
Figure 4 presents the general configuration of the PV/wind/micro-hydro hybrid system.
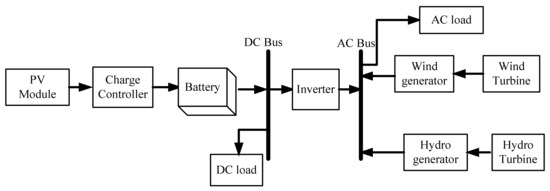
Figure 4.
General configuration of PV/wind/micro-hydro hybrid system.
3.4. Result and Discussion
3.4.1. HOMER Input Data
It is necessary to give the renewable power availability over a one-year period, a demand curve, and the specifics of each element in order to predict the cost of a hybrid power system. Table 8 shows the system’s capital and replacement costs.
Table 8.
Capital and replacement cost of the system.
3.4.2. Economic Modeling
The capital costs of each component have already been taken into account. The estimate of the fixed capital cost here is assumed for unconsidered costs, including distribution network construction, to be about $60,000.
3.5. Hybrid System Architectures
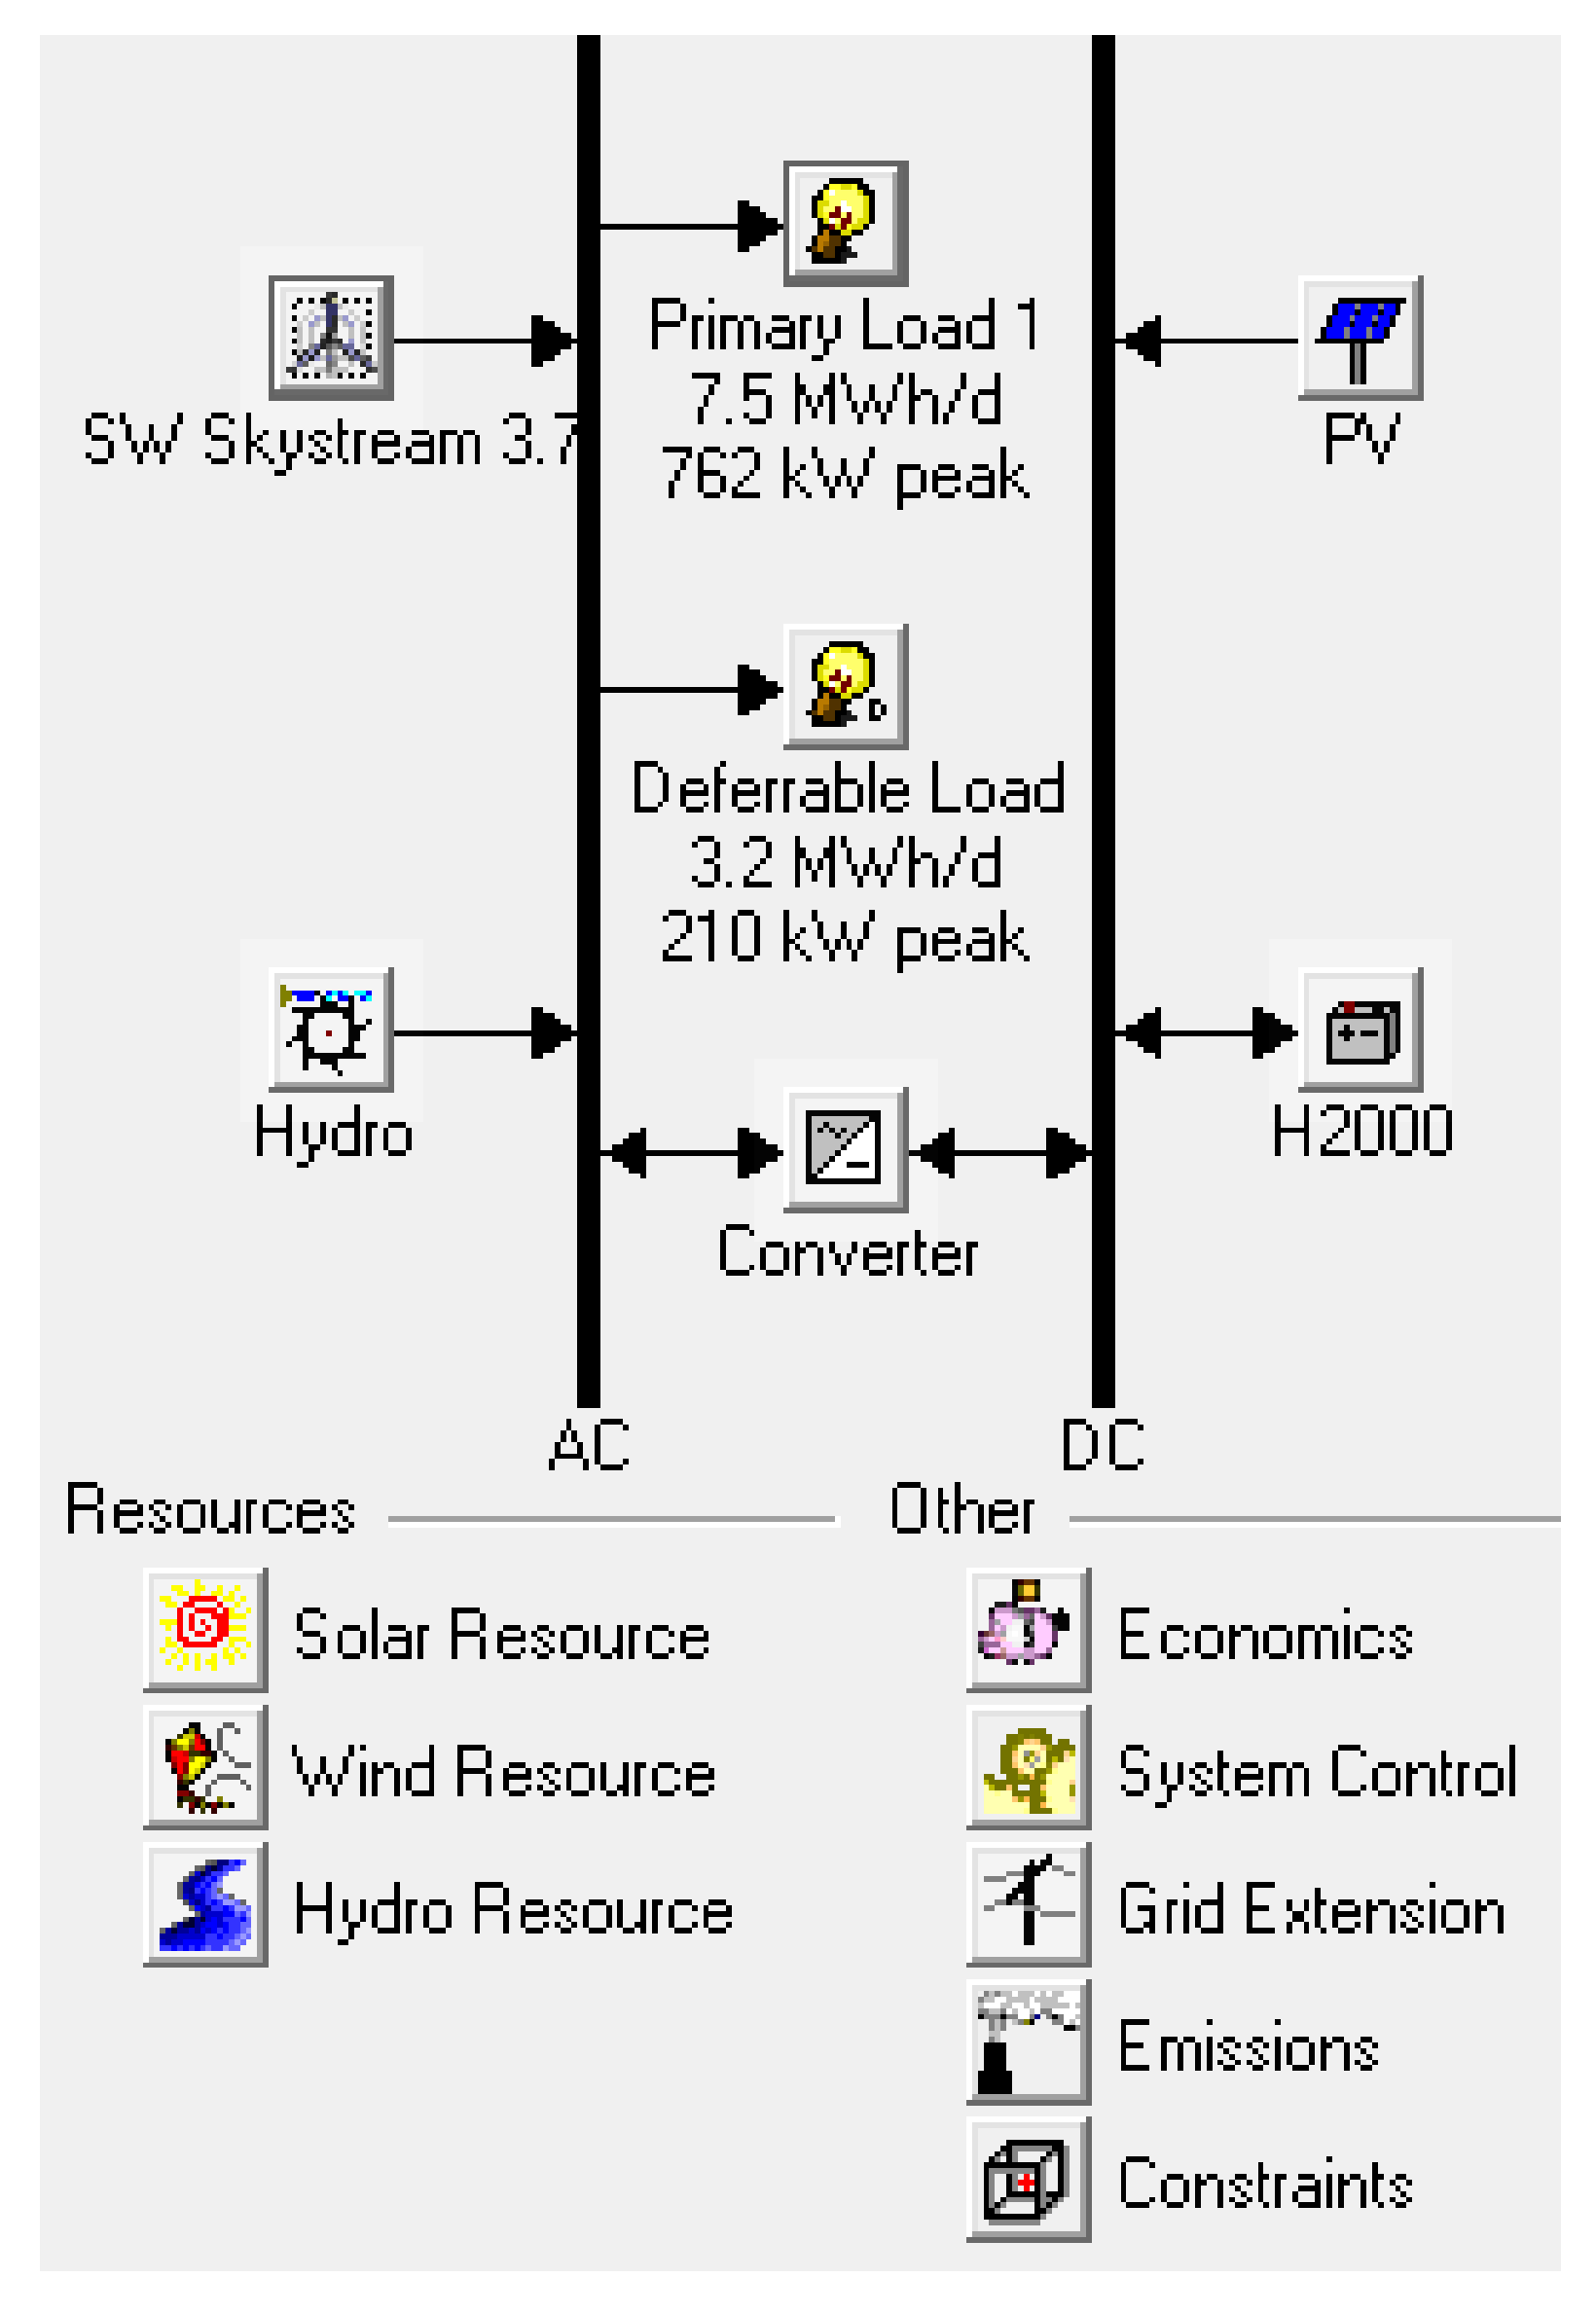
Figure 5 presented the equipment to consider and the PV/wind/micro-hydro hybrid system configuration.

Figure 5.
Equipment to consider and PV/wind/micro-hydro hybrid system configuration.
4. Results and Discussion
4.1. Results
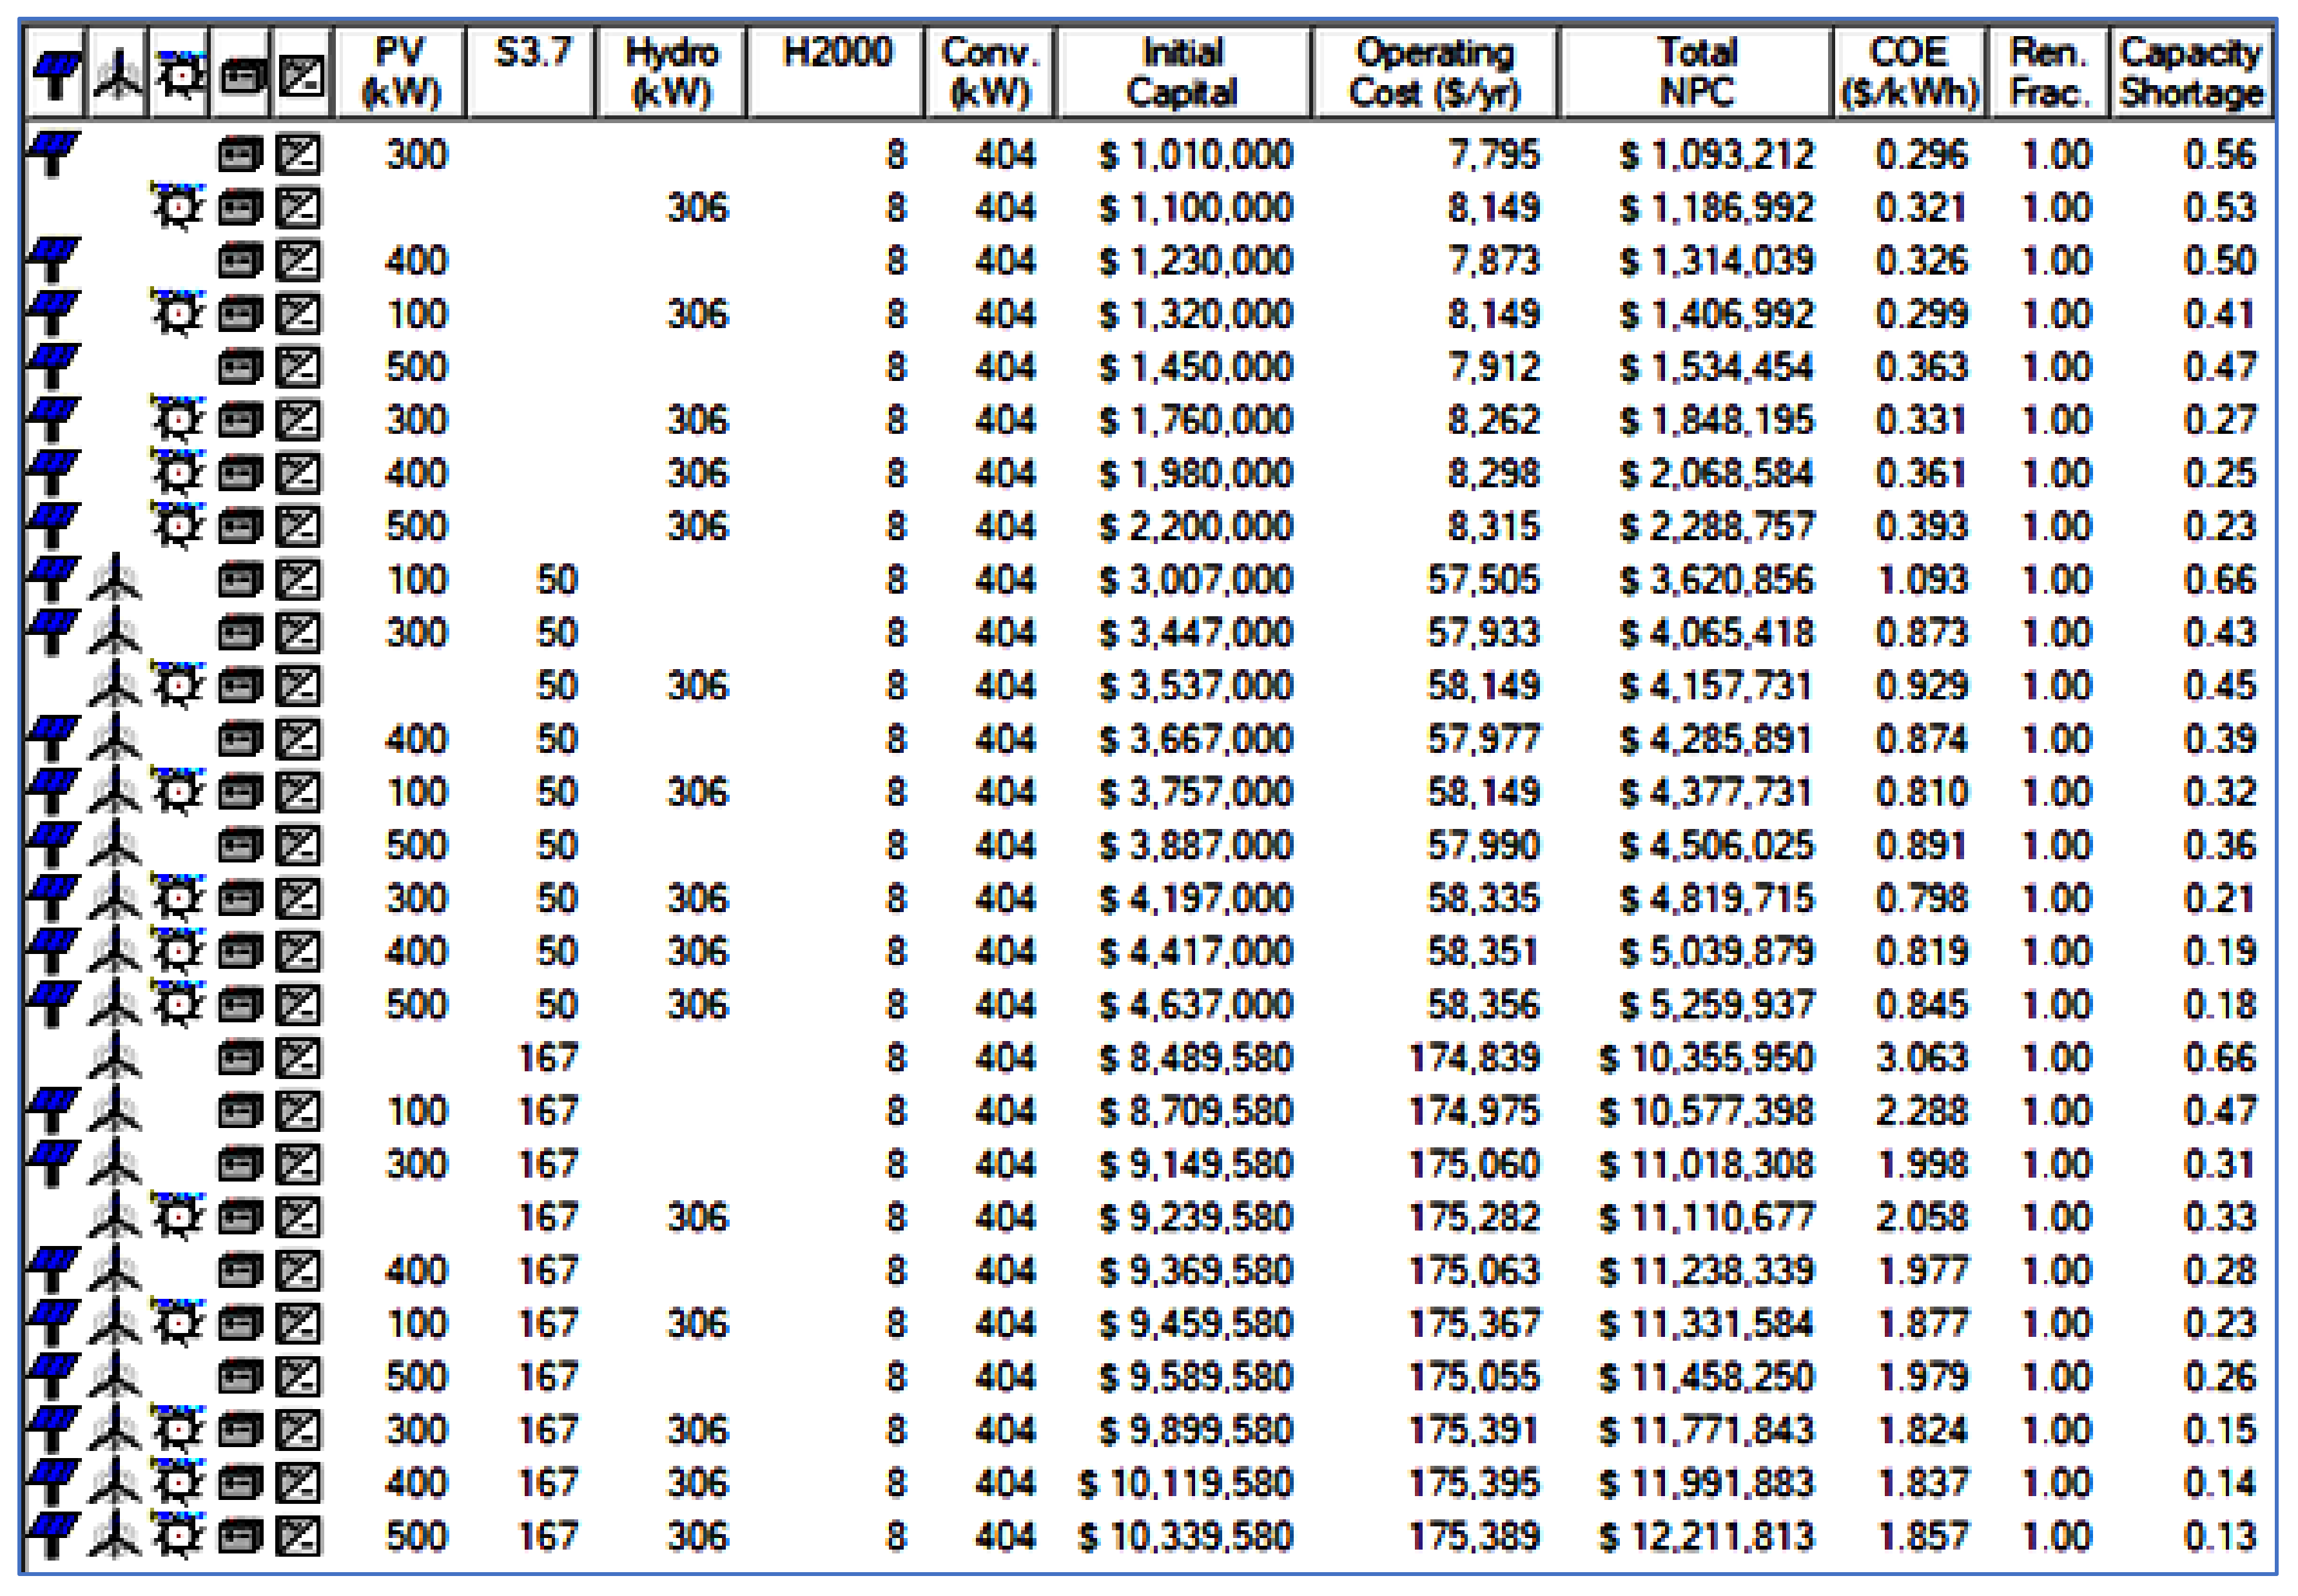
Following the simulation, HOMER generated a list of possible power sources, together with the overall net present value, starting capital cost, energy per kWh cost, overall system design, and element sizes that fit the load demand.
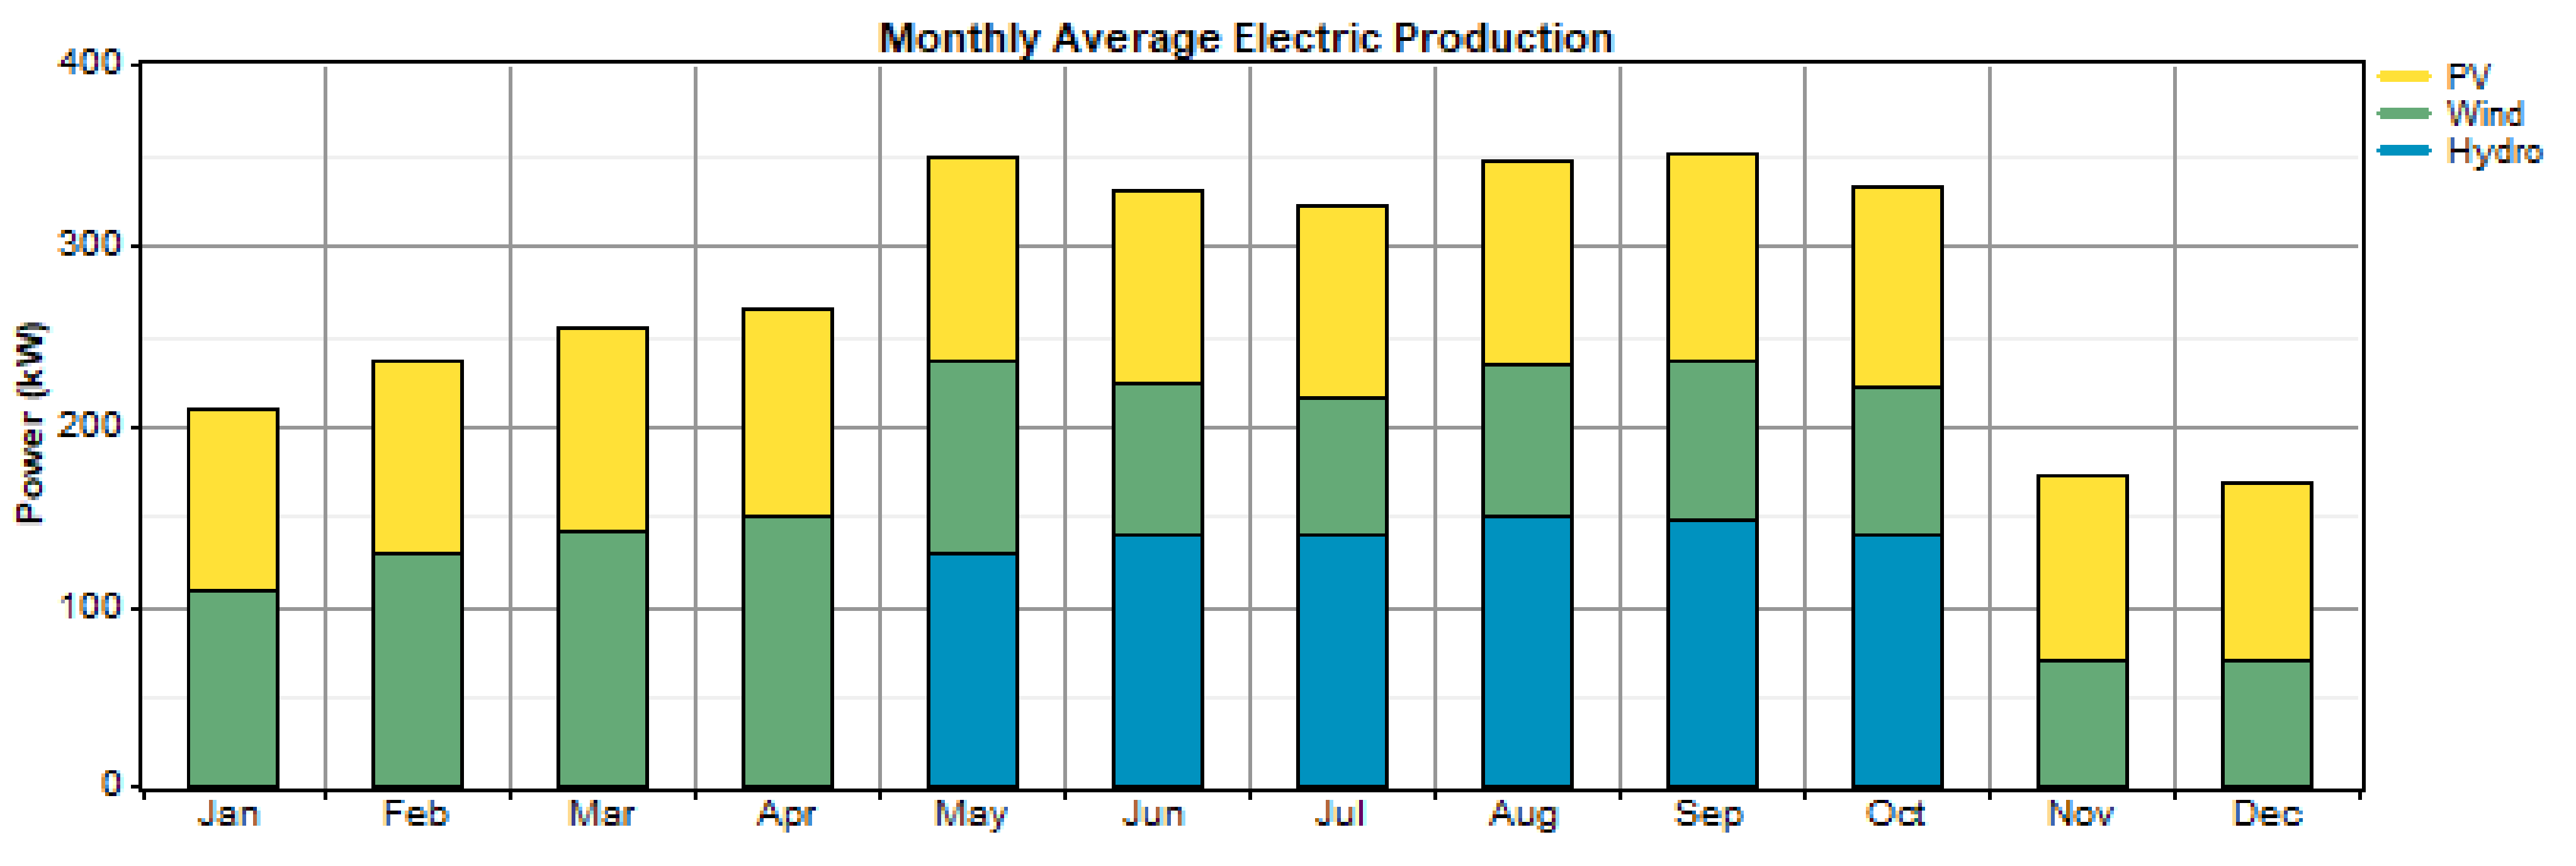
From Figure 6, the outputs of the validation of the model correspond to Scenario 13, out of 27 scenarios. This scenario was selected because the costs of energy and capacity shortage were more sensitive and optimum as compared with the other scenarios. So, all the sensitivity analyses were performed in this scenario. All of the above optimization findings for Maji town were calculated using an average wind speed of 3.6 m/s, daily radiation of 5.19 kWh/m2/day, an average flow rate of 1.6 m3/s, a wind operational reserve of 5%, and the highest allowable annual capacity shortfall of 5%. According to the above modeling, the fairest model for Maji town was a hybrid solar/battery/micro-hydro/converter with a 500 kW of solar, 18 kW × 9.28 wind turbines, 500 Hoppecke 16OPzS 2000 batteries (each 2000 Ah capacity), and a 916 kW bi-directional inverter (Figure 6, the final row). This “ideal” system used 100% renewable power, and the price of power was $0.81/kWh (a net present cost of $4,377,731), including capital depreciation and levelized operation and maintenance costs. Figure 7 shows the energy generation from various PV, wind, and micro-hydro elements of the overall main energy need (2,742,499 kWh/y). Wind turbines provided 498,380 kWh/day (18% of the total energy provided), solar PV provided approximately 37% of the total energy (1,003,250 kWh/y), and micro-hydro provided approximately 45% of the total energy (1,240,819 kWh/y) for this town. Even though there was a surplus of 2,113,023 kWh (77%) generated, there was only a capacity deficiency of 92,261 kWh (13.3%) over the year.
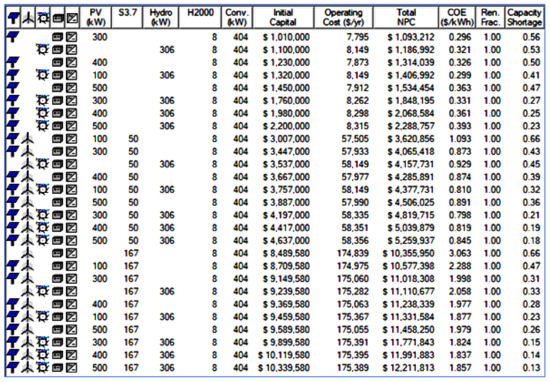
Figure 6.
Overall optimization results for the PV/wind/micro-hydro hybrid system.
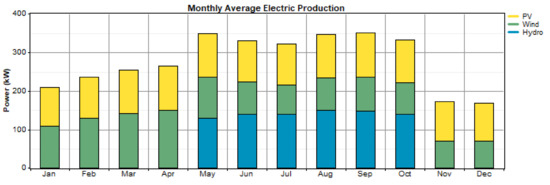
Figure 7.
Monthly average electric production of Maji town for the PV/wind/micro-hydro hybrid system.
4.2. Output of Economic Analysis
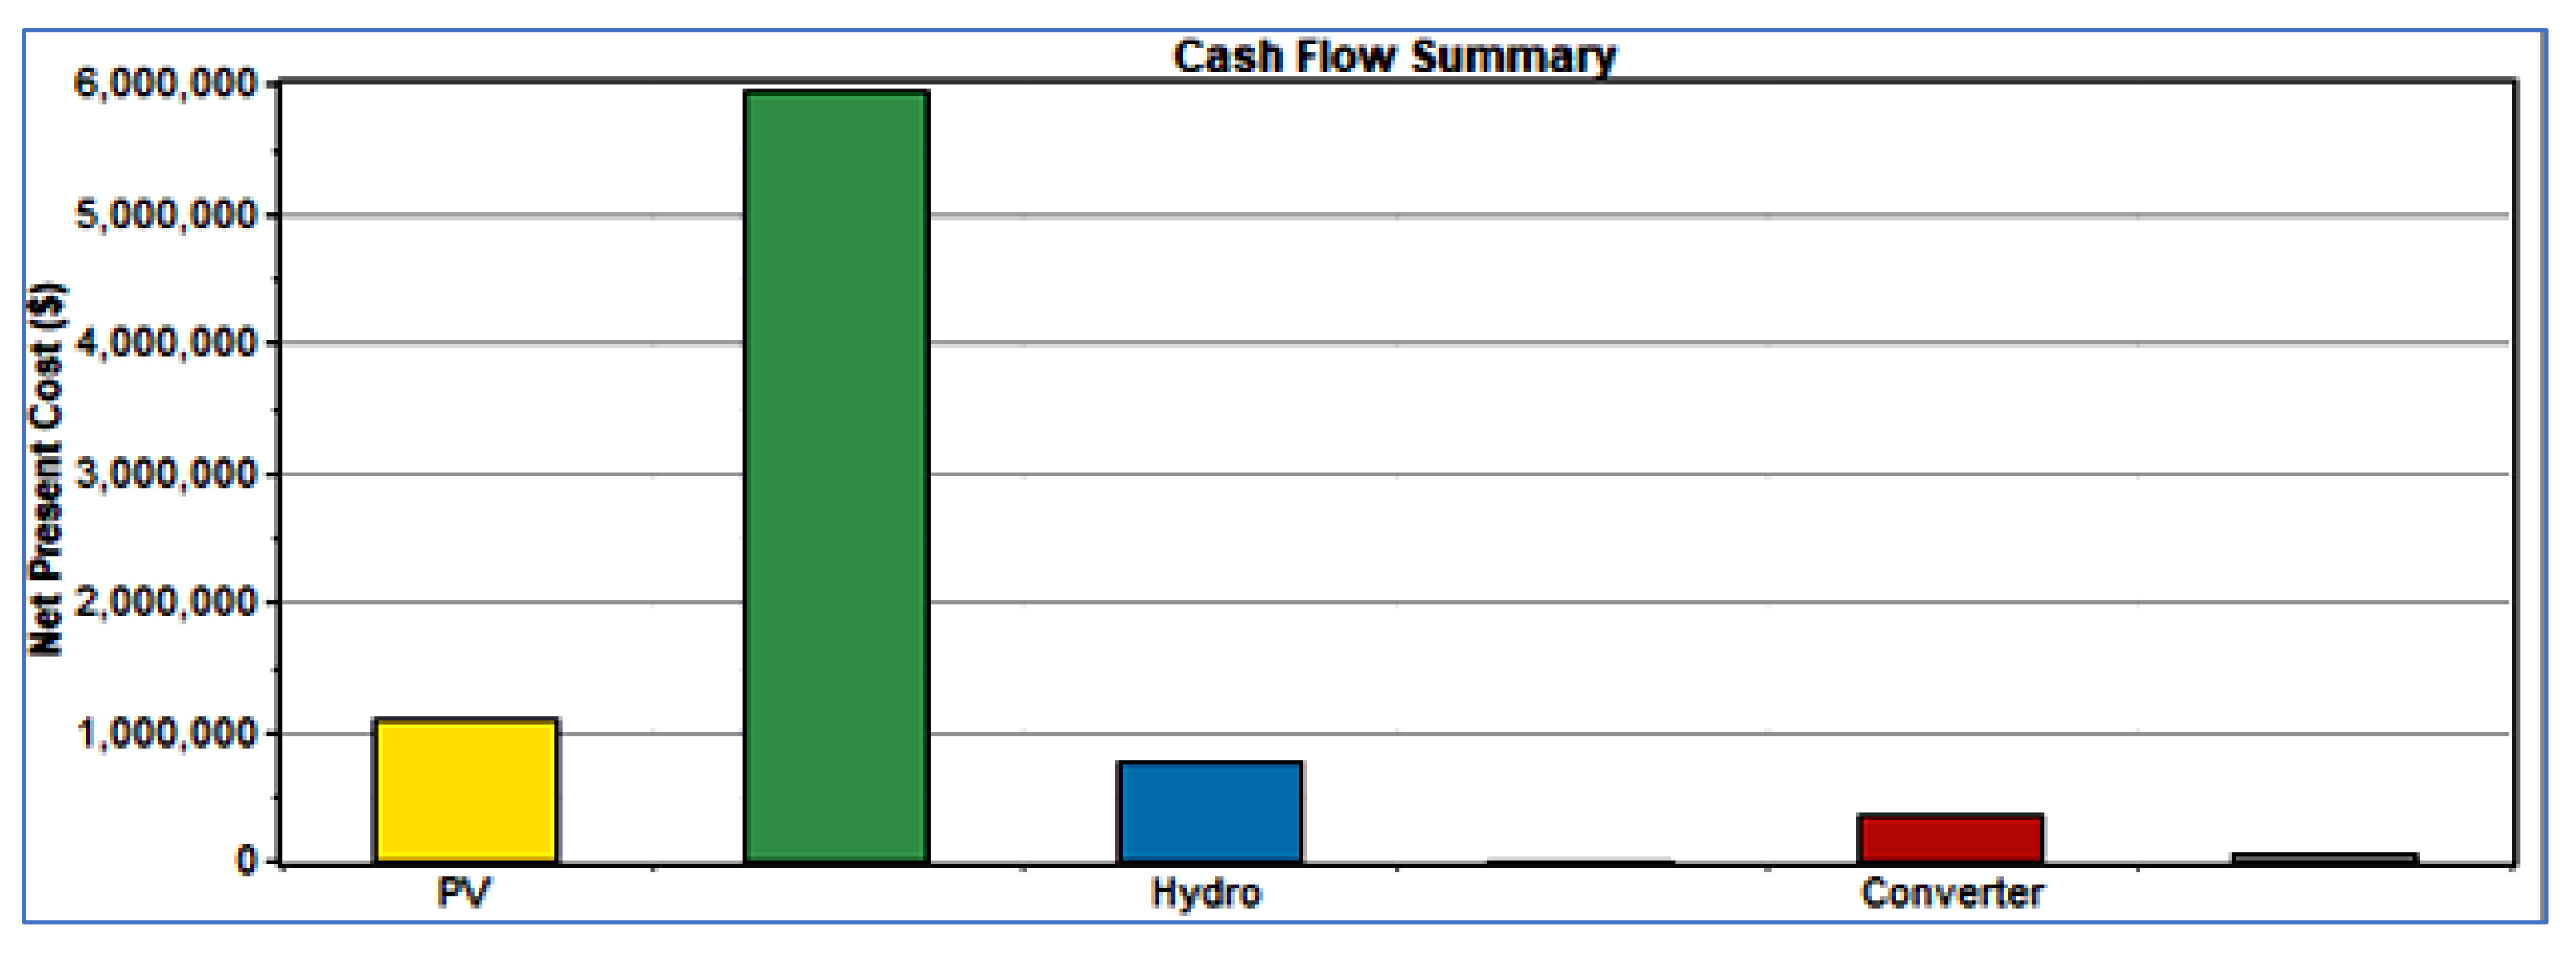
The project lifetime was taken as 25 years, and the annual real interest rate and the nominal rate as 8% and 10%, respectively. Each component had its own life time and was expected to be replaced at the end of its life time. The initial capital cost of a component is the total installed cost of that component at the beginning of the project. The levelized cost of energy (COE), net present cost, and initial cost of this town are presented in the following paragraphs. Figure 8 summarizes the economic performance of the winning system for Maji town. The capital cost accounted for the lion’s share of the total NPC, followed by replacement and O&M costs. The components incurring the largest cost were the wind turbine and battery bank, followed by the PV modules and converter. This is expressed graphically in Figure 8.

Figure 8.
Cash flow summery for the system.
Figure 8 presents the cash flow summery for the system.
From Figure 8 above cash flow summary graph the net present cost of wind farm (green color) is more costly than that of PV (yellow color), micro-hydro (blue color) and converter (red color) but the cost of battery is lower than the remaining system components.
The COE for the optimal PV, wind, or micro-hydro system is $0.810/kWh, and the overall annual cost of labor needed to pay should be $14,525, or 435,750 ETB. The economic performance of the hybrid stand-alone system for Maji town is shown in Table 9.
Table 9.
Economic indicators.
4.3. Sensitivity Results
A viable network is a hybrid model that satisfies the demand requirements. The program filters out all infeasible systems and displays the results in increasing NPC order.
Comparative Analysis of the Cost of Standalone System and Grid Extension
The distance from the grid at which the grid has expanded has the same NPC as an off-grid system. The off-grid solution is best when it is far away from the grid. Grid expansion is best when it is close to the grid. The unit cost of a 132 kV single-circuit transmission line using optical fiber ground wire (OPGW) is $125,000 per kilometer. The transmission’s operational and maintenance costs are 2% of the initial cost, or around $2500 per kilometer each year. Table 10 shows the cost of extending the grid in Maji town.
Table 10.
Grid extension cost for Maji town.
The total capital cost of the grid extension is $22,185,000 from Mizan Aman substation to Maji, while the total cost for the construction of a standalone hybrid system, including staff salary costs, is $4,392,256.
For lengths longer than 16.5 km, the solar/wind/micro-hydro hybrid power supply solutions outperformed the grid extension, with an energy cost of 0.81 $/kWh. As a result, the cost of grid extension was greater than the cost of a hybrid solution. In comparison with the others, the PV/wind/micro-hydro hybrid energy system was judged to be the most cost-effective, with a total net present cost of $4,377,731 and the lowest levelized cost of energy of $0.81/kWh.
4.4. MATLAB/Simulink Validation
The obtained results are validated with the MATLAB Simulink model. Figure 9 presents the overall system in MATLAB/Simulink. Figure 10 presents the MATLAB simulation output of the inverter from a solar panel. Figure 11 presents the MATLAB simulation output of wind, and Figure 12 presents the MATLAB simulation output of micro-hydropower.
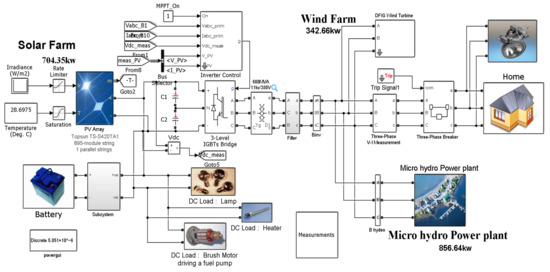
Figure 9.
General block diagram of the overall system.
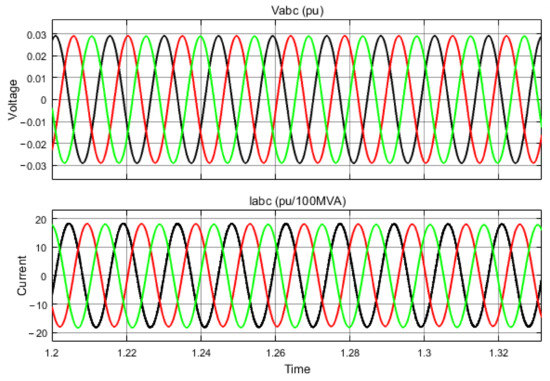
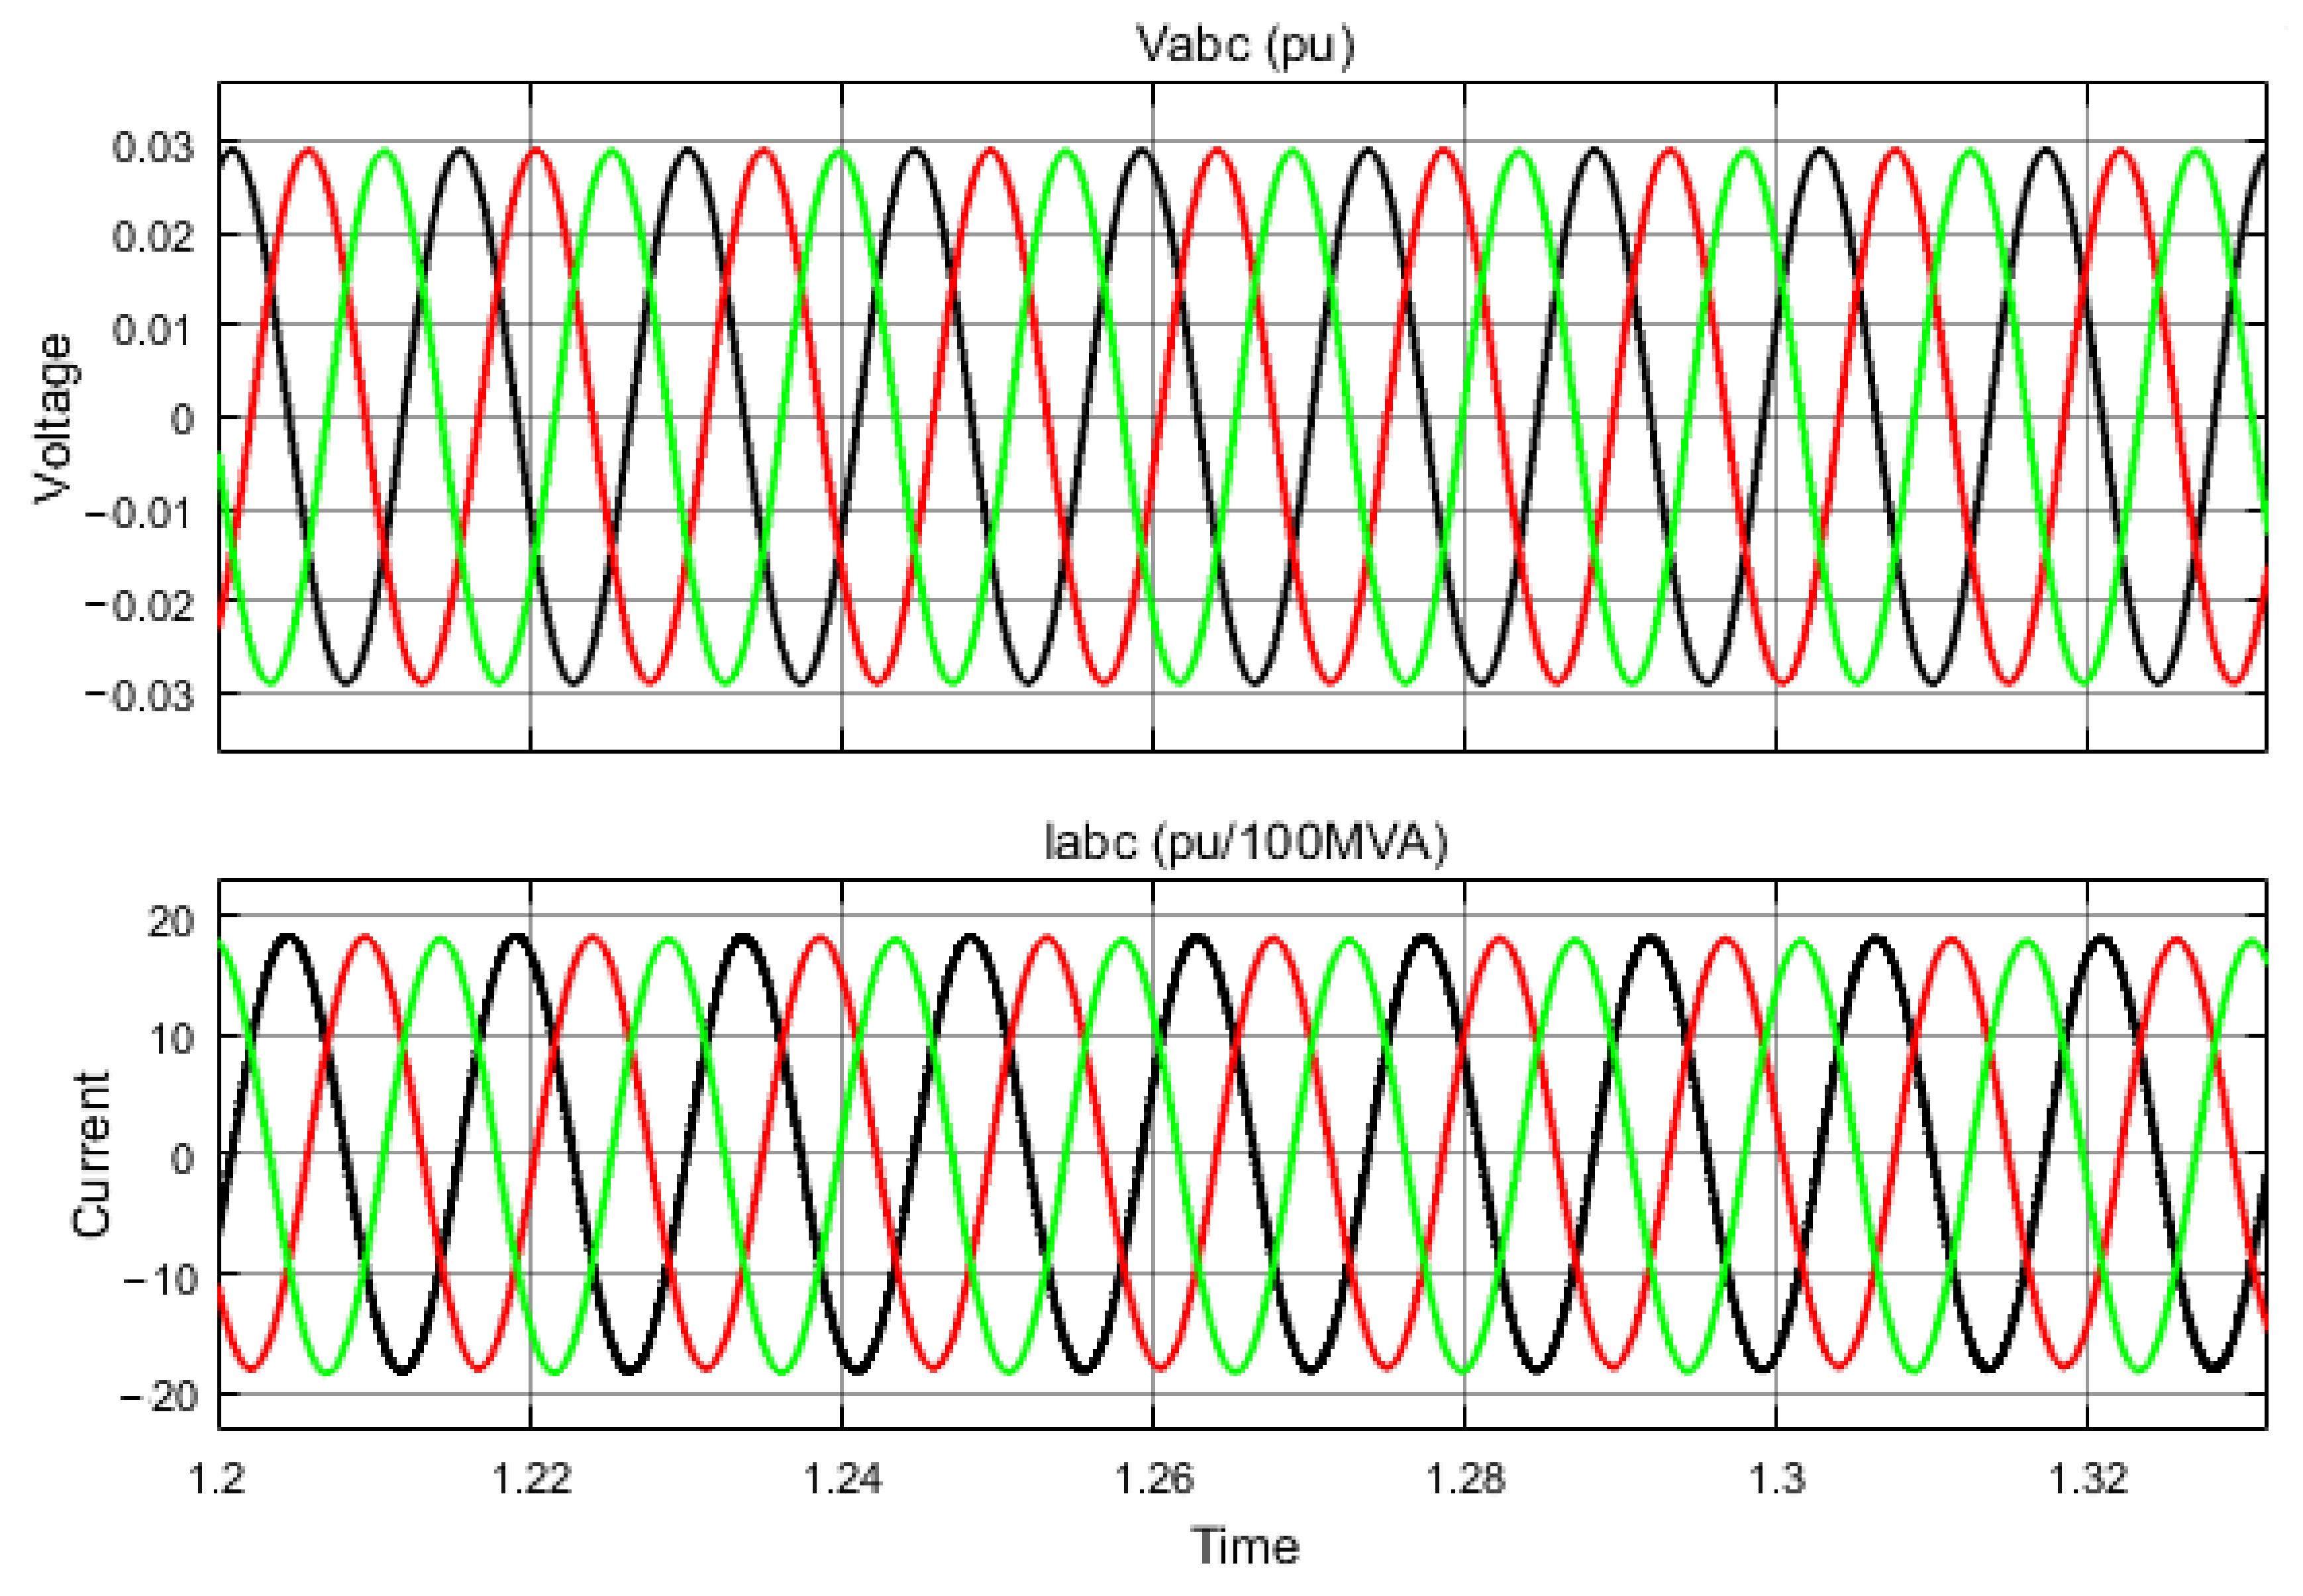
Figure 10.
Output of the inverter from a solar panel.
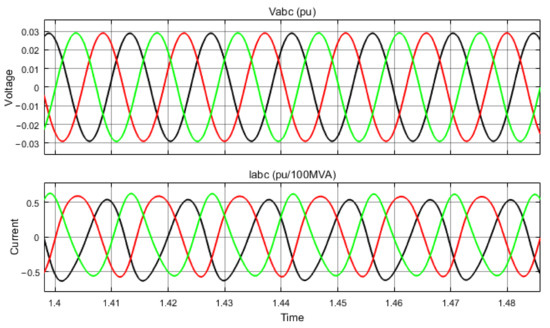
Figure 11.
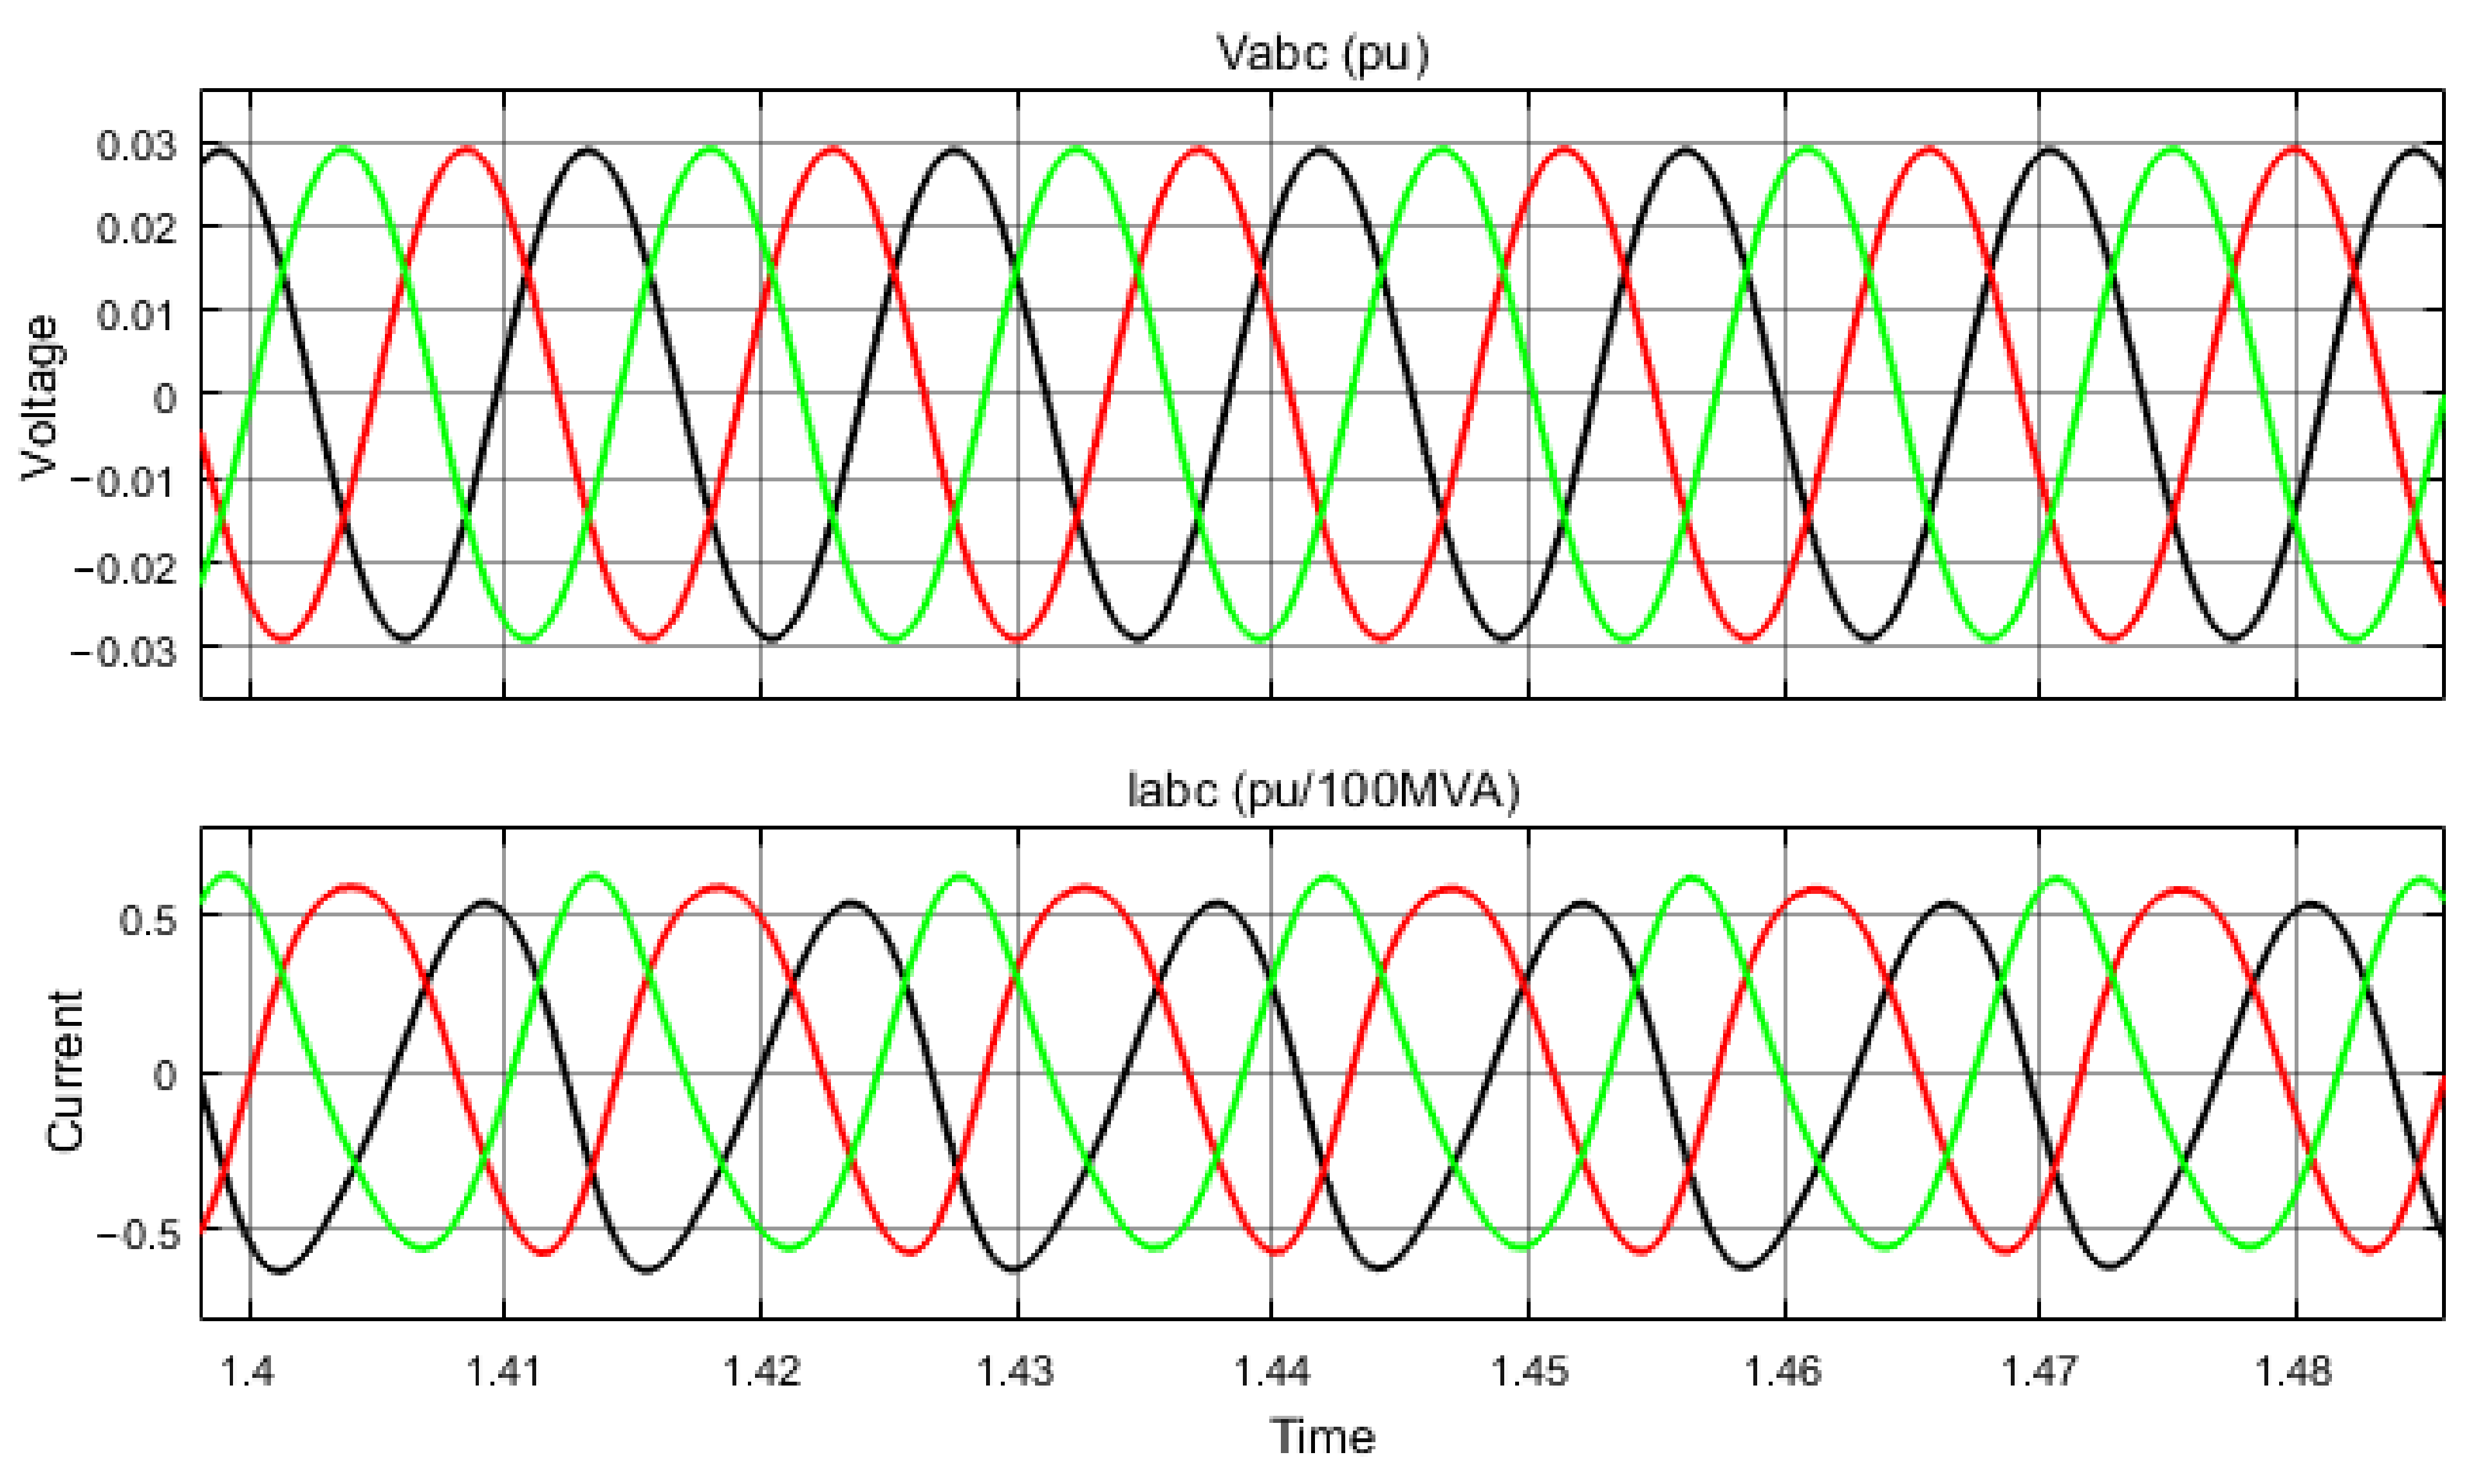
Output of wind.
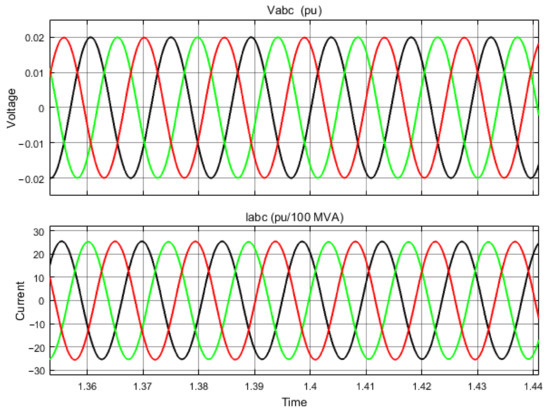
Figure 12.
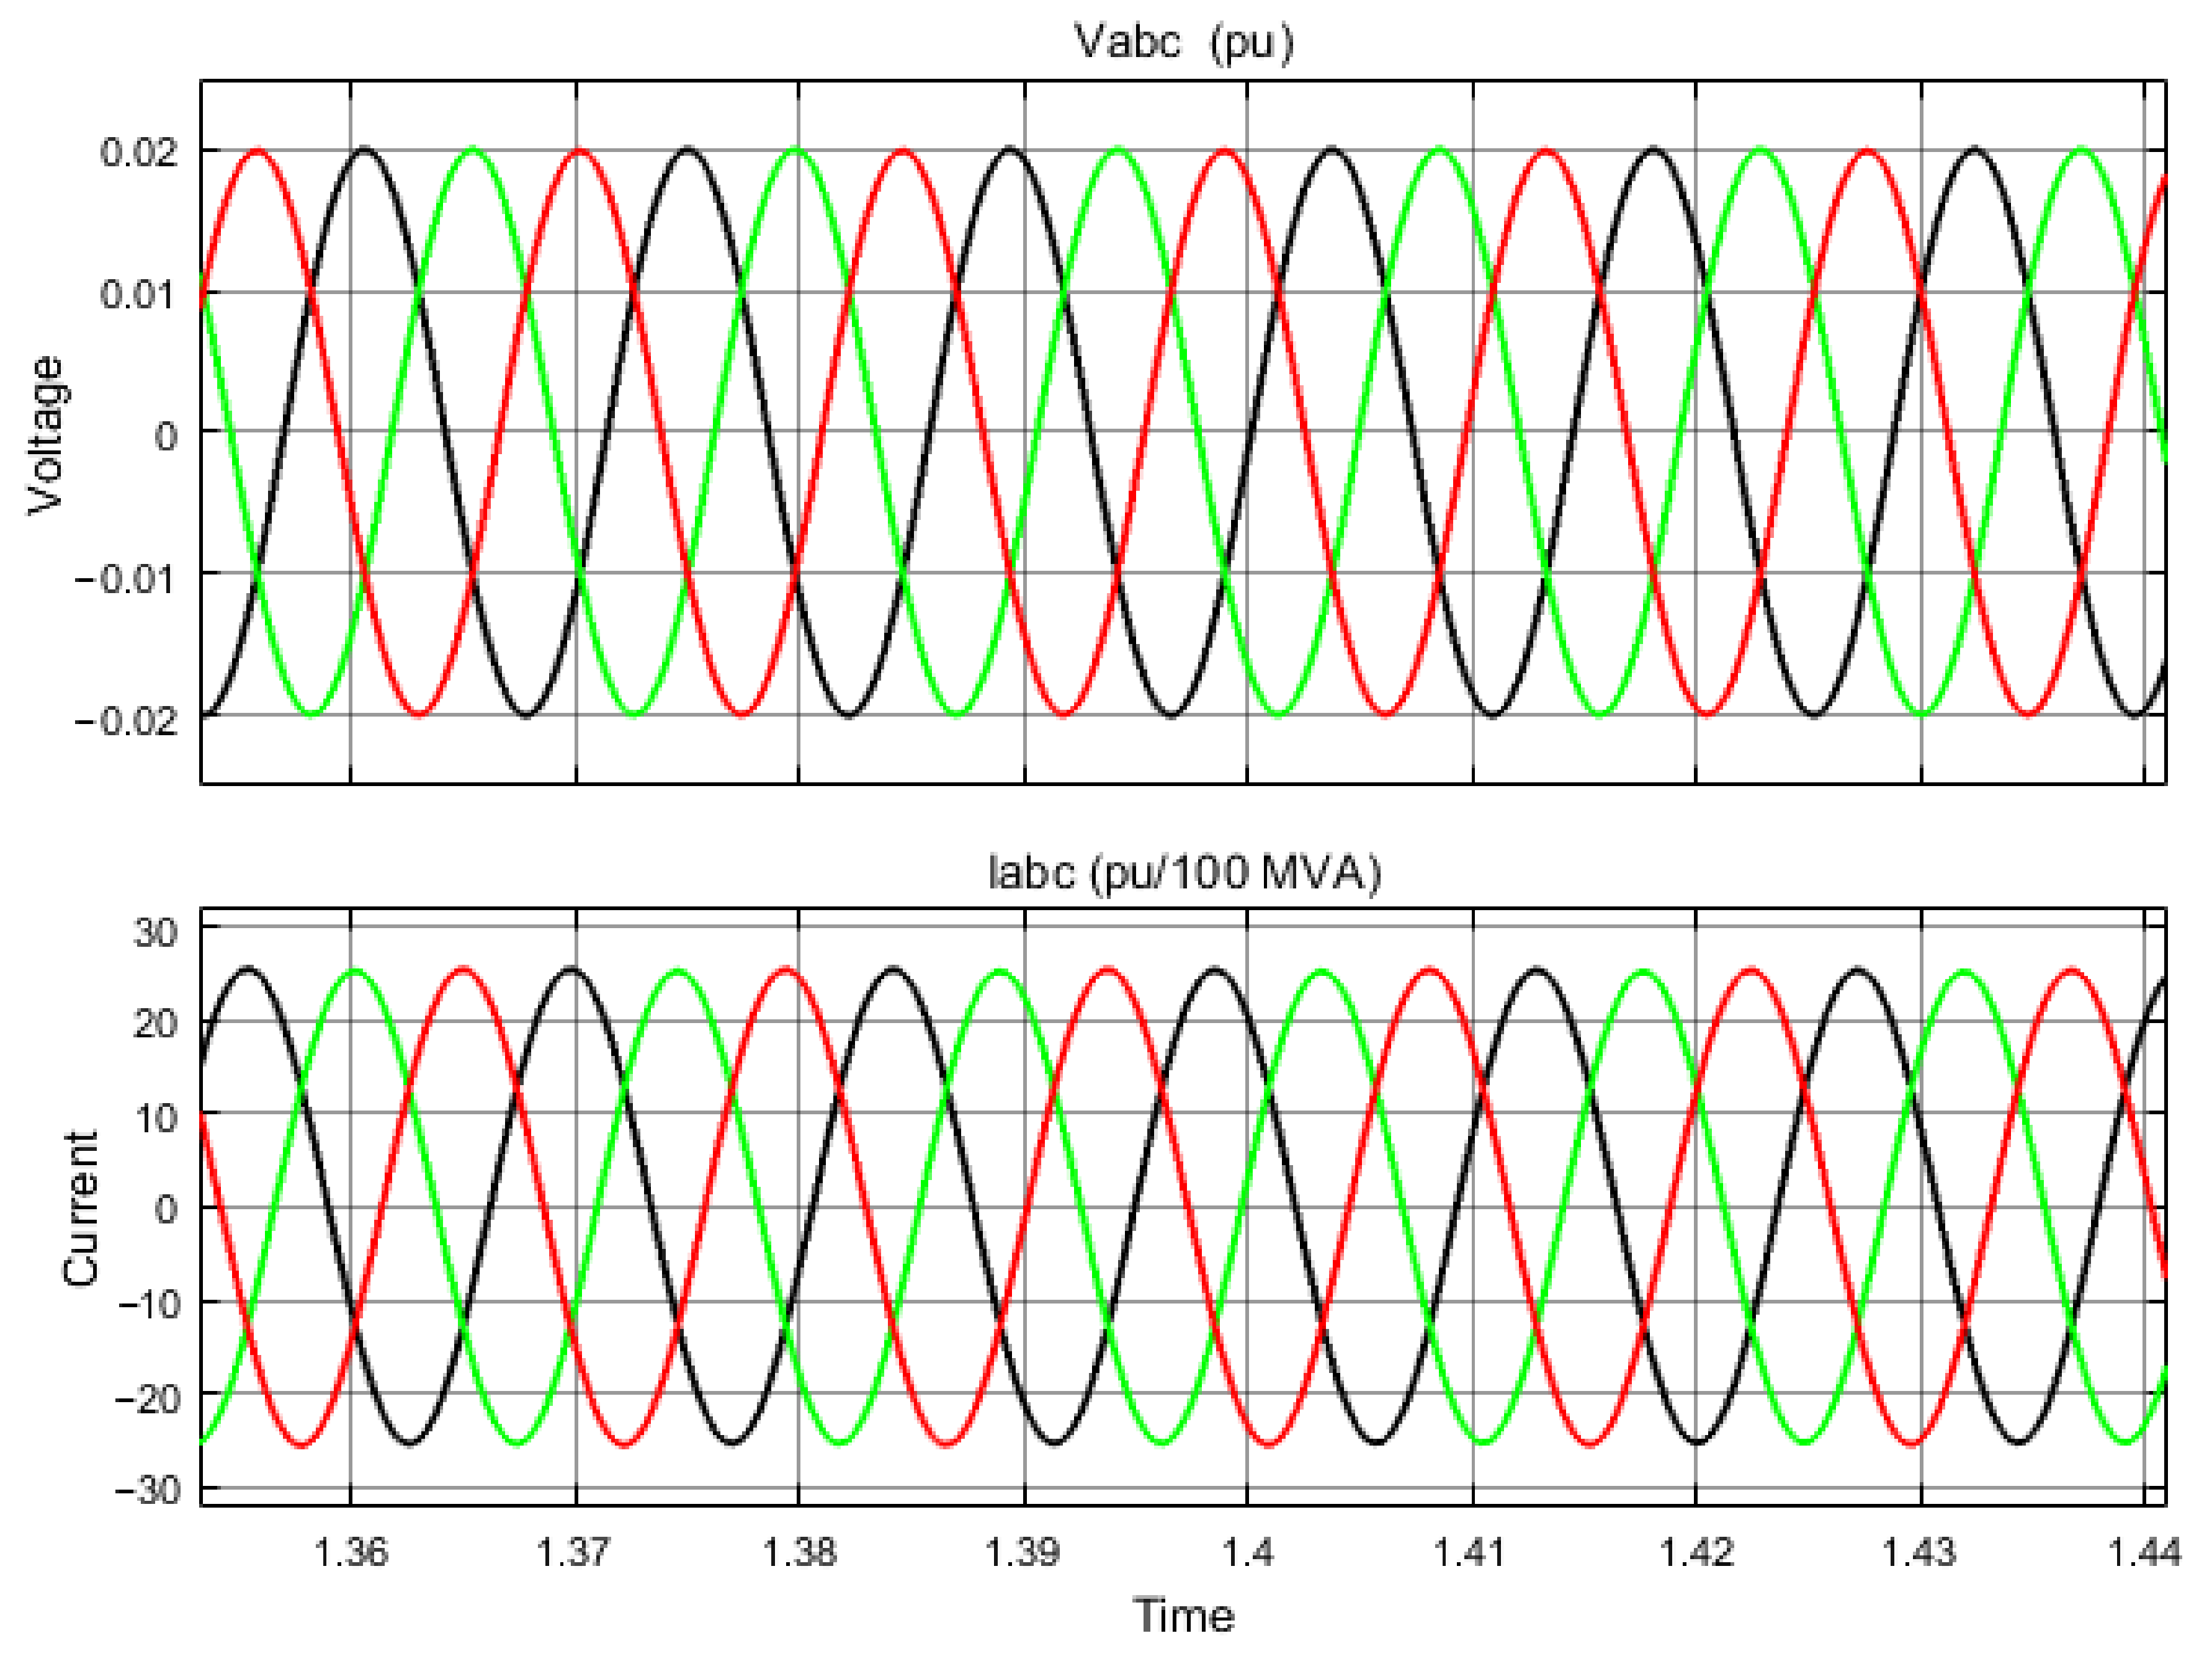
Output of micro-hydropower.
4.5. Simulation Results and Discussion
In Figure 10 for solar power generation, the irradiance of the surface is 1000w/m2 and the average solar radiation in the least sunny month is 5.19kWh/m2/day for the case study areas, and the illuminance is 683,060.11 lux or 683,060 lm/m2. In Figure 11 for wind power generation, the average wind speed in the least windy season at a 10 m tower height is 3.6 m/s and at 50 m tower height is 4.44 m/s, which is sufficient to produce power as the minimum wind speed required to start to produce power is 3.5 m/s. Finally, in Figure 12, the flow rate of micro-hydro power is 1.6 m3/s. The simulation result of the designed standalone system is presented in the following figures.
Figure 10 shows the output of a solar panel inverter, which is used to convert DC electrical sources to AC sources by regulating the voltage, current, and frequency as required by the designer. The input to inverters is always DC sources, so these zero-frequency DC sources are converted to sinusoidal AC sources, which are the most commonly used power sources in residential and industrial applications. The inverters are designed for a specific purpose in order to perform the desired application. As it is derived from the mathematical calculations of the inverter, with a power rating of 916 kW, three-phase AC inverters should be used. So, from Figure 10, the output of a solar panel using an inverter is purely sinusoidal and can easily be used for home appliances.
The output of the three different colors (black, green and red) shows the three-phase output voltage and current waveforms produced from inverter of the solar array. They are in-phase with each other having the same magnitude.
Figure 11 shows the output voltage and current generated by wind. The output of the wind generator is AC power, which means that wind speed or aerodynamic lift force turns on the wind turbine, which produces mechanical power, and the mechanical power (torque and angular speed) of the wind turbine drives the doubly fed induction generator (DFIG) as a result of an AC sinusoidal wave form being produced, which has an identical output in the magnitude of voltage, phase angle, and frequency for synchronization purposes. So, DFIG produces a three-phase 50 Hz AC output, and the transformer steps down the voltage to 400 V for residential applications. The current waveform is unbalanced. This is due to the random variation of wind speed throughout the whole time. As the unbalance is much more difficult, it does not have any effect on system synchronization or equipment damage.
The output of the three different colors (black, green and red) shows the three-phase output voltage and current waveforms produced from inverter of the wind and also shows how rotating magnetic field if produced using based of Faradays law. They are in-phase with each other having the same magnitude.
Figure 12 shows the output voltage and current of the micro-hydro power plant for the Tum River. In hydropower plants, the falling water hits the turbine blade, which converts hydraulic energy into mechanical energy, and the turbine drives the alternator, which converts mechanical energy into electrical energy. This electrical energy is mostly from AC sources as most of the alternators available for generation stations are AC generators. So, as shown in Figure 12, the output is a sinusoidal wave shape, which indicates that the output generated from hydropower is purely a sinusoidal AC source.
From Figure 12 the output of three different colors (black, green and red) which shows the three-phase output voltage and current waveforms produced from inverter of the wind and also describes how rotating magnetic field if produced using based of Faradays law. They are in-phase with each other having the same magnitude.
4.6. Practical System versus Ideal System
The distinction between the fairest/practical system and the ideal system is that in the practical application of renewable energy resources for rural electrification, the proposed project is determined by investigating the feasibility study technically and economically. Furthermore, by collecting the necessary data for the analysis system, like solar irradiation, wind speed, and hydro data like flow rate and mean head, the system can be easily implemented for the selected case study. The proposed standalone system is highly efficient and robust due to the hybridization of the solar, wind, and micro-hydro systems. For example, as these three renewable energy resources exist at different times of the year, solar power is more powerful, while micro-hydro is low, and in the summer season, micro-hydro and wind power are more powerful during the summer season and compensate for the power shortage covered by the PV farm. Generally, before implementing these renewable energy resources, there should be a detailed renewable energy analysis in terms of availability, feasibility, and sustainability. There is no ideal implementation of such a standalone system without a feasibility analysis.
5. Conclusions
The main aim of this work is to develop a feasible system that provides electricity for Maji town, located in Ethiopia, by harnessing power from different renewable energy resources. The MATLAB and HOMER simulation software programs are used for the design and optimization of the prosed system. The findings of the HOMER model show that a hybrid (wind/solar/micro hydro) system will be able to provide power to Maji town’s demand at significantly lower costs compared to the grid extension cost. According to the simulation results, the best combination for supplying energy to Maji town is a hybrid solar/wind/micro-hydro system.
The proposed solar/wind/micro-hydro system uses 100% renewable energy and the price of power is $0.81/kWh (a net present cost of $4,377,731), incorporating capital depreciation and levelized O&M. During the project’s lifetime, the cost of a grid extension power supply ($22.19 million) is nearly $17,808,000 more than the cost of a designed standalone system ($4,377,731). For lengths longer than 16.5 km, solar/wind/micro-hydro hybrid solutions outperform grid expansion, with an energy cost of 0.81 cents/kWh. According to this article, expanding the national utility grid to Maji town is more expensive than establishing a solar/wind/micro-hydro standalone hybrid. Furthermore, the HOMER software results are validated by using the MATLAB/Simulink model. The selected area (Maji Town) has good renewable energy potential, so the project should be practically implemented to electrify the area.
Author Contributions
Conceptualization, E.S.B. and B.K.; methodology, E.S.B.; software, E.S.B.; validation, E.S.B., B.K., I.G.H., and O.P.M.; formal analysis, B.K.; investigation, B.K.; resources, B.K.; data curation, E.S.B.; writing—original draft preparation, E.S.B. and B.K.; writing—review and editing, B.K., O.P.M., and J.M.G. All authors have read and agreed to the published version of the manuscript.
Funding
There is no funding available for this research.
Institutional Review Board Statement
Not applicable.
Informed Consent Statement
Not applicable.
Data Availability Statement
Data will be available upon request.
Conflicts of Interest
The authors declare no conflict of interest.
Abbreviations
| AC | Alternating current |
| Ah | Ampere hour |
| COE | Cost of energy |
| CP | Power coefficient |
| CROM | Center for Research on Microgrids |
| D | Rotor diameter |
| DC | Direct current |
| DFIG | Doubly fed induction generator |
| HOMER | Hybrid optimization model for energy renewables |
| ILSFA | Illinois Solar for All |
| kWh | Kilo watt hour |
| MPPT | Maximum power point tracker |
| NPC | Net present cost |
| NREL | National Renewable Energy laboratory |
| ° | Degree |
| O&M | Operation and maintenance |
| OPGW | Optical fiber ground wire |
| Probability density function | |
| PGF | Panel generation factor |
| PV | Photovoltaic |
| SNNPRs | South nation, nationality, and peoples regional state |
| USD | United States Dollar |
| WP | Watt peak |
References
- An, W.; Zhang, Y.; Pang, B.; Wu, J. Synergistic design of an integrated pv/distillation solar system based on nanofluid spectral splitting technique. AIMS Energy 2021, 9, 534–557. [Google Scholar] [CrossRef]
- Rashid, F.; Hoque, M.E.; Aziz, M.; Sakib, T.N.; Islam, M.T.; Robin, R.M. Investigation of Optimal Hybrid Energy Systems Using Available Energy Sources in a Rural Area of Bangladesh. Energies 2021, 14, 5794. [Google Scholar] [CrossRef]
- Thankan, C.; Winters, A.; Jo, J.H.; Aldeman, M. Feasibility of applying Illinois Solar for All (ILSFA) to the Bloomington Normal Water Reclamation District. AIMS Energy 2021, 9, 117–137. [Google Scholar] [CrossRef]
- Drake, F.; Mulugetta, Y. Assessment of solar and wind energy in Ethiopia. I. Solar energy. Sol. Energy 1996, 57, 205–217. [Google Scholar] [CrossRef]
- Mulugeta, Y.; Drake, F. Assessment of solar and wind energy resources in Ethiopia: II. Wind energy. Sol. Energy 1996, 57, 323–334. [Google Scholar] [CrossRef]
- Japanese Embassy in Ethiopia. Study on the Energy Sector in Ethiopia. 2008. Available online: http://www.et.emb-japan.go.jp/electric_report_english.pdf (accessed on 15 January 2021).
- Bekele, G.; Palm, B. Wind energy potential assessment at four typical locations in Ethiopia. Appl. Energy 2009, 86, 388–396. [Google Scholar] [CrossRef]
- Yeshalem, M.T.; Khan, B. Design of an off-grid hybrid PV/wind power system for remote mobile base station: A case study. AIMS Energy 2017, 5, 96–112. [Google Scholar] [CrossRef]
- Djelailia, O.; Kelaiaia, M.S.; Labar, H.; Necaibia, S.; Merad, F. Energy hybridization photovoltaic/diesel generator/pump storage hydroelectric management based on online optimal fuel consumption per kWh. Sustain. Cities Soc. 2019, 44, 1–15. [Google Scholar] [CrossRef]
- Castillo-Calzadilla, T.; Macarulla, A.M.; Kamara-Esteban, O.; Borges, C.E. A case study comparison between photovoltaic and fossil generation based on direct current hybrid microgrids to power a service building. J. Clean. Prod. 2020, 244, 118870. [Google Scholar] [CrossRef]
- Cuesta, M.A.; Castillo-Calzadilla, T.; Borges, C.E. A critical analysis on hybrid renewable energy modeling tools: An emerging opportunity to include social indicators to optimise systems in small communities. Renew. Sustain. Energy Rev. 2020, 122, 109691. [Google Scholar] [CrossRef]
- Prakash, R.; Singh, R.K.; Pullagura, G.; Murugan, S. Effect of Hydrogen. 2011. Available online: http://dspace.nitrkl.ac.in/dspace/bitstream/2080/1539/1/Effect%20of%20Hydrogen (accessed on 15 January 2021).
- Bekele, G.; Palm, B. Feasibility study for a standalone solar-wind-based hybrid energy system for application in Ethiopia. Appl. Energy 2010, 87, 487–495. [Google Scholar] [CrossRef]
- Gebrehiwot, K.; Mondal, M.A.H.; Ringler, C.; Gebremeskel, A.G. Optimization and cost-benefit assessment of hybrid power systems for off-grid rural electrification in Ethiopia. Energy 2019, 177, 234–246. [Google Scholar] [CrossRef]
- Malamaki, K.-N.D.; Demoulias, C.S. Analytical Calculation of the Electrical Energy Losses on Fixed-Mounted PV Plants. IEEE Trans. Sustain. Energy 2014, 5, 1080. [Google Scholar] [CrossRef]
- Duffie, J.A.; Beckman, W.A. Solar Engineering of Thermal Processes, 3rd ed.; Wiley: New York, NY, USA, 1991. [Google Scholar]
- Aldo, V. Fundamentals of Renewable Energy Processes; Elsevier Inc.: Amsterdam, The Netherlands, 2005. [Google Scholar]
- Patil, M.R. Wind and Solar Power Systems; CRC Press LLC: Boca Raton, FL, USA, 1999. [Google Scholar]
- Twidell, J.; Weir, T. Renewable Energy Resources, 2nd ed.; Taylor &Francis: London, UK, 2006. [Google Scholar]
- Guidelines for Electrical Designs of SHP Plants Including Switchyard; Alternate Hydro Energy Centre Indian Institute of Technology: Roorkee, India, 2012. Available online: https://www.iitr.ac.in/departments/HRE/uploads/standards_pdf/3.3_Design_of_switchyard.pdf (accessed on 16 January 2021).
- Mockmore, C.A.; Merryfield, F. The Banki Water Turbine; Bulletin Series No. 25; Oregon State College: Corvallis, OR, USA, 1949. [Google Scholar]
- Liu, G.; Rasul, M.G.; Amanullah, M.T.O.; Khan, M.M.K. Techno-economic simulation and optimization of residential grid-connected PV system for the Queensland climate. Renew. Energy 2012, 45, 146–155. [Google Scholar]


Publisher’s Note: MDPI stays neutral with regard to jurisdictional claims in published maps and institutional affiliations. |
© 2022 by the authors. Licensee MDPI, Basel, Switzerland. This article is an open access article distributed under the terms and conditions of the Creative Commons Attribution (CC BY) license (https://creativecommons.org/licenses/by/4.0/).