Article

Distance to M87 as the Mode of the Modulus Distribution

by
Mariusz Tarnopolski
Institute of Astronomy, Faculty of Physics, Astronomy and Informatics, Nicolaus Copernicus University, ul. Grudziądzka 5, PL-87-100 Toruń, Poland
Astronomy 2025, 4(2), 6; https://doi.org/10.3390/astronomy4020006
Submission received: 28 January 2025 / Revised: 14 March 2025 / Accepted: 31 March 2025 / Published: 2 April 2025

Abstract

:
de Grijs and Bono (ApJS 2020, 246, 3) compiled a list of distances to M87 from the literature published in the last 100 years. They reported the arithmetic mean of the three most stable tracers (Cepheids, tip of the red giant branch, and surface brightness fluctuations). The arithmetic mean is one of the measures of central tendency of a distribution; others are the median and mode. The three do not align for asymmetric distributions, which is the case for the distance moduli μ 0 to M87. I construct a kernel density distribution of the set of μ 0 and estimate the recommended distance to M87 as its mode, obtaining μ 0 = 31.06 ± 0.001 ( statistical ) 0.06 + 0.04 ( systematic ) mag, corresponding to D = 16.29 0.45 + 0.30 Mpc, which yields uncertainties smaller than those associated with the mean and median.

1. Introduction

de Grijs and Bono [1] compiled a list of more than 200 distance moduli μ 0 (absorption-corrected) to M87 from the literature published in the last 100 years. They categorized them into 15 groups based on the employed tracers and employed the five they established to be internally consistent: period–luminosity relation for Cepheids, planetary nebulae luminosity function (PNLF), surface brightness fluctuation (SBF), the tip of the red giant branch (TRGB) magnitude, and novae. Fundamentally, all of these techniques rely on calibrating a given type of astronomical sources or phenomena as standard candles owing to some of their properties being universal across cosmic time:
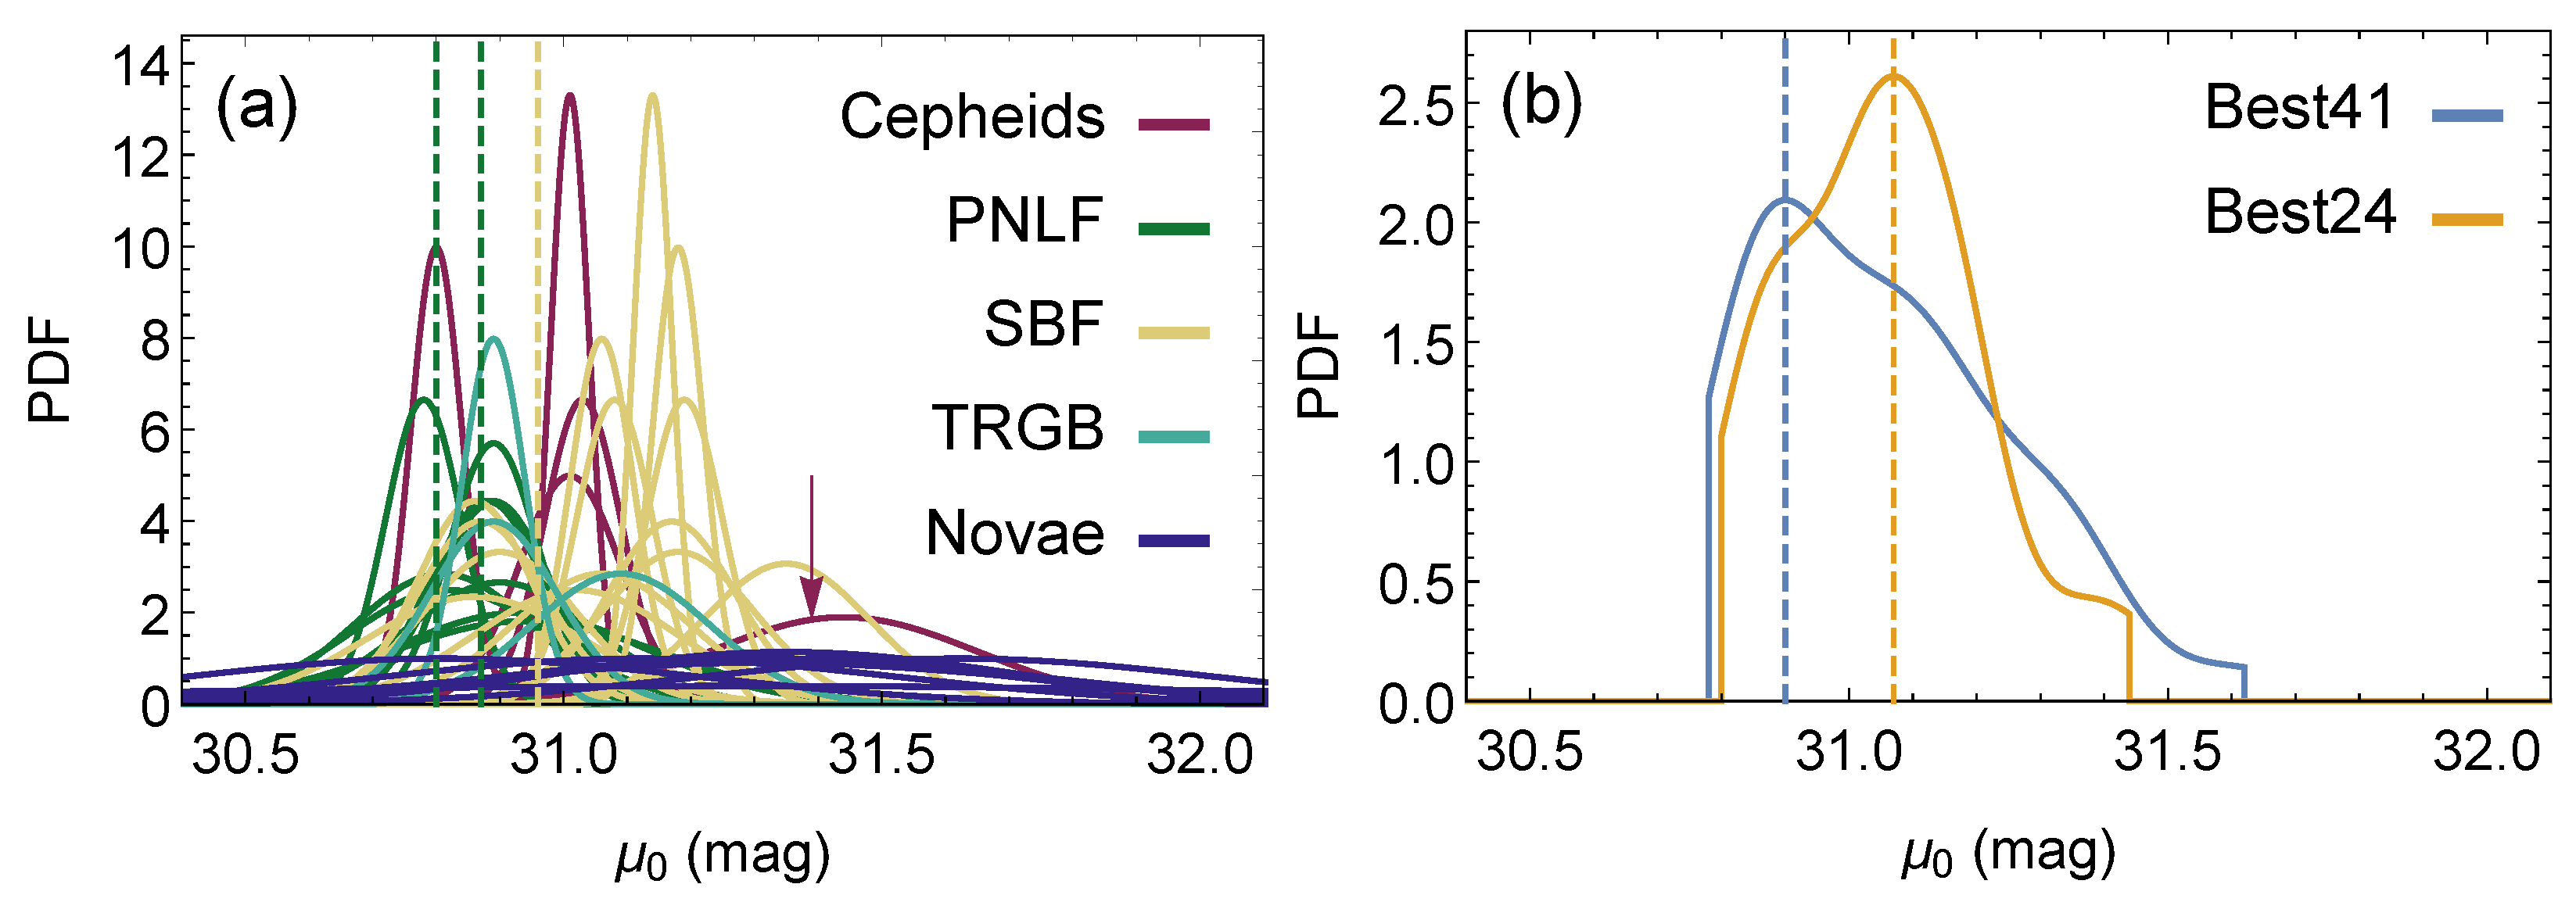
  • Cepheids are periodically varying stars whose period is tightly related to their intrinsic luminosity (Leavitt law [2]) and, hence, can be employed to infer the distances to their host galaxies.
  • PNLF [3]—the LF of PN is very consistent across different galaxies, and the number and luminosity of PN can be used to infer the distance via a calibrated intrinsic luminosity of PN. The PNLF is independent of the galaxies’ types and environments.
  • SBF [4]—small fluctuations of surface brightness due to unresolved stars in a galaxy are used to infer its distance; especially applicable to nearby ellipticals, such as M87.
  • The TRGB [5] in a galaxy’s color–magnitude diagram corresponds to a known, calibrated luminosity and as such can be used to infer the distance to the host galaxy.
  • The peak brightness of novae [6] has a consistent luminosity (similarly to supernovae) and, hence, can be calibrated to serve as a distance indicator.
The adjusted distance values to M87 from the PNLF were eventually discarded as being essentially lower limits, and novae had significantly larger uncertainties. Using Cepheids, SBF, and TRGB, the arithmetic mean of μ 0 was calculated as ( 31.03 ± 0.14 ) mag, corresponding to D = ( 16.07 ± 1.03 ) Mpc. Note that despite calculating the “mean values and their 1 σ uncertainties”, the uncertainty was, in fact, taken as the standard deviation, not as the standard error of the mean, which should be divided by the square root of the sample size (i.e., by 24 ) and, hence, should read 0.03 mag or 0.21 Mpc.1
The arithmetic mean is one possible measure of central tendency of a distribution. Another option is the median, which was employed recently by Rackers et al. [7], who used the full sample of de Grijs and Bono [1] to arrive at a value of the systematic error, and using the same sample of Cepheid, SBF, and TRGB moduli gave the median distance as 31.08 0.08 + 0.06 mag, corresponding to D = 16.4 0.6 + 0.5 Mpc.
Ramakrishnan and Desai [8] reported the median of all 15 tracers to be μ 0 = ( 31.08 ± 0.09 ) mag, corresponding to D = ( 16.44 ± 0.68 ) Mpc. They examined the Gaussianity of the residuals and concluded that whereas some tracers fulfill this condition (e.g., PNLF and SBF), the full set of moduli does not; therefore, the mean is unsuitable and the median ought to be employed as the distance to M87.
The third common measure of central tendency is the mode, i.e., the most probable value that manifests itself by a peak in the probability density function (PDF). I utilize the same sample of de Grijs and Bono [1] to establish the distance to M87 as the mode of the distribution of μ 0 to complement the previous studies with a measure of central tendency that has not yet been employed to such a task. Bootstrap [9,10,11] is employed to estimate the statistical error. The final distance D = 16.29 0.45 + 0.30 Mpc is consistent with the other two estimates (i.e, the mean and median), and including the systematic error from [7] leads to even smaller uncertainties than in the other studies.

2. Data and Methodology

2.1. Data

The distance moduli μ 0 are taken from Table 1 of [1]. They are grouped according to tracers: Cepheids, PNLF, SBF, TRGB, and novae, with sample sizes of N = 5 , 11 , 17 , 3 , 8 , respectively. They are represented in Figure 1a as Gaussian distributions, N ( μ 0 , σ ) , with individual values μ 0 and their errors σ as means and standard deviations. Combined, they form the Best44 sample. Two PNLF distances and one SBF distance are given with no errors by the originating authors. Excluding these gives the Best41 sample. Taking only Cepheids, SBF, and TRGB as the most reliable tracers from the Best44 sample forms the Best25 sample. Excluding the one SBF value with no error gives the Best24 sample.

2.2. Methods

The final two samples from Section 2.1 are displayed in Figure 1b as kernel density estimates (KDEs) with a Gaussian kernel and bandwidth according to the Silverman [13] rule. The KDEs are unimodal; hence, the mode unambiguously corresponds to the most probable value. I note in passing that the modes of the Best44 and Best41 samples are close to each other, as well as the modes of the Best25 and Best24 samples. This means that the μ 0 values not equipped with uncertainties in the originating papers do not strongly affect the resulting distance distributions; nevertheless, the Best44 and Best25 samples are excluded from the following analyses due to the inability to account for the biases the missing uncertainties introduce. There is a discrepancy between the modes of the samples consisting of all five tracers and the most stable three, amounting to 0.17 mag. PNLF values being essentially lower limits (PN detections are biased toward foreground objects [1]) offsets the modulus distribution toward lower modes; indeed, the Best24 sample has its mode higher than the Best41 sample.
To constrain the positions and uncertainties of the modes, bootstrap resampling [9,10,11] is performed as follows:
  • From the Gaussian representation N ( μ 0 , σ ) of each measurement in Best41 and Best24 samples a randomized value is drawn, thus creating a random realization of the Best41 and Best24 samples;
  • KDEs of the randomized Best41 and Best24 samples are constructed, and their modes m are found numerically;
  • The above procedure is repeated n = 10 4 times to form distributions of modes { m i } i = 1 n ; their means m , standard deviations σ m , and standard errors of the mean σ m / n are computed;
  • The above procedure is repeated independently 10 times to verify that m and σ m always converge to approximately the same values.

3. Results

3.1. Discussion

The outcomes of the bootstrap from Section 2.2 are gathered in Table 1. Mean mode m for the Best41 sample is slightly smaller than for the Best24 sample. The standard deviations and standard errors of the means are comparable between samples. It should be emphasized that the standard errors of the sample means are small because they scale with 1 / n . The standard error of the mean is not a measure of dispersion of a sample, which, even if large, does not reflect the accuracy of determining the value of the mean whose constraint becomes tighter for larger samples. This was correctly computed by Rackers et al. [7]; cf. their Table 1.
The distance D is calculated as follows:
D = 10 1 + μ 0 / 5
with μ 0 taken as the mean of the mode distribution from bootstrapping m (Section 2.2). The error Δ D is obtained via error propagation as
Δ D = D 5 ln ( 10 ) Δ μ 0 .
These statistical errors are small compared to systematic ones estimated by Rackers et al. [7]; hence, the latter dominate when combined in quadrature. Thus, the recommended value of μ 0 , based on the Best24 sample, is μ 0 = 31.06 0.06 + 0.04 mag, and the distance estimate to M87 is D = 16.29 0.45 + 0.30 Mpc.
de Grijs and Bono [1] also discarded one μ 0 value from the Cepheid sample, i.e., the measurement of Tammann et al. [12]. They argued that this is an outlier; indeed, it has a clearly larger value than others from this tracer and a larger uncertainty as well (see Figure 1a). Rackers et al. [7] followed suit. I repeated the whole procedure from Section 2.2 for the two samples from Section 2.1 without the Tammann et al. [12] point as well. The only difference, compared to the results quoted in Table 1, is that the Best40 sample (i.e., the Best41 sample minus this one point) yielded m = 30.99 mag, leading to D = 15.78 Mpc. Therefore, the Tammann et al. [12] measurement does not affect the final distance to M87 obtained above, specifically in the case of the Best24 sample.

3.2. Relevance

The supermassive black hole (SMBH) mass M scales with distance D as M D 2 [1]; hence, two mass values M , 1 and M , 2 corresponding to D 1 and D 2 , respectively, are related to each other as
M , 1 M , 2 = D 1 D 2 2 .
Taking M , 2 = 6.5 · 10 9 M as reported by the Event Horizon Telescope Collaboration et al. [14] and the D 2 = 16.8 Mpc they employed, the mass M , 1 corresponding to the new recommended distance D 1 = 16.29 Mpc is calculated to be M , 1 = 6.1 · 10 9 M . The uncertainty Δ M , 1 is not reported here since error propagation2 applied to Equation (3) would also involve Δ D 2 and Δ M , 2 besides Δ D 1 . The mass estimate M , 2 by the Event Horizon Telescope Collaboration et al. [14] was obtained via numerical simulations within a general relativistic framework utilizing just the value and uncertainty of D 2 . To obtain a meaningful error Δ M , 1 of the SMBH mass estimate, the same simulations would need to be performed independently utilizing the new recommended distance D 1 without referring to D 2 and M , 2 .
Finally, the new recommended distance to M87 has significantly smaller errors than previously reported in the literature [7,8]. This allows us to set M87 more firmly on the cosmic distance ladder as a reference distance, and it aids in setting the next rungs, extending to the ∼100 Mpc scale [1].

4. Summary

Obtaining a representative value for a set of data can be achieved with a measure of central tendency. de Grijs and Bono [1] calculated the distance to M87 as the arithmetic mean of absorption-corrected distance moduli μ 0 gathered from the literature published in the last 100 years. Rackers et al. [7] and Ramakrishnan and Desai [8] employed the median as the measure of central tendency, obtaining values consistent with each other and with the mean within errors. Herein, I explore the mode of a unimodal distribution as another measure of central tendency. All measures (i.e., mean, median, and mode) are in agreement within errors, but the statistical uncertainty of the mode is greatly reduced compared to those of the medians via bootstrap resampling, and the final error of the mode is dominated by systematic uncertainties established by Rackers et al. [7]. The final recommended distance to M87 is, therefore, μ 0 = 31.06 0.06 + 0.04 mag, equivalent to D = 16.29 0.45 + 0.30 Mpc.

Funding

Funding from the National Science Center through Sonata Grant No. 2021/43/D/ST9/01153 is acknowledged.

Data Availability Statement

The original data used in this study are available in Table 1 of [1].

Conflicts of Interest

The author declares no conflicts of interest.

Abbreviations

The following abbreviations are used in this manuscript:
KDEkernel density estimate
PDFprobability density function
PNLFplanetary nebulae luminosity function
SBFsurface brightness fluctuation
SMBHsupermassive black hole
TRGBtip of the red giant branch

Notes

1
See the discussion in Section 3.1 for an explanation for the factor of 24 instead of 25, as Section 2.1 would suggest.
2
Note that its application to the mass estimate by de Grijs and Bono [1] gives an error of 1.1 · 10 9 M , not the 0.6 · 10 9 M reported by them, which was likely obtained by neglecting the terms Δ D 1 and Δ D 2 in the resulting formula for Δ M , 1 . Their higher value than that adopted by the Event Horizon Telescope Collaboration et al. [14] distance uncertainty would, hence, lead to a smaller SMBH mass uncertainty, which is a counterintuitive outcome. Likewise, a similar case occurs for the mass estimate obtained with the even smaller uncertainties of the new recommended distance computed herein.

References

  1. de Grijs, R.; Bono, G. Clustering of Local Group Distances: Publication Bias or Correlated Measurements? VI. Extending to Virgo Cluster Distances. Astrophys. J. Suppl. 2020, 246, 3. [Google Scholar] [CrossRef]
  2. Breuval, L.; Huang, C.D.; Riess, A.G. The Legacy of Henrietta Leavitt: A Re-analysis of the First Cepheid Period-Luminosity Relation. arXiv 2025, arXiv:2502.17438. [Google Scholar]
  3. Ciardullo, R.; Jacoby, G.H.; Feldmeier, J.J.; Bartlett, R.E. The Planetary Nebula Luminosity Function of M87 and the Intracluster Stars of Virgo. Astrophys. J. 1998, 492, 62–73. [Google Scholar] [CrossRef]
  4. Tonry, J.; Schneider, D.P. A New Technique for Measuring Extragalactic Distances. Astron. J. 1988, 96, 807. [Google Scholar] [CrossRef]
  5. Beaton, R.L.; Bono, G.; Braga, V.F.; Dall’Ora, M.; Fiorentino, G.; Jang, I.S.; Martínez-Vázquez, C.E.; Matsunaga, N.; Monelli, M.; Neeley, J.R.; et al. Old-Aged Primary Distance Indicators. Space Sci. Rev. 2018, 214, 113. [Google Scholar] [CrossRef]
  6. della Valle, M.; Livio, M. The Calibration of Novae as Distance Indicators. Astrophys. J. 1995, 452, 704. [Google Scholar] [CrossRef]
  7. Rackers, N.; Splawska, S.; Ratra, B. Median Statistics Estimate of the Distance to M87. Publ. Astron. Soc. Pac. 2024, 136, 024101. [Google Scholar] [CrossRef]
  8. Ramakrishnan, G.; Desai, S. A meta-analysis of distance measurements to M87. Prog. Theor. Exp. Phys. 2023, 2023, 113F01. [Google Scholar] [CrossRef]
  9. Efron, B. Bootstrap Methods: Another Look at the Jackknife. Ann. Stat. 1979, 7, 1–26. [Google Scholar] [CrossRef]
  10. Efron, B. Nonparametric estimates of standard error: The jackknife, the bootstrap and other methods. Biometrika 1981, 68, 589–599. [Google Scholar] [CrossRef]
  11. Efron, B.; Tibshirani, R.J. An Introduction to the Bootstrap; CRC Press: Boca Raton, FL, USA, 1994. [Google Scholar]
  12. Tammann, G.A.; Sandage, A.; Reindl, B. The distance of the Virgo cluster. Nucl. Phys. B Proc. Suppl. 2000, 80, 13/11. [Google Scholar] [CrossRef]
  13. Silverman, B.W. Density Estimation for Statistics and Data Analysis; Chapman and Hall: London, UK, 1986. [Google Scholar]
  14. Event Horizon Telescope Collaboration; Akiyama, K.; Alberdi, A.; Alef, W.; Asada, K.; Azulay, R.; Baczko, A.K.; Ball, D.; Baloković, M.; Barrett, J.; et al. First M87 Event Horizon Telescope Results. I. The Shadow of the Supermassive Black Hole. Astrophys. J. Lett. 2019, 875, L1. [Google Scholar] [CrossRef]
Figure 1. (a) Distance moduli of the measurements from [1] represented as Gaussian distributions with locations μ 0 and their individual standard errors as standard deviations. Vertical dashed lines mark values with no errors reported. Arrow points to the Tammann et al. [12] measurement (see Section 3). (b) Distributions of the investigated samples. Vertical dashed lines mark the respective modes; their difference equals 0.17 mag.
Astronomy 04 00006 g001
Table 1. Mean m values of the bootstrap resampled distributions of mode m, their standard deviation σ m , standard error σ m / n of the means, distances D, statistical errors and final errors Δ D and Δ D + obtained as statistical errors combined in quadrature with systematic errors from [7]. Quantities are rounded to 0.01, except for σ m / n , which is rounded to 0.001.
Sample m σ m σ m / n D Δ D stat Δ D Δ D +
(mag) (mag) (mag) (Mpc) (Mpc) (Mpc) (Mpc)
Best4131.000.070.00115.850.010.440.29
Best2431.060.060.00116.290.010.450.30
Disclaimer/Publisher’s Note: The statements, opinions and data contained in all publications are solely those of the individual author(s) and contributor(s) and not of MDPI and/or the editor(s). MDPI and/or the editor(s) disclaim responsibility for any injury to people or property resulting from any ideas, methods, instructions or products referred to in the content.

