Article

Effect of Annealing Temperature on Microstructure and Properties of Solid Solution Extruded Mg–2.0Zn–1.0Y–0.5Zr Alloys

1
School of Materials Science and Engineering, Henan University of Science and Technology, Luoyang 471023, China
2
Collaborative Innovation Center of Nonferrous Metals, Luoyang 471023, China
*
Author to whom correspondence should be addressed.
Alloys 2024, 3(2), 140-160; https://doi.org/10.3390/alloys3020008
Submission received: 25 March 2024 / Revised: 9 May 2024 / Accepted: 16 May 2024 / Published: 23 May 2024

Abstract

:
In this investigation, the effects of different annealing temperatures (180, 200, 220, 240, 260, and 280 °C) on the microstructure evolution and properties of an extruded Mg–2.0Zn–1.0Y–0.5Zr (wt%) magnesium alloys were determined. Optical microscopy (OM), scanning electron microscopy (SEM), immersion corrosion, electrochemical corrosion experiments, and tensile testing were performed. Research has found that combining hot extrusion with subsequent low-temperature annealing significantly improves the strength, plasticity, and corrosion resistance of alloys due to grain refinement and a reduced dislocation density. The alloy was completely recrystallized at an annealing temperature of 240 °C for 4 h after solid solution extrusion, and the grains were fine and uniform, demonstrating the best comprehensive properties. Its corrosion rate, ultimate tensile strength, yield strength, and elongation were 0.454 ± 0.023 mm/y, 346.7 ± 8.9 MPa, 292.4 ± 6.9 MPa, and 19.0 ± 0.4%, respectively. The corrosion mechanism of the specimens under extruded and annealed conditions was analyzed. After annealing at 240 °C for 4 h, the dislocation and bimodal grain structure of the samples were almost eliminated, resulting in uniform and fine grains, which were conducive to the formation of a more uniform and denser oxide film, thus improving the corrosion resistance of the alloy.

1. Introduction

Magnesium serves as a promising biomedical implant material due to its excellent biocompatibility, biodegradability, low density (~1.74 kg/m3), and moderate Young’s modulus (41–45 GPa) similar to human bone (15–30 GPa), allowing it to avoid stress shielding and effectively eliminate secondary surgeries [1,2,3,4]. Biodegradable implants for orthopedic applications must meet following requirements: (1) a yield strength of >200 MPa; (2) a fracture elongation of >10%; (3) a degradation (corrosion) rate < 0.5 mm/y; and (4) uniform corrosion during tissue recovery (12–24 weeks) [5,6]. In addition, hydrogen evolution below 0.01 mL/cm2/day is considered acceptable [7]. Nevertheless, pure magnesium cannot provide sufficient corrosion resistance and mechanical strength in physiological environments due to its low potential and low slip surfaces. Various methods have been used to improve the above-mentioned properties, including alloying, heat treatment, thermal deformation, and coating treatment [8,9,10,11].
The anti-corrosion performance and mechanical strength of magnesium can be improved by adding alloying elements, such as Zn, Zr, Ca, Sr, Mn, and Re. Zn, as an essential trace element in the human body necessary for organs, can promote the growth of human bone cells and contribute to bone healing [12]. Furthermore, Zn can refine grain and transform impurities such as Fe and Ni into harmless intermetallic compounds [13]. Zr is completely biocompatible, exhibits a great grain-refining effect, and improves corrosion resistance to a certain extent [14,15,16]. Further, the rare-earth element Y can significantly improve mechanical properties and corrosion resistance, as well as promote the formation of phosphate and a relatively stable hydroxide film on the alloy surface [17,18,19]. However, it is difficult to achieve the above-mentioned performance requirements in physiological environments by alloying alone.
Hot extrusion can markedly improve mechanical properties of magnesium, causing grain refinement, an increased dislocation density, and nanoscale precipitated phases [20,21]. According to the current literature, hot extrusion can improve mechanical properties of magnesium alloys; however, some researchers believe that the corrosion rate of “hot” extruded alloys is mainly affected by the two competing parameters of grain size and fringe lines, with grain size having a greater impact on the corrosion behavior of the alloy. Therefore, as-extruded alloys with a smaller grain size will exhibit greater corrosion resistance compared to as-cast alloys [22,23]. Other studies suggested that the high-density dislocation and fiber texture caused by extrusion can trigger corrosion deterioration and adversely affect corrosion resistance [24,25,26]. Moreover, magnesium products will be particularly prone to forming a significant texture, because the von Mises criterion of requiring at least five independent slip systems for extensive plasticity cannot be satisfied [27].
Choi et al. [28] found that annealing treatment after rolling could reduce the dislocation density, eliminate internal stress, and further improve the corrosion resistance of ZK60 alloy. Chen et al. [29] found that both the mechanical properties and degradation behavior of the as-extruded ZK60 alloy were improved after T5 treatment. Zhu et al. [30] reported that an NQZ310K alloy only recovers under low-temperature annealing, and its mechanical properties do not change much, but its corrosion rate decreases. Lian et al. [31] observed that residual stress of an as-extruded ME21 magnesium alloy was reduced, and residual stress distribution was homogenized. Volkov et al. [32,33] showed that low-temperature annealing led to some increases in strength and plasticity for pre-deformed magnesium.
It is reported that biodegradable materials should meet the following requirements in terms of mechanical properties and degradation properties: 1. yield strength (YS) ≥ 200 MPa; 2. elongation (EL) ≥ 10%; 3. corrosion rate (CR) ≤ 0.5 mm/y; and 4. a uniform degradation form [34]. Based on a previous study of the novel Mg–2.0Zn–1.0Y–0.5Zr (wt%) alloy, it was found that the corrosion resistance and mechanical properties of the alloy can be improved after extrusion at 490 °C for 8 h in a solid solution +460 °C, where YS is 293 ± 4.9 MPa, EL is 16.7 ± 1.5%, CRw is 0.669 ± 0.017 mm/y [35]. Although the strength has reached the standard of biological use, the corrosion resistance has not reached the requirements of biological magnesium alloy materials. In this paper, an as-cast Mg–2.0Zn–1.0Y–0.5Zr alloy was subjected to hot extrusion at 460 °C after solid solution treatment at 490 °C for 8 h, followed by low-temperature annealing at different temperatures so as to further improve its mechanics and corrosion resistance. Finally, the corrosion mechanism of the solid solution extrusion alloy with low-temperature annealing was discussed.

2. Materials and Methods

2.1. Material Preparatione

Ingots were cut into cylinders with dimensions of Φ 49 × 35 mm for extrusion. A differential thermal analysis (DTA) of the ingot before solution and extrusion treatment was performed, and the results are shown in Figure 1. There are two obvious inflection points on the DTA curve, in which 503.5 °C and 606.0 °C are melting point of eutectic phase and alloy, respectively. The solution temperature was approximately 10 °C to 20 °C below the eutectic temperature [36], and based on previous research findings [37], the ingot was solution-treated at 490 °C for 8 h and subsequently extruded at 460 °C, with an extrusion ratio of 7.7 and an extrusion speed of 5 mm/s. After extrusion, the diameter of the bar material was Φ18 mm, and it was air-cooled to room temperature. A schematic diagram of the extrusion process and the bar after extrusion are presented in Figure 2. After this, extruded rods needed to be annealed at 180, 200, 220, 240, 260, and 280 °C for 4 h. We used the codes SE46, SEA18, SEA20, SEA22, SEA24, SEA26, and SEA28 to replace 1, 2 and 3 in the process solution at 490 °C for 8 h + extrusion at 460 °C, solution at 490 °C for 8 h + extrusion at 460 °C + annealing at 180 °C for 4 h, solution at 490 °C for 8 h + extrusion at 460 °C + annealing at 200 °C for 4 h, solution at 490 °C for 8 h + extrusion at 460 °C + annealing at 220 °C for 4 h, solution at 490 °C for 8 h + extrusion at 460 °C + annealing at 240 °C for 4 h, solution at 490 °C for 8 h + extrusion at 460 °C + annealing at 260 °C for 4 h, and solution at 490 °C for 8 h + extrusion at 460 °C + annealing at 280 °C for 4 h.

2.2. Microstructure Characterization

The metallographic specimens were ground successively to 2000 grit with SiC paper and polished with 1.5 μm diamond paste, followed by etching in a solution of 5 g picric acid + 100 mL ethanol + 5 mL glacial acetic acid + 10 mL deionized water. The microstructure was observed using an optical microscope (OM, OLYMPUS PMG3, Tokyo, Japan).
The phase analysis was carried out by D8 ADVANCE X-ray diffraction (XRD) with Cu Kα radiation. The tube voltage and current were 35 kV and 40 mA, respectively, the scanning speed was 2°/min, and the scanning range was 15–85°.
The specimens for transmission electron microscopy (TEM, JSM-2010, Lincoln, NE, USA) observations were thinned to approximately 100 μm using mechanical methods and cut into circular thin foils of 3 mm in diameter. Then, in a 3 wt% HClO4 solution cooled to −40 °C using liquid nitrogen, it was prepared by double jet electrolytic polishing under a voltage and current of 80 V and 20 mA, respectively.

2.3. Tensile Testing

The mechanical properties of tensile specimens perpendicular to the extrusion direction were measured at room temperature using an electronic universal testing machine (DNS100) with a size of 2 mm thickness, 3.5 mm width and 15 mm gauge length based on the GB/T228.1-2021 standard [38]. Tensile tests were carried out on a universal testing machine at room temperature; the tensile rate was 1 mm/min, and each experiment tested five parallel specimens.

2.4. Immersion Experiment

Immersion experiments with a size of Φ 18 mm × 5 mm were performed in simulated body fluid (SBF) at about 37 ± 0.5 °C. The ratio of the solution volume to specimen area was 30:1 mL/cm2, the immersion time was 120 h with the replacement of SBF every 24 h, and the amount of hydrogen evolution was recorded every day using a gas-collecting device. A boiling chromic acid solution was used to remove corrosion products (3 g AgNO3 + 60 g chromic acid + 300 mL deionized water). An electronic analytical balance with an accuracy of 0.1 mg was used to determine the mass loss. The chemical composition of SBF is given in Table 1.
The corrosion rate obtained by weight loss was calculated as follows [39]:
P W = ( K × W ) / ( A × T × D )
where PW is the corrosion rate (mm/y), K = 8.76 × 10⁴, W is the weight loss value (g), A is the specimen surface area, T is the immersion time (h), and D is the density of the material (kg/m3).

2.5. Electrochemical Testing

An electrochemical workstation was used for electrochemical experiments (Autolab, AUT84580, Herisau, Switzerland) with a three-electrode electrochemical cell. A specimen with an exposed area of 1 cm2 was used as the working electrode, a graphite sheet was used as the counter electrode, and a saturated calomel electrode (SCE) was used as the reference electrode. All potentials herein are relative to SCE. Electrochemical impedance spectroscopy (EIS) was performed after the specimen (immersed in SBF for 1 h) obtained a stable open-circuit potential (OCP) with an AC amplitude of 5 mV over a frequency range from 10 kHz to 0.1 Hz. Then, the polarization curve was obtained at a constant voltage scan rate of 5 mV/s from −1.9 V to −1.1 V.
Observation and test specimens were machined in parallel to the extrusion direction (ED).

3. Results

3.1. Subsection

Figure 3 and Figure 4 present optical images and grain size distributions of the Mg–2.0Zn–1.0Y–0.5Zr alloy under different conditions, respectively. Nano Measurer measuring software (version 1.2.5) was used to measure the grain size. The average grain size of the as-cast specimen was approximately 95 ± 2 μm. Compared with the cast alloy, the microstructure of extruded specimen SE46 was significantly refined; it was mainly composed of a bimodal grain structure with tiny dynamic recrystallized (DRXed) grains and several elongated deformed grains, namely, coarse unrecrystallized (unDRXed) grains distributed along the ED [28,40], with an average grain size of about 2.3 ± 0.4 μm.
Figure 5 shows the XRD spectra of extruded and annealed Mg–2.0Zn–1.0Y–0.5Zr alloys. A small amount of I (Mg3YZn6) and W (Mg3Y2Zn3) phases was detected in the spectra of all specimens by the XRD pattern, which meant that the second phases in alloys did not change, but the diffraction peak in the alloys varied somewhat. Previous studies showed that the second phase consists of W, I, and Zn2Zr phases [37,41]. In addition, it was observed that higher peaks of (0002) and (10–11) orientation were detected in extruded and annealed specimens, which indicates that the annealing process does not change the preferential crystallographic orientation of α-Mg grains [24,42].
Figure 6 shows TEM bright-field micrographs of Mg–2.0Zn–1.0Y–0.5Zr alloys in different states. A large number of dislocations and nanoscale particle-like and rod-like second phases were observed in specimen SE46, with most of the nanoscale rod-like second phase aligned in ED with the dynamically recrystallized grains after extrusion. These nanoscale second phases dynamically precipitated from the supersaturated solid solution during the extrusion process. Li et al. [43] observed massive residual and dislocation tangles in Mg-Yb alloy after extrusion. In contrast, grains in specimen SEA24 were fine and more homogeneous, and the number of high-density dislocations in the alloy decreased sharply. Furthermore, the amount of nanoscale second phases increased and significantly grew, and other studies [28,44] have found similar results. In addition, twins were less prominent in both extruded and annealed specimens; therefore, the influence of twins in the alloy on the mechanical properties and corrosion resistance was not considered.

3.2. Mechanical Properties

Figure 7 shows the mechanical properties of Mg–2.0Zn–1.0Y–0.5Zr alloys annealed at different temperatures. The ultimate tensile strength (UTS), yield strength (YS), and elongation (EL) of extruded specimen SE46 were 298.4 ± 4.8 MPa, 237.1 ± 7.5 MPa, and 16.2 ± 0.4%, respectively. The strength and ductility of annealed specimens gradually increased as the annealing temperature rose to 240 °C, and gradually decreasing at higher annealing temperatures. After annealing at 240 °C, specimen SEA24 showed the highest strength and ductility; the UTS, YS, and EL were 346.7 ± 8.9 MPa, 292.4 ± 6.9 MPa, and 19.0 ± 0.4%, respectively, and were 16.2%, 23.3%, and 17.2% higher than those of extruded specimen SE46. This indicated that low-temperature annealing after extrusion was beneficial to improve strength and ductility.
As previously described, extruded specimen SE46 demonstrated high strength and relatively low elongation. Specimen SE46 contained fine grains, caused by dynamic recrystallization due to the extrusion process. At this time, W, I, and Zn2Zr phases dispersed in the grain interior and grain boundaries led to precipitation strengthening, as shown in Figure 6a, b. Moreover, a large number of dislocations within coarse and un-recrystallized grains, as well as insufficient deformation energy for recrystallization, positively affected the strength [22]. In contrast, elongated deformed grains were unfavorable for stress release, resulting in stress concentrations, which cause cracking and even fracture [30,45]. Consequently, these factors resulted in higher strength and lower elongation of extruded specimen SE46.
The influence of the annealing temperature on strength and elongation was shown to be closely related to the grain size and dislocation density [28]. When the annealing temperature was lower than 240 °C, the increase in grain size and decrease in dislocation density in annealed specimens decreased the strength of the specimens. Moreover, the bimodal grain structure accompanied by coarse unrecrystallized and fine recrystallized grains made it difficult for the matrix to slide along the ED, thus further enhancing the strength [46]. A slight increase in secondary phases after annealing was also responsible for the increased strength.
When the annealing temperature was 240 °C, specimen SEA240 was completely recrystallized, and the grains were fine and uniform. According to the Hall–Petch relationship, grain refinement can promote an increase in crystal boundaries per unit volume, strongly inhibiting internal dislocation movement in the initial stage of the tensile process, and dislocation plugging can minimize the slip of adjacent grains, ultimately promoting strength [26,47,48]. In addition, the fine grain size could increase the basic slip system and angular slip system, promoting grain boundary sliding and torsion, shortening the dislocation movement distance, and improving plasticity [21]. Furthermore, the small and uniform grain size was also conducive to the improved coordination and transmissibility of deformation between different grains in the alloy, resulting in better plasticity [49].
Figure 8 depicts the fracture morphologies after tensile tests of Mg–2.0Zn–1.0Y–0.5Zr alloys annealed at different temperatures.
The fracture morphology of extruded specimen SE46 consisted of a small cleavage platform, numerous tearing edges, and dimples, implying mixed brittle and ductile fracture, as shown in Figure 8a. This was likely related to the bimodal grain structure, because coarse unDRXed grains can act as crack initiation sites during subsequent tension along the ED [50]. After annealing at 220 °C, the number of tearing edges in specimen SEA22 decreased with an increase in dimples, indicating that plasticity improved. Specimen SEA24 annealed at 240 °C demonstrated good ductile fracture, with abundant and uniformly distributed dimples, as shown in Figure 8c. This showed that the fracture mechanism shifted from the ductile–brittle fracture mode to ductile fracture mode [43]. The microstructure of the SEA24 specimen, as shown in Figure 3f, was more uniform after recrystallization, which was beneficial to improving plasticity. When the annealing temperature was increased to 280 °C, as shown in Figure 8d, the number of dimples decreased, the dimple size increased, cleavage platform increased, and the number of tearing edges increased; therefore, plasticity decreased. This was attributed to the coarsening of grains. The rupture characteristics were consistent with results for the mechanical properties.

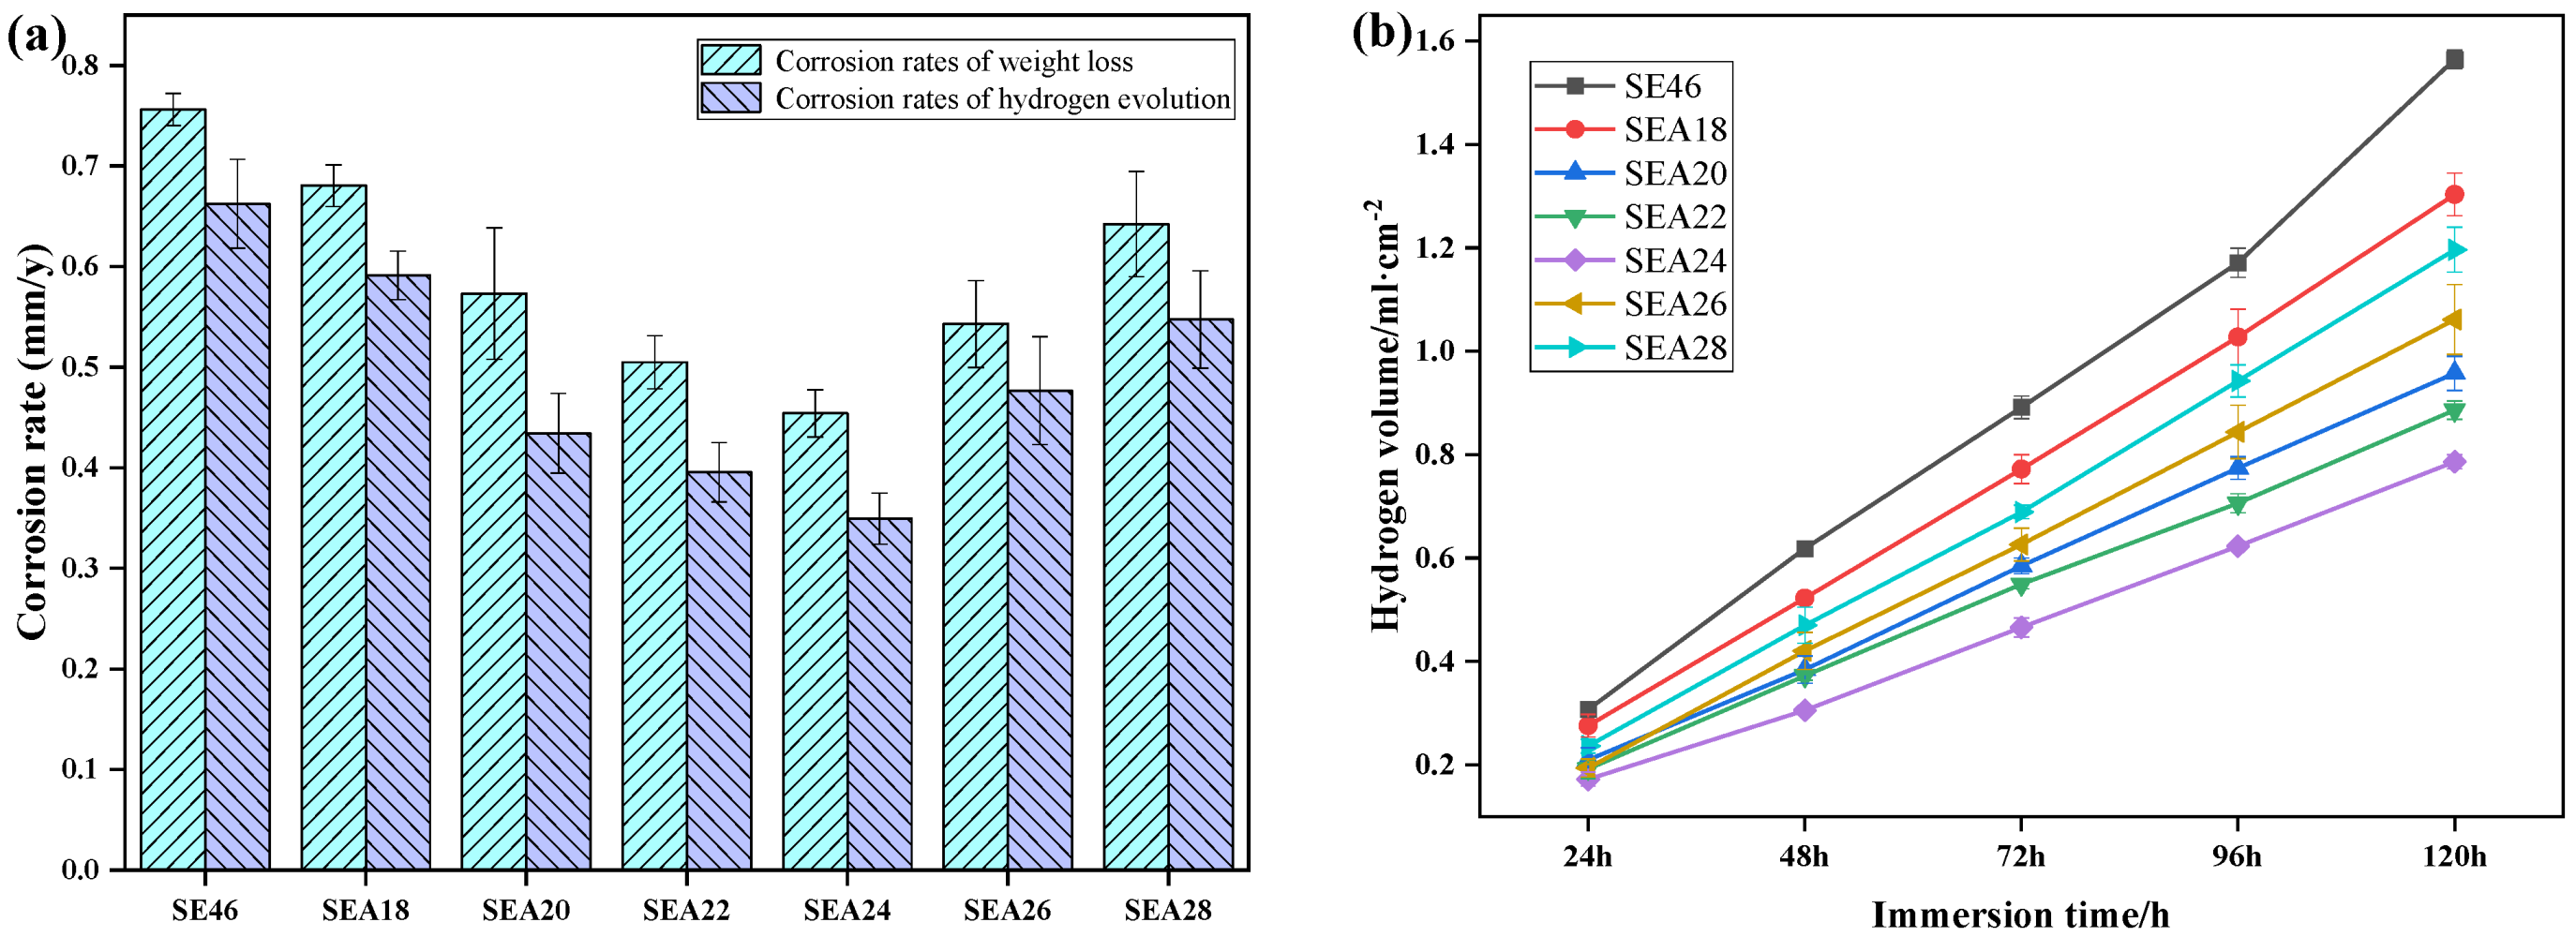
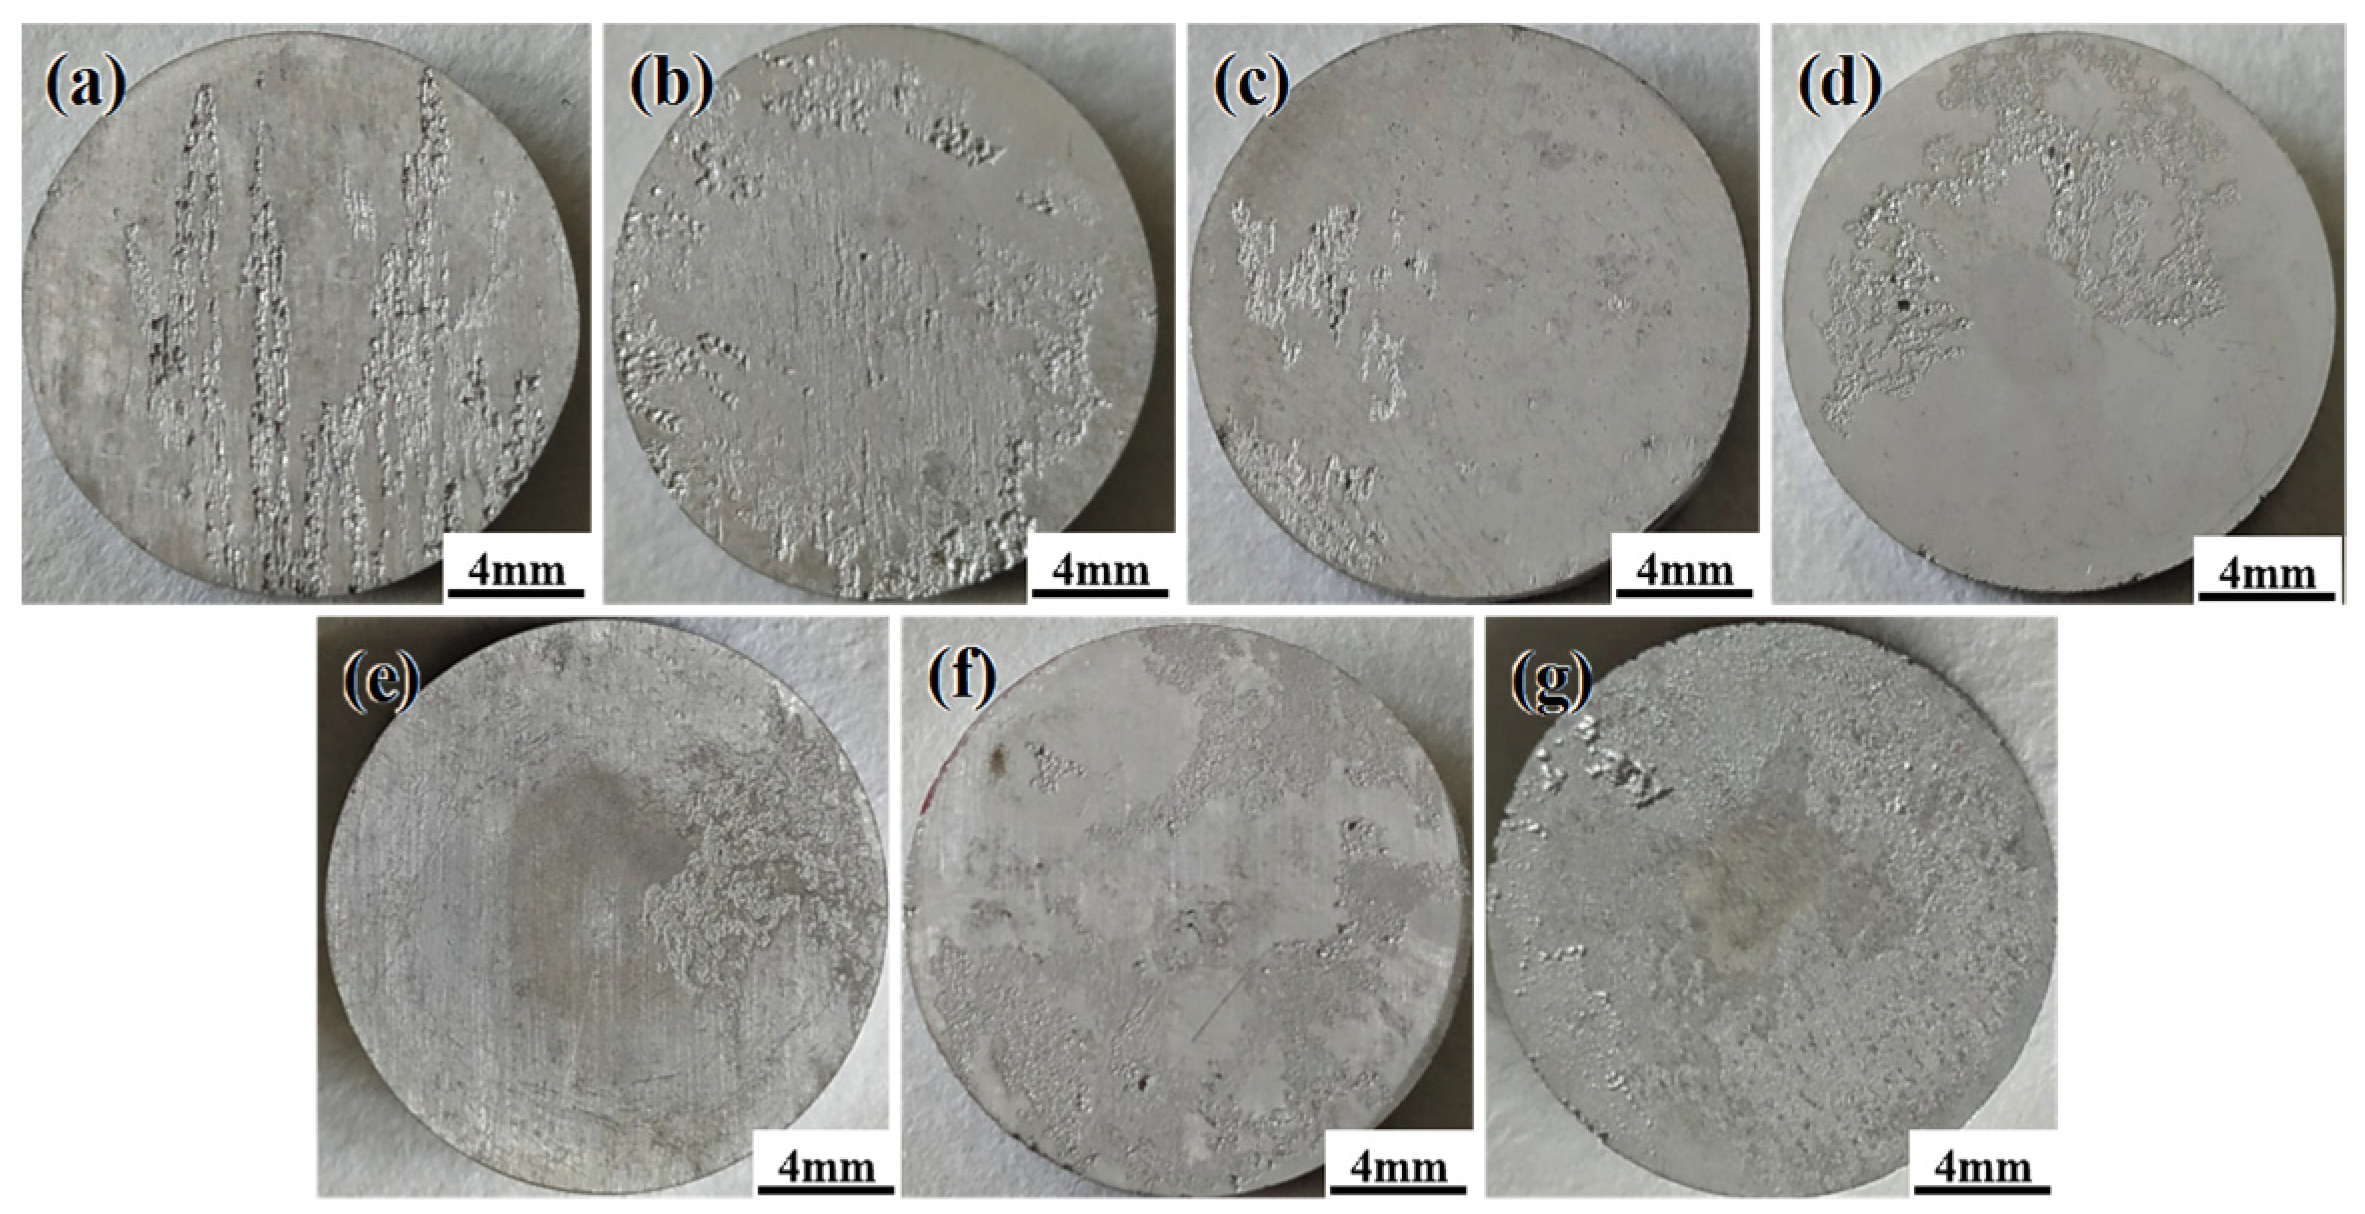
3.3. Corrosion Resistance

The corrosion rate and hydrogen evolution volume of Mg–2.0Zn–1.0Y–0.5Zr alloys annealed at different temperatures after being immersed in SBF for 120 h are shown in Figure 9. The corrosion rate obtained by weight loss for extruded specimen SE46 was 0.756 ± 0.016 mm/y. After undergoing further annealing treatment, the corrosion rate decreased significantly. On the other hand, it first decreased with an increase in the annealing temperature until 240 °C and thereafter increased gradually at higher temperatures. The corrosion rate for specimen SEA24 was the lowest among all specimens at approximately 0.454 ± 0.023 mm/y. In practice, however, inadequate corrosion product removal or overcleaning will affect precision [51]. The overall corrosion reaction for magnesium is as follows: Mg + 2H2O → Mg(OH)2 + H2. In other words, magnesium corrosion is accompanied by the formation of a molecule of hydrogen. To ensure accuracy, reliability, and reproducibility, hydrogen evolution was used to evaluate the corrosion rate of specimens [52]. The formula for the corrosion rate PH (mm/y) via hydrogen evolution is as follows [53]:
P H = 2.088 V H
where 2.088 is a constant, and VH is the H2 evolution rate (mL/cm2/d)—one mole of hydrogen has 24.45 L at 25 °C and a pressure of 1 atm, and is produced for 1 mole of corroded Mg metal, 24.31 g. Three samples from each group were taken for testing. The corrosion rates obtained by hydrogen evolution were consistent with those determined by weight loss, but the former were smaller than the latter. This may be attributed to the shedding of partially undissolved grains and second-phase particles caused by overcleaning, resulting in a higher corrosion rate calculated by weight loss. In addition, some hydrogen bubbles could have been attached to the walls of the funnel and burette or were possibly dissolved on the specimen surface, leading an underestimation of the corrosion rate calculated by hydrogen evolution [54].
The hydrogen evolution volume of extruded specimen SE46 increased continuously with the immersion time, reaching 1.56 mL/cm2 at an immersion time of 120 h. The increasing trend for annealed specimens was similar to specimen SE46, but the hydrogen evolution volume was lower. Upon increasing the annealing temperature, the hydrogen evolution volume decreased first and then increased, and it decreased to approximately 0.79 mL/cm2 for specimen SEA24 annealed at 240 °C.
Figure 10 and Figure 11, respectively, show macroscopic and microscopic SEM images of the corrosion morphology of annealed samples after soaking for 120 h to remove corrosion products. From a macro point of view, the corrosion area and depth of alloy surface decreased significantly as the annealing temperature increased to 240 °C, as shown in Figure 10b–e. After that, when the temperature continued to rise to 280 °C (Figure 10f), the local corrosion of the surface increased. Combined with the microscopic morphology analysis, Figure 11a shows the corrosion morphology of extruded alloys. There was an obvious zonal corrosion morphology distribution along the extrusion direction, accompanied by many small corrosion pits. When the annealing temperature was 220 °C (Figure 11b), some fine corrosion pits still existed in the alloys, and strip corrosion occurred along the non-recrystallization matrix. When the annealing temperature was 240 °C, the recrystallization degree of alloy was complete, and the corrosion morphology was somewhat reduced and relatively uniform compared with that at 220 °C, as shown in Figure 11c. As the annealing temperature rose to 280 °C (Figure 11d), alloy grains grew significantly, the corrosion morphology appeared as large and wide corrosion grooves mixed with small and many corrosion pits, and the local corrosion morphology could be observed.
The counter maps and three-dimensional morphology of tested specimens after removal of the corrosion products are shown in Figure 12 and Figure 13, respectively. The different colors represent the degree of corrosion, where the more uniform the color pattern, the more flat the corrosion surface and the more uniform the corrosion. Through the color contrast, it can be seen that the alloy annealed at 240 °C exhibited relatively uniform corrosion. The linear roughness (Ra) crossing the localized corrosion region can reflect corrosion resistance [55]. The lower the liner roughness, the better the corrosion resistance [56]. The Ra of extruded specimen SE46 was 8.112 μm, the corrosion morphology was not uniform, there were local corrosion pits with a large size in the vertical direction, and corrosion was relatively heavy. Previous studies have reported that deep pits could reduce overall corrosion resistance [57]. The Ra value of annealed specimen SEA24 was approximately 4.240 μm (lower than that of the other specimens), indicating a relatively light corrosion and a uniform corrosion morphology, as shown in Figure 13c. The Ra value for specimen SEA28 was 6.933 μm, where many small corrosion pits were distributed on surface, and serious local corrosion appeared again.
Hot extrusion can greatly reduce the grain size and improve the strength and ductility [41]. However, due to the limited number of active deformation systems in hexagonal close-packed magnesium, a strong crystallographic texture is prone to develop upon hot extrusion [58,59]. Moreover, massive dislocation in extruded alloys was induced by deformation [31,60]. Because the XRD results indicated that the annealing process did not alter the direction of the crystalline texture of the extruded specimen, the effect of the crystalline texture on corrosion resistance was not considered.
Figure 14 and Table 2 show a locally enlarged view of corrosion products not removed by EH48 and EHA24 and the EDS of corrosion products. It can be seen from the figure that the corrosion degree of alloy was reduced after the solid solution extrusion annealing treatment. According to Table 2, corrosion product elements were mainly O, Ca, P, C, and Mg. The high contents of C, O and P showed that corrosion products may be composed of phosphate.
Several studies reported that the difference in the crystal structure between MgO and the internal Mg matrix will be reduced after grain refinement, and the MgO film will tend to be stable and dense, thus improving corrosion resistance [28,60,61].
An increase in dislocation density can reduce the equilibrium potential near the dislocation, enhancing the thermodynamic driving force of electrochemical corrosion [43,62]. Moreover, dislocations distort the lattice, and atoms in the distorted lattice are more active than those in normal lattice and are susceptible to corrosion [63]. Therefore, a high dislocation density can decrease the corrosion resistance of alloys through corrosion preferably at the outcrop of dislocations [64,65].
Previous studies have shown that the unDRXed region in extruded alloys had a higher dislocation density than that of the DRXed region by kernel average misorientation maps, and texture appeared in extruded alloy [41,66]. The unDRXed region had greater activity during immersion, and so it will give priority to corrosion in the SBF solution [67]. In addition, the massive dislocation and bimodal grain structure in extruded alloys inevitably led to the deterioration of their corrosion resistance.
With a lower annealing temperature (<240 °C), the dislocation density and non-DRXed grains in the alloy were reduced to some extent, thus improving the corrosion resistance. However, the grain size was smaller than that of extruded specimens. When the annealing temperature reached 240 °C, the non-DRXed grains in the alloy disappeared, and micro-galvanic corrosion caused by different corrosion potentials between coarse grains and fine grains was eliminated. In addition, grain refinement was beneficial for reducing the corrosion rate due to the more stable and dense MgO film. Finally, the dislocation density was further reduced. Therefore, this specimen had the lowest corrosion rate. With an increase in the annealing temperature, grains grew from 2.4 to 4.2 μm, which made the MgO film prone to cracking, thus weakening its protective effect and increasing the corrosion rate.
As previously mentioned, grain refinement induced by extrusion can improve the corrosion resistance of Mg–2.0Zn–1.0Y–0.5Zr alloys because larger grain boundaries offer better surface coverage and inhibit the subsequent rupture of the exterior oxide film layer. However, a high dislocation density will be unfavorable to its corrosion resistance. In addition, a high dislocation density can easily lead to deformation, ultimately leading to premature failure of an implant. Therefore, lower-temperature annealing was investigated and incorporated during hot extrusion to refine grains and remove dislocation. Accordingly, plasticity and corrosion resistance can be improved at the same time, without a loss of strength.

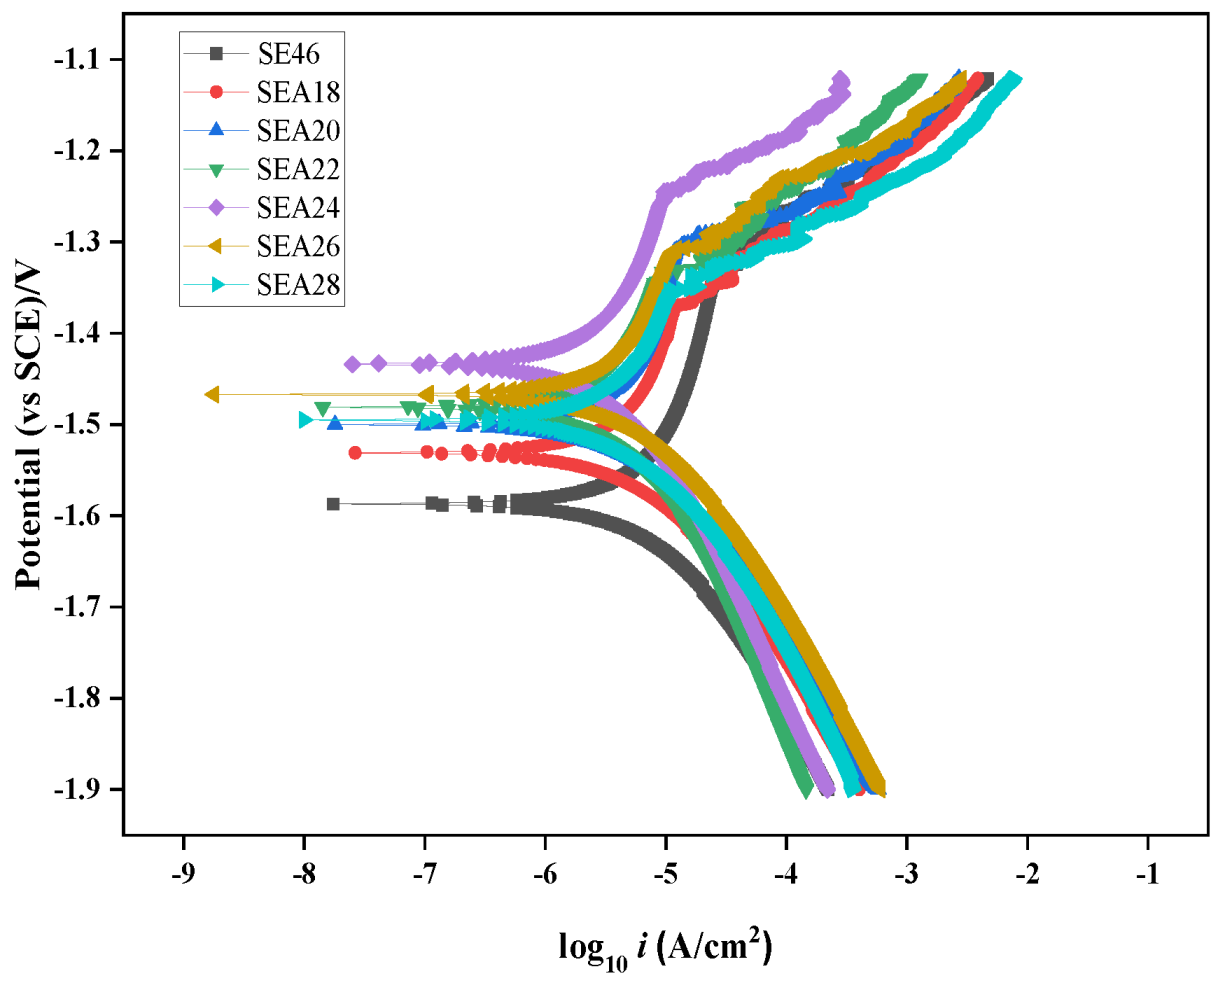
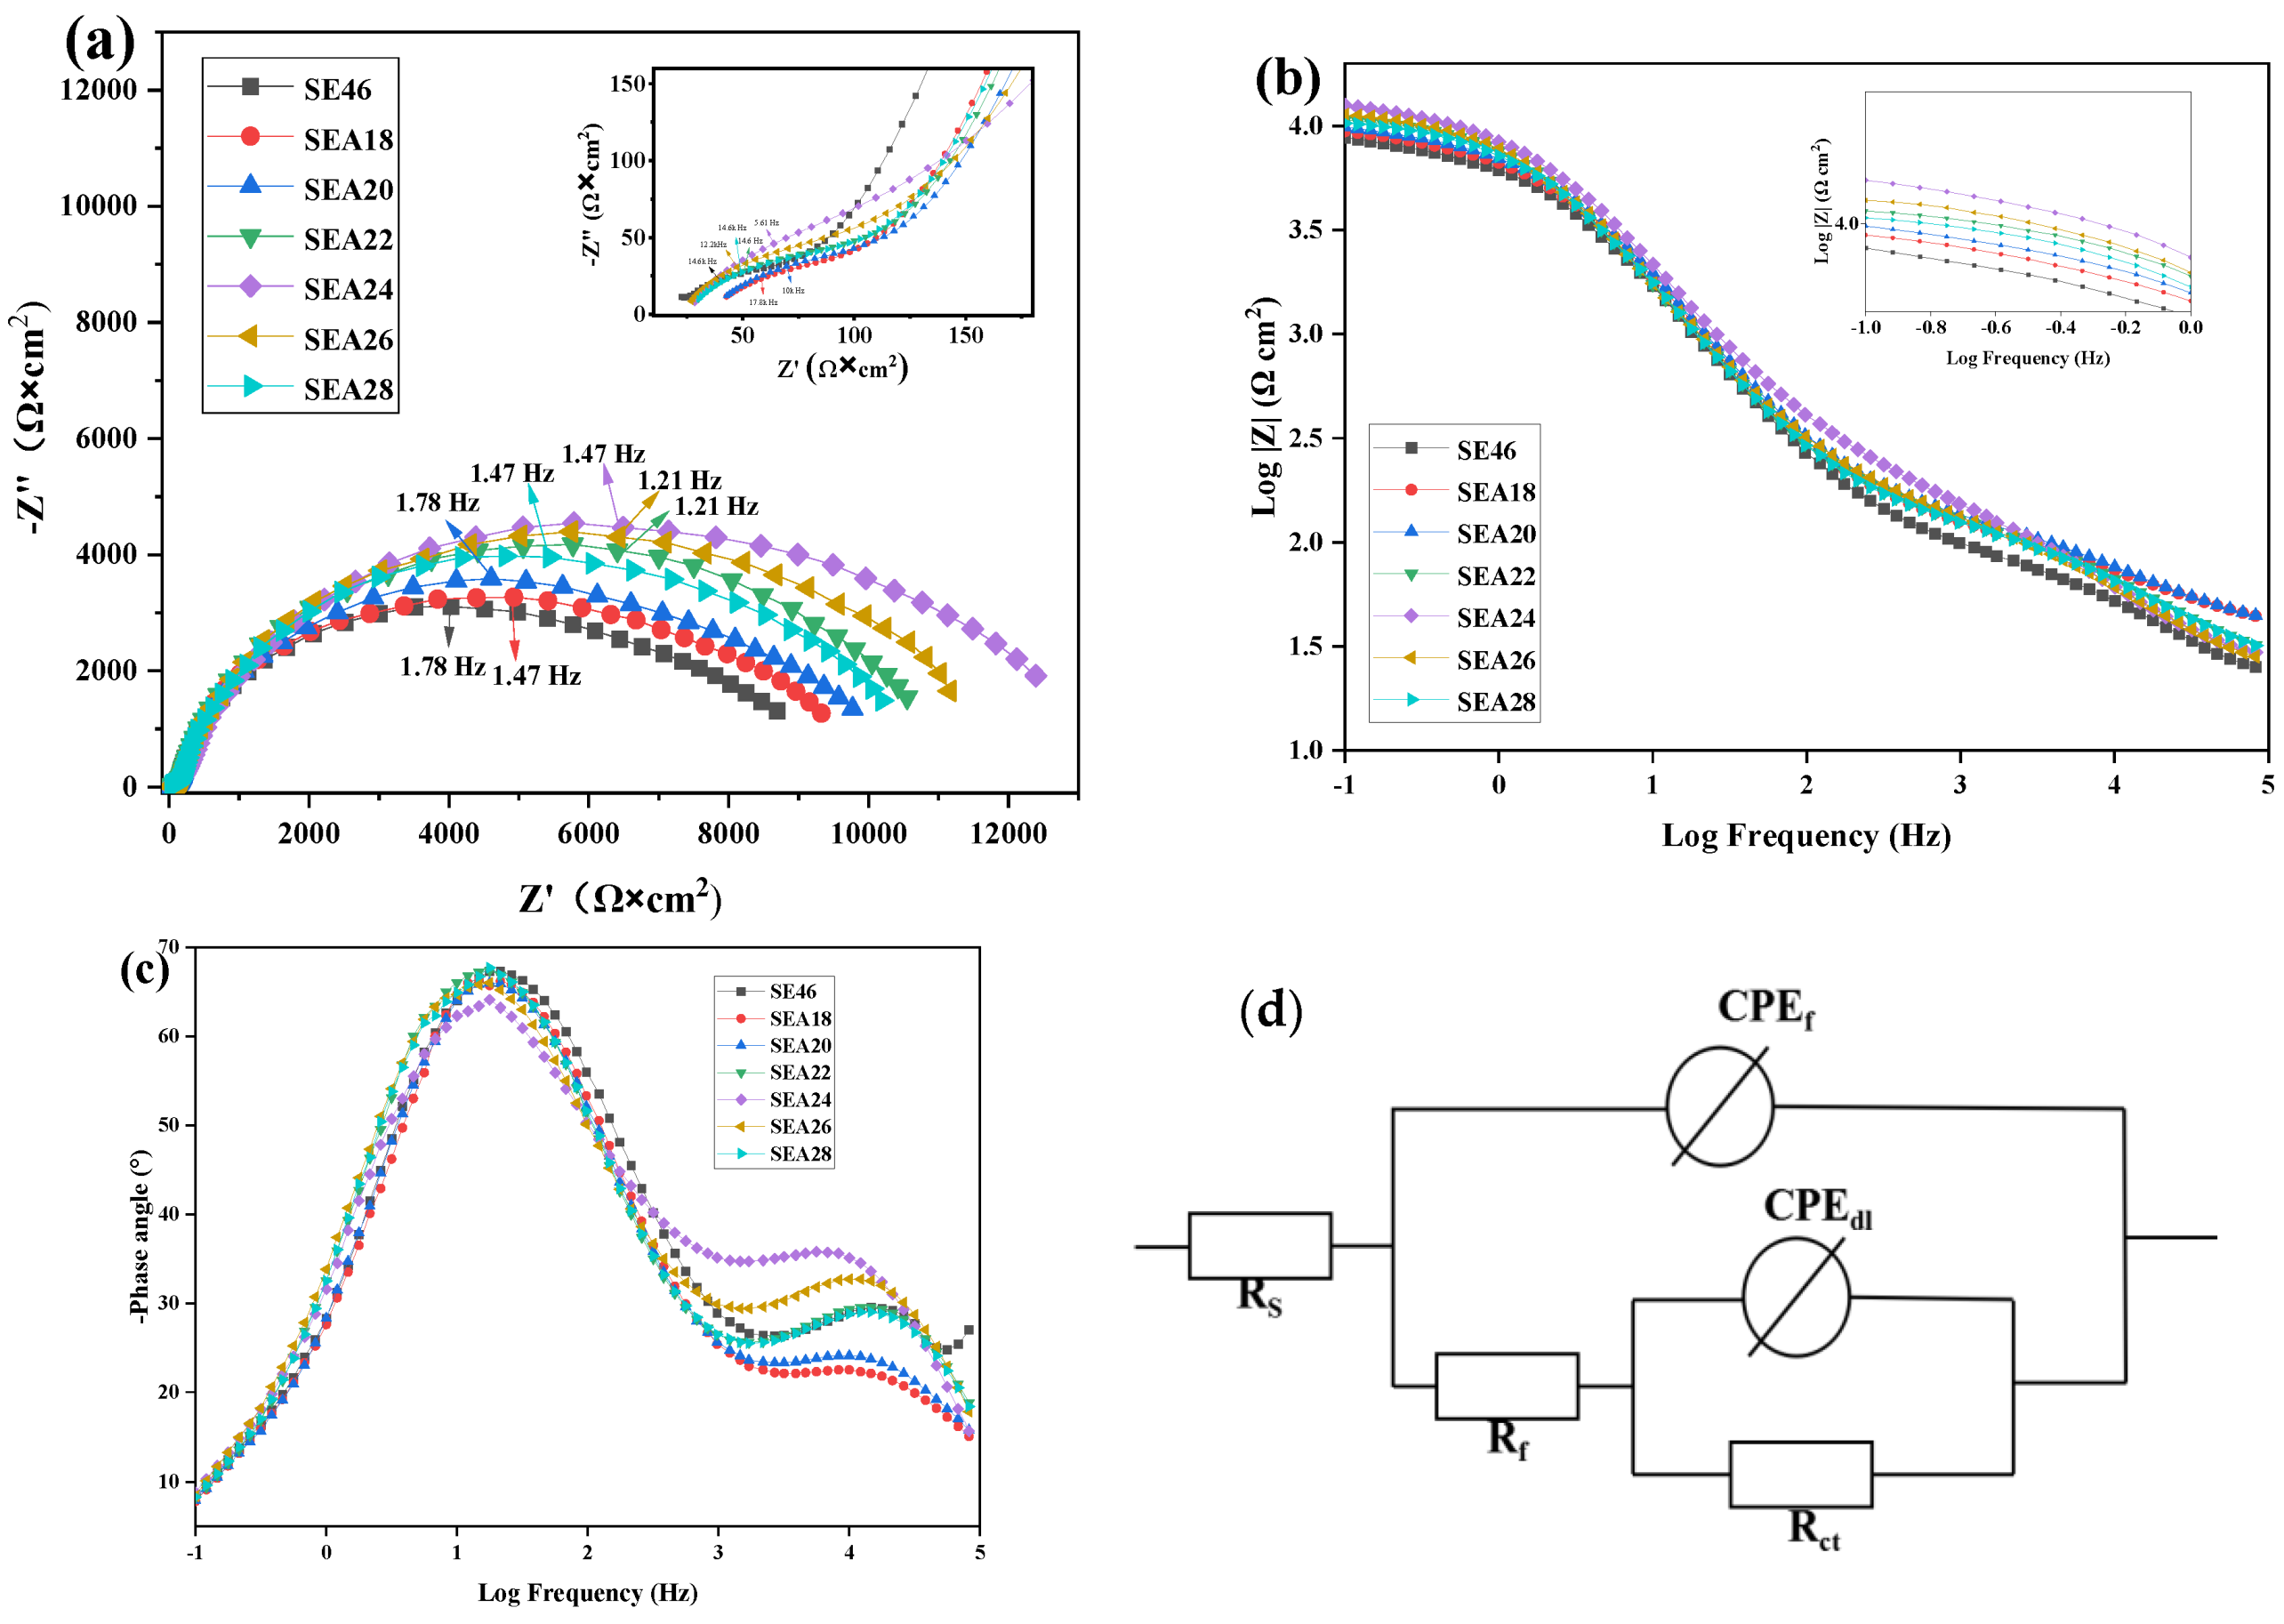
3.4. Electrochemical Properties

Figure 15 exhibits potentiodynamic polarization curves of Mg–2.0Zn–1.0Y–0.5Zr alloys annealed at different temperatures and immersed in SBF for 1 h at OCP. The corrosion potential (Ecorr), breakdown potential (Eb), and corrosion current (Icorr) obtained from polarization curves are listed in Table 3. Icorr was obtained by the Tafel extrapolation method and reflects corrosion rate. According to Faraday’s law, the greater the Icorr, the greater the corrosion rate and the worse the corrosion resistance [39]. The anodic polarization curves of all specimens presented weak passivation characteristics, which indicated that a protective corrosion product film was formed on their surfaces [68,69]. Ecorr and Icorr of extruded specimen SE46 were −1.592 V/SCE and 5.427 μA/cm2, respectively. After low-temperature annealing, Ecorr became positive and Icorr decreased. As shown in Figure 15 and Table 3, with the increase in the annealing temperature, Ecorr first shifted positively and then subsequently negatively, and Icorr first decreased and then increased. The specimen SEA24 annealed at 240 °C presented higher Ecorr and Eb values and a minimal Icorr, approximately −1.440 V/SCE, −1.244 V/SCE, and 2.454 μA/cm2, respectively, implying a more stable and dense protective film and a higher corrosion resistance. This was consistent with the weight loss test results.
The electrochemical corrosion rate of specimens could also be calculated by the Icorr value using the following formula [70]:
P i = 3270 I corr ρ V M
where Pi is the degradation rate (mm/y), Icorr is the corrosion current density (A/cm2), M is the molecular weight of the Mg alloy (g), V is the number of electrons lost during the oxidation reaction, and ρ is the measured density of Mg alloy (1000 kg/m3). It is shown that corrosion rates obtained by Icorr are consistent with those obtained by weight loss and hydrogen evolution, but for all specimens, those obtained by Icorr are markedly lower than those determined by weight loss and by hydrogen evolution. Shi et al. found similar results for the instantaneous corrosion rate [71,72]. This may have been caused by the fact that Pi is the instantaneous corrosion rate for 1 h whereas PW and Ph are the average corrosion rates for 5 days. On the other hand, Pi for specimen SEA24 is the lowest among all other specimens.
The EIS curves and equivalent circuit of Mg–2.0Zn–1.0Y–0.5Zr alloys annealed at different temperatures in SBF at OCP are shown in Figure 16, where the solid lines in Figure 16a–c represent the fitting results. The Nyquist plots of all specimens presented a compressed capacitive loop over the entire frequency range. However, as shown under local magnification, a capacitive arc was present in the high-frequency range. Furthermore, two peak values for all specimens could be observed from Bode phase angle in Figure 8c, corresponding to the presence of two capacitive loops in the corrosion process. The high-frequency loop was associated with charging in the interface, whereas the low-frequency loop was associated with charge transfer [73]. The high-frequency capacitive loop radius for extruded specimen SE46 was relatively small, as shown in the Nyquist plots in Figure 16a. After annealing, it aggrandized compared to extruded specimen SE46, first increasing and then decreasing with an increase in the annealing temperature. The variation trend of the low-frequency modulus |Z| in the specimens shown in Bode plots in Figure 16b was consistent with that of the high-frequency capacitive loops. The corrosion resistance of alloys typically relies on the magnitude of the capacitive arc modulus, where the larger the modulus, the greater the reaction resistance and the slower the anode alloy corrosion [74,75]. The large modulus value indicated a film with better integrity compared to the other specimens. Therefore, specimen SEA240 demonstrated the best corrosion resistance.
The EIS plots for all specimens could be interpreted using the equivalent circuit shown in Figure 16d, where Rs is the solution resistance between the reference electrode and working electrode, Rf and CPEf represent oxide film resistance and the constant phase element of product film, respectively [52,76], Rct describes the charge transfer resistance of interfacial reaction, and CPEdl denotes the electrochemical double layer/MgO barrier film capacitance at the substrate/electrolyte interface [53,77]. The equivalent circuit element values, obtained by ZSimpWin software (version 3.60), are listed in Table 4. The Rs values were all very low, and the corrosion rate was determined by the charge transfer resistance (Rct). The film resistance (Rf) and charge transfer resistance (Rct) of annealed specimens increased compared to extruded specimen SE46. Specifically, values first increased until 240 °C and then gradually decreased with increasing annealing temperature. The Rf and Rct values for specimen SEA24 reached their maxima at approximately 240 and 12,700 Ω/cm2, respectively, implying that specimen SEA24 had the best corrosion resistance. This could be attributed to the decrease in dislocation caused by annealing, leading to a decrease in the activation position in the active area.
The polarization resistance (Rp), defined as the zero-frequency impedance at −Z″ = 0 often assessed at f→0, is calculated using the following equation: Rp = Rf + Rt [78]. The corrosion rate density derived from EIS (IEIS) is calculated with the Stern–Geary equation [54,79]:
I EIS = b a b c 2.303 ( b a + b c ) R p
where ba and bc are the anodic and cathodic slopes of the polarization curve (mV/dec), respectively, which is measured soon after EIS measurement. The instantaneous corrosion rate Pi/EIS determined from IEIS is calculated using Equation (3), and the results are presented in Table 4. It can be seen that the Rp value of annealed specimens increased compared with that of extruded sample SE46, and the Rp value for specimen SEA24 is the lowest, implying the formation of a uniform and compact oxide film. For another, there was good consistency between Pi/EIS, determined from IEIS, and Pi obtained by Icorr, but Pi was slightly larger than Pi/EIS. Furthermore, Pi/EIS for specimen SEA24 was the lowest compared to other specimens.

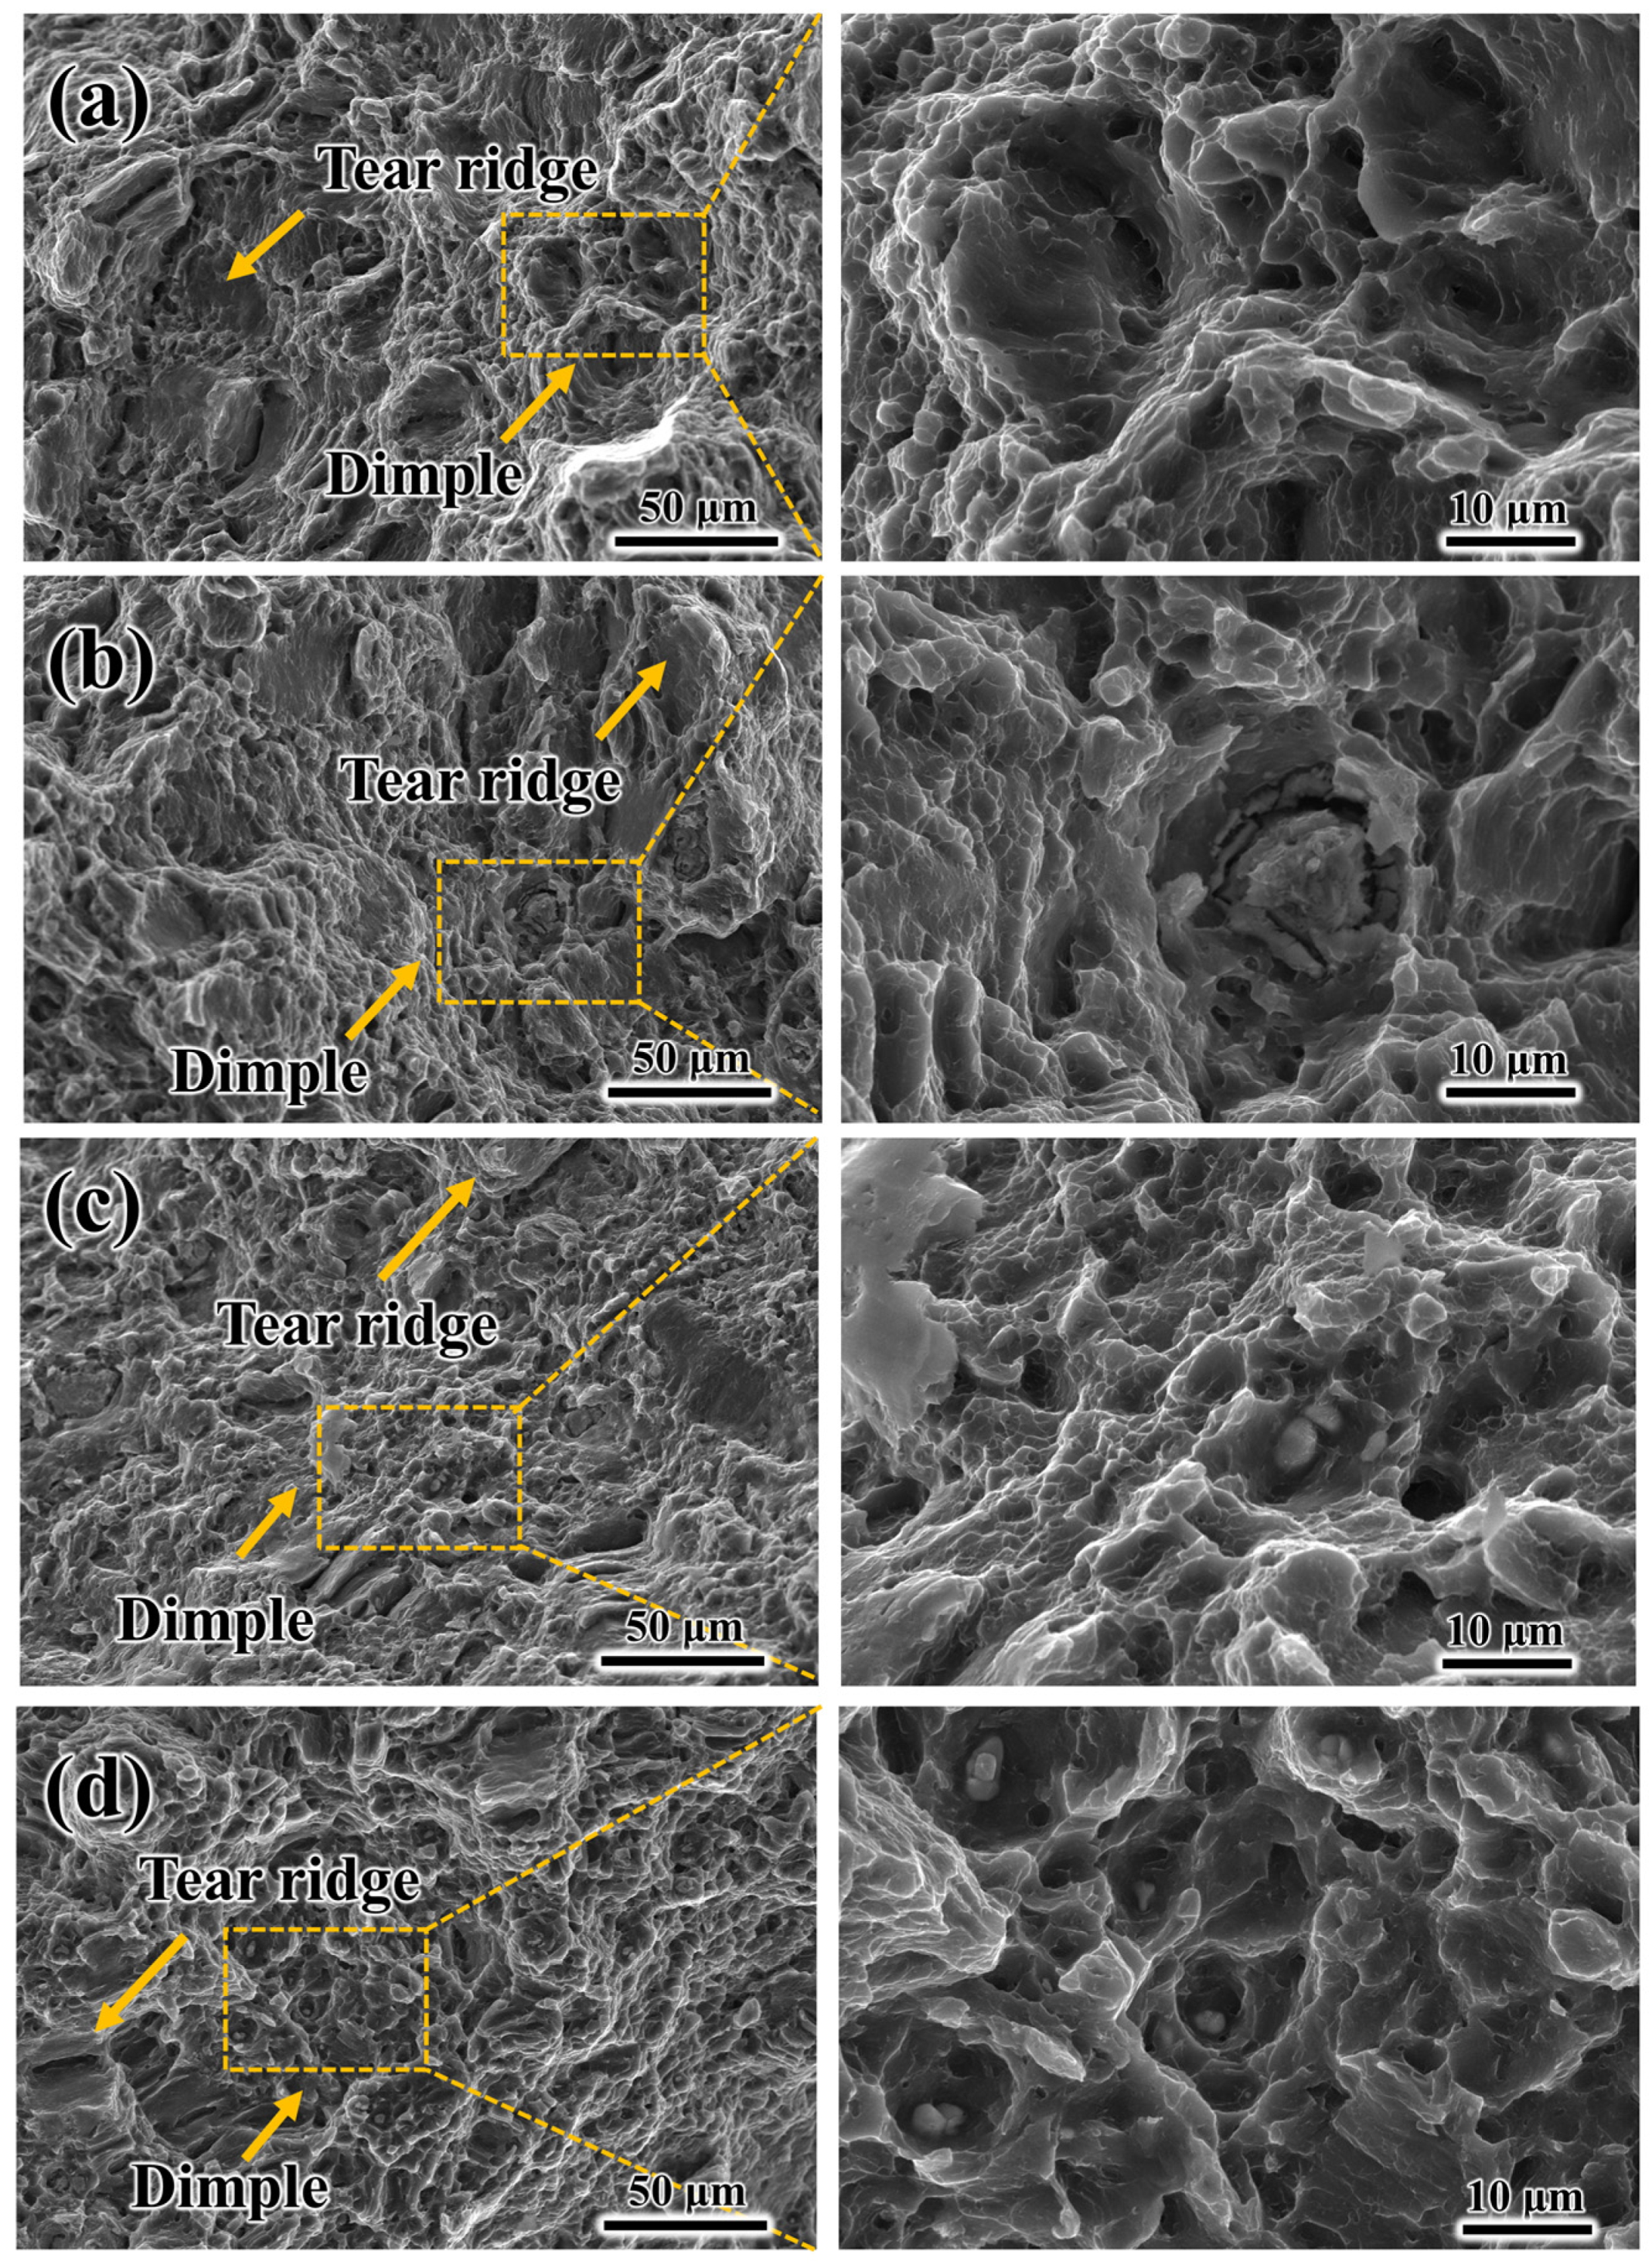
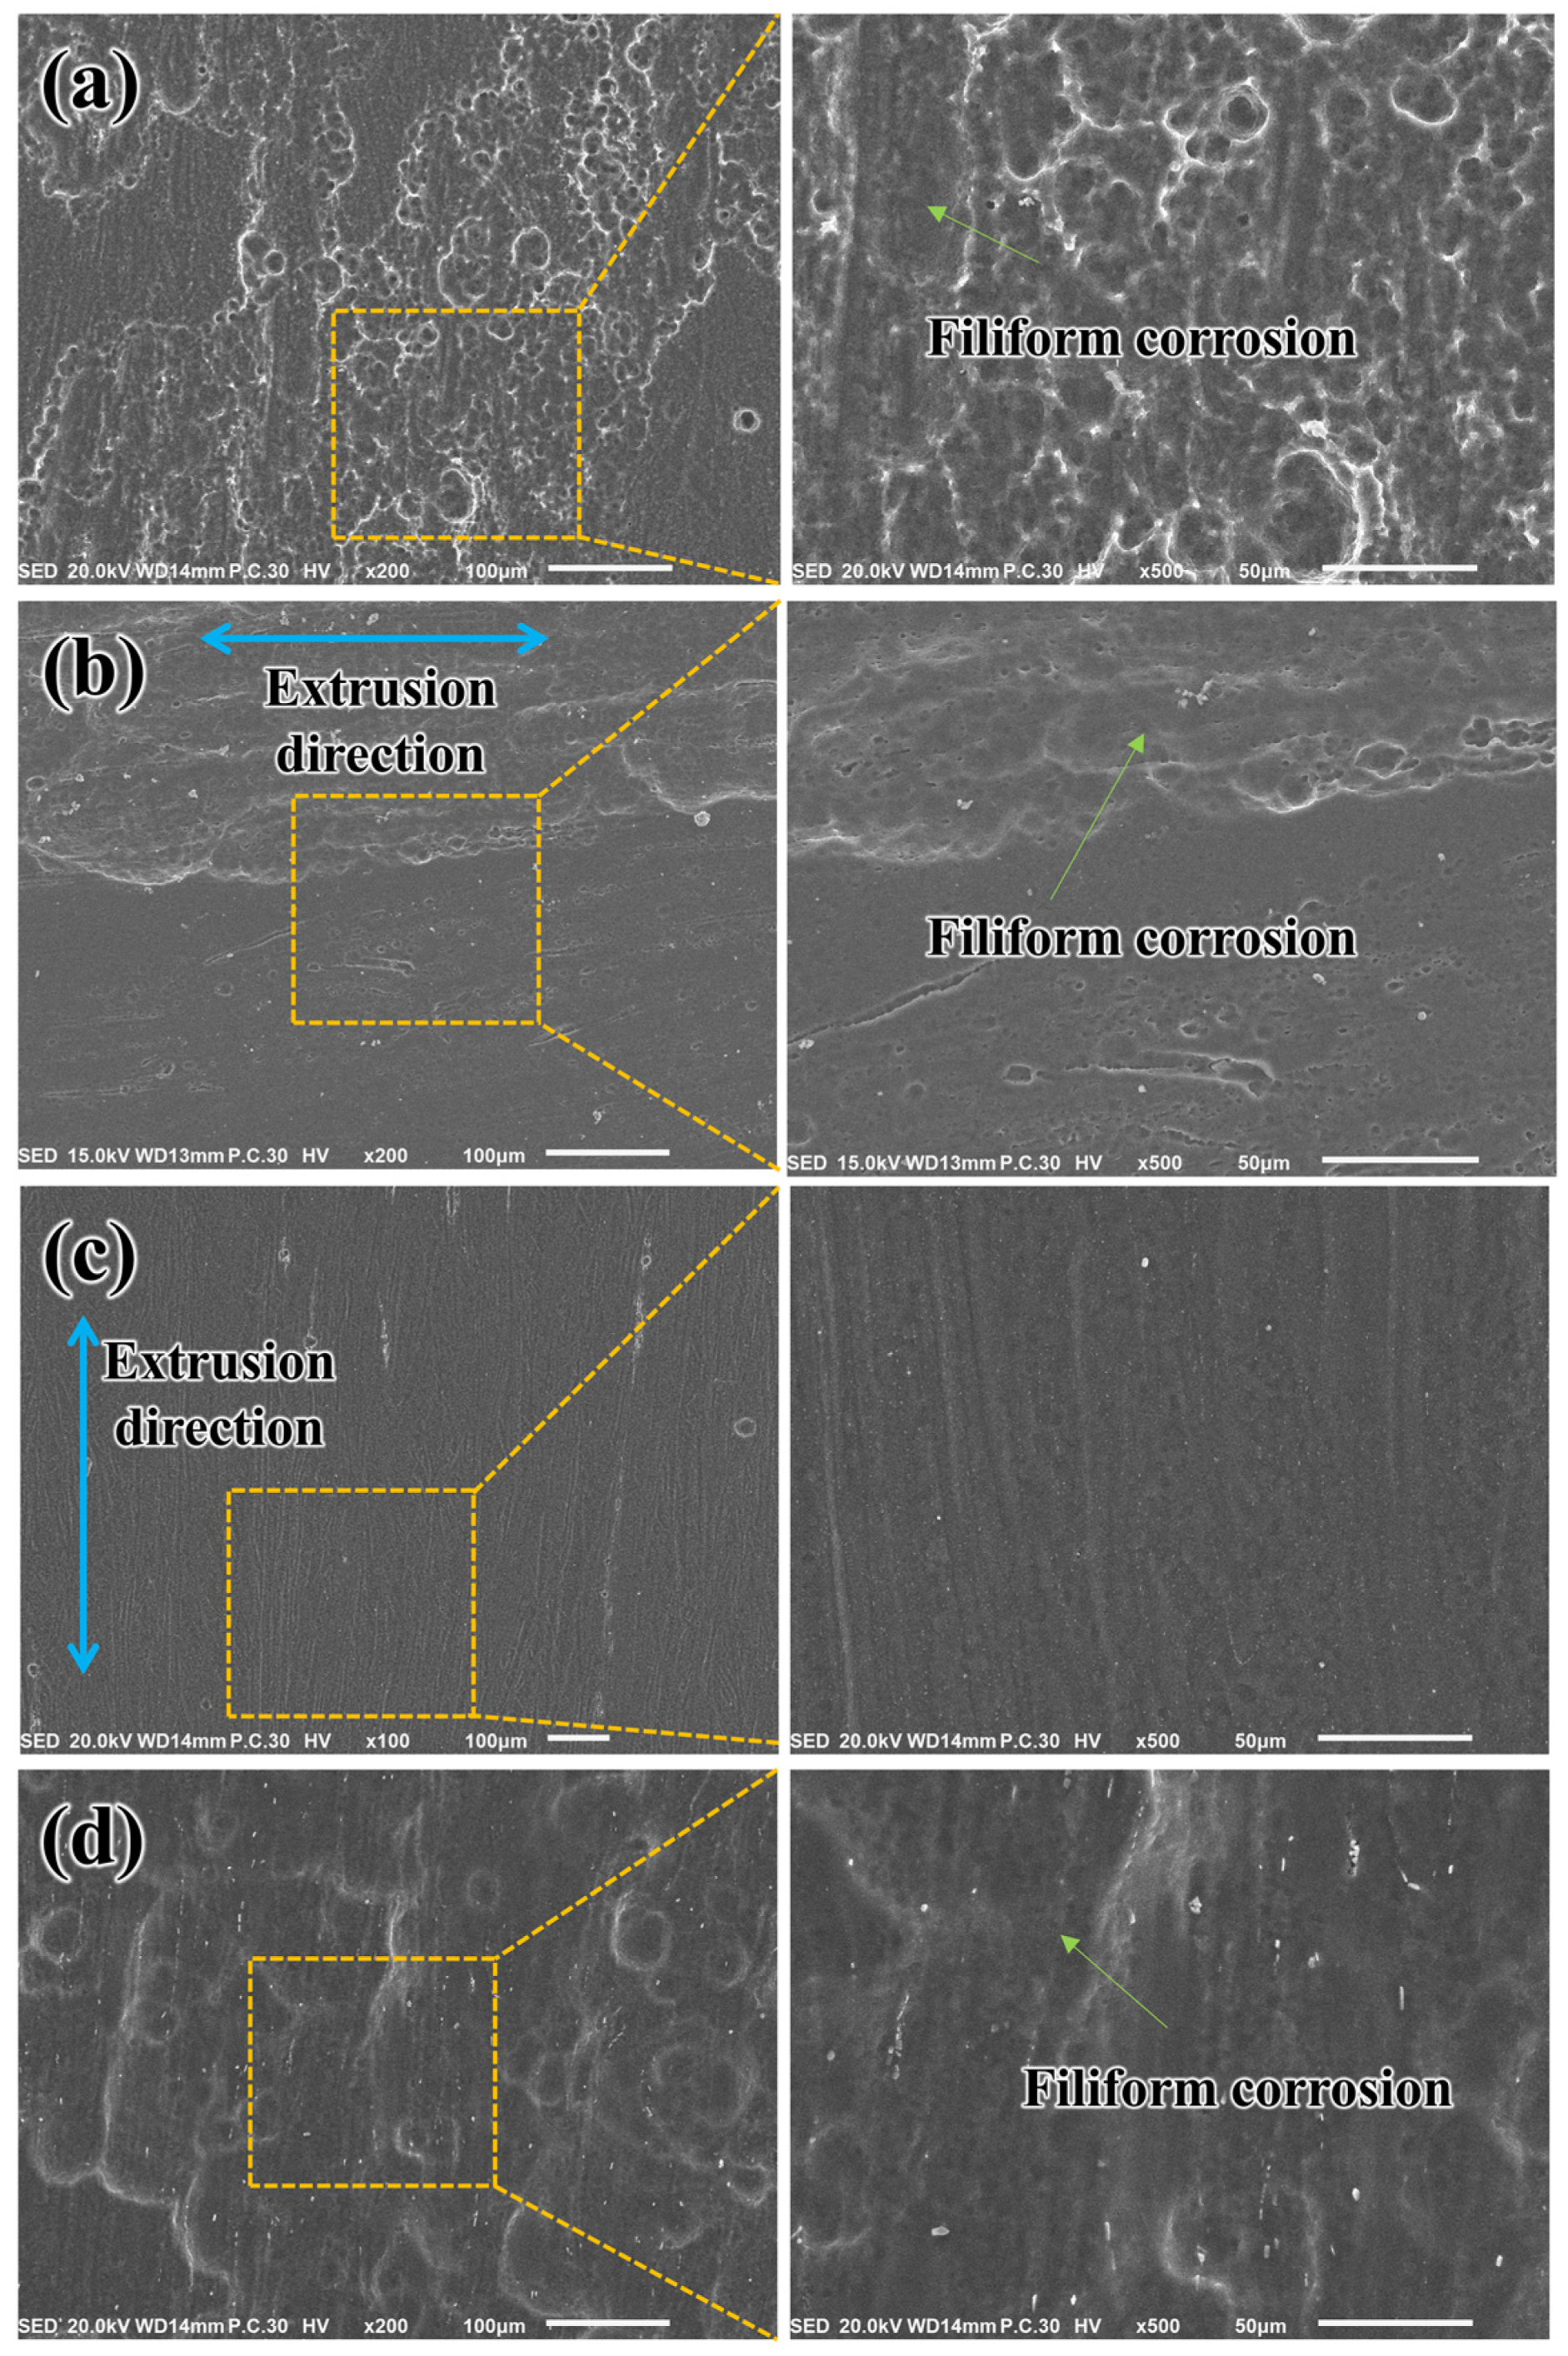
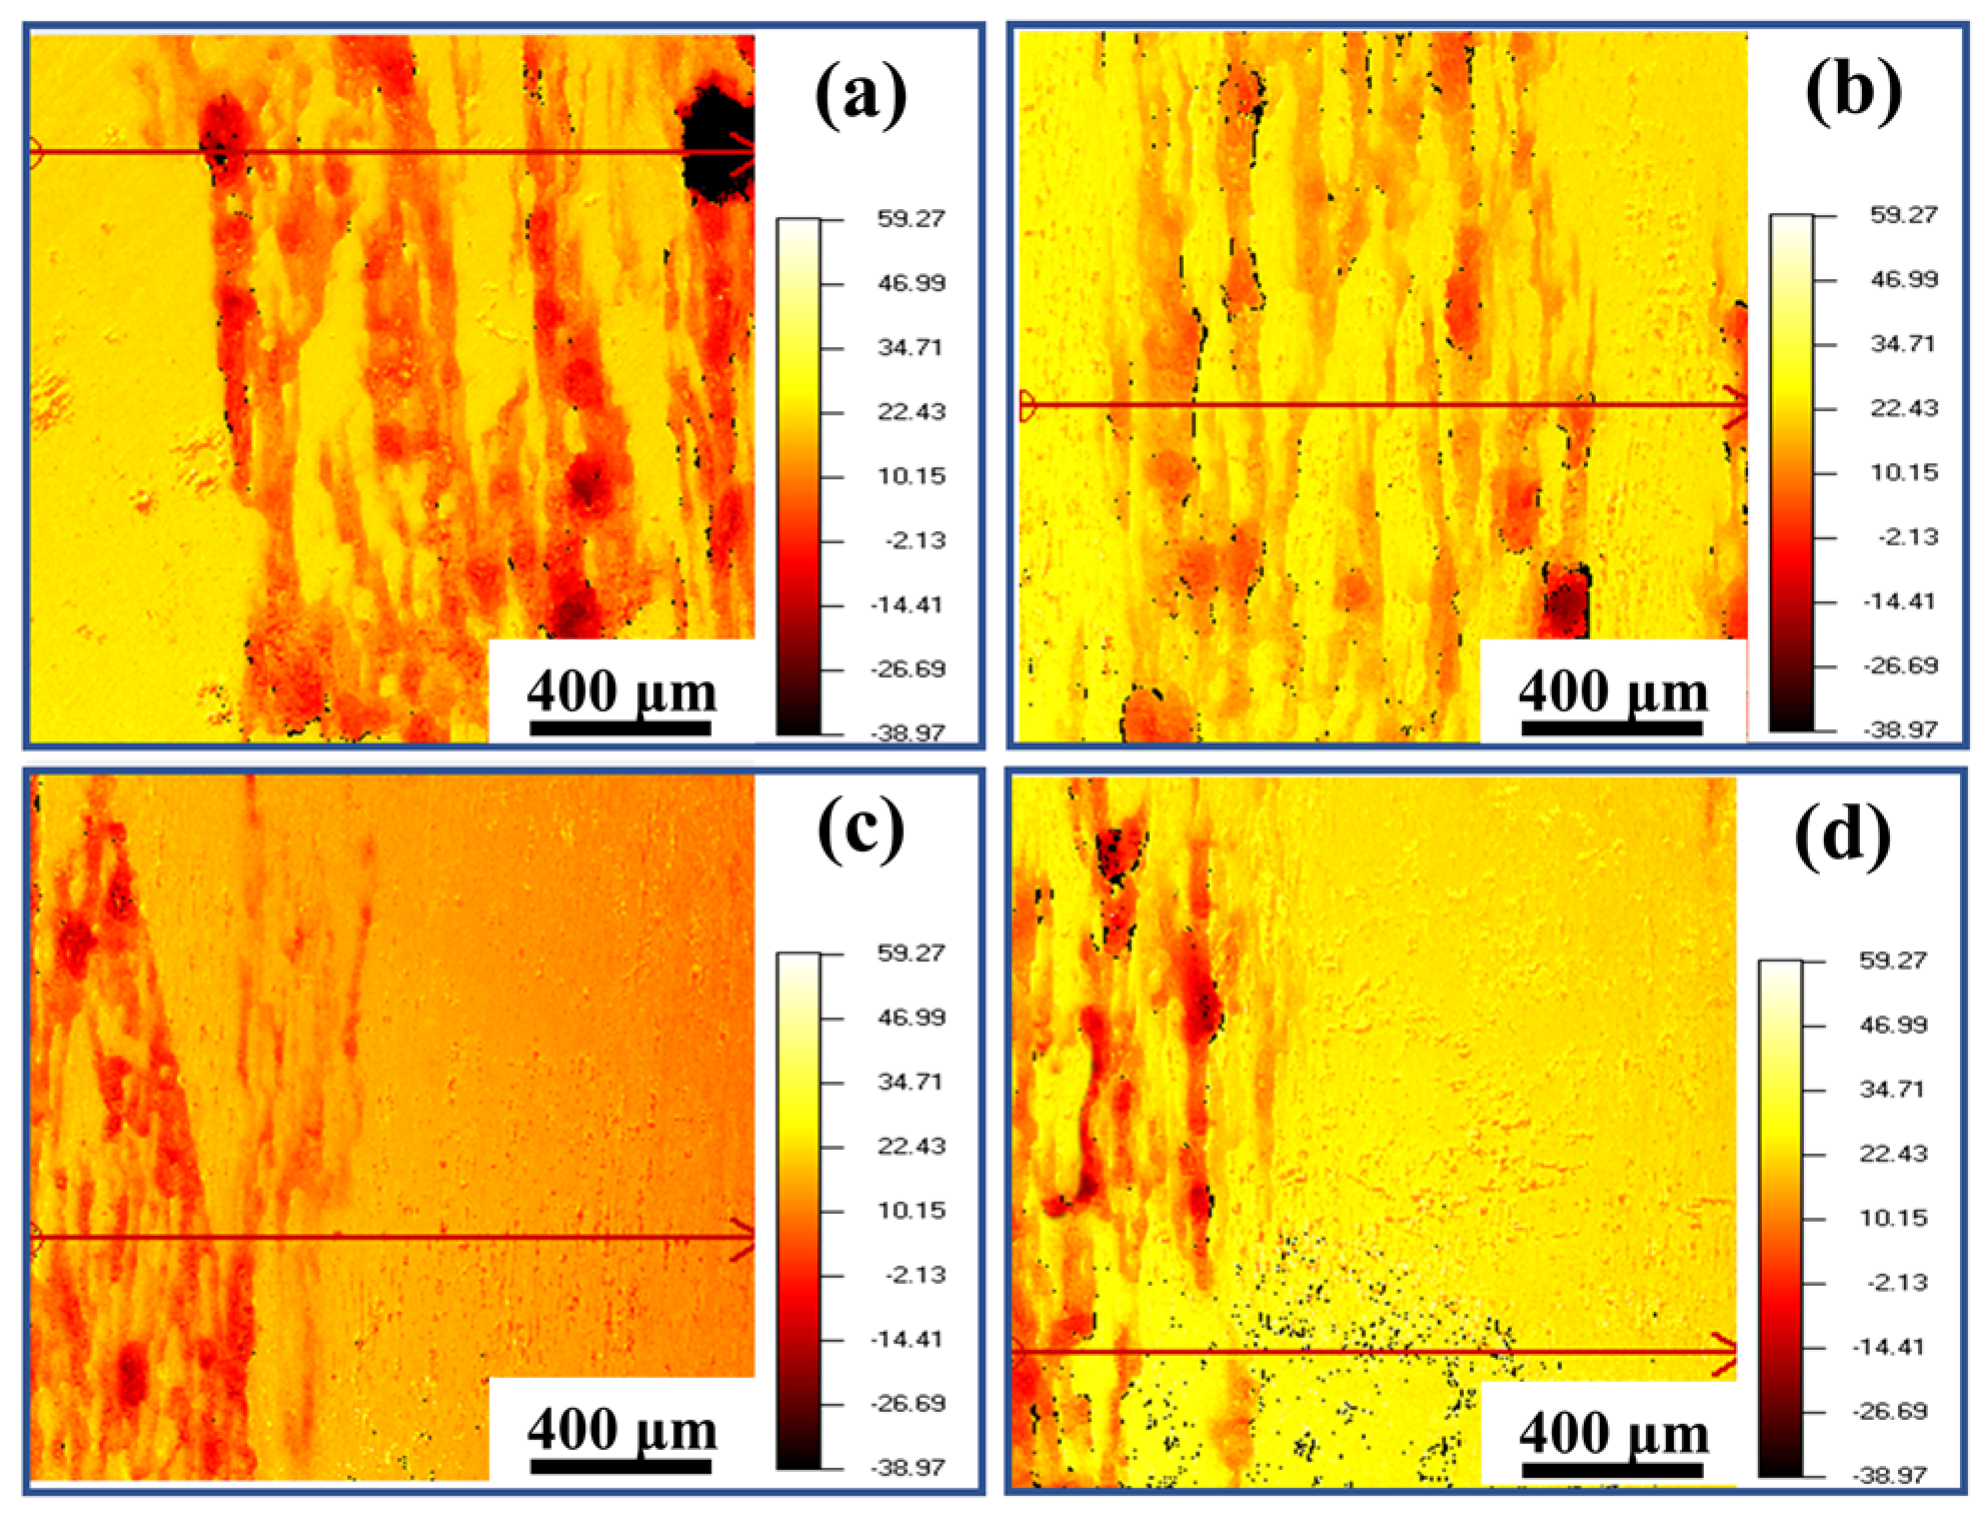
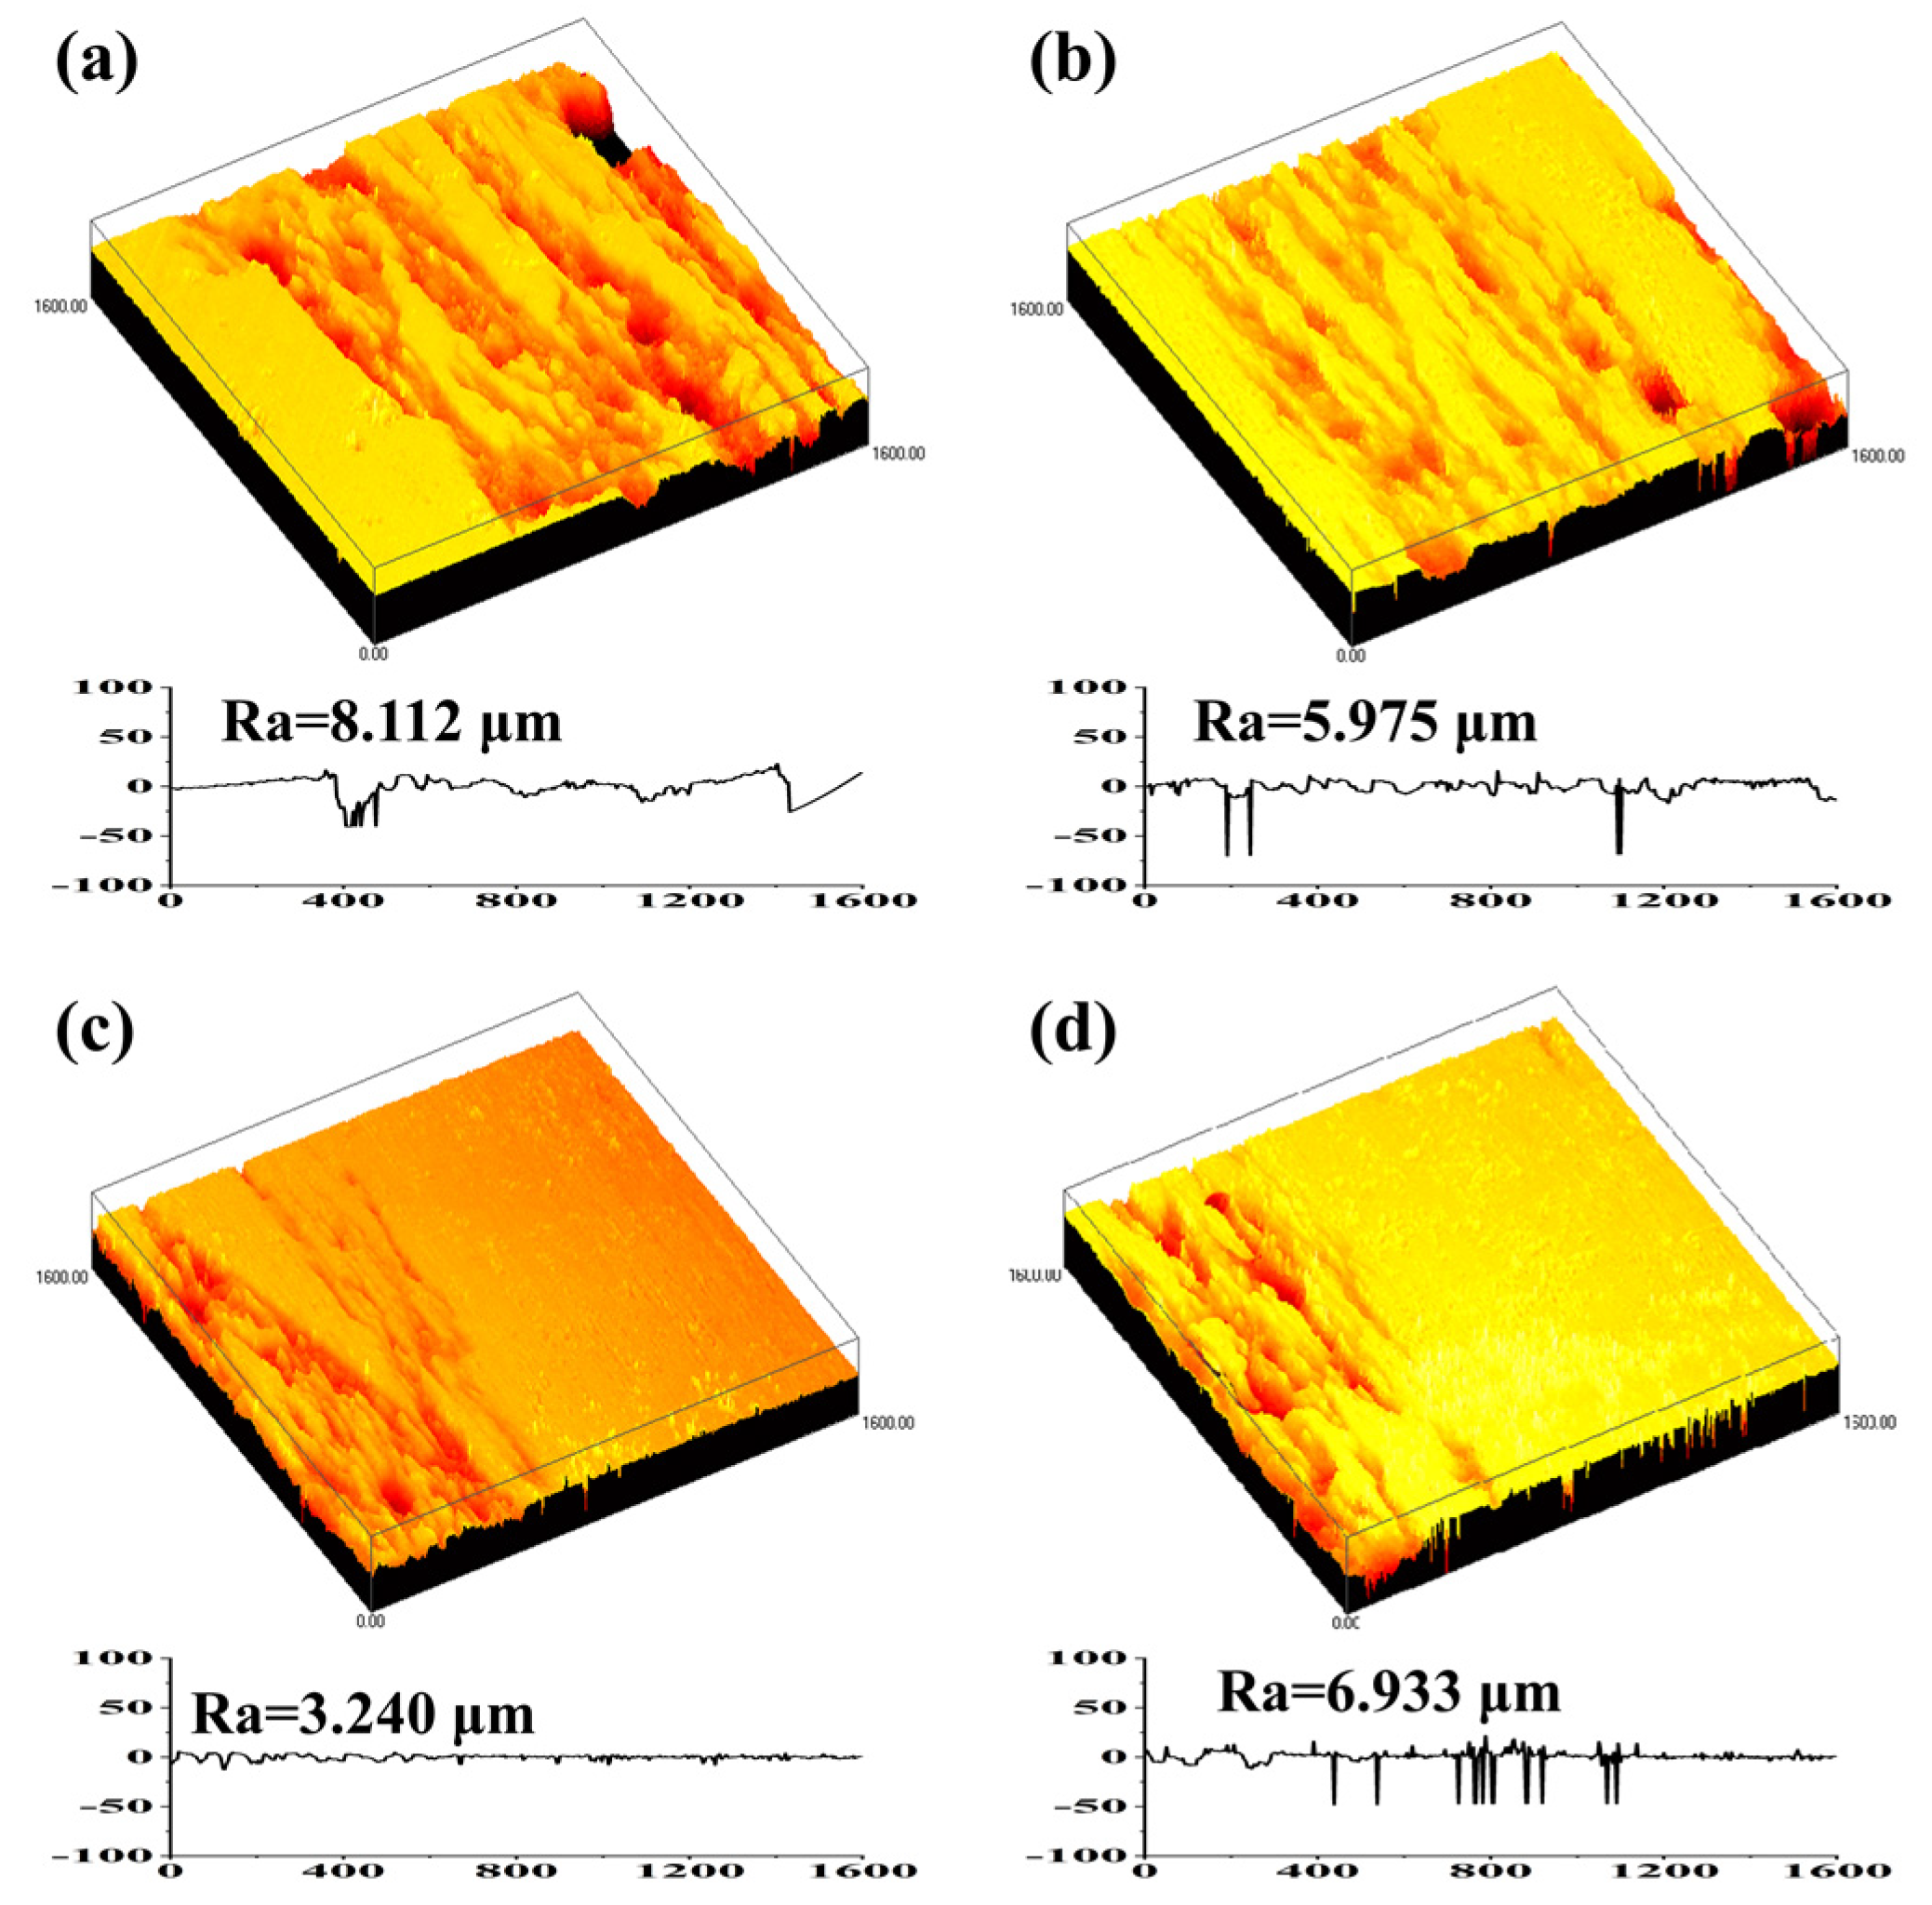
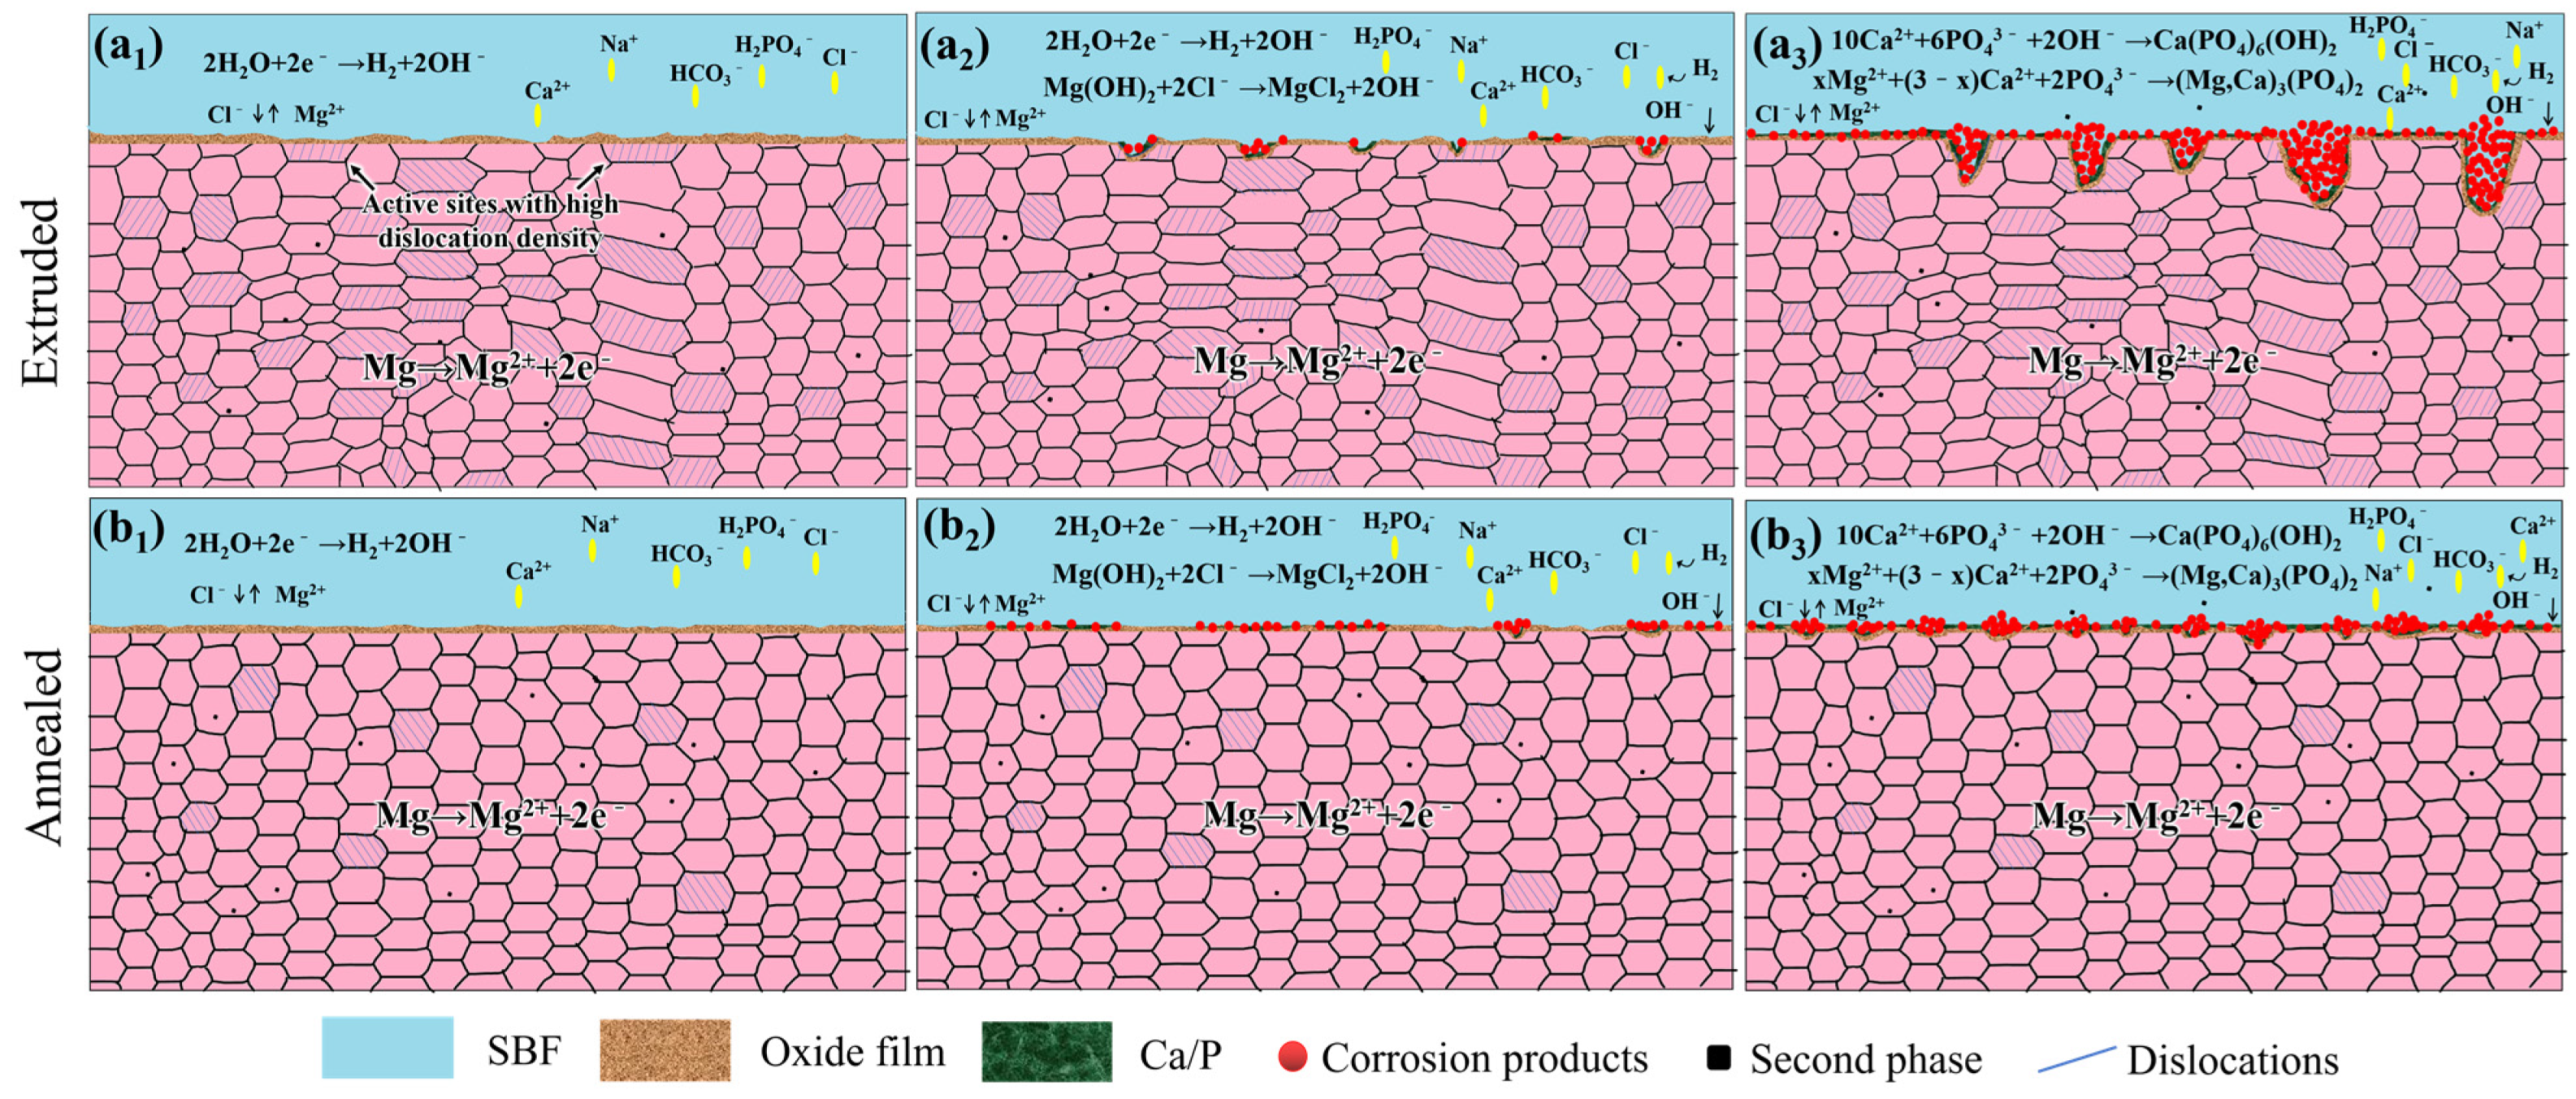
3.5. Corrosion Behavior

The corrosion behaviors of extruded Mg–2.0Zn–1.0Y–0.5Zr alloys before and after annealing in SBF showed distinct differences. Based on immersion experiments and electrochemical tests, corrosion models of extruded and annealed specimens in SBF are proposed in Figure 17.
Extruded specimen SE46 exhibited a bimodal grain structure and high dislocation density. The coarse-grain regions contained a weaker passive layer and higher dislocation density, causing them to become active sites and more susceptible to corrosion. Aggressive ions, such as needle-shaped chloride (Cl), locally and preferably attacked the weak sites of the oxide film at a dislocation ridge in coarse-grain regions. In addition, the potential difference between coarse and fine grains acted as a driving force for galvanic corrosion, with fine-grain regions acting as a micro-cathode and coarse-grain regions acting as a micro-anode. Establishing many micro-galvanic couples when the extruded specimen was in contact with the SBF solution resulted in the extruded specimen experiencing accelerated corrosion at coarse-grain regions. Corrosion propagated in succession along coarse-grain regions with a lower potential and weaker passive layer, forming filiform corrosion caused by competition between corrosive and passivating species with increasing immersion time. The coarse-grain regions with fewer grain boundaries also experienced localized corrosion, leading to the formation of large isolated pits. Finally, a pitting and filiform-type corrosion morphology formed, as shown in Figure 13a. Schematic diagrams of the corrosion behavior of extruded specimen SE46 following the corrosion process are shown in Figure 17(a1–a3).
After annealing at 240 °C for 4 h, the dislocation and bimodal grain structure in specimen SEA24 were nearly eliminated, and uniform and fine grains formed, which was favorable for the formation of a more uniform and compact oxide film. These conditions allowed the SEA24 specimen to exhibit a more positive potential and more uniform and compact oxide film. Weak portions of oxide film such as defects (e.g., dislocations) and the interface with a second phase and matrix formed active spots when specimen SEA24 was immersed in SBF, which was preferentially destroyed by Cl and dissolution. In contrast, the oxide film was uniformly destroyed, thus effectively slowing down the corrosion rate. When the matrix substrate came into contact with the SBF solution, the α-Mg matrix and dispersed W and I phases acted as the anode and cathode, respectively, leading to micro-galvanic corrosion. Moreover, an outer Ca/P film and an inner oxide film formed as corrosion products gradually deposited onto the SEA24 surface with increasing immersion time. In addition, the large volume fraction of grain boundaries combined with the fine grain size in specimen SEA24 provided protection from filiform-type attack and a lower corrosion rate, ensuring that the pits that formed were shallow and subsequently connected to each other, leading to the formation of uniform corrosion conditions. The specimen with uniform and fine grains was shown to corrode more uniformly compared to that with a bimodal grain structure (Figure 13c). Schematic diagrams showing the corrosion behavior of annealed specimen SEA24 are presented in Figure 17(b1–b3).
Different techniques were used to measure the corrosion rate. Among them, electrochemical tests are suitable for qualitative comparison, and weight loss and hydrogen evolution tests are suitable for quantitative comparison.

4. Conclusions

Based on the investigation of the microstructure, properties and corrosion resistance of Mg–2.0Zn–1.0Y–0.5Zr alloys, the main conclusions are as follows:
(1)
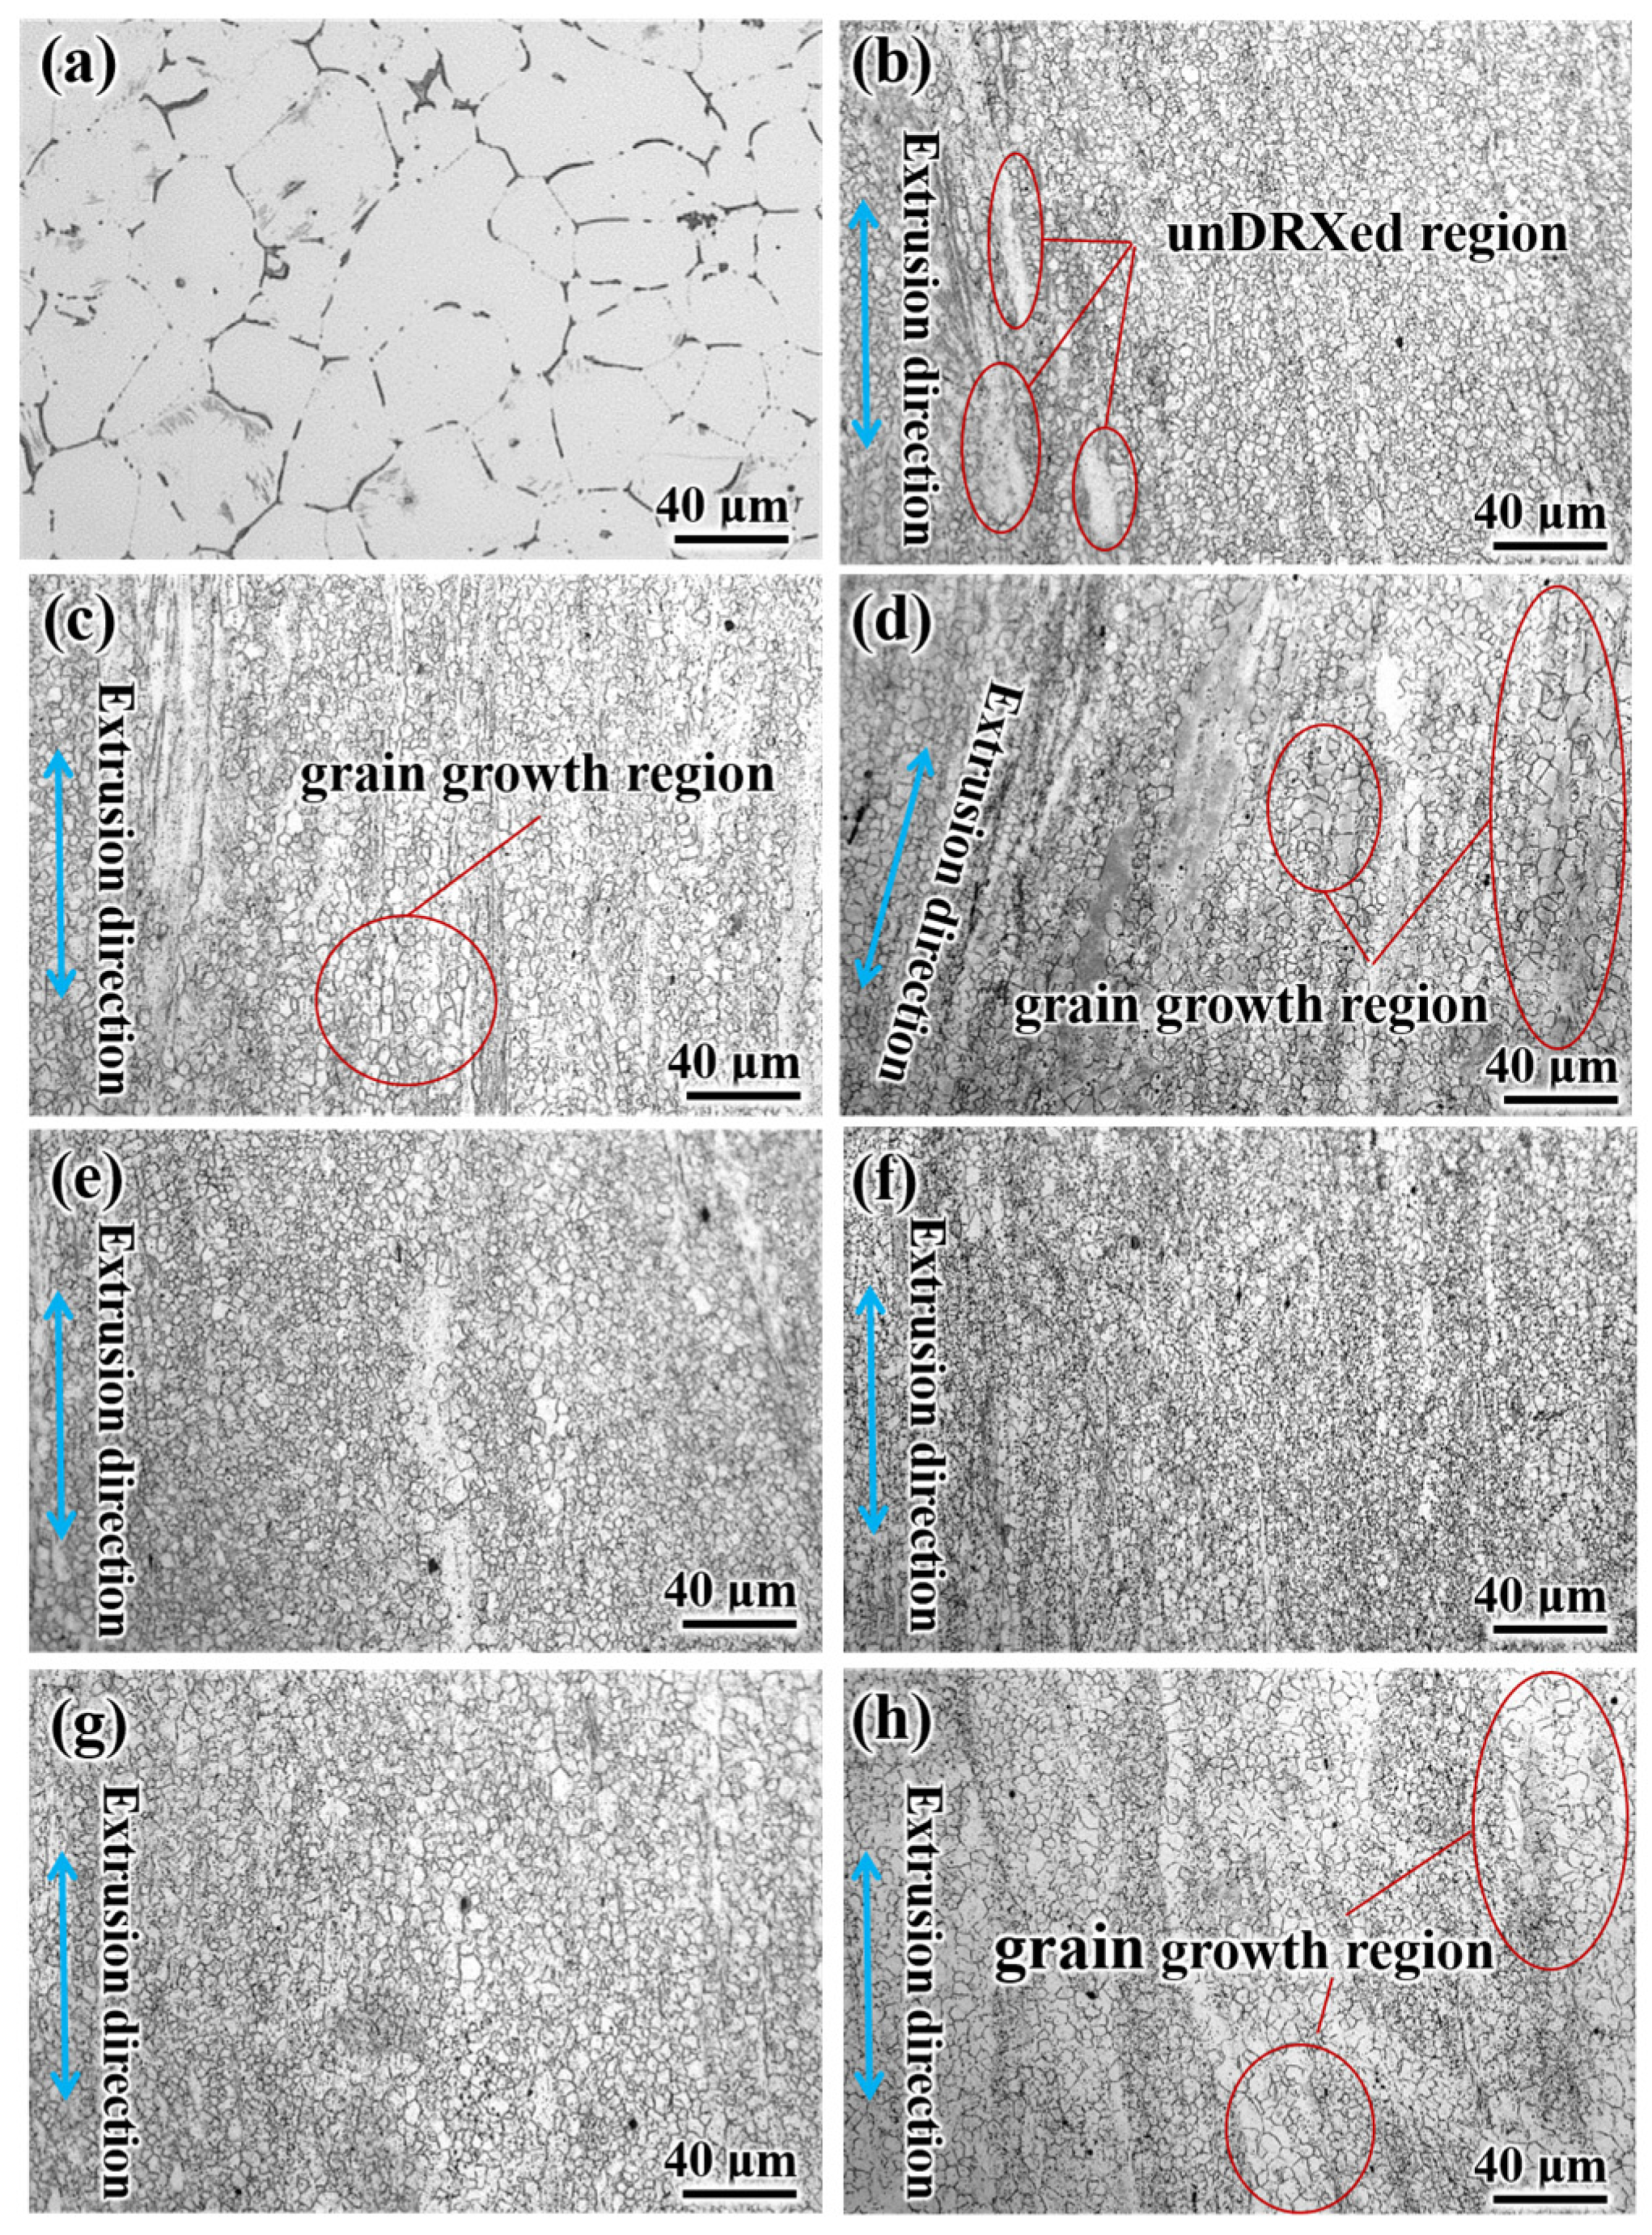
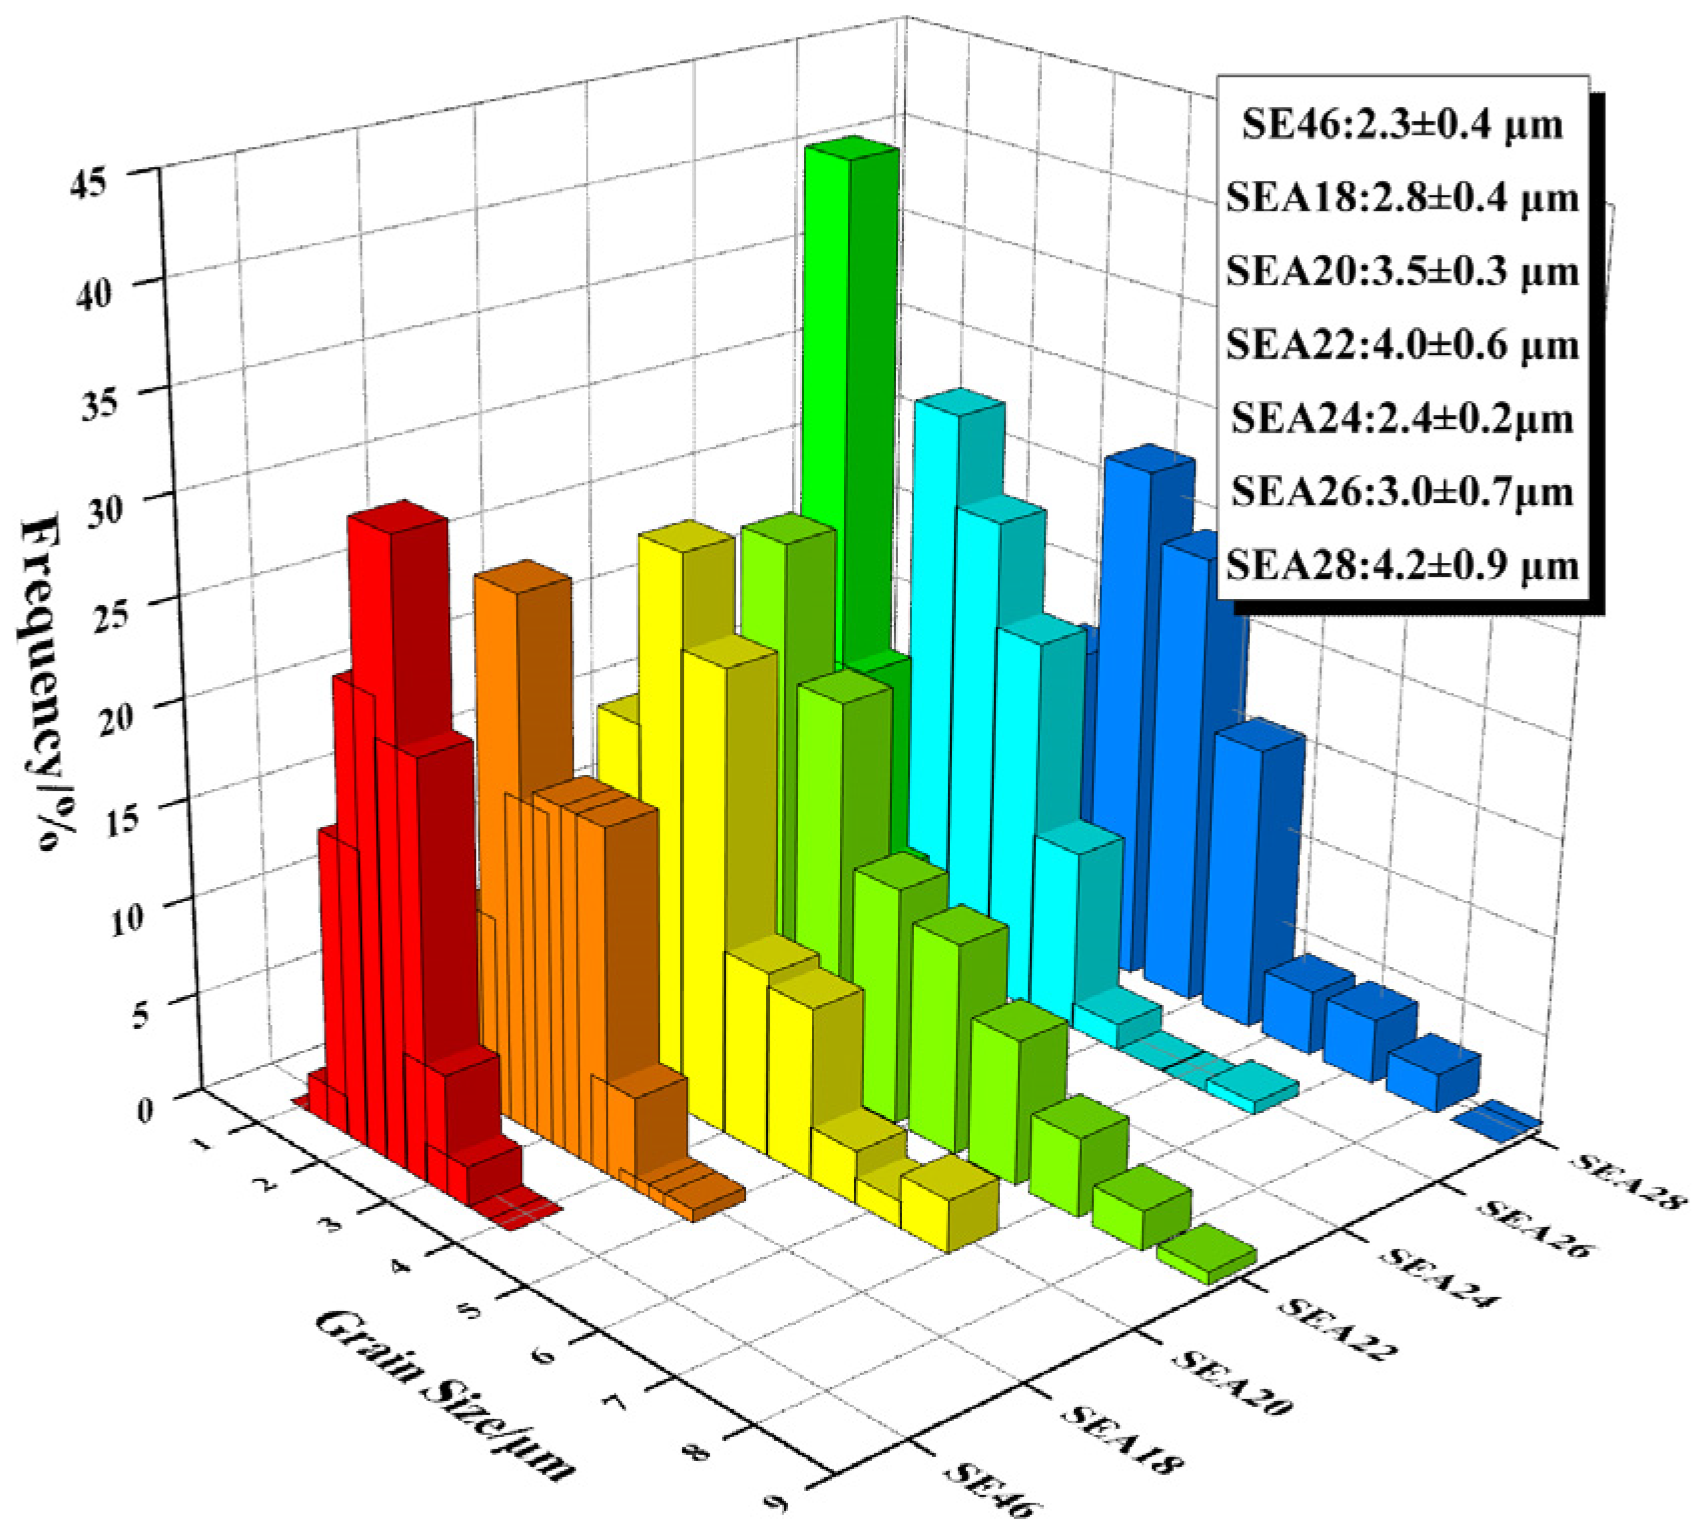
After annealing at different temperatures for 4 h, the recrystallization degree and grain size of extruded Mg–2.0Zn–1.0Y–0.5Zr alloys change with increasing temperature. When the annealing temperature is 220 °C, the grain size increases by 1.7 μm compared with the extruded alloy. When the annealing temperature is 240 °C, recrystallization is complete and the equiaxed grain size is 2.4 ± 0.2 μm. When the temperature rises to 280 °C, the grain size gradually grows to 4.2 ± 0.9 μm.
(2)
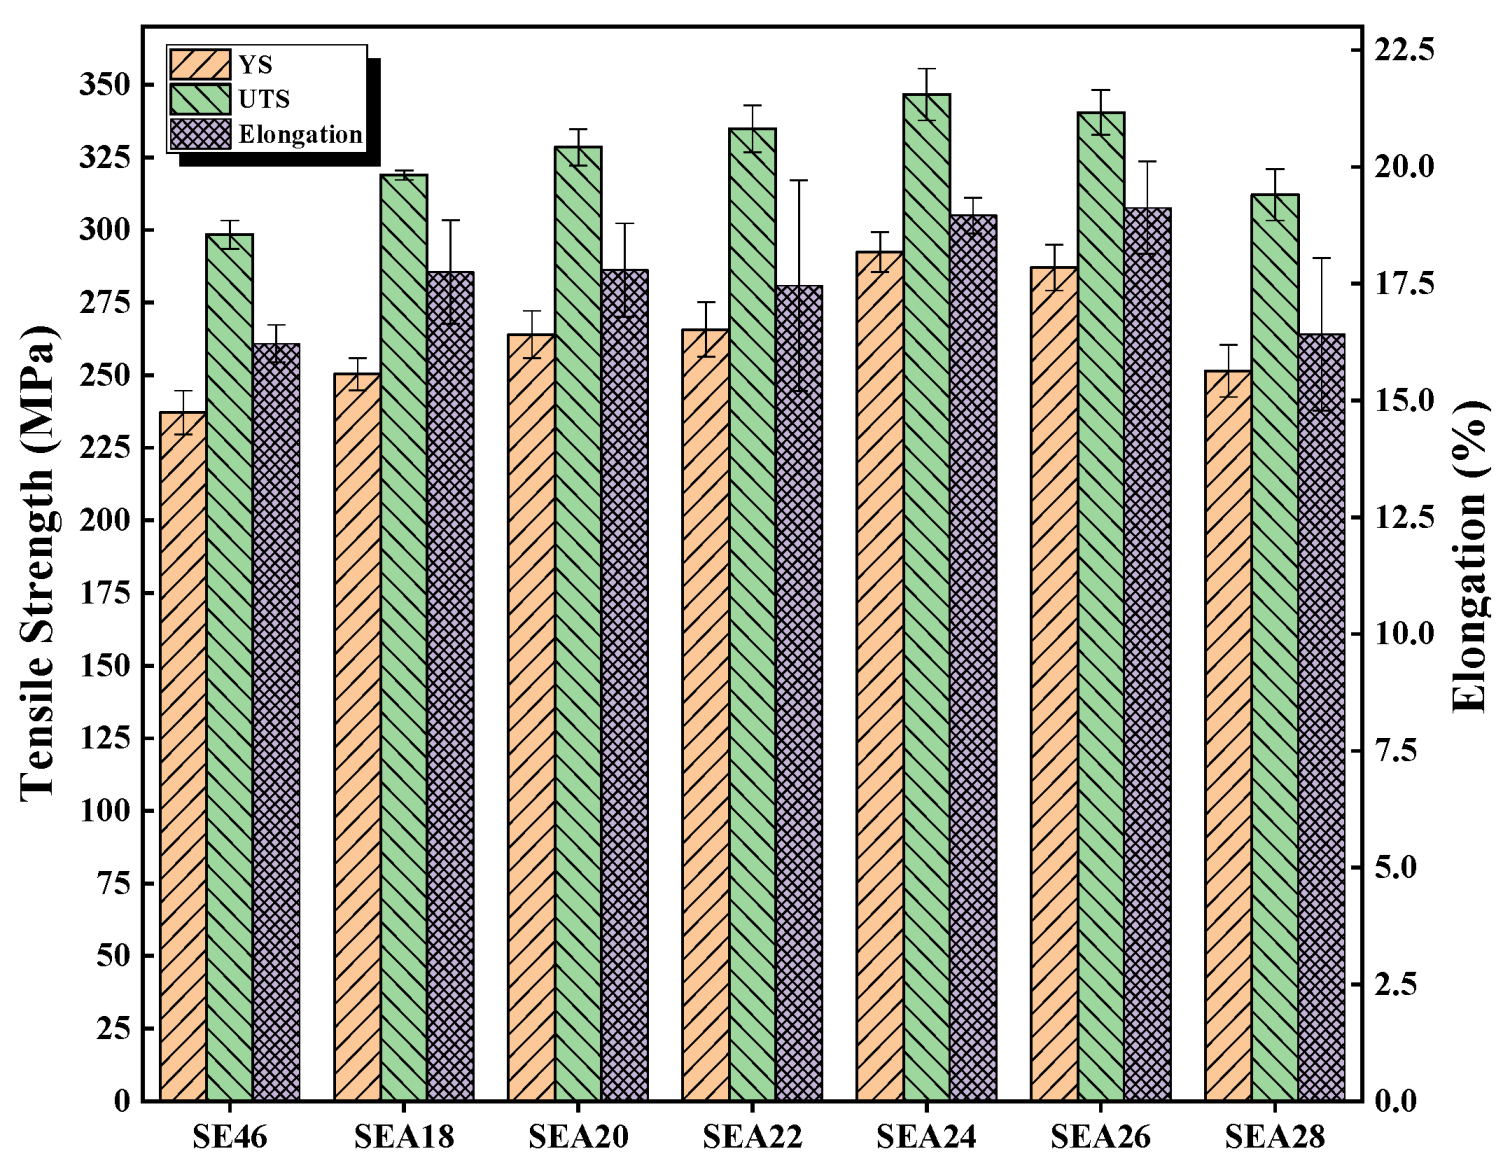
The mechanical properties and corrosion resistance of annealed alloys are enhanced due to grain refinement and the reduced dislocation density. When the annealing temperature is 240 °C, the alloy has the highest corrosion resistance and best mechanical properties, with an Rw, UTS, YS, and EL of 0.454 ± 0.023 mm/y, 346.7 ± 8.9 MPa, 292.4 ± 6.9 MPa, and 19.0 ± 0.4%, respectively.
(3)
With the increase in the annealing temperature, Icorr first decreases and then increases, Ecorr first shifts to positive values and then to negative values, and the capacitive arc modulus first increases and then decreases. The alloy annealed at 240 °C has the maximal arc radius, the lowest Icorr value, and the maximal Ecorr value.

Author Contributions

Conceptualization, J.W.; formal analysis, J.H. and P.T.; data curation, X.Z.; writing—original draft, Z.C.; writing—review & editing, W.F. and Y.G. All authors have read and agreed to the published version of the manuscript.

Funding

This work was supported by the Henan New Nonferrous Metal Materials University Science and Technology Innovation Team Support Program of China (2012IRTSTHN008), the Henan Provincial Natural Science Foundation (242300420018), the Henan Key Laboratory of Non-ferrous Materials Science and Processing Technology.

Data Availability Statement

The original contributions presented in the study are included in the article, further inquiries can be directed to the corresponding author.

Conflicts of Interest

The authors declare no conflicts of interest.

References

  1. Nagels, J.; Stokdijk, M.; Rozing, P.M. Stress Shielding and Bone Resorption in Shoulder Arthroplasty. J. Shoulder Elb. Surg. 2003, 12, 35–39. [Google Scholar] [CrossRef]
  2. Zhou, J.; Li, Q.; Zhang, H.; Chen, F. Corrosion Behavior of AZ91D Magnesium Alloy in Three Different Physiological Environments. J. Mater. Eng Perform. 2014, 23, 181–186. [Google Scholar] [CrossRef]
  3. Li, J.; Tan, L.; Wan, P.; Yu, X.; Yang, K. Study on Microstructure and Properties of Extruded Mg–2Nd–0.2Zn Alloy as Potential Biodegradable Implant Material. Mater. Sci. Eng. C 2015, 49, 422–429. [Google Scholar] [CrossRef] [PubMed]
  4. Jiang, W.; Wu, D.; Dong, W.; Ding, J.; Ye, Z.; Zeng, P.; Gao, Y. Design and Validation of a Nonparasitic 2R1T Parallel Hand-Held Prostate Biopsy Robot With Remote Center of Motion. J. Mech. Robot. 2023, 16, 051009. [Google Scholar] [CrossRef]
  5. Li, H.; Wen, J.; Liu, Y.; He, J.; Shi, H.; Tian, P. Progress in Research on Biodegradable Magnesium Alloys: A Review. Adv. Eng. Mater. 2020, 22, 2000213. [Google Scholar] [CrossRef]
  6. Farraro, K.E.; Kim, K.E.; Woo, S.L.-Y.; Flowers, J.R.; McCullough, M.B. Revolutionizing Orthopaedic Biomaterials: The Potential of Biodegradable and Bioresorbable Magnesium-Based Materials for Functional Tissue Engineering. J. Biomech. 2014, 47, 1979–1986. [Google Scholar] [CrossRef]
  7. Munir, K.; Lin, J.; Wen, C.; Wright, P.F.A.; Li, Y. Mechanical, Corrosion, and Biocompatibility Properties of Mg-Zr-Sr-Sc Alloys for Biodegradable Implant Applications. Acta Biomater. 2020, 102, 493–507. [Google Scholar] [CrossRef] [PubMed]
  8. Chen, Y.; Dou, J.; Yu, H.; Chen, C. Degradable Magnesium-Based Alloys for Biomedical Applications: The Role of Critical Alloying Elements. J. Biomater. Appl. 2019, 33, 1348–1372. [Google Scholar] [CrossRef]
  9. Zhou, W.; Shen, T.; Aung, N.N. Effect of Heat Treatment on Corrosion Behaviour of Magnesium Alloy AZ91D in Simulated Body Fluid. Corros. Sci. 2010, 52, 1035–1041. [Google Scholar] [CrossRef]
  10. Caceres, C.H.; Mann, G.E.; Griffiths, J.R. Grain Size Hardening in Mg and Mg-Zn Solid Solutions. Metall. Mater. Trans. A-Phys. Metall. Mater. Sci. 2011, 42A, 1950–1959. [Google Scholar] [CrossRef]
  11. Choudhary, L.; Raman, R.K.S. Magnesium Alloys as Body Implants: Fracture Mechanism under Dynamic and Static Loadings in a Physiological Environment. Acta Biomater. 2012, 8, 916–923. [Google Scholar] [CrossRef]
  12. Zhang, E.; Yin, D.; Xu, L.; Yang, L.; Yang, K. Microstructure, Mechanical and Corrosion Properties and Biocompatibility of Mg–Zn–Mn Alloys for Biomedical Application. Mater. Sci. Eng. C 2009, 29, 987–993. [Google Scholar] [CrossRef]
  13. Song, Y.; Han, E.-H.; Shan, D.; Yim, C.D.; You, B.S. The Effect of Zn Concentration on the Corrosion Behavior of Mg–xZn Alloys. Corros. Sci. 2012, 65, 322–330. [Google Scholar] [CrossRef]
  14. Ding, Y.; Wen, C.; Hodgson, P.; Li, Y. Effects of Alloying Elements on the Corrosion Behavior and Biocompatibility of Biodegradable Magnesium Alloys: A Review. J. Mater. Chem. B 2014, 2, 1912–1933. [Google Scholar] [CrossRef]
  15. Xing, F.; Guo, F.; Su, J.; Zhao, X.; Cai, H. The Existing Forms of Zr in Mg-Zn-Zr Magnesium Alloys and Its Grain Refinement Mechanism. Mater. Res. Express 2021, 8, 066516. [Google Scholar] [CrossRef]
  16. Singh Raman, R.K. The Role of Microstructure in Localized Corrosion of Magnesium Alloys. Metall. Mater Trans. A 2004, 35, 2525–2531. [Google Scholar] [CrossRef]
  17. Li, Z.; Sun, S.; Chen, M.; Fahlman, B.D.; Liu, D.; Bi, H. In Vitro and in Vivo Corrosion, Mechanical Properties and Biocompatibility Evaluation of MgF 2 -Coated Mg-Zn-Zr Alloy as Cancellous Screws. Mater. Sci. Eng. C 2017, 75, 1268–1280. [Google Scholar] [CrossRef] [PubMed]
  18. Wang, J.; Li, Y.; Huang, S.; Wei, Y.; Xi, X.; Cai, K.; Pan, F. Effects of Y on the Microstructure, Mechanical and Bio-Corrosion Properties of Mg–Zn–Ca Bulk Metallic Glass. J. Mater. Sci. Technol. 2014, 30, 1255–1261. [Google Scholar] [CrossRef]
  19. Neil, W.C.; Forsyth, M.; Howlett, P.C.; Hutchinson, C.R.; Hinton, B.R.W. Corrosion of Magnesium Alloy ZE41—The Role of Microstructural Features. Corros. Sci. 2009, 51, 387–394. [Google Scholar] [CrossRef]
  20. Sun, H.; Li, C.; Fang, W. Evolution of Microstructure and Mechanical Properties of Mg–3.0Zn–0.2Ca–0.5Y Alloy by Extrusion at Various Temperatures. J. Mater. Processing Technol. 2016, 229, 633–640. [Google Scholar] [CrossRef]
  21. Gui, Z.; Kang, Z.; Li, Y. Mechanical and Corrosion Properties of Mg-Gd-Zn-Zr-Mn Biodegradable Alloy by Hot Extrusion. J. Alloys Compd. 2016, 685, 222–230. [Google Scholar] [CrossRef]
  22. Zhang, X.; Yuan, G.; Niu, J.; Fu, P.; Ding, W. Microstructure, Mechanical Properties, Biocorrosion Behavior, and Cytotoxicity of as-Extruded Mg–Nd–Zn–Zr Alloy with Different Extrusion Ratios. J. Mech. Behav. Biomed. Mater. 2012, 9, 153–162. [Google Scholar] [CrossRef]
  23. Yao, H.; Li, H.; Liu, Y.; Shi, H. Enhanced Mechanical and Corrosion Properties of Grain Refined Mg-2.0Zn-0.5Zr-3.0Gd Alloy. Met. Mater./Kov. Mater. 2021, 58, 409–421. [Google Scholar] [CrossRef]
  24. Zhang, T.; Shao, Y.; Meng, G.; Cui, Z.; Wang, F. Corrosion of Hot Extrusion AZ91 Magnesium Alloy: I-Relation between the Microstructure and Corrosion Behavior. Corros. Sci. 2011, 53, 1960–1968. [Google Scholar] [CrossRef]
  25. Chen, L.; Sheng, Y.; Wang, X.; Zhao, X.; Liu, H.; Li, W. Effect of the Microstructure and Distribution of the Second Phase on the Stress Corrosion Cracking of Biomedical Mg-Zn-Zr-xSr Alloys. Materials 2018, 11, 551. [Google Scholar] [CrossRef]
  26. Cao, X.; Zhang, Z.; Xu, C.; Ren, C.; Yang, W.; Zhang, J. Micro-Galvanic Corrosion Behavior and Mechanical Properties of Extruded Mg–2Y–1Zn-0.4Zr-0.3Sr Alloys with Different Extrusion Temperament Immersed in Simulated Body Fluids. Mater. Chem. Phys. 2021, 271, 124928. [Google Scholar] [CrossRef]
  27. Yasi, J.A.; Hector, L.G.; Trinkle, D.R. First-Principles Data for Solid-Solution Strengthening of Magnesium: From Geometry and Chemistry to Properties. Acta Mater. 2010, 58, 5704–5713. [Google Scholar] [CrossRef]
  28. Choi, H.Y.; Kim, W.J. Effect of Thermal Treatment on the Bio-Corrosion and Mechanical Properties of Ultrafine-Grained ZK60 Magnesium Alloy. J. Mech. Behav. Biomed. Mater. 2015, 51, 291–301. [Google Scholar] [CrossRef] [PubMed]
  29. Chen, J.; Tan, L.; Yang, K. Effect of Heat Treatment on Mechanical and Biodegradable Properties of an Extruded ZK60 Alloy. Bioact. Mater. 2017, 2, 19–26. [Google Scholar] [CrossRef]
  30. Zhu, Z.; Zhu, J.; Nie, Y.; Li, X.; Cheng, J.; Zhang, X. Effects of Annealing on Mechanical and Corrosion Properties of As-Extruded NQZ310K Alloy. J. Mater. Eng. Perform. 2020, 29, 925–932. [Google Scholar] [CrossRef]
  31. Lian, Y.; Ji, P.; Zhang, J.; Yuan, X.; Xu, W.; Zhao, Y.; Mo, J.; Zheng, L.; Dou, S. Effect of Homogenization Annealing on Internal Residual Stress Distribution and Texture in ME21 Magnesium Alloy Extruded Plates. J. Magnes. Alloys 2019, 7, 186–192. [Google Scholar] [CrossRef]
  32. Volkov, A.Y.; Kliukin, I.V. Improving the Mechanical Properties of Pure Magnesium through Cold Hydrostatic Extrusion and Low-Temperature Annealing. Mater. Sci. Eng. A 2015, 627, 56–60. [Google Scholar] [CrossRef]
  33. Song, B.; Guo, N.; Xin, R.; Pan, H.; Guo, C. Strengthening and Toughening of Extruded Magnesium Alloy Rods by Combining Pre-Torsion Deformation with Subsequent Annealing. Mater. Sci. Eng. A 2016, 650, 300–304. [Google Scholar] [CrossRef]
  34. Lu, Y.; Bradshaw, A.R.; Chiu, Y.L.; Jones, I.P. Effects of Secondary Phase and Grain Size on the Corrosion of Biodegradable Mg-Zn-Ca Alloys. Mater. Sci. Eng. C-Mater. Biol. Appl. 2015, 48, 480–486. [Google Scholar] [CrossRef] [PubMed]
  35. Xu, D.; He, J.; Wen, J.; Ren, X.; Wang, Y.; Zeng, T. Effects of Solution Treatment on Microstructure, Mechanical Properties and Corrosion Behavior of Mg-2Zn-1Y-0.5Zr Alloy. Mater. Res. Express 2019, 6, 125411. [Google Scholar] [CrossRef]
  36. Liu, Y.; Wen, J.; Yao, H.; He, J.; Li, H. Enhancing the Corrosion Resistance Performance of Mg-1.8Zn-1.74Gd-0.5Y-0.4Zr Biomaterial via Solution Treatment Process. Materials 2020, 13, 836. [Google Scholar] [CrossRef] [PubMed]
  37. Ding, W. Opportunities and Challenges for the Biodegradable Magnesium Alloys as Next-Generation Biomaterials. Regen. Biomater. 2016, 3, 79–86. [Google Scholar] [CrossRef] [PubMed]
  38. National Standards—National Standard Information Public Service Platform. Available online: https://std.samr.gov.cn/gb/search/gbDetailed?id=D4BEFFF4EB12B241E05397BE0A0AF581%20 (accessed on 12 December 2023).
  39. Gollapudi, S. Grain Size Distribution Effects on the Corrosion Behaviour of Materials. Corros. Sci. 2012, 62, 90–94. [Google Scholar] [CrossRef]
  40. Cheng, W.; Bai, Y.; Wang, L.; Wang, H.; Bian, L.; Yu, H. Strengthening Effect of Extruded Mg-8Sn-2Zn-2Al Alloy: Influence of Micro and Nano-Size Mg2Sn Precipitates. Materials 2017, 10, 822. [Google Scholar] [CrossRef]
  41. He, J.; Xu, D.; Wen, J.; Shi, H.; Wang, Y.; Ren, X. Microstructure, Mechanical Properties and Corrosion Behavior of Biodegradable As-extruded Mg-2Zn-1Y-0.5Zr Alloys. Rare Met. Mater. Eng. 2022, 51, 474–483. Available online: https://kns.cnki.net/kcms2/article/abstract?v=z5VdU6XQV3XMa37BoO1exMBzTiSz9HvSD3__1iARi2bChyXd94rcqEx1xACQeFxsgkF6IwJwNMjgfvknvCGmPa1Nt2hFghVSJjbvpuz1_DT8wAOd3y6hV6WFKbIDCS6YZp4WWEbqRTs=&uniplatform=NZKPT&language=CHS (accessed on 19 May 2024).
  42. Lei, L.; Cui, Z.; Pan, H.; Pang, K.; Wang, X.; Cui, H. Effect of Extrusion on the Microstructure and Corrosion Behavior of Mg-Zn-Mn-(0, 1.5)Sr Alloys in Hank’s Solution. Corros. Sci. 2022, 195, 109975. [Google Scholar] [CrossRef]
  43. Li, L.; Zhang, C.; Lv, H.; Liu, C.; Wen, Z.; Jiang, J. Texture Development and Tensile Properties of Mg–Yb Binary Alloys during Hot Extrusion and Subsequent Annealing. J. Magnes. Alloys 2022, 10, 249–265. [Google Scholar] [CrossRef]
  44. Daidong, Z.; Xiaowei, H.; Daqing, F.; Yuesheng, C. Effects of Heat Treatment on Microstructure and Mechanical Properties of As-Extruded Mg-9Sn-1.5Y-0.4Zr Magnesium Alloy. Rare Met. Mater. Eng. 2016, 45, 2208–2213. [Google Scholar] [CrossRef]
  45. Zhang, B.P.; Geng, L.; Huang, L.J.; Zhang, X.X.; Dong, C.C. Enhanced Mechanical Properties in Fine-Grained Mg–1.0Zn–0.5Ca Alloys Prepared by Extrusion at Different Temperatures. Scr. Mater. 2010, 63, 1024–1027. [Google Scholar] [CrossRef]
  46. He, J.H.; Jin, L.; Wang, F.H.; Dong, S.; Dong, J. Mechanical Properties of Mg-8Gd-3Y-0.5Zr Alloy with Bimodal Grain Size Distributions. J. Magnes. Alloys 2017, 5, 423–429. [Google Scholar] [CrossRef]
  47. Jeong, Y.S.; Kim, W.J. Enhancement of Mechanical Properties and Corrosion Resistance of Mg–Ca Alloys through Microstructural Refinement by Indirect Extrusion. Corros. Sci. 2014, 82, 392–403. [Google Scholar] [CrossRef]
  48. Oh-ishi, K.; Mendis, C.L.; Homma, T.; Kamado, S.; Ohkubo, T.; Hono, K. Bimodally Grained Microstructure Development during Hot Extrusion of Mg–2.4 Zn–0.1 Ag–0.1 Ca–0.16 Zr (at.%) Alloys. Acta Mater. 2009, 57, 5593–5604. [Google Scholar] [CrossRef]
  49. Jiang, M.G.; Xu, C.; Yan, H.; Lu, S.H.; Nakata, T.; Lao, C.S.; Chen, R.S.; Kamado, S.; Han, E.H. Correlation between Dynamic Recrystallization and Formation of Rare Earth Texture in a Mg-Zn-Gd Magnesium Alloy during Extrusion. Sci. Rep. 2018, 8, 16800. [Google Scholar] [CrossRef]
  50. Fu, W.; Wang, R.; Zhang, J.; Wu, K.; Liu, G.; Sun, J. The Effect of Precipitates on Voiding, Twinning, and Fracture Behaviors in Mg Alloys. Mater. Sci. Eng. A 2018, 720, 98–109. [Google Scholar] [CrossRef]
  51. Esmaily, M.; Svensson, J.E.; Fajardo, S.; Birbilis, N.; Frankel, G.S.; Virtanen, S.; Arrabal, R.; Thomas, S.; Johansson, L.G. Fundamentals and Advances in Magnesium Alloy Corrosion. Prog. Mater. Sci. 2017, 89, 92–193. [Google Scholar] [CrossRef]
  52. Olugbade, T.O.; Omiyale, B.O.; Ojo, O.T. Corrosion, Corrosion Fatigue, and Protection of Magnesium Alloys: Mechanisms, Measurements, and Mitigation. J. Mater. Eng. Perform. 2022, 31, 1707–1727. [Google Scholar] [CrossRef]
  53. Qiao, Z.; Shi, Z.; Hort, N.; Zainal Abidin, N.I.; Atrens, A. Corrosion Behaviour of a Nominally High Purity Mg Ingot Produced by Permanent Mould Direct Chill Casting. Corros. Sci. 2012, 61, 185–207. [Google Scholar] [CrossRef]
  54. Atrens, A.; Song, G.; Liu, M.; Shi, Z.; Cao, F.; Dargusch, M.S. Review of Recent Developments in the Field of Magnesium Corrosion. Adv. Eng. Mater. 2015, 17, 400–453. [Google Scholar] [CrossRef]
  55. Chen, J.; Tan, L.; Yu, X.; Yang, K. Effect of Minor Content of Gd on the Mechanical and Degradable Properties of As-Cast Mg-2Zn-xGd-0.5Zr Alloys. J. Mater. Sci. Technol. 2019, 35, 503–511. [Google Scholar] [CrossRef]
  56. Cai, C.; Song, R.; Wang, L.; Li, J. Surface Corrosion Behavior and Reaction Product Film Deposition Mechanism of Mg-Zn-Zr-Nd Alloys during Degradation Process in Hank’s Solution. Surf. Coat. Technol. 2018, 342, 57–68. [Google Scholar] [CrossRef]
  57. Wang, L.-X.; Song, R.-B.; Cai, C.-H.; Li, J.-Y. Enhanced Strength and Corrosion Resistance of Mg–2Zn–0.6Zr Alloy with Extrusion. Acta Metall. Sin. (Engl. Lett.) 2019, 32, 10–22. [Google Scholar] [CrossRef]
  58. She, J.; Peng, P.; Xiao, L.; Tang, A.T.; Wang, Y.; Pan, F.S. Development of High Strength and Ductility in Mg–2Zn Extruded Alloy by High Content Mn-Alloying. Mater. Sci. Eng. A 2019, 765, 138203. [Google Scholar] [CrossRef]
  59. Karakulak, E. A Review: Past, Present and Future of Grain Refining of Magnesium Castings. J. Magnes. Alloys 2019, 7, 355–369. [Google Scholar] [CrossRef]
  60. Ralston, K.D.; Birbilis, N. Effect of Grain Size on Corrosion: A Review. Corrosion 2010, 66, 075005. [Google Scholar] [CrossRef]
  61. Liu, D.; Guo, C.; Chai, L.; Sherman, V.R.; Qin, X.; Ding, Y.; Meyers, M.A. Mechanical Properties and Corrosion Resistance of Hot Extruded Mg–2.5Zn–1Ca Alloy. Mater. Sci. Eng. B 2015, 195, 50–58. [Google Scholar] [CrossRef]
  62. Song, D.; Ma, A.; Jiang, J.; Lin, P.; Yang, D.; Fan, J. Corrosion Behavior of Equal-Channel-Angular-Pressed Pure Magnesium in NaCl Aqueous Solution. Corros. Sci. 2010, 52, 481–490. [Google Scholar] [CrossRef]
  63. Hamu, G.B.; Eliezer, D.; Wagner, L. The Relation between Severe Plastic Deformation Microstructure and Corrosion Behavior of AZ31 Magnesium Alloy. J. Alloys Compd. 2009, 468, 222–229. [Google Scholar] [CrossRef]
  64. Kayani, S.H.; Park, S.; Euh, K.; Seol, J.B.; Kim, J.G.; Sung, H. Dislocation-Aided Electrochemical Behavior of Precipitates in Stress Corrosion Cracking of Al–Zn–Mg–Cu Alloys. Mater. Charact. 2022, 190, 112019. [Google Scholar] [CrossRef]
  65. Xiong, Y.; Yang, Z.; Zhu, T.; Jiang, Y. Effect of Texture Evolution on Corrosion Resistance of AZ80 Magnesium Alloy Subjected to Applied Force in Simulated Body Fluid. Mater. Res. Express 2020, 7, 015406. [Google Scholar] [CrossRef]
  66. Song, D.; Li, C.; Liang, N.; Yang, F.; Jiang, J.; Sun, J.; Wu, G.; Ma, A.; Ma, X. Simultaneously Improving Corrosion Resistance and Mechanical Properties of a Magnesium Alloy via Equal-Channel Angular Pressing and Post Water Annealing. Mater. Des. 2019, 166, 107621. [Google Scholar] [CrossRef]
  67. Liu, Y.; Wen, J.; Li, H.; He, J. Effects of Extrusion Parameters on the Microstructure, Corrosion Resistance, and Mechanical Properties of Biodegradable Mg–Zn–Gd–Y–Zr Alloy. J. Alloys Compd. 2022, 891, 161964. [Google Scholar] [CrossRef]
  68. Wen, J.; He, J.; Lu, X. Influence of Silicon on the Corrosion Behaviour of Al–Zn–In–Mg–Ti Sacrificial Anode. Corros. Sci. 2011, 53, 3861–3865. [Google Scholar] [CrossRef]
  69. Wang, J.; Li, J.-Y.; Zhang, Y.; Yu, W.-M. Effects of the Addition of Micro-Amounts of Calcium on the Corrosion Resistance of Mg-0.1Mn-1.0Zn-xCa Biomaterials. J. Mater. Eng. Perform. 2019, 28, 1553–1562. [Google Scholar] [CrossRef]
  70. Ralston, K.D.; Birbilis, N.; Davies, C.H.J. Revealing the Relationship between Grain Size and Corrosion Rate of Metals. Scr. Mater. 2010, 63, 1201–1204. [Google Scholar] [CrossRef]
  71. Yeh, T.-C.; Huang, T.-C.; Huang, H.-Y.; Huang, Y.-P.; Cai, Y.-T.; Lin, S.-T.; Wei, Y.; Yeh, J.-M. Electrochemical Investigations on Anticorrosive and Electrochromic Properties of Electroactive Polyurea. Polym. Chem. 2012, 3, 2209. [Google Scholar] [CrossRef]
  72. Shi, Z.; Atrens, A. An Innovative Specimen Configuration for the Study of Mg Corrosion. Corros. Sci. 2011, 53, 226–246. [Google Scholar] [CrossRef]
  73. King, A.D.; Birbilis, N.; Scully, J.R. Accurate Electrochemical Measurement of Magnesium Corrosion Rates; a Combined Impedance, Mass-Loss and Hydrogen Collection Study. Electrochim. Acta 2014, 121, 394–406. [Google Scholar] [CrossRef]
  74. Du, Y.Z.; Qiao, X.G.; Zheng, M.Y.; Wu, K.; Xu, S.W. The Microstructure, Texture and Mechanical Properties of Extruded Mg–5.3Zn–0.2Ca–0.5Ce (Wt%) Alloy. Mater. Sci. Eng. A 2015, 620, 164–171. [Google Scholar] [CrossRef]
  75. Cao, F.; Shi, Z.; Hofstetter, J.; Uggowitzer, P.J.; Song, G.; Liu, M.; Atrens, A. Corrosion of Ultra-High-Purity Mg in 3.5% NaCl Solution Saturated with Mg(OH)2. Corros. Sci. 2013, 75, 78–99. [Google Scholar] [CrossRef]
  76. Gomes, M.P.; Costa, I.; Pébère, N.; Rossi, J.L.; Tribollet, B.; Vivier, V. On the Corrosion Mechanism of Mg Investigated by Electrochemical Impedance Spectroscopy. Electrochim. Acta 2019, 306, 61–70. [Google Scholar] [CrossRef]
  77. Baril, G.; Galicia, G.; Deslouis, C.; Pébère, N.; Tribollet, B.; Vivier, V. An Impedance Investigation of the Mechanism of Pure Magnesium Corrosion in Sodium Sulfate Solutions. J. Electrochem. Soc. 2007, 154, C108. [Google Scholar] [CrossRef]
  78. Pan, H.; Pang, K.; Cui, F.; Ge, F.; Man, C.; Wang, X.; Cui, Z. Effect of Alloyed Sr on the Microstructure and Corrosion Behavior of Biodegradable Mg-Zn-Mn Alloy in Hanks’ Solution. Corros. Sci. 2019, 157, 420–437. [Google Scholar] [CrossRef]
  79. Chang, C.-H.; Huang, T.-C.; Peng, C.-W.; Yeh, T.-C.; Lu, H.-I.; Hung, W.-I.; Weng, C.-J.; Yang, T.-I.; Yeh, J.-M. Novel Anticorrosion Coatings Prepared from Polyaniline/Graphene Composites. Carbon 2012, 50, 5044–5051. [Google Scholar] [CrossRef]
Figure 1. DTA curve of the Mg–2.0Zn–1.0Y–0.5Zr alloy.
Alloys 03 00008 g001
Figure 2. Schematic illustration of the extrusion (b), the block (a), and the extruded bar (c).
Alloys 03 00008 g002
Figure 3. Optical images of solid solution extruded Mg–2.0Zn–1.0Y–0.5Zr alloys annealed at different temperatures: (a) as-cast, (b) unheated, (c) 180 °C, (d) 200 °C, (e) 220 °C, (f) 240 °C, (g) 260 °C, and (h) 280 °C.
Alloys 03 00008 g003
Figure 4. Grain size distribution of Mg–2.0Zn–1.0Y–0.5Zr alloys annealed at different temperatures.
Alloys 03 00008 g004
Figure 5. XRD patterns of Mg–2.0Zn–1.0Y–0.5Zr alloys annealed at different temperatures.
Alloys 03 00008 g005
Figure 6. TEM bright-field micrographs of extruded SE46 (a,b) and annealed SEA24 (c,d) specimens.
Alloys 03 00008 g006
Figure 7. Mechanical properties of Mg–2.0Zn–1.0Y–0.5Zr alloys annealed at different temperatures.
Alloys 03 00008 g007
Figure 8. Mechanical properties of solid solution extruded Mg–2.0Zn–1.0Y–0.5Zr alloys annealed at different temperatures: (a) unheated; (b) 220 °C; (c) 240 °C; and (d) 280 °C.
Alloys 03 00008 g008
Figure 9. Corrosion rate (a) and hydrogen volume (b) of Mg–2.0Zn–1.0Y–0.5Zr alloys annealed at different temperatures after immersion in SBF for 120 h.
Alloys 03 00008 g009
Figure 10. Surface macrographs of annealed alloys immersed in SBF for 120 h: (a) unheated; (b) 180 °C; (c) 200 °C; (d) 220 °C; (e) 240 °C; (f) 260 °C; and (g) 280 °C.
Alloys 03 00008 g010
Figure 11. Fracture morphologies of solid solution extruded Mg–2.0Zn–1.0Y–0.5Zr alloys annealed at different temperatures: (a) unheated; (b) 220 °C; (c) 240 °C; and (d) 280 °C.
Alloys 03 00008 g011
Figure 12. Contour map of removing corrosion products after annealing alloys at different temperatures and soaking in SBF for 120 h: (a) unheated; (b) 220 °C × 4 h; (c) 240 °C × 4 h; and (d) 280 °C × 4 h.
Alloys 03 00008 g012
Figure 13. Three-dimensional morphology of alloys annealed at different temperatures and soaked in SBF for 120 h: (a) unheated; (b) 220 °C × 4 h; (c) 240 °C × 4 h; and (d) 280 °C × 4 h.
Alloys 03 00008 g013
Figure 14. The corrosion morphology of the alloy without the removal of corrosion products after 120 h of immersion in simulated body fluids: (a) EH48, (b) EH48 local magnification, (c) EHA24, and (d) EHA24 local magnification.
Alloys 03 00008 g014
Figure 15. Polarization curves of Mg–2.0Zn–1.0Y–0.5Zr alloys annealed at different temperatures after immersion in SBF for 1 h at OCP.
Alloys 03 00008 g015
Figure 16. EIS of Mg–2.0Zn–1.0Y–0.5Zr alloys that were extruded and subsequently annealed at different temperatures after immersion in SBF for hour at OCP: (a) Nyquist diagram, (b) Bode impedance diagram, (c) Bode phase angle, and (d) equivalent circuit (the characteristic frequency is marked in Nyquist plots).
Alloys 03 00008 g016
Figure 17. Schematic diagrams of the corrosion behaviors of the extruded SE46 (a1a3) and annealed SEA24 (b1b3) specimens.
Alloys 03 00008 g017
Table 1. Chemical composition of the SBF (g/L).
NaClCaCl2KClNaHCO3MgCl2·6H2OC6H12O6Na2HPO4·12H2OKH2PO4MgSO4·7H2O
8.000.140.400.350.101.000.060.060.06
Table 2. EDS analyses marked in Figure 11.
PositionElement (wt%)
OCaPCMg
A49.118.813.68.69.9
B57.911.59.611.29.8
Table 3. Fitting results for the polarization curves.
MaterialEcorr (V/SCE)Eb (V/SCE)Icorr (μA/cm2)ba (mV/dec)bc (mV/dec)Pi (mm/y)
SE46−1.592−1.3285.42760−1550.132
SEA18−1.533−1.3694.30155−1430.104
SEA20−1.498−1.3103.83752−1430.093
SEA22−1.483−1.3322.85349−1630.069
SEA24−1.440−1.2442.45447−1550.060
SEA26−1.465−1.3083.45655−1430.084
SEA28−1.489−1.3543.79854−1550.092
Table 4. EIS fitting parameters of Mg–2.0Zn–1.0Y–0.5Zr alloys that were extruded and subsequently annealed at different temper-atures after immersion in SBF for hour at OCP.
SamplesRs
(Ω·cm2)
CPEf
−1·cm−2·s−n)
n1Rf
(Ω·cm2)
CPEdl
−1·cm−2·s−n)
n2Rct
(Ω·cm2)
Rp
(Ω·cm2)
IEIS
(μA·cm−2)
Pi/EIS
(mm·y−1)
SE46171.14 × 10−50.68109.19.22 × 10−60.918.69 × 1038.80 × 1034.8780.118
SEA1836.281.10 × 10−60.67125.97.77 × 10−60.929.34 × 1039.47 × 1034.1050.100
SEA2036.039.79 × 10−70.68141.27.98 × 10−60.919.76 × 1039.90 × 1033.5880.087
SEA2224.487.53 × 10−60.70140.71.00 × 10−50.901.10 × 1041.11 × 1042.7340.066
SEA2424.018.62 × 10−60.702447.97 × 10−60.871.27 × 1041.29 × 1042.2660.055
SEA2622.047.96 × 10−60.71166.71.04 × 10−50.881.17 × 1041.19 × 1043.2750.079
SEA2822.977.7 × 10−50.70124.82.78 × 10−50.711.04 × 1041.05 × 1043.4230.083
Disclaimer/Publisher’s Note: The statements, opinions and data contained in all publications are solely those of the individual author(s) and contributor(s) and not of MDPI and/or the editor(s). MDPI and/or the editor(s) disclaim responsibility for any injury to people or property resulting from any ideas, methods, instructions or products referred to in the content.

