
Revolutionizing Coffee Farming: A Mobile App with GPS-Enabled Reporting for Rapid and Accurate On-Site Detection of Coffee Leaf Diseases Using Integrated Deep Learning

 ,
,  ,
,  ,
,  ,
,
Abstract
:1. Introduction
2. Related Works
3. Materials and Methods
3.1. Study Area
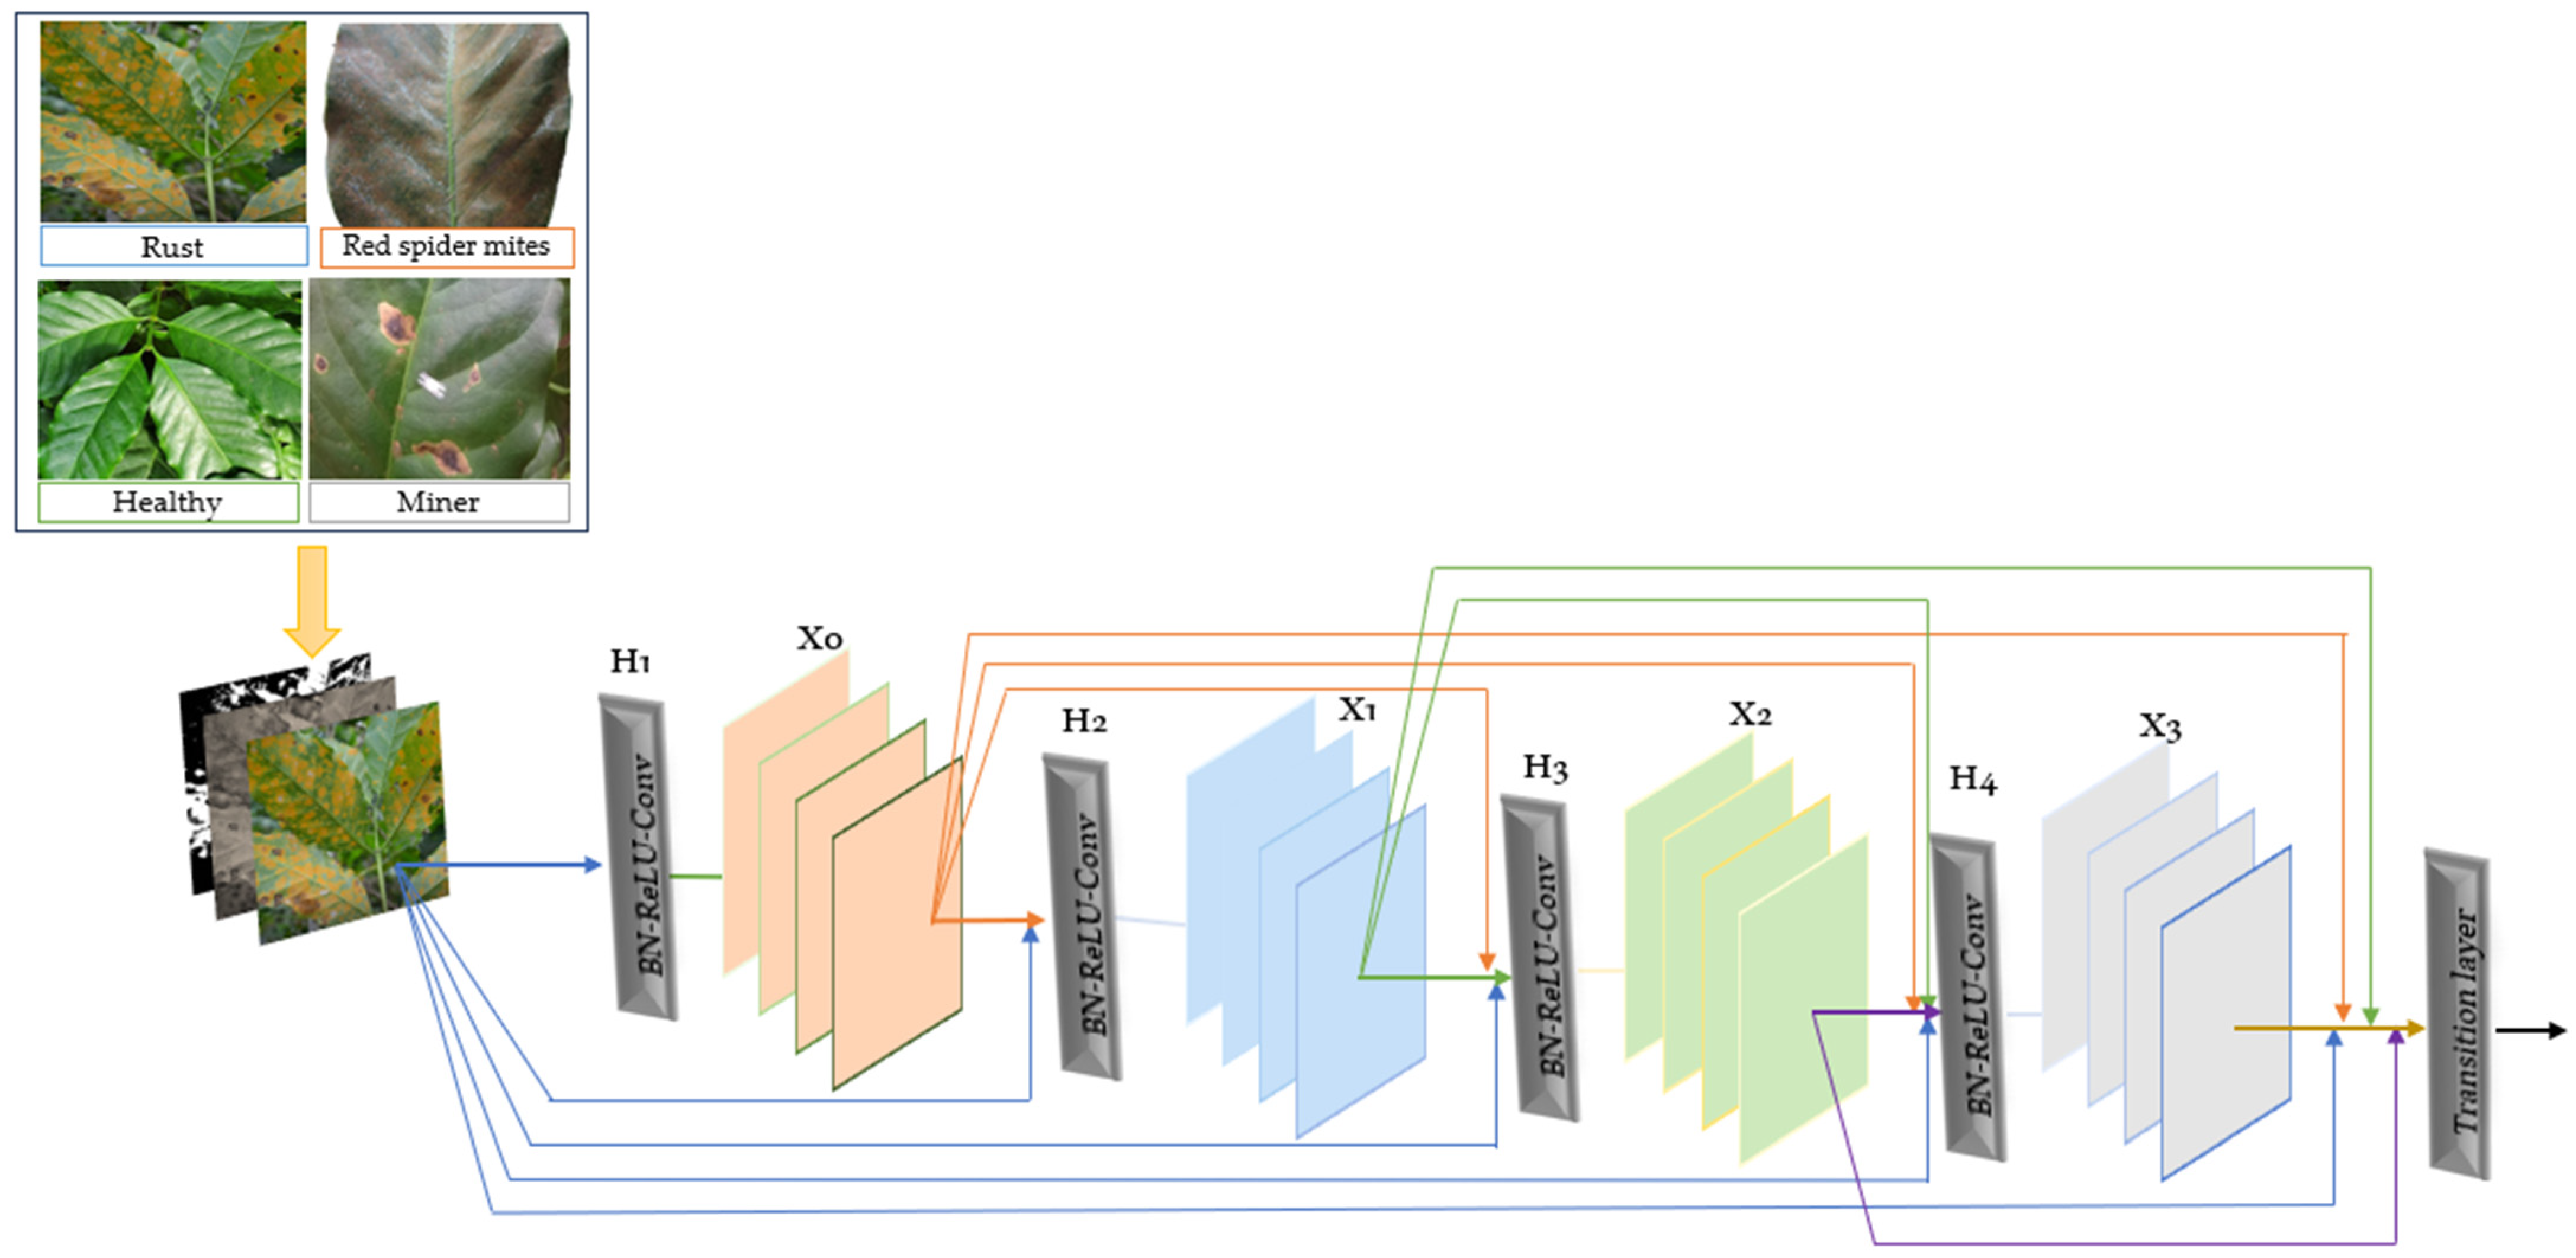
3.2. Dataset
3.3. Deep Learning Algorithms
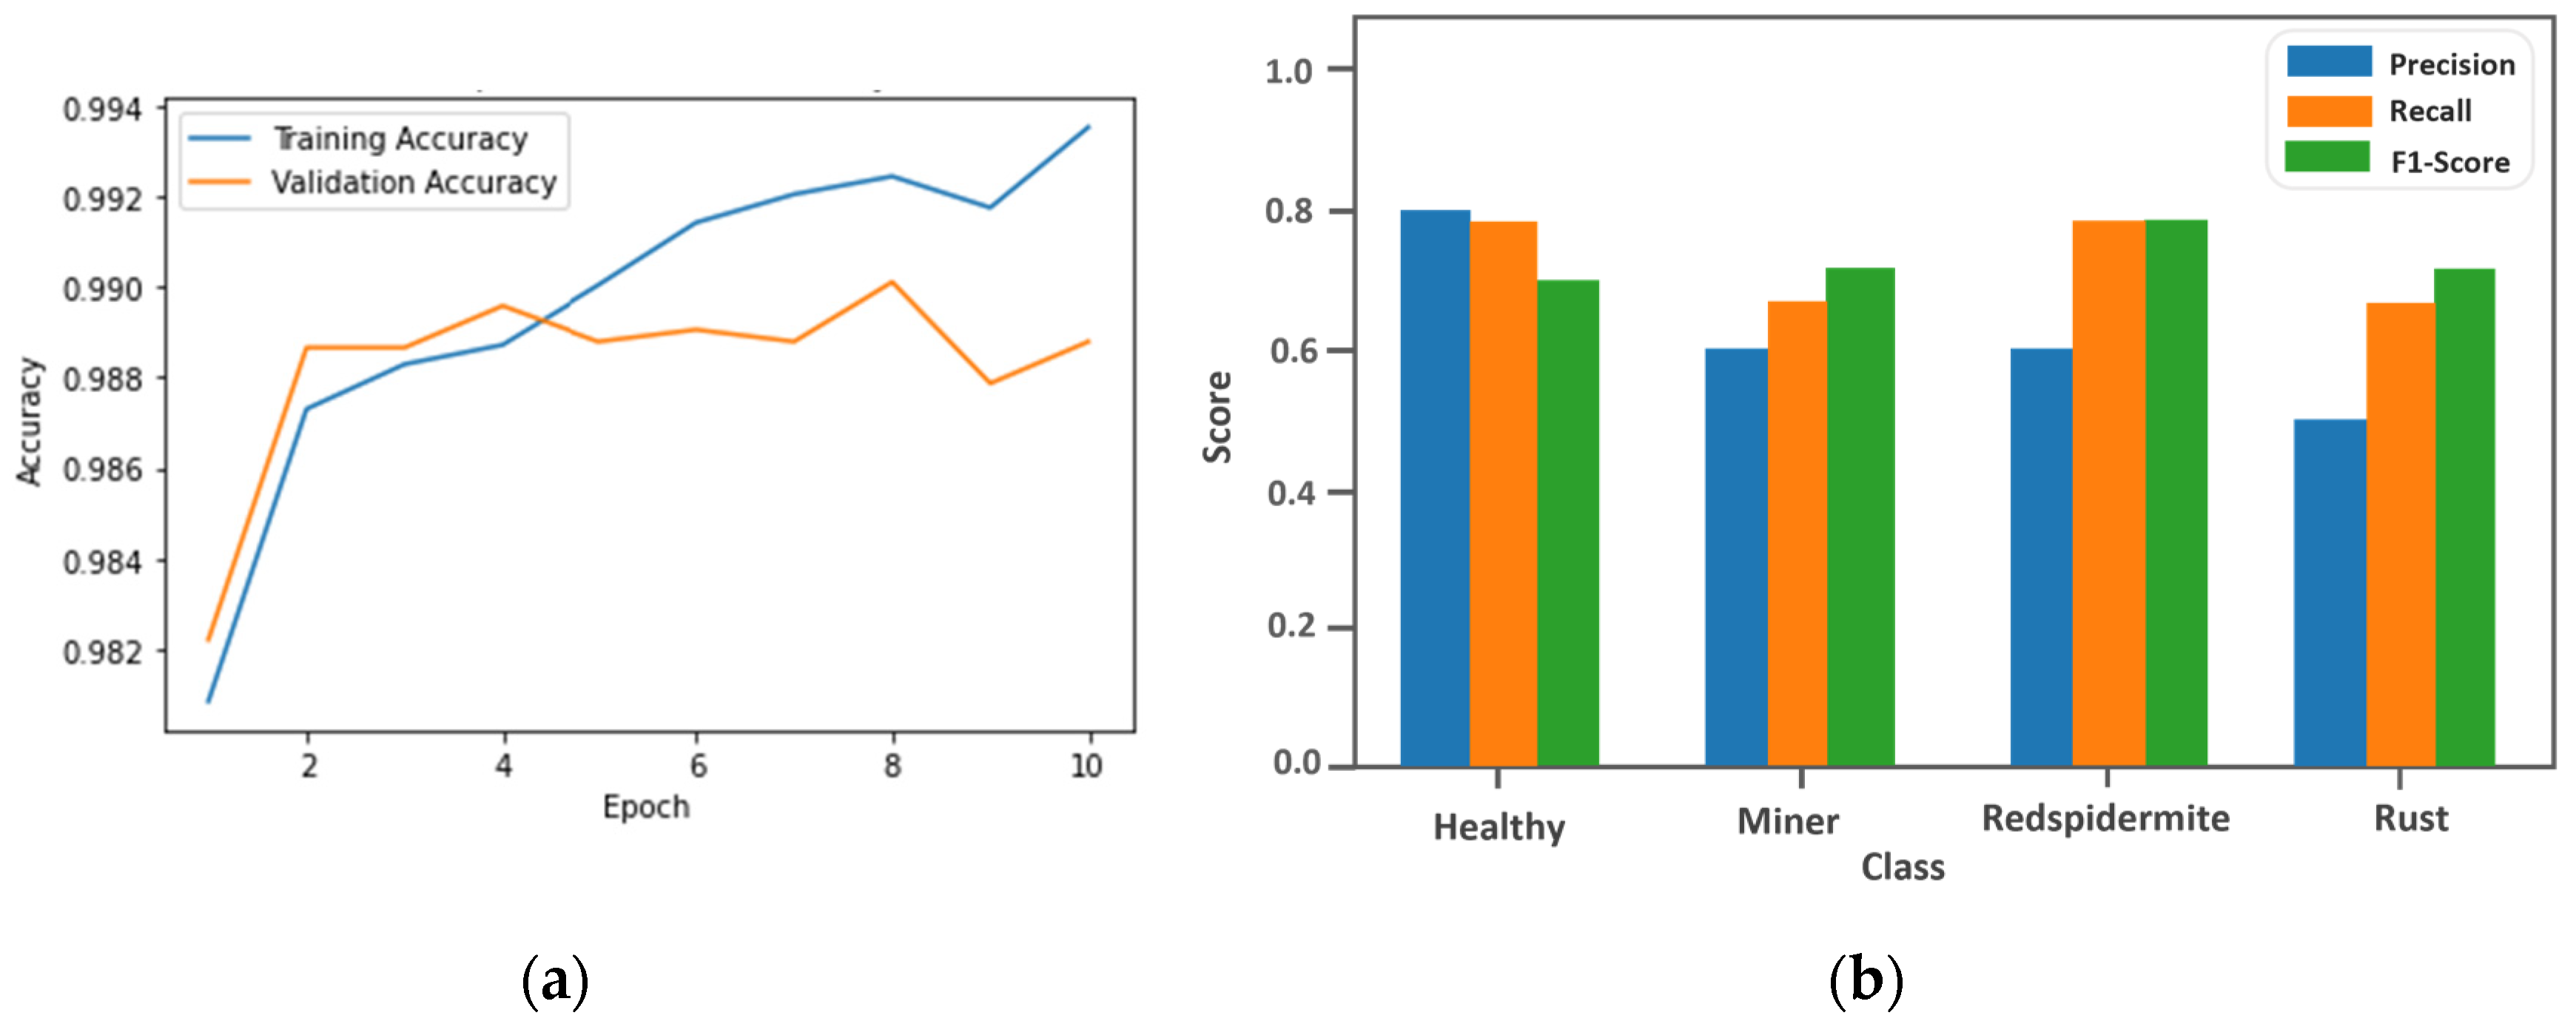
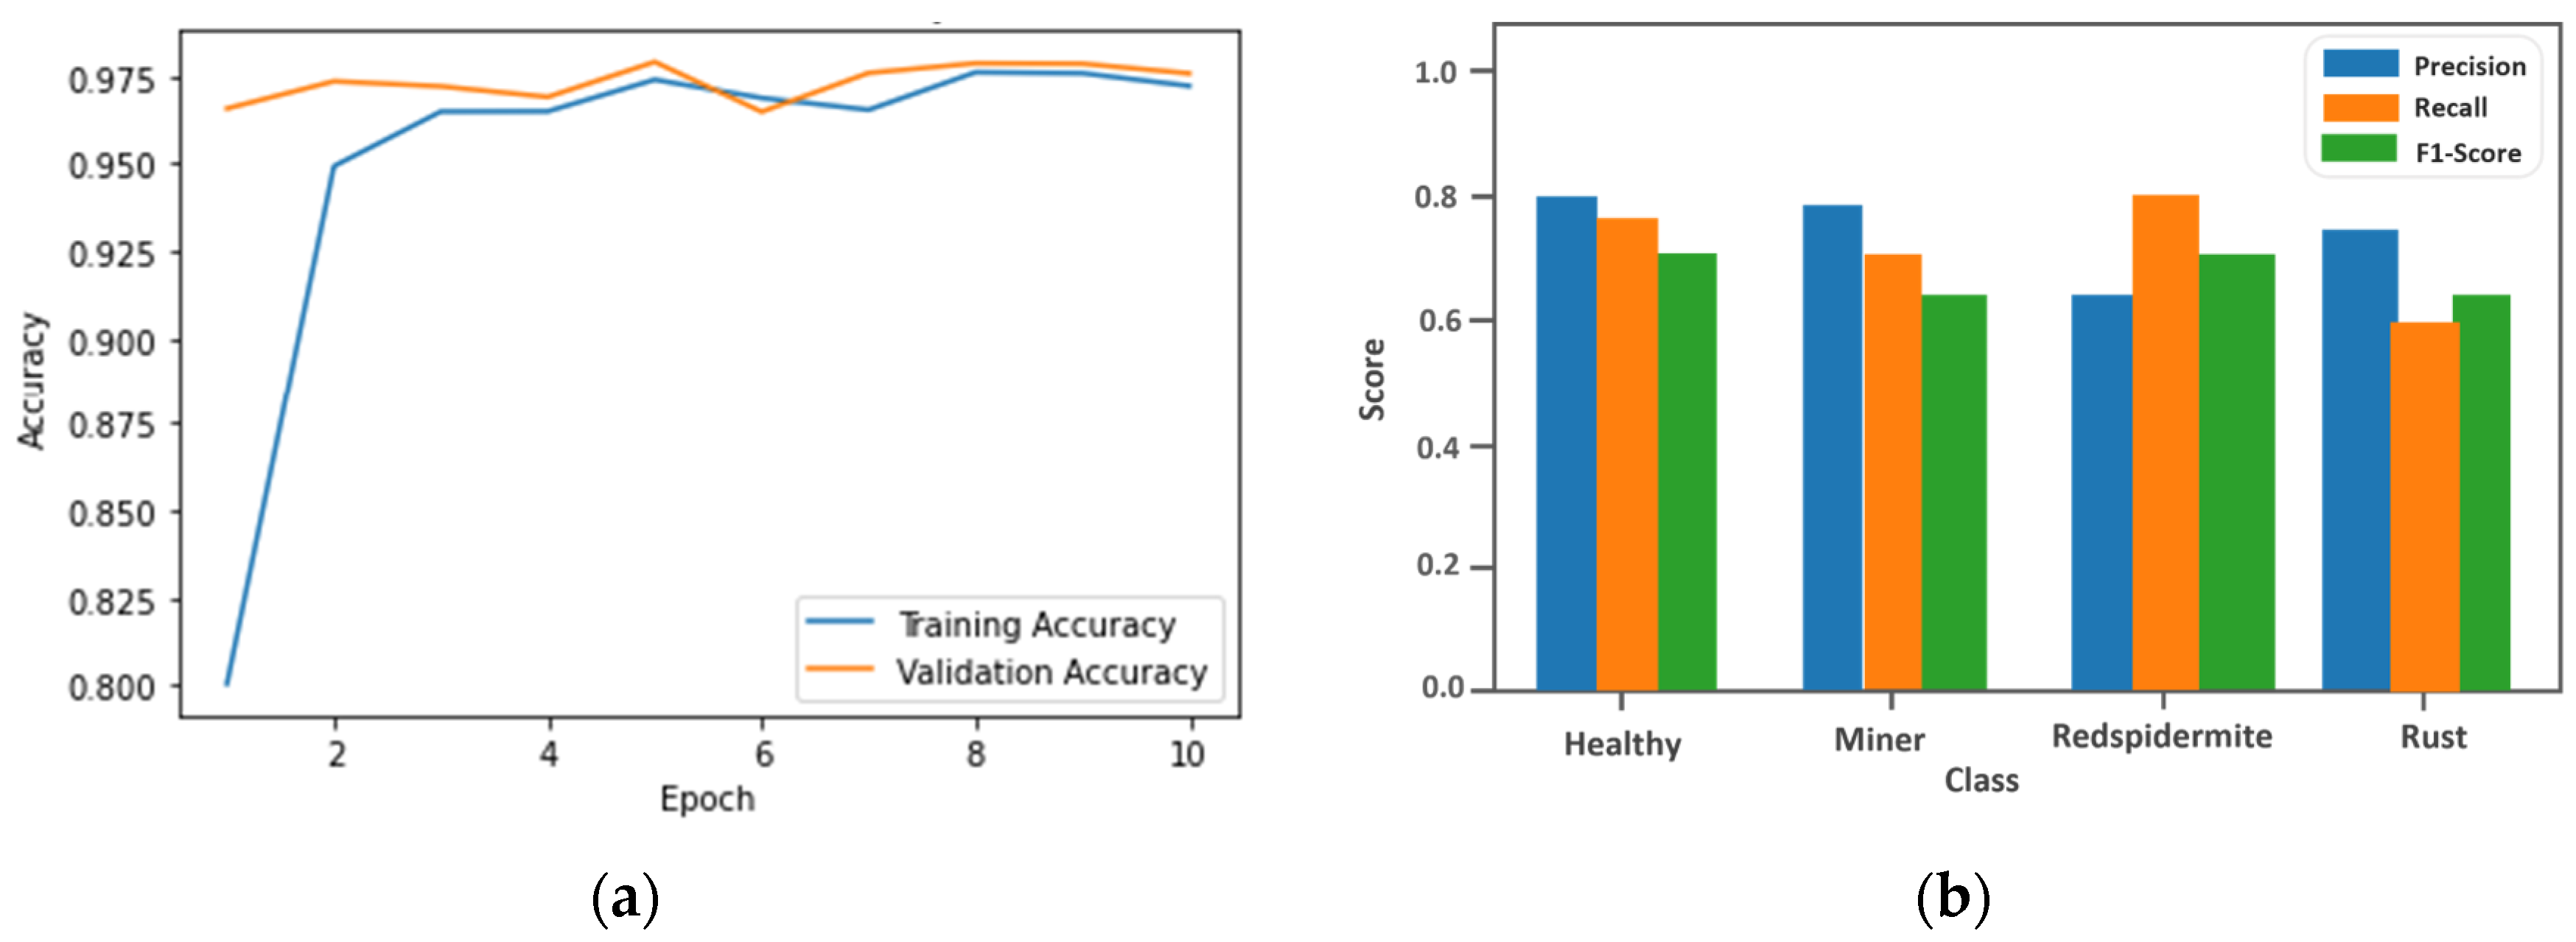
3.4. Performance Score Measurements
3.4.1. Precision–Recall Curve
3.4.2. F1 Scores
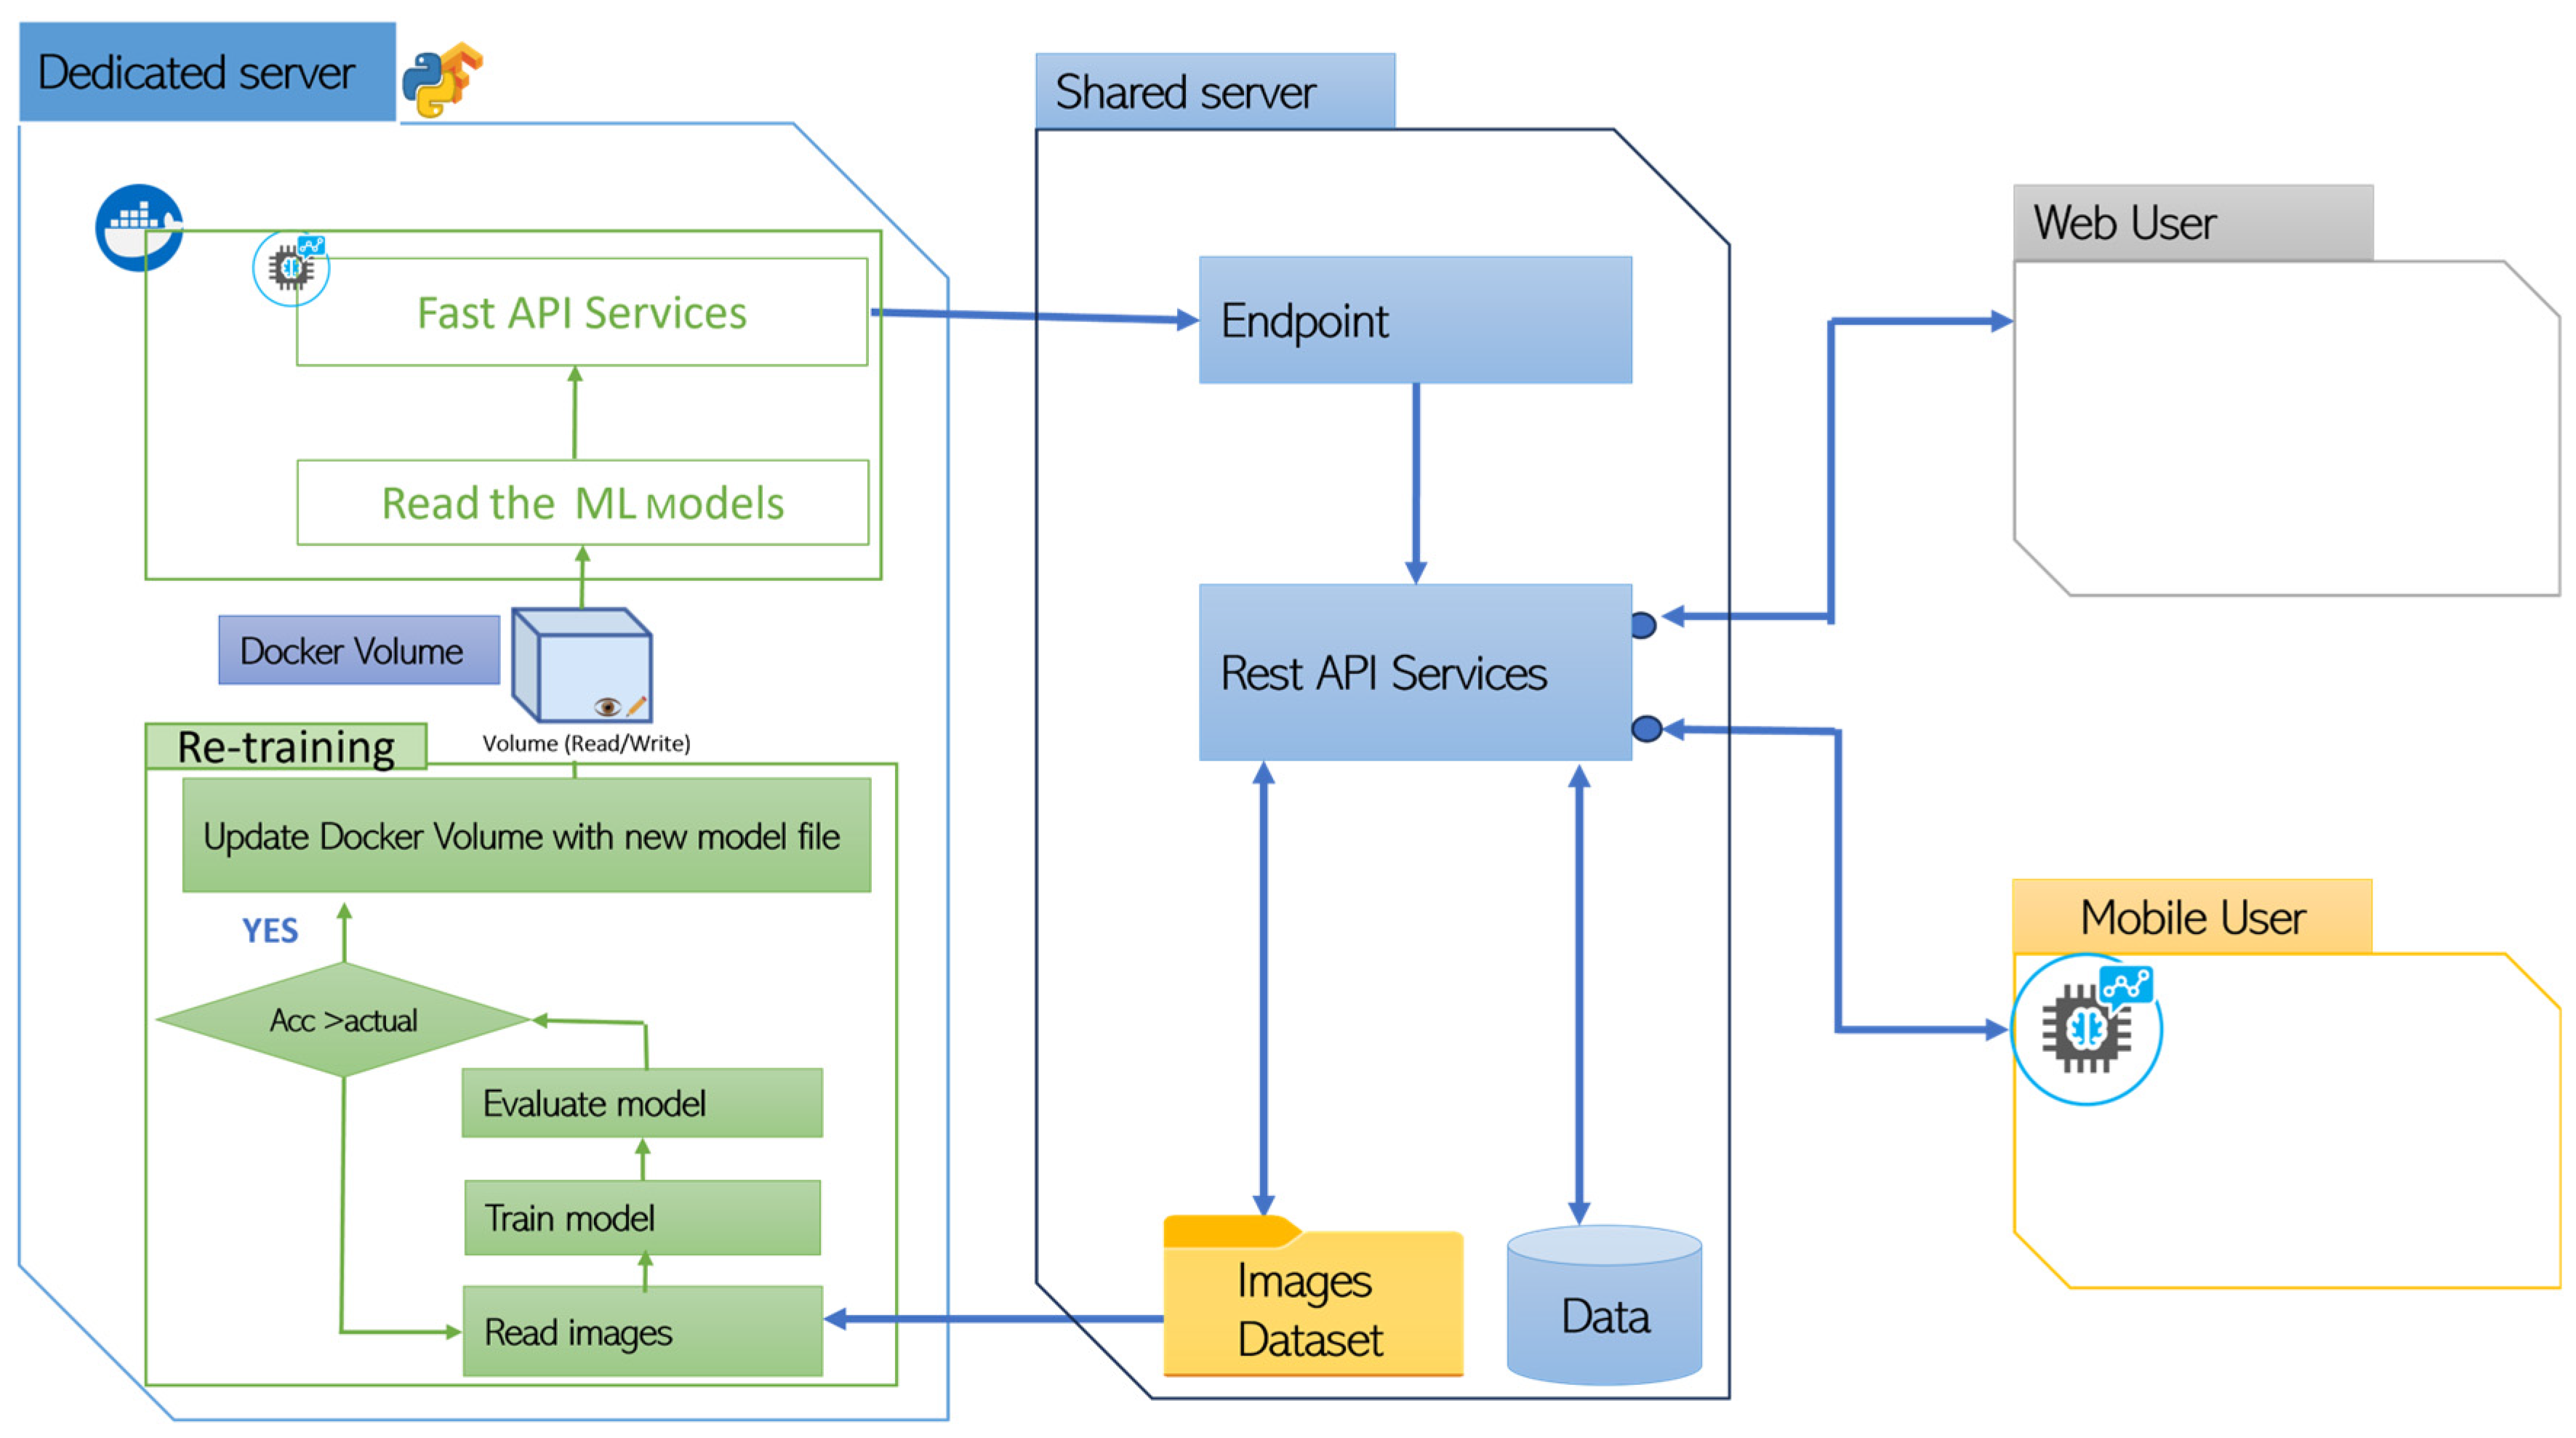
3.5. Mobile and Cloud Computing Techniques
3.5.1. Docker and APIs
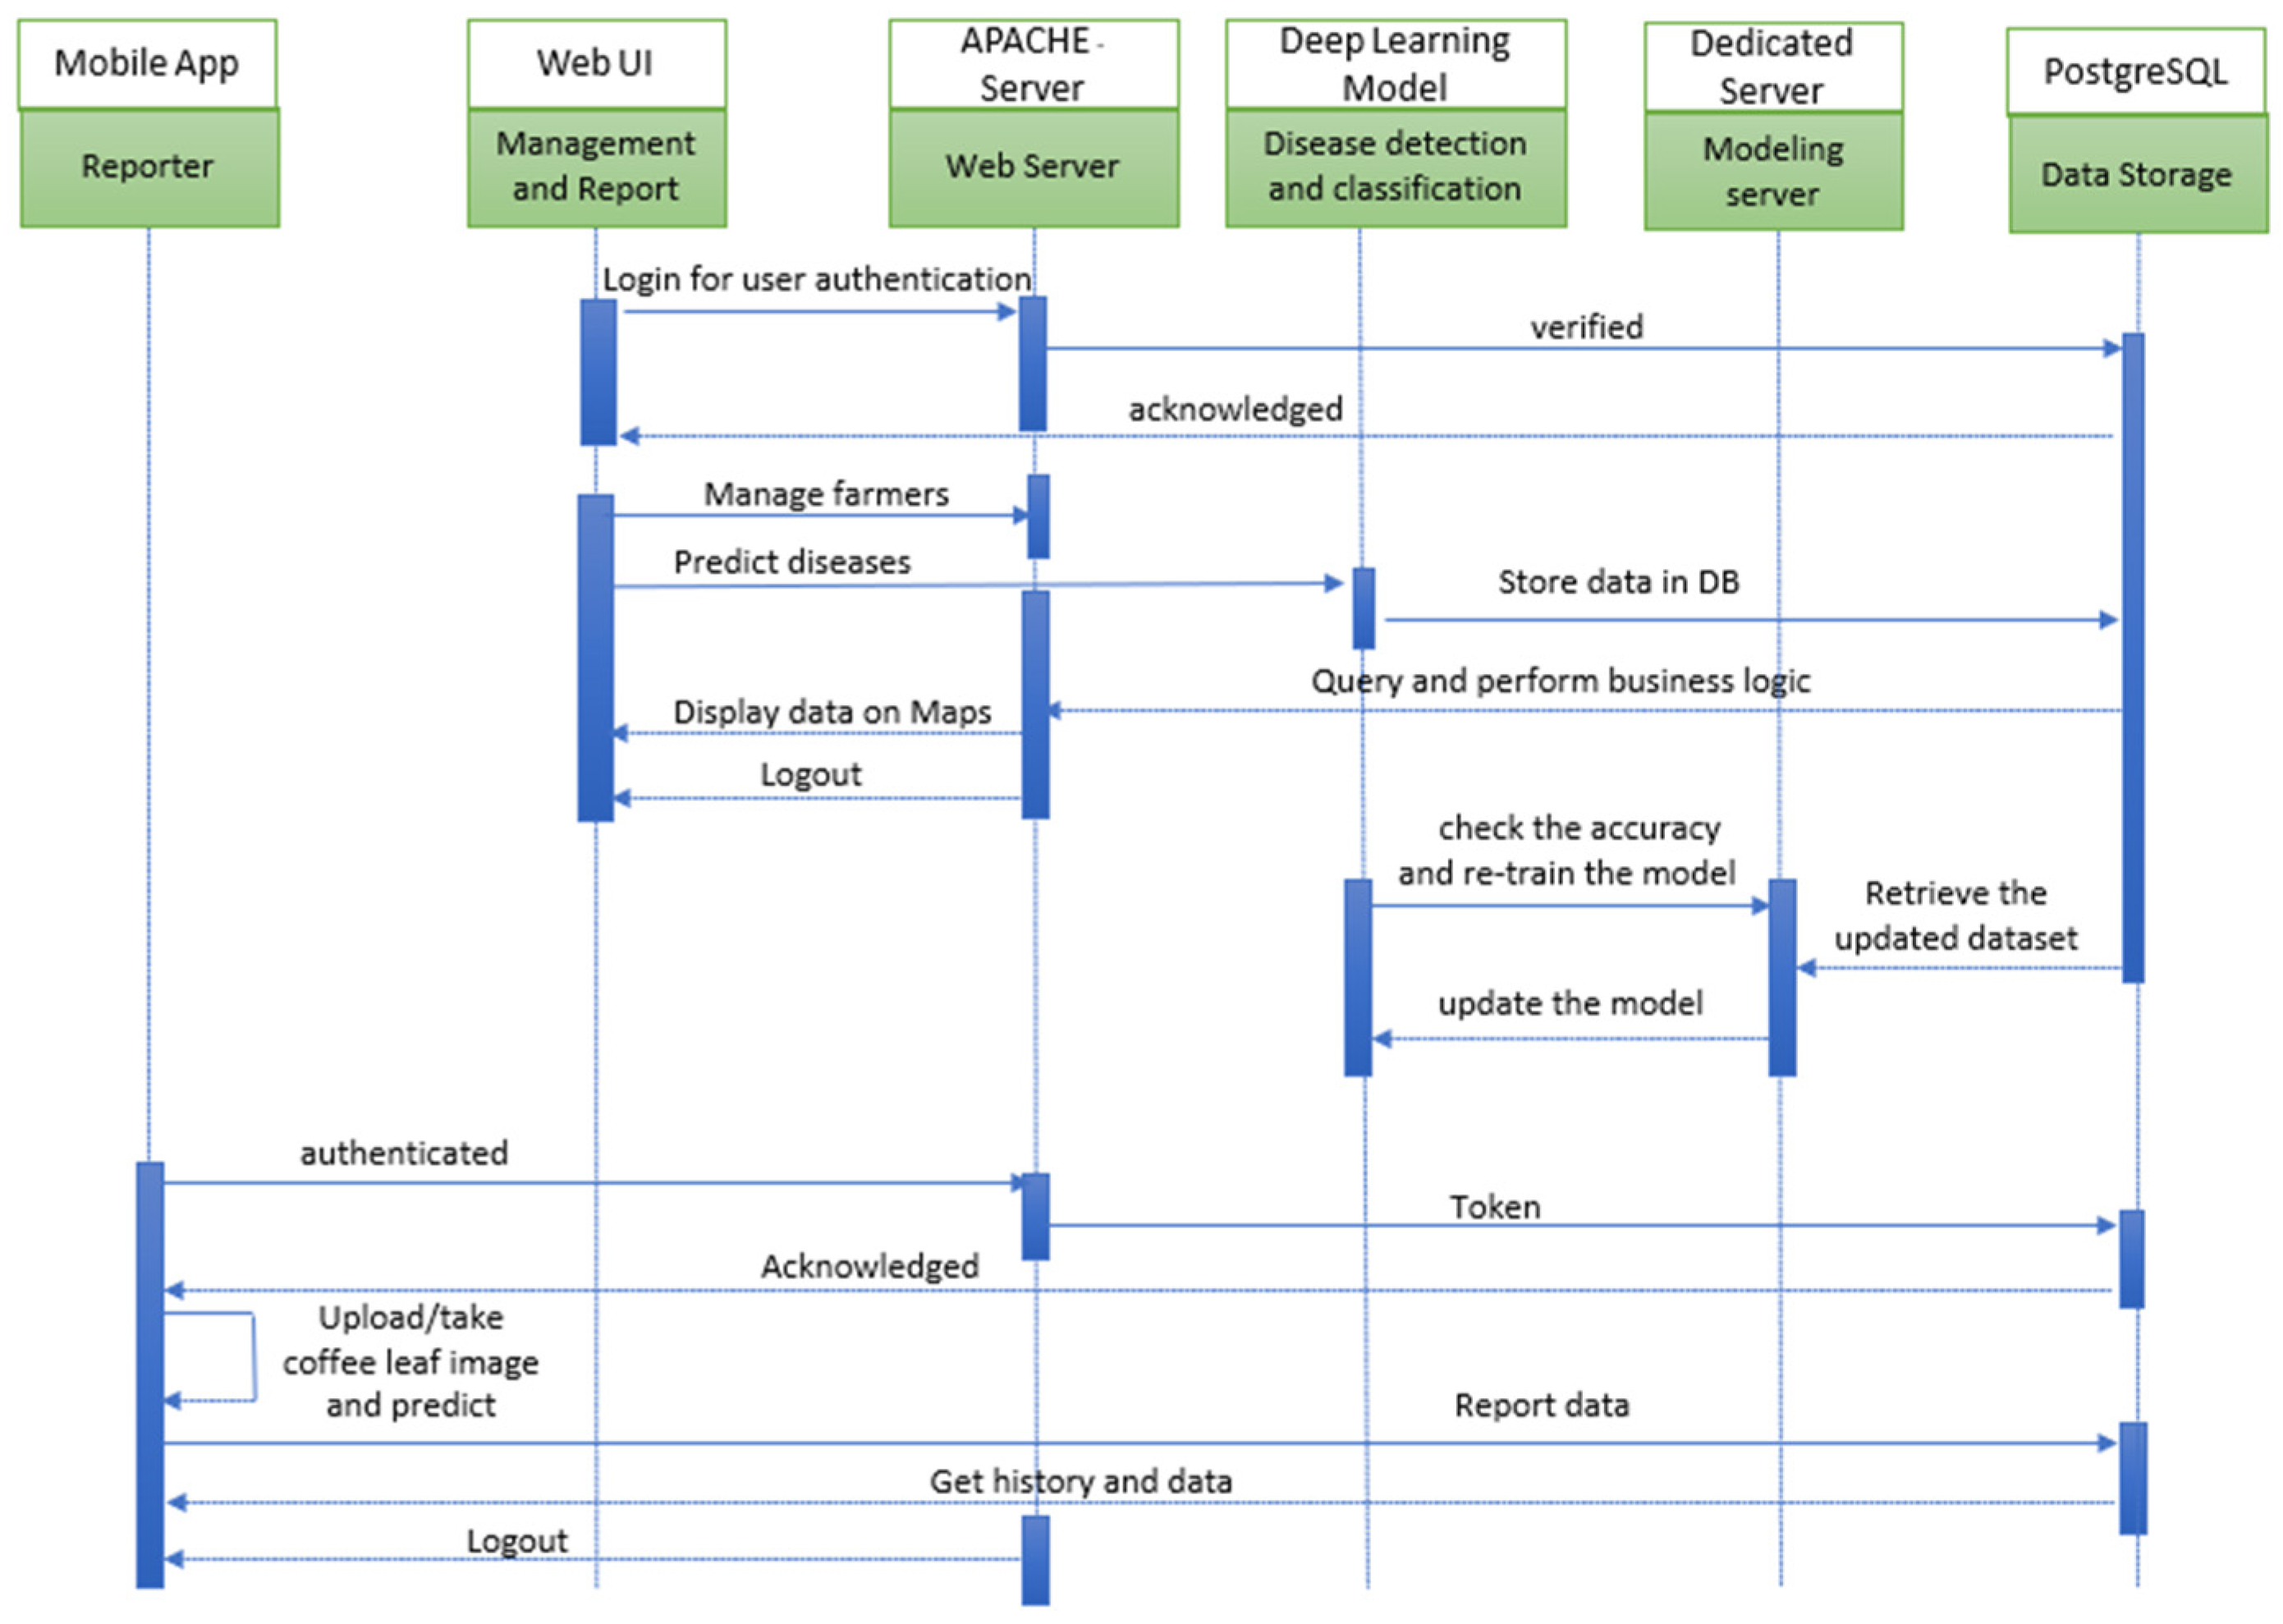
3.5.2. System Flow with Sequence Diagram
4. Results
4.1. Network Architecture Model
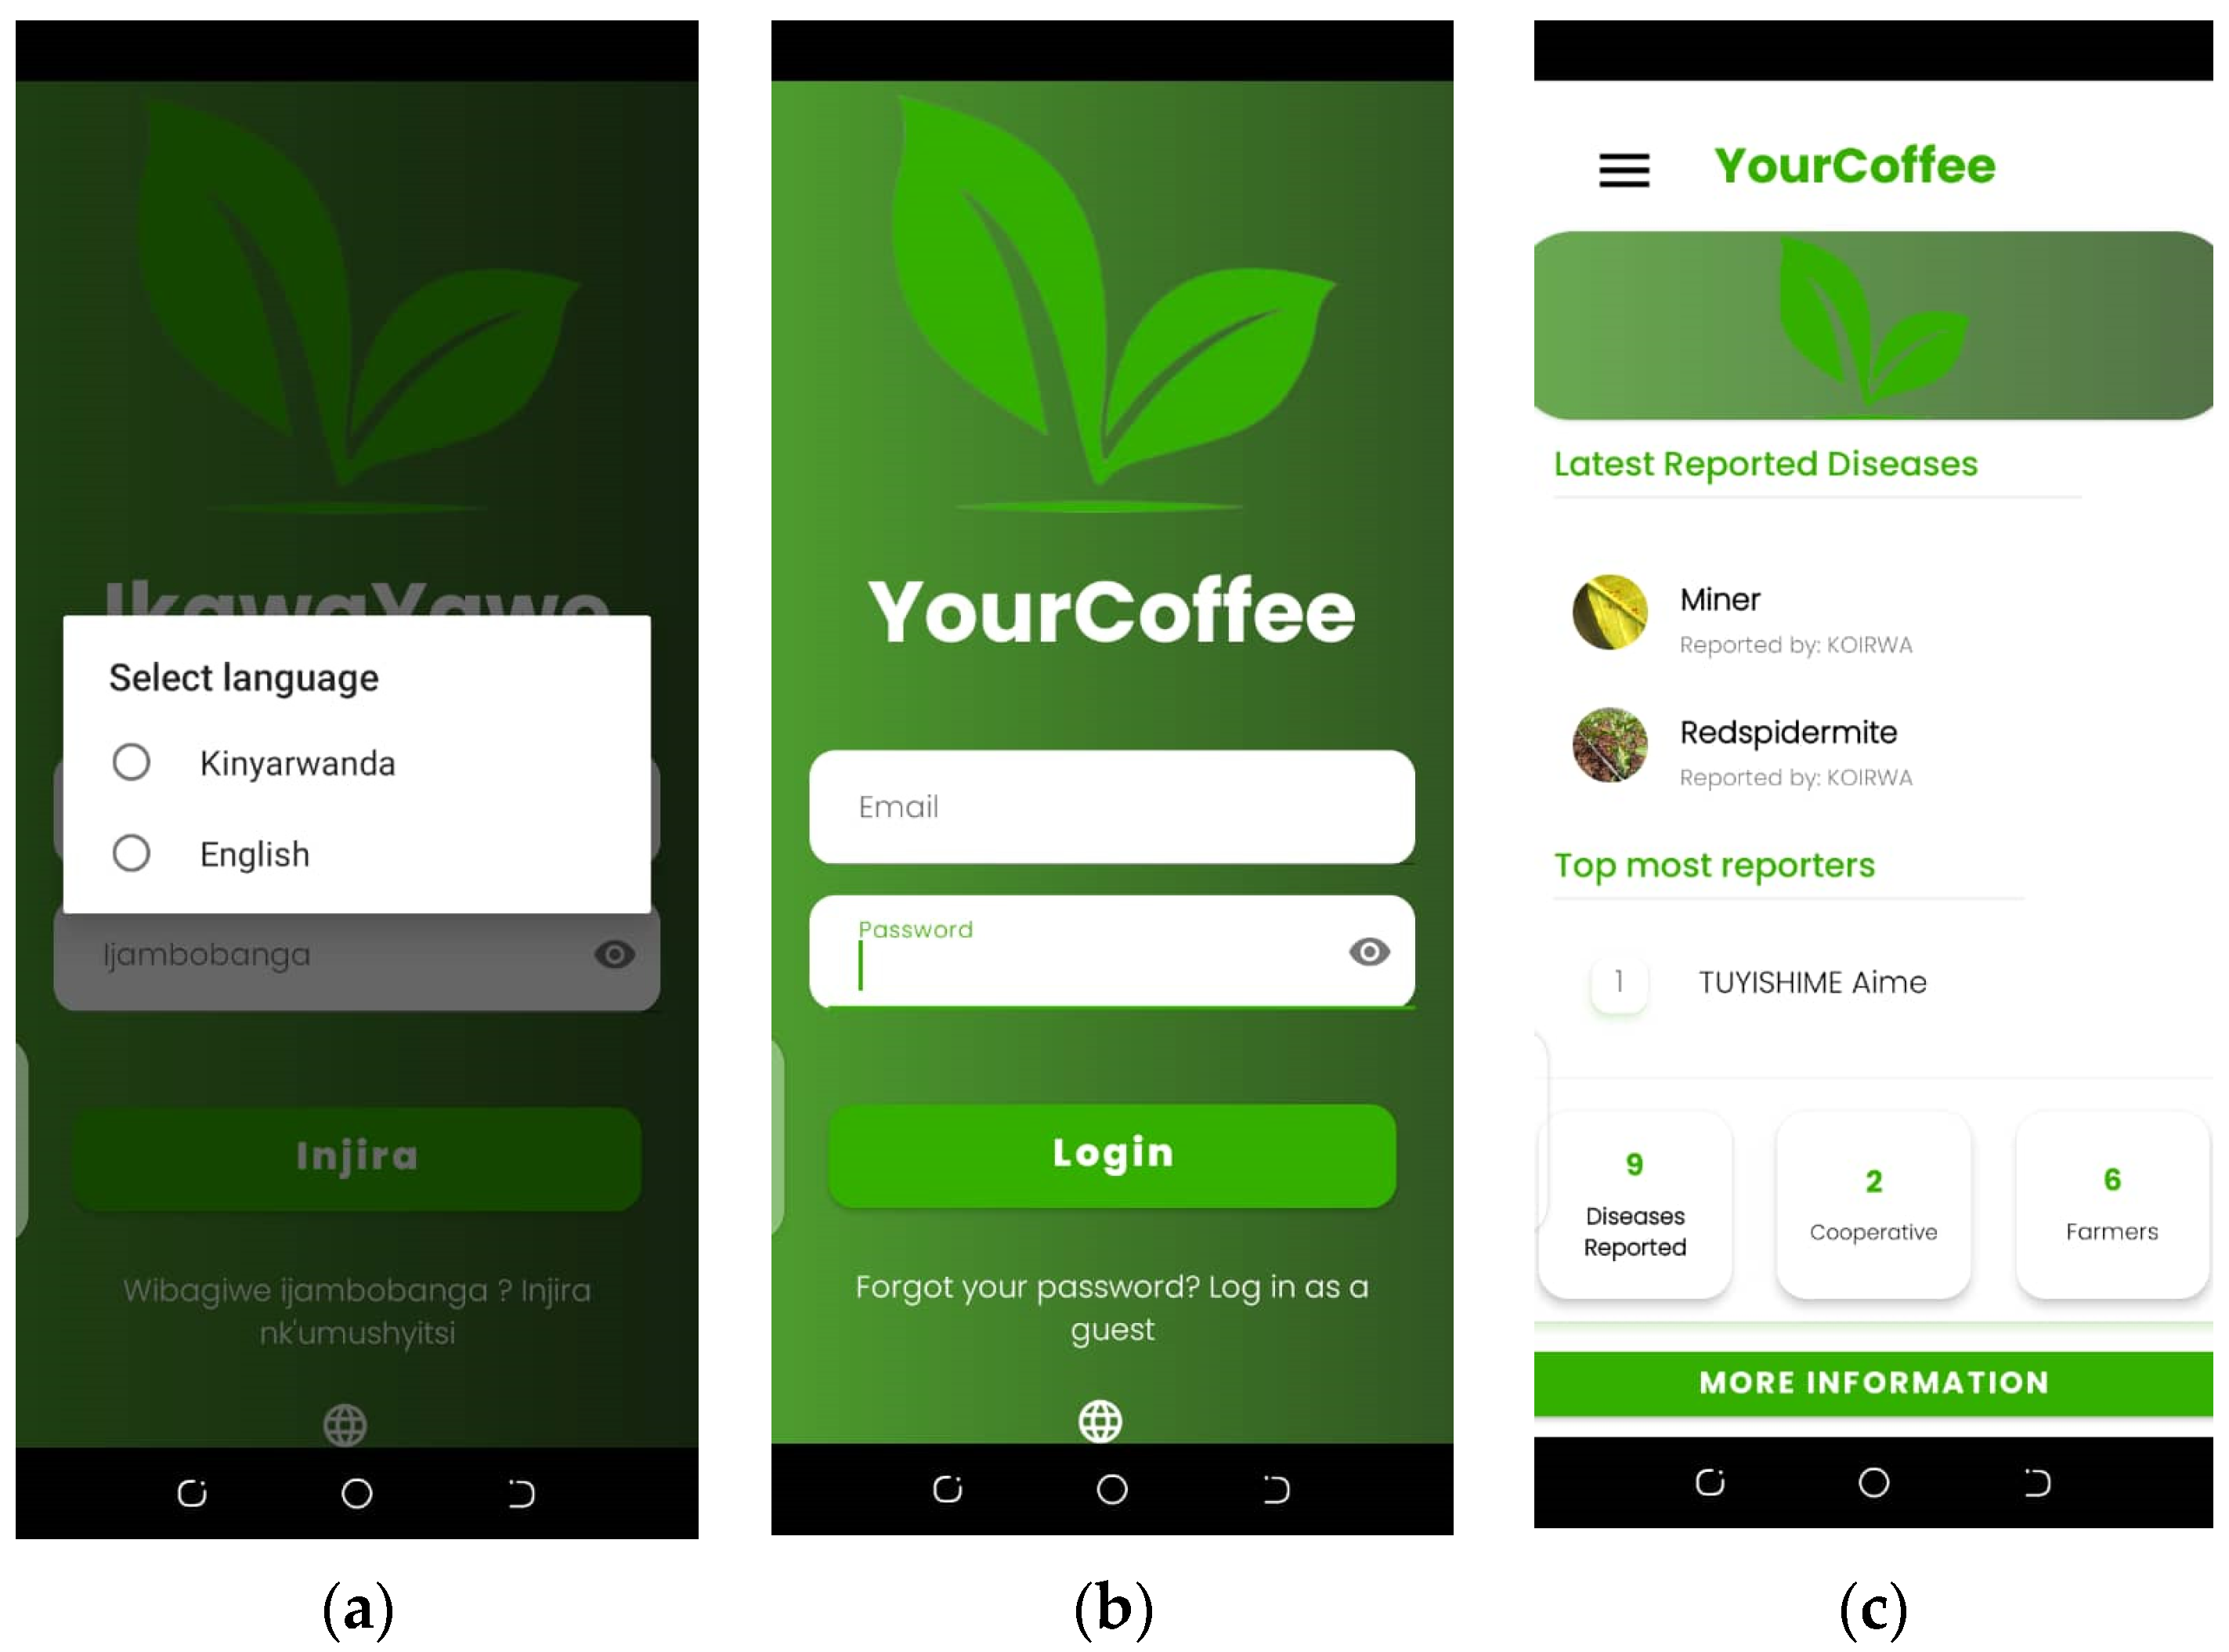
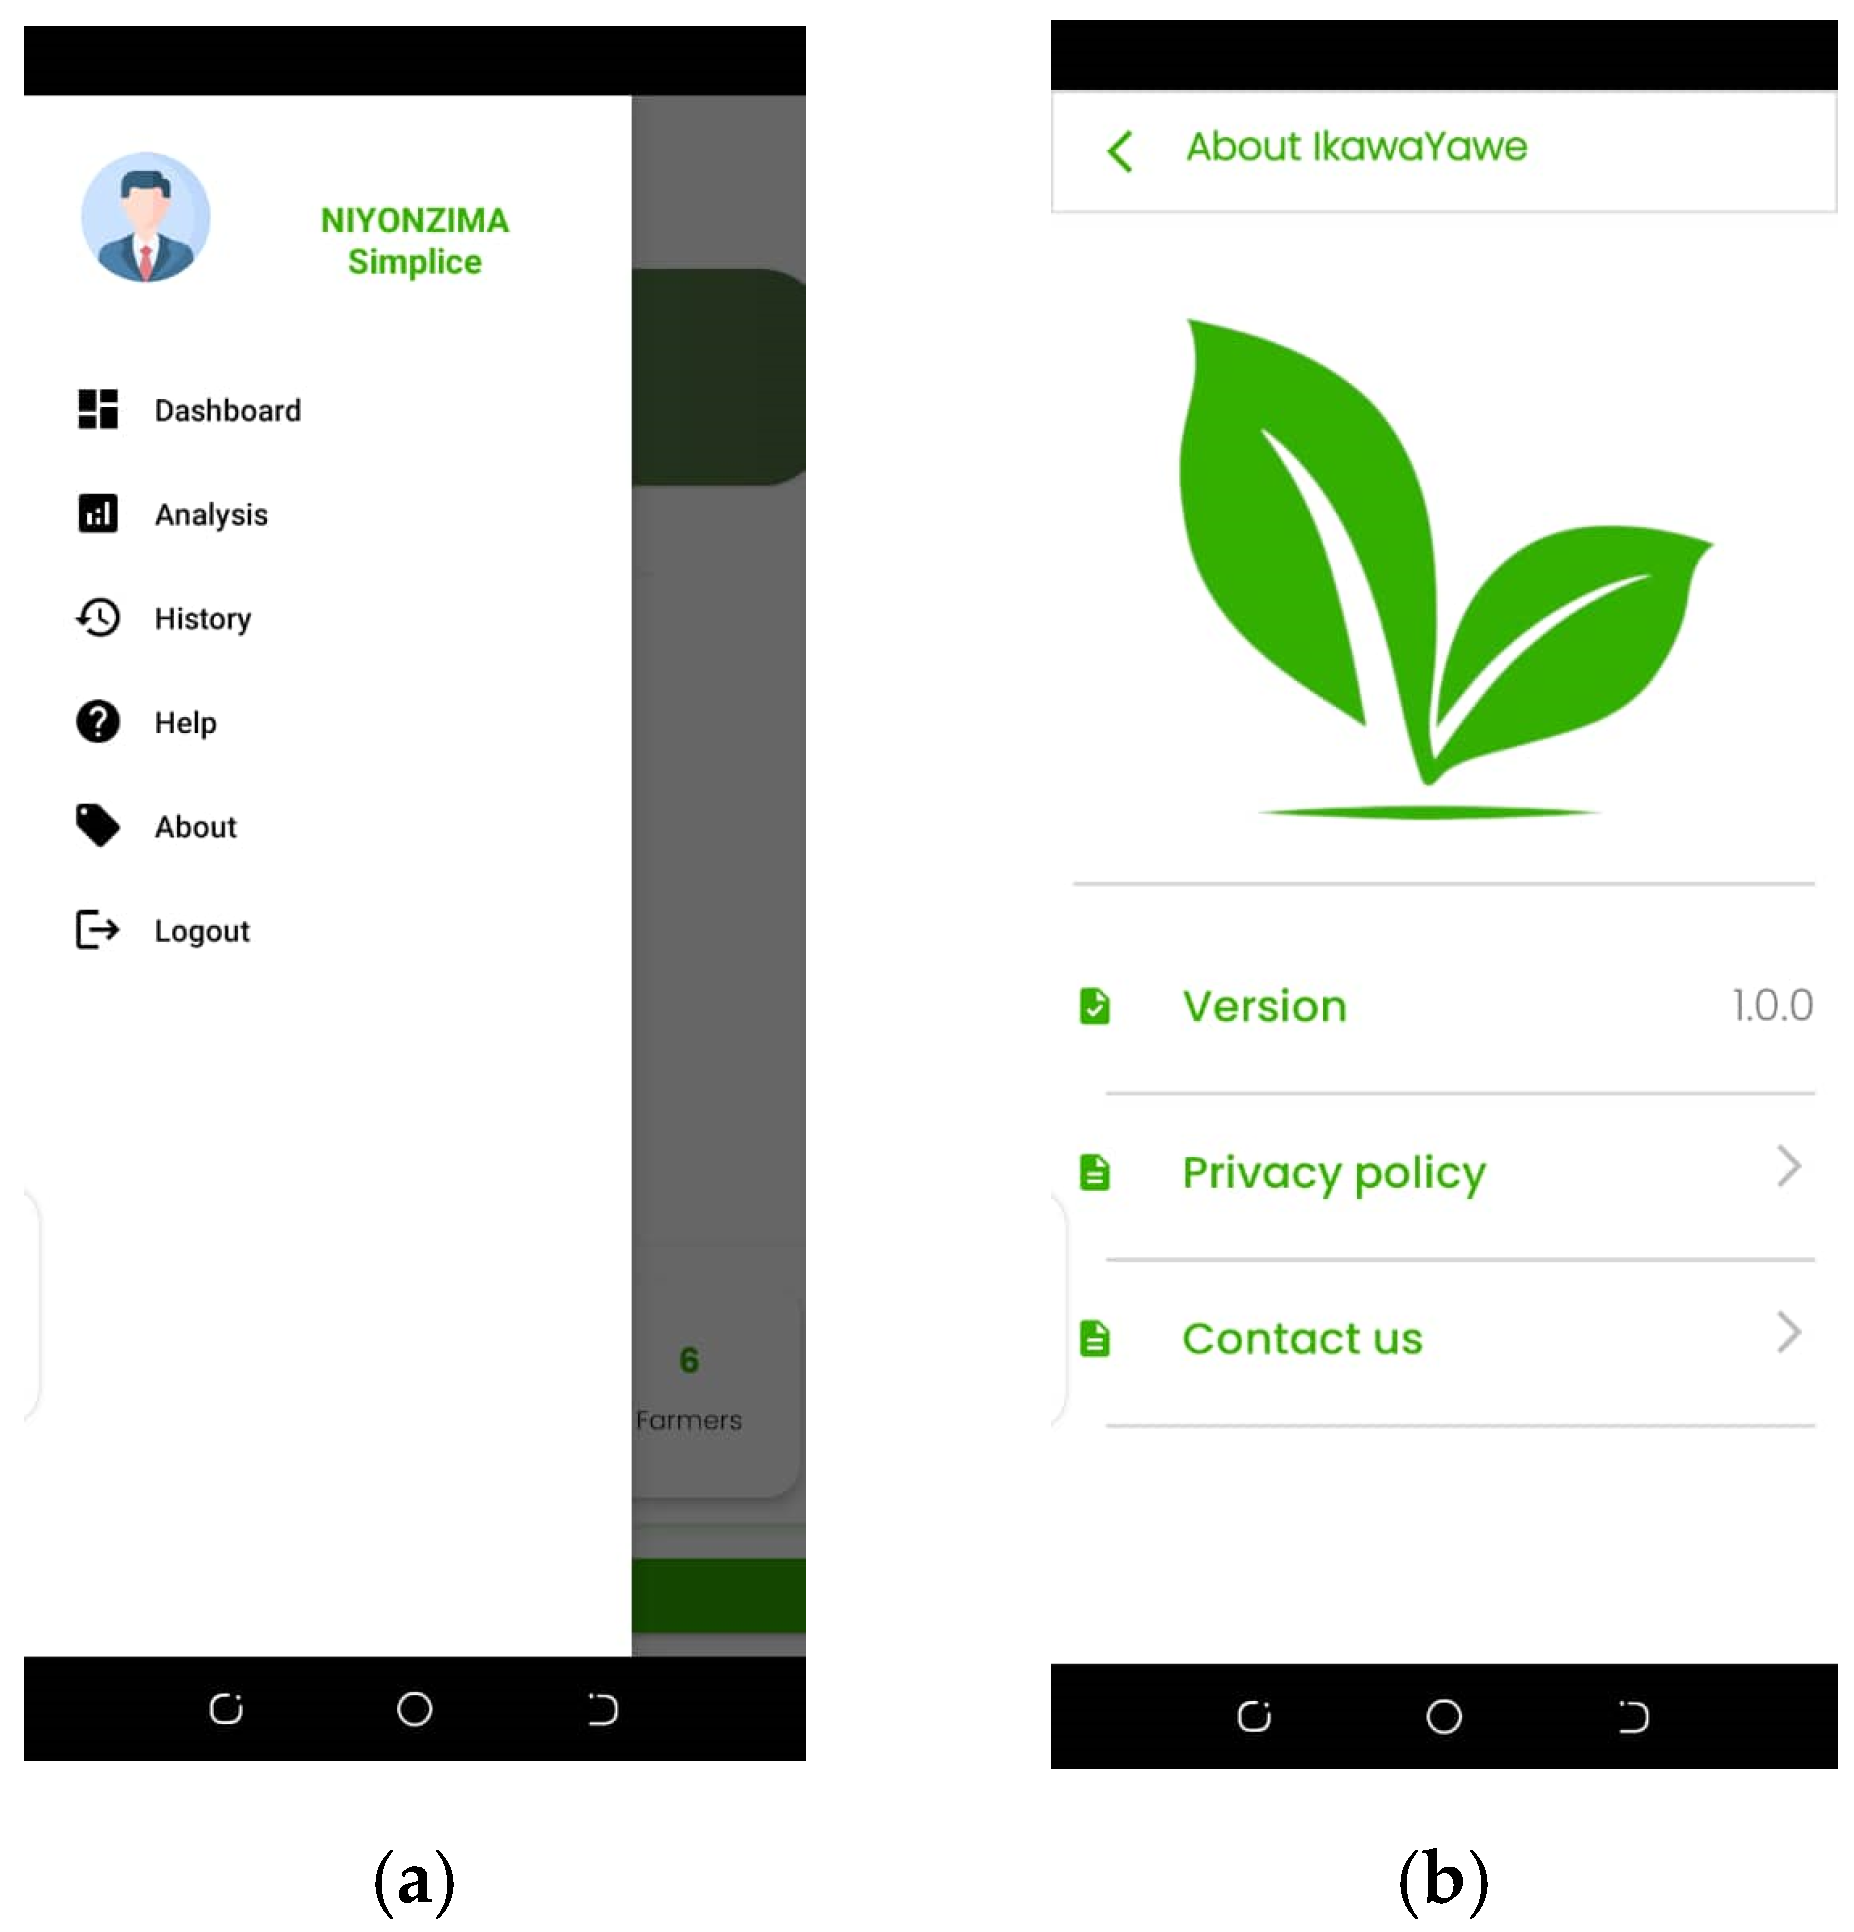
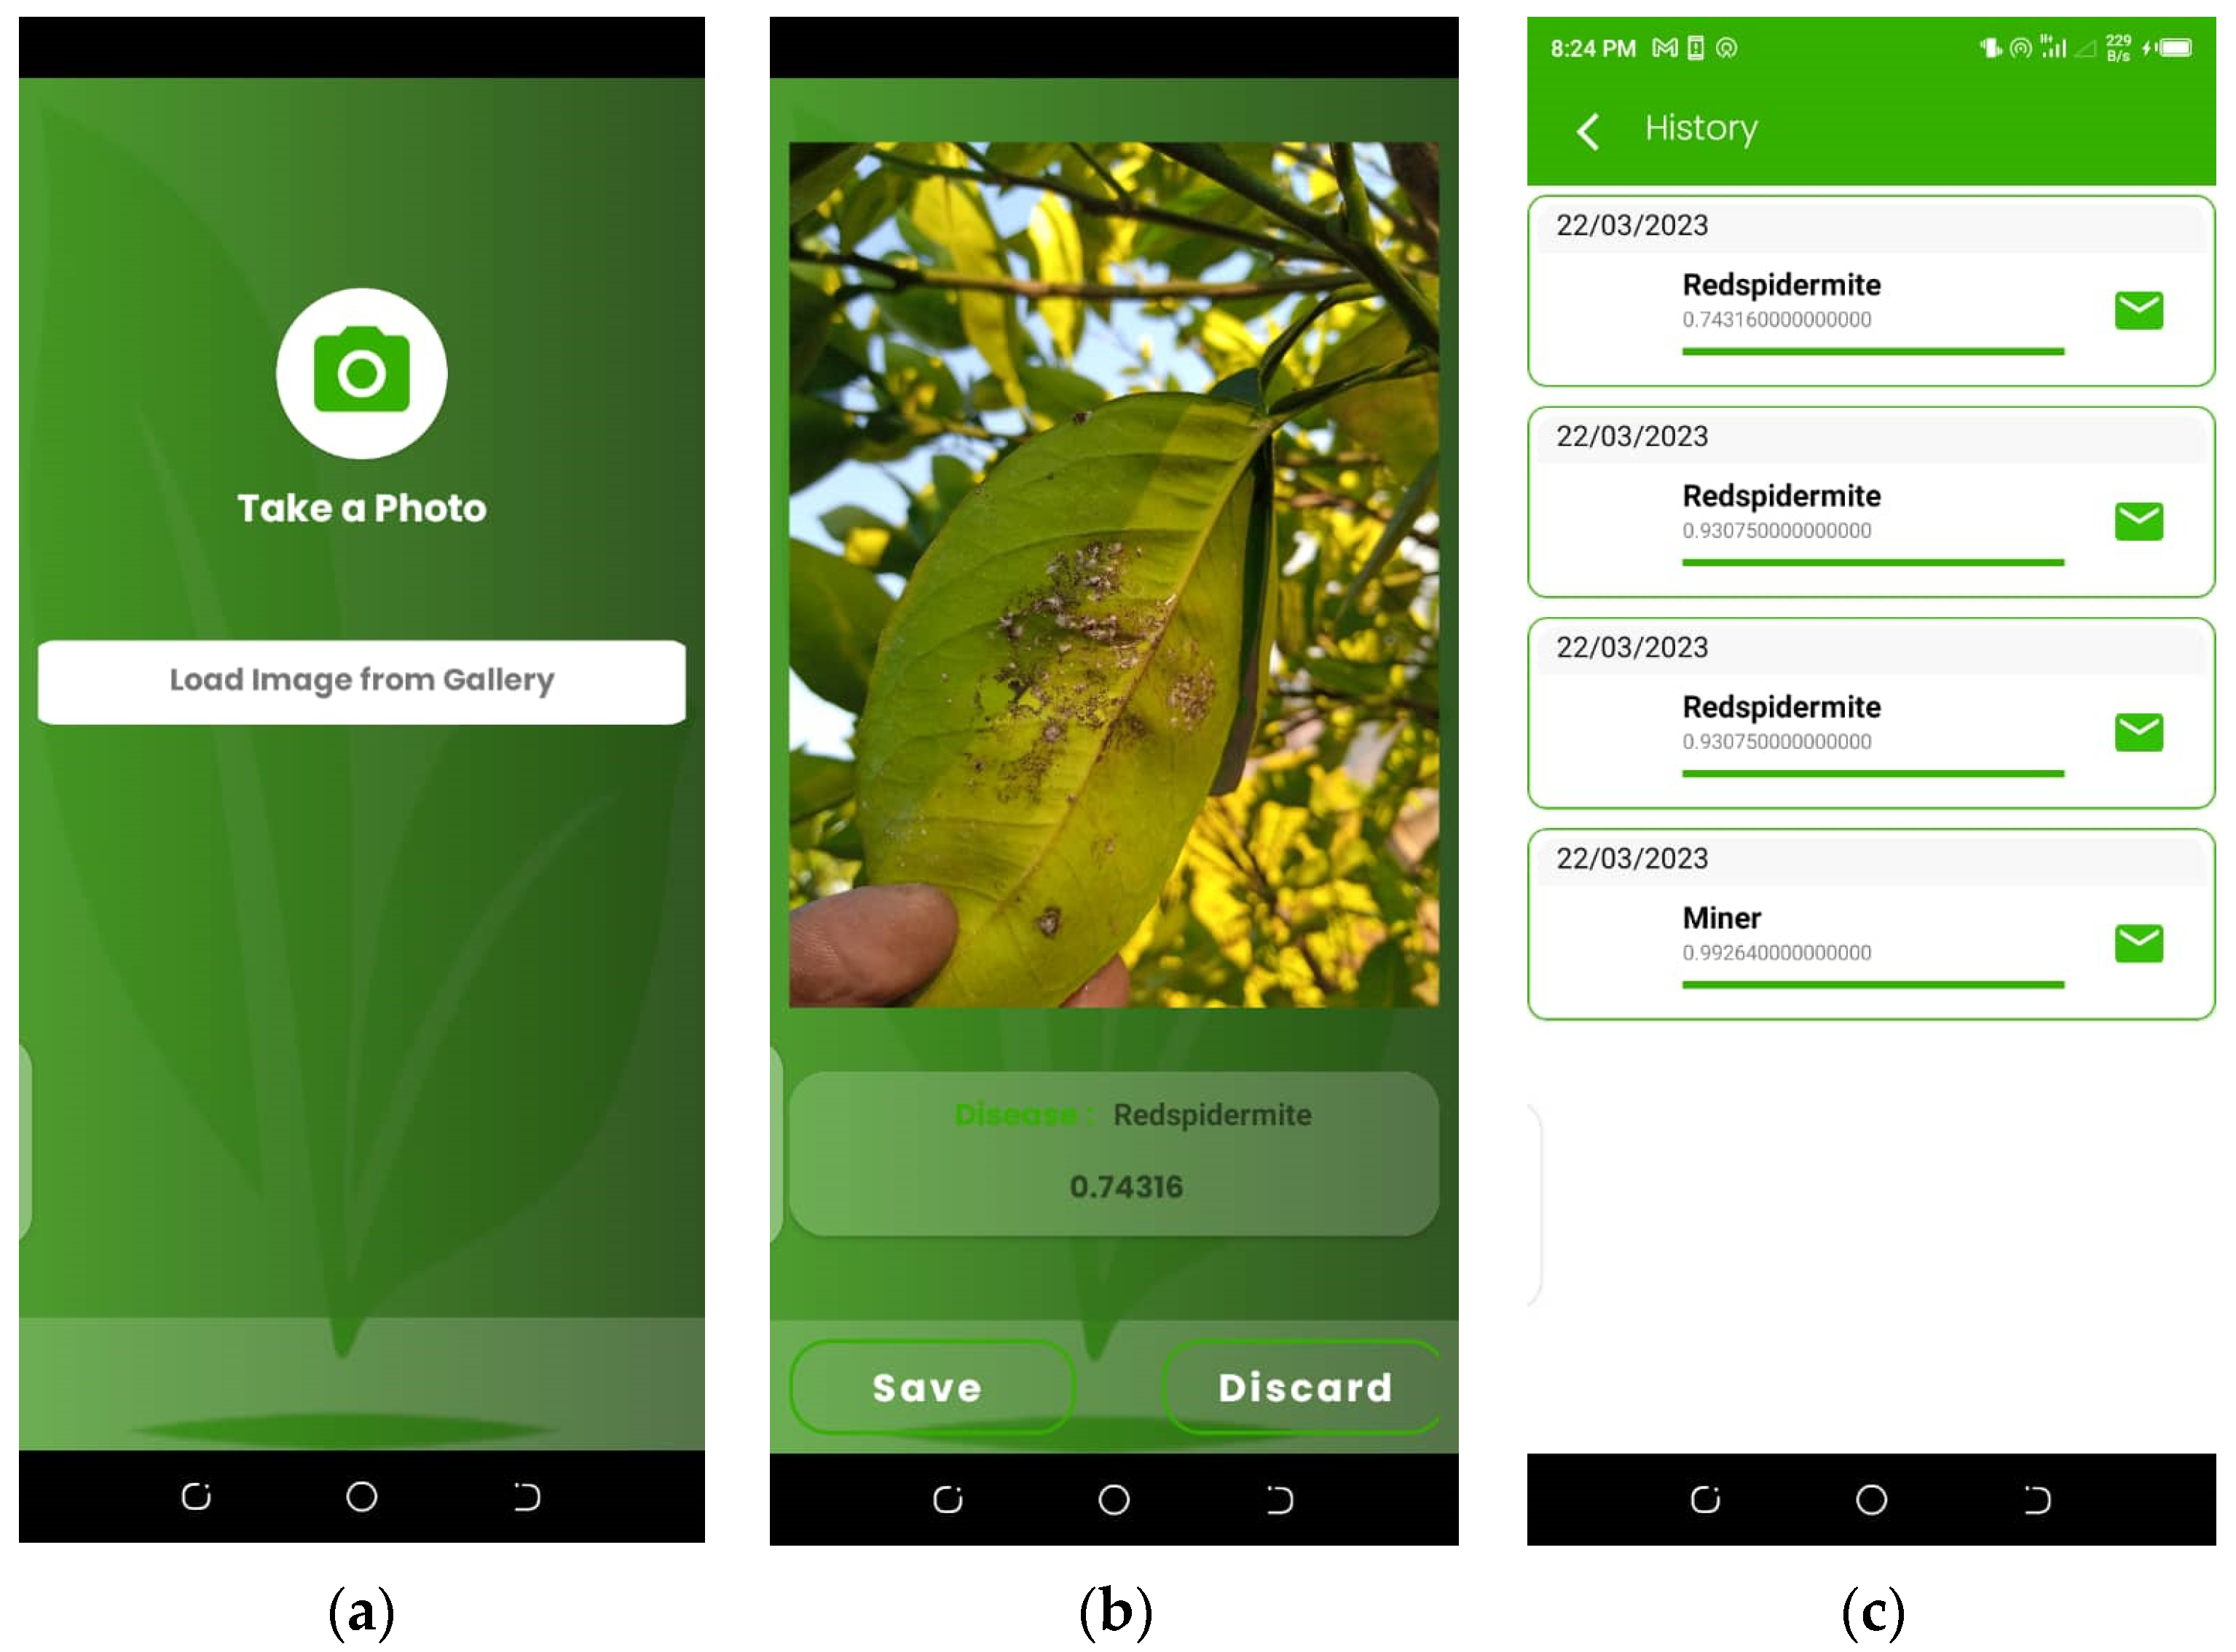
4.2. Mobile Application as a Disease Detection, Classification, and Reporting Tool
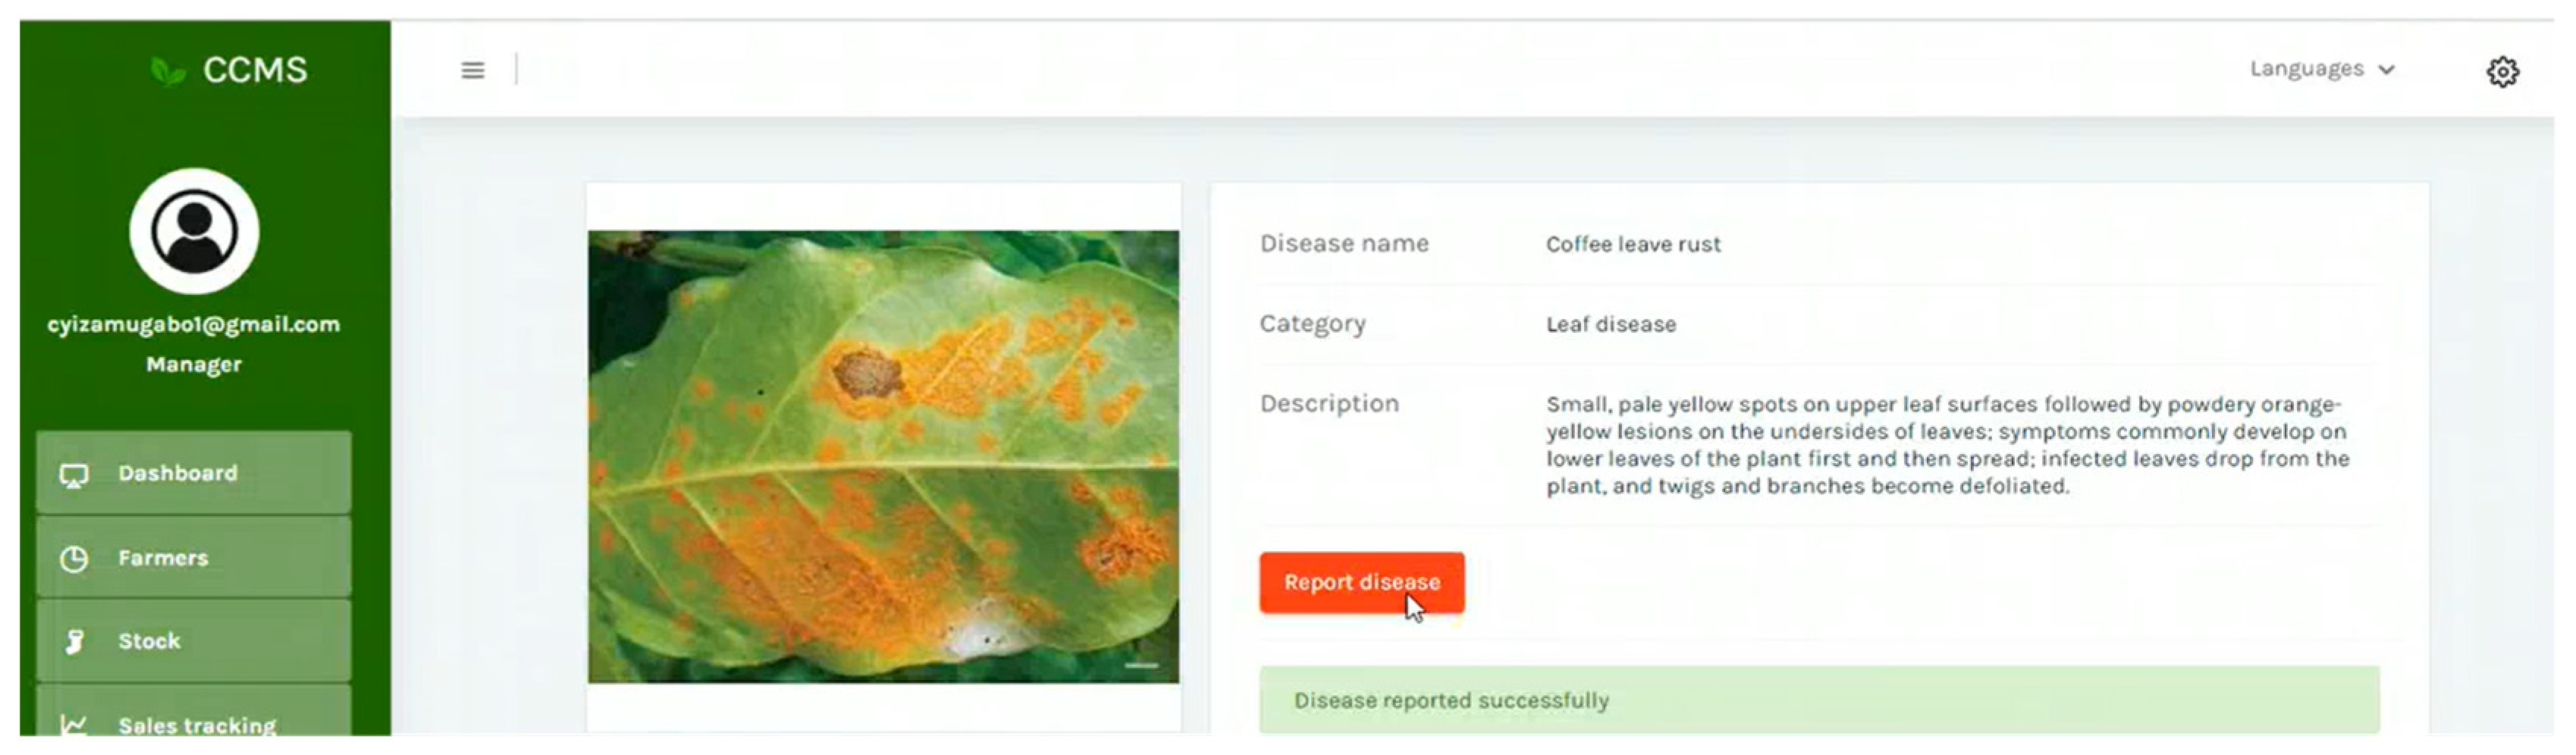
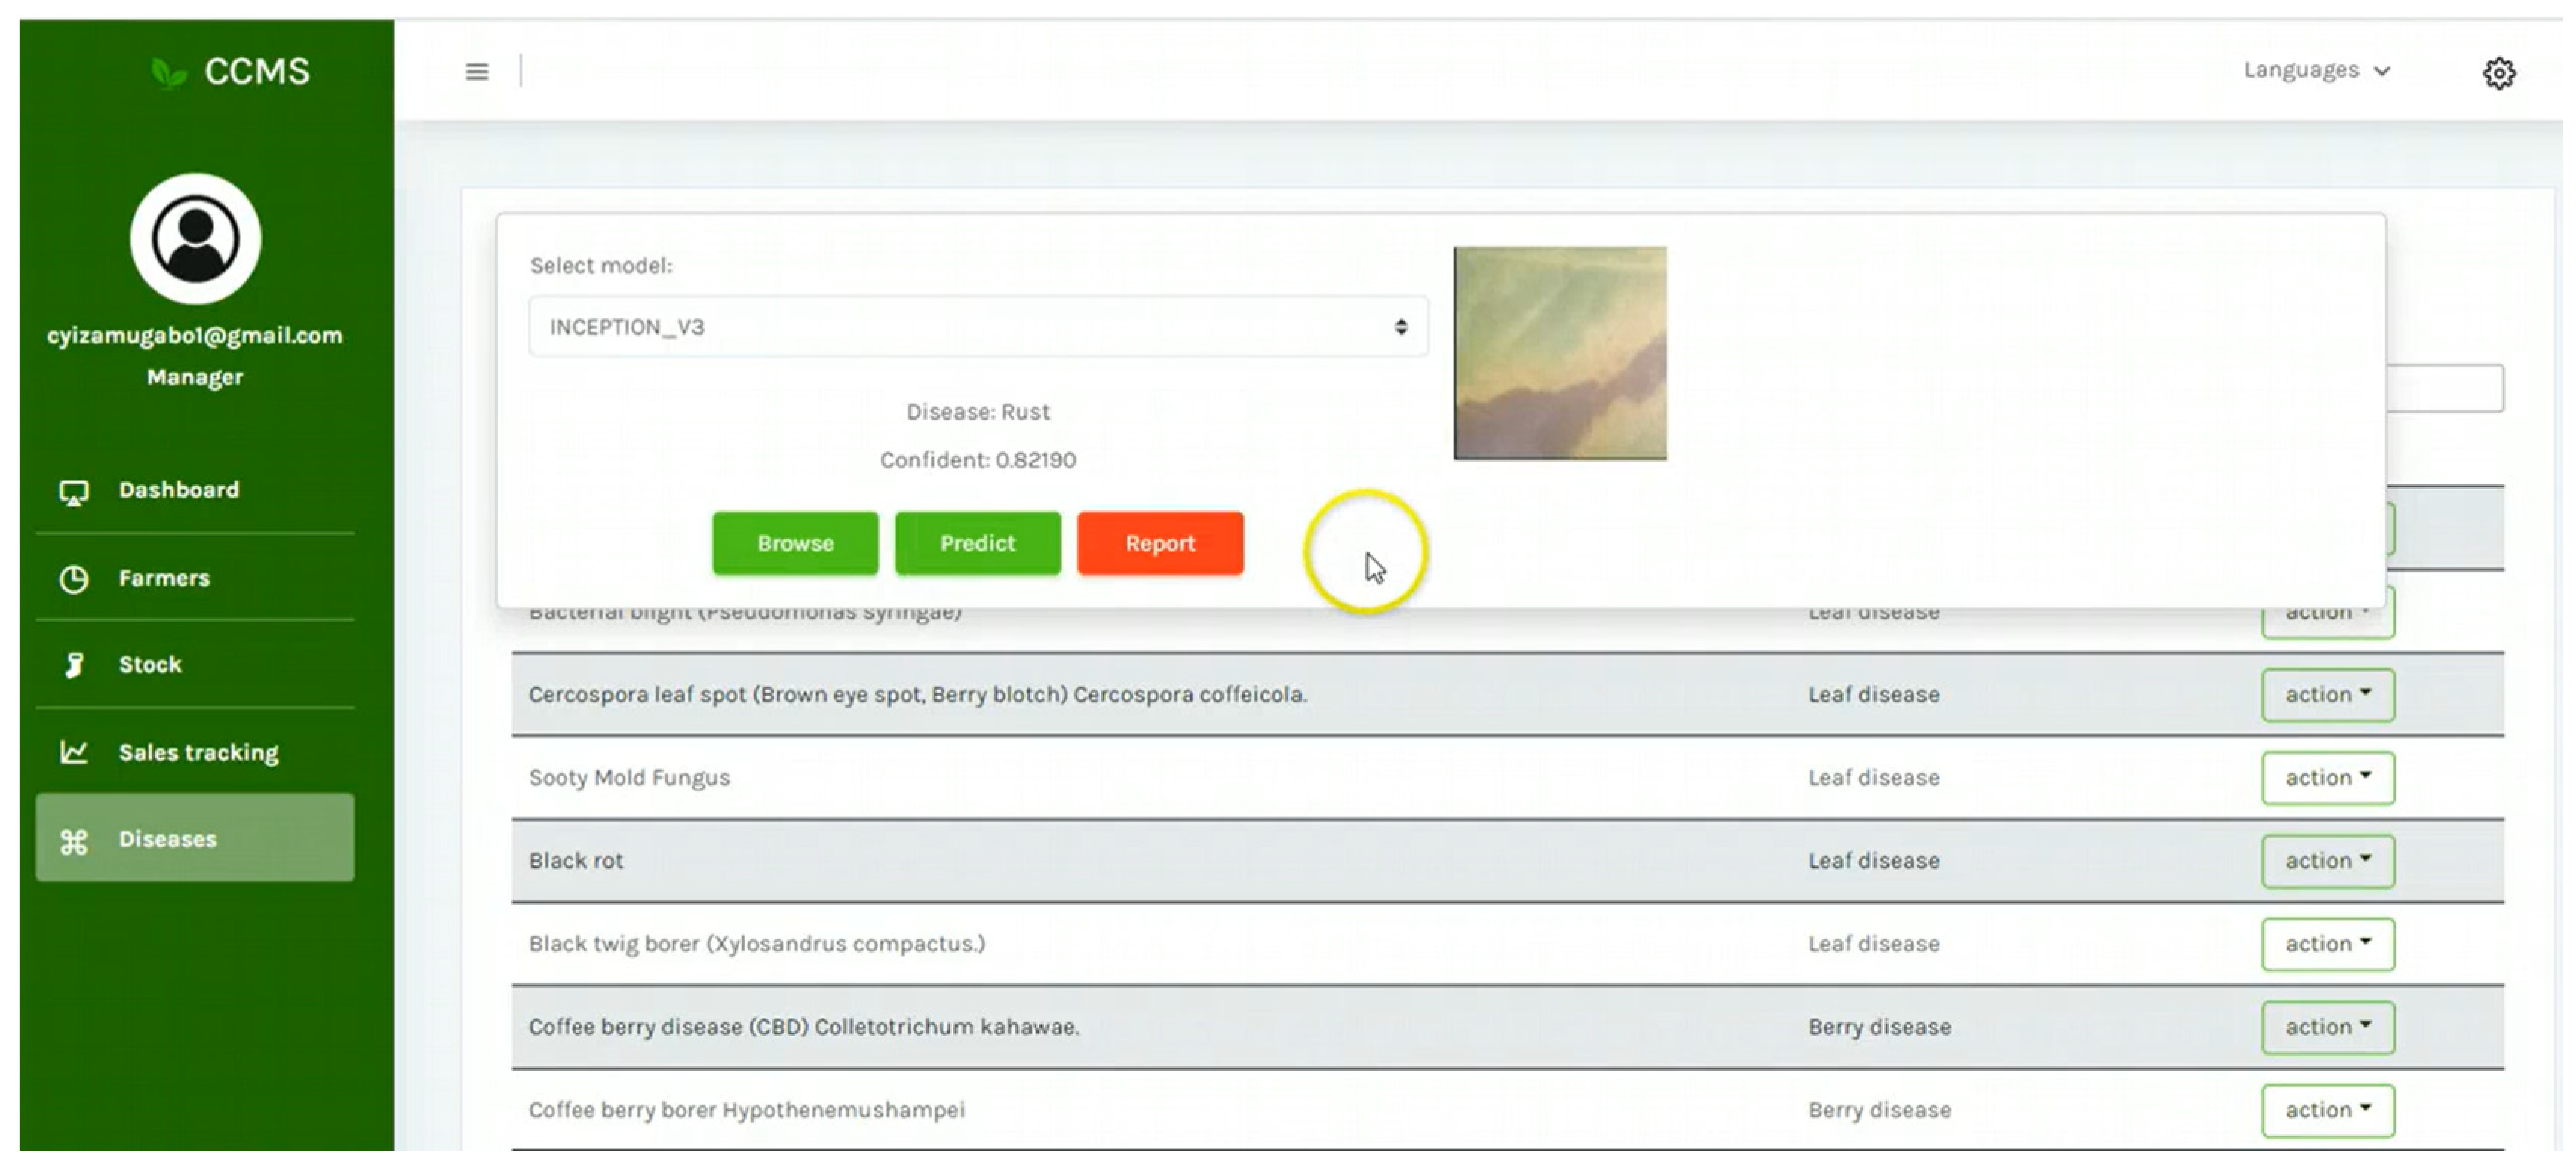
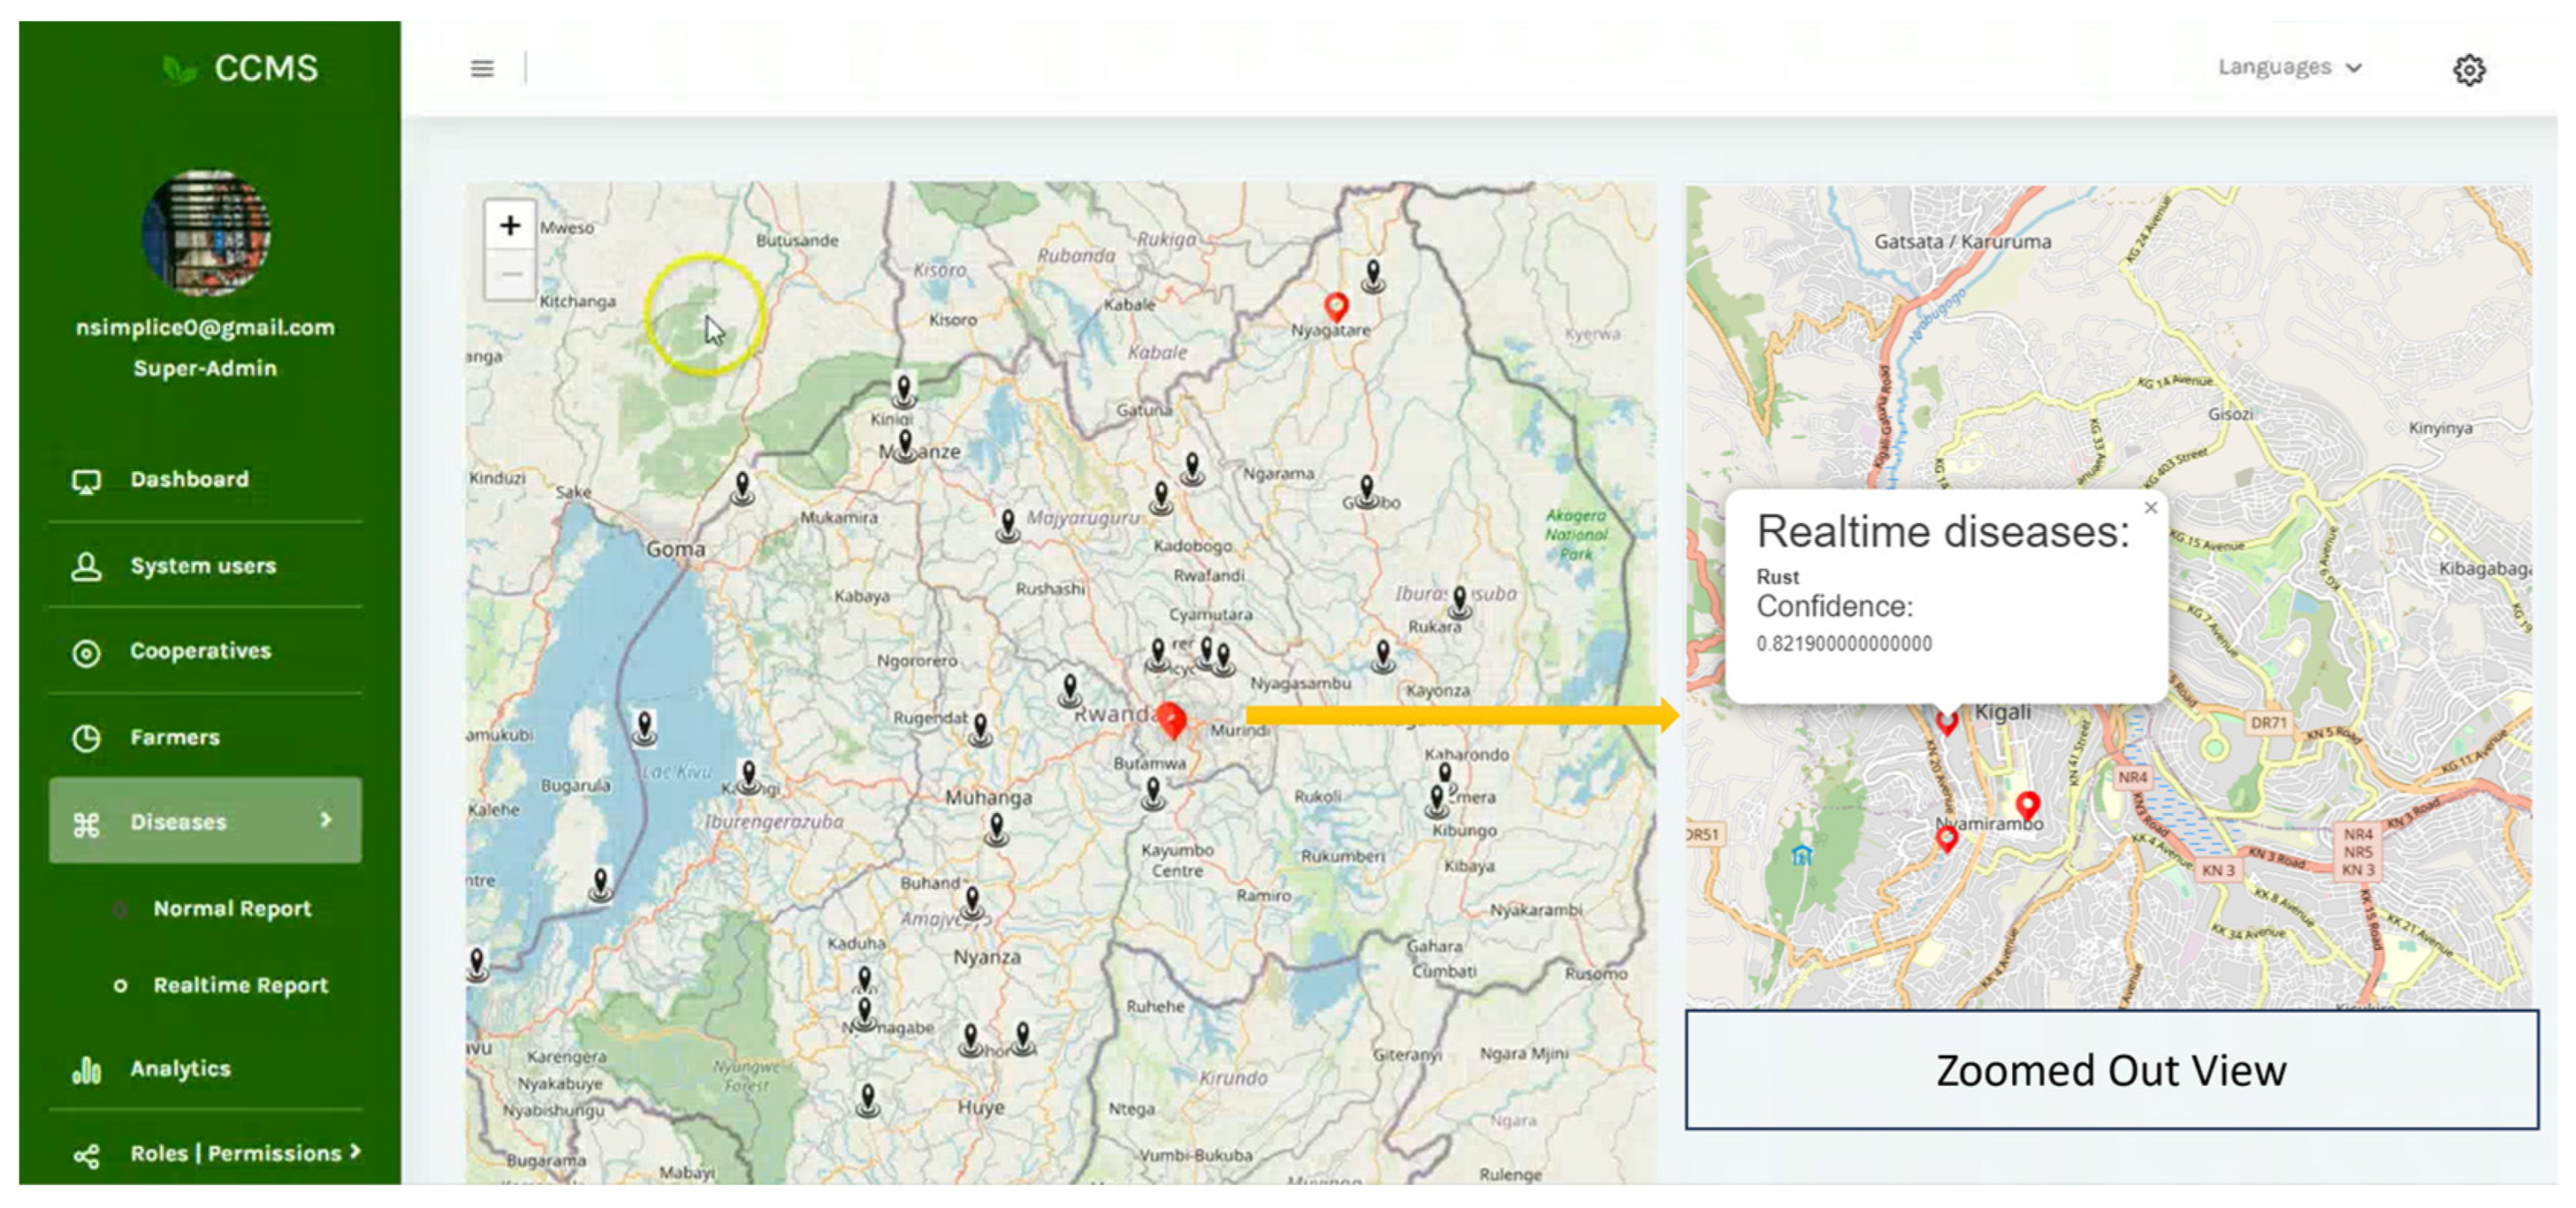
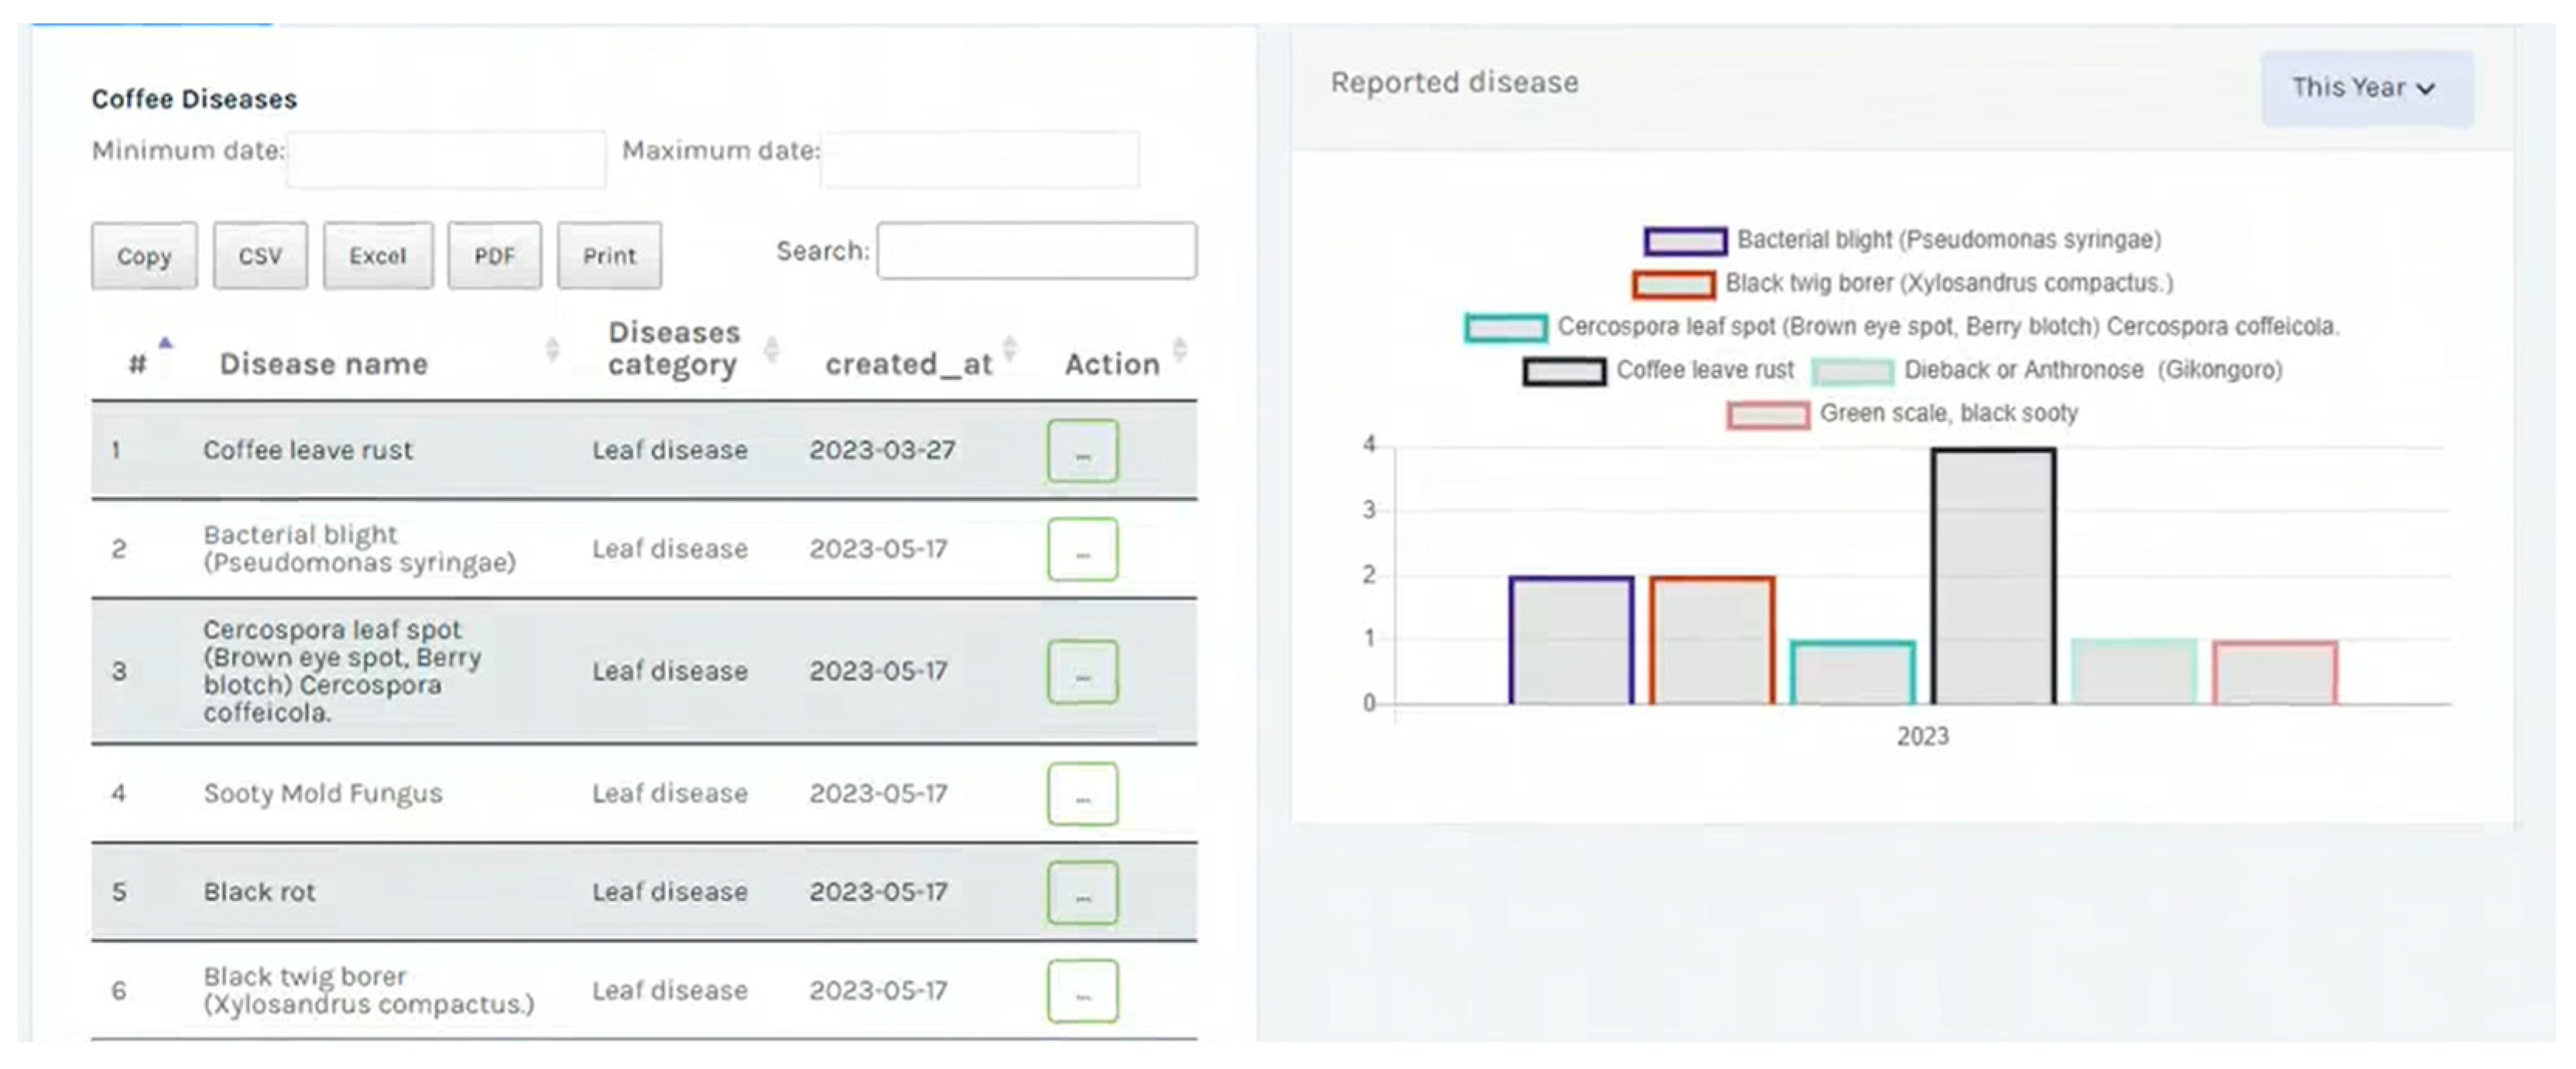
4.3. Web Application as a Data Management and Visualization Tool
5. Discussion
6. Conclusions
Author Contributions
Funding
Institutional Review Board Statement
Informed Consent Statement
Data Availability Statement
Acknowledgments
Conflicts of Interest
References
- UNCTAD. Commodities at a Glance—Special Issue on Coffee in East Africa. 2018. Available online: http://creativecommons.org/licenses/by/3.0/igo/ (accessed on 20 October 2023).
- Belay, S.; Mideksa, D.; Gebrezgiabher, S.; Seifu, W. Factors affecting coffee (Coffea arabica L.) quality in Ethiopia: A review. J. Multidiscip. Sci. Res. 2016, 4, 27–33. [Google Scholar]
- Increasing Agri-Export. NAEB Strategic Plan, Kigali. 2019. Available online: https://naeb.gov.rw/fileadmin/documents/191126NAEBStrategy2019-2024_FINAL.pdf (accessed on 21 October 2023).
- Behuria, P. The Politics of Upgrading in Global Value Chains: The Case of Rwanda’s Coffee Sector October 2018; ESID Working Paper No. 108; The University of Manchester: Manchester, UK, 2018. [Google Scholar] [CrossRef]
- Waller, J.M. Control of Coffee Diseases. In Coffee; Springer: Boston, MA, USA, 1985; pp. 219–229. [Google Scholar] [CrossRef]
- Etana, M.B. A review on the status of coffee berry disease (Colletotrichum kahawae) in Ethiopia. Am. J. Food Technol. 2019, 76, 71–76. [Google Scholar]
- Nair, K.P.P. Coffee. In The Agronomy and Economy of Important Tree Crops of the Developing World; Elsevier: Burlington, MA, USA, 2010; pp. 181–208. [Google Scholar] [CrossRef]
- Eskes, A.B. Incomplete Resistance to Coffee Leaf Rust. In Durable Resistance in Crops; Lamberti, F., Waller, J.M., Van der Graaff, N.A., Eds.; Springer: New York, NY, USA; Boston, MA, USA, 1983; pp. 291–315. [Google Scholar] [CrossRef]
- Boa Sorte, L.X.; Ferraz, C.T.; Fambrini, F.; Goulart, R.D.R.; Saito, J.H. Coffee leaf disease recognition based on deep learning and texture attributes. Procedia Comput. Sci. 2019, 159, 135–144. [Google Scholar] [CrossRef]
- Bigirimana, J. Incidence and severity of coffee leaf rust and other coffee pests and diseases in Rwanda. Afr. J. Agric. Res. 2012, 7, 3847–3852. [Google Scholar] [CrossRef]
- Bigirimana, J.; Adams, C.G.; Gatarayiha, C.M.; Muhutu, J.C.; Gut, L.J. Occurrence of potato taste defect in coffee and its relations with management practices in Rwanda. Agric. Ecosyst. Environ. 2019, 269, 82–87. [Google Scholar] [CrossRef]
- Aristizábal, L.F.; Johnson, M.A. Monitoring Coffee Leaf Rust (Hemileia vastatrix) on Commercial Coffee Farms in Hawaii: Early Insights from the First Year of Disease Incursion. Agronomy 2022, 12, 1134. [Google Scholar] [CrossRef]
- Li, K.; Hajian-Forooshani, Z.; Vandermeer, J.; Perfecto, I. Coffee leaf rust (Hemileia vastatrix) is spread by rain splash from infected leaf litter in a semi-controlled experiment. J. Plant Pathol. 2023, 105, 667–672. [Google Scholar] [CrossRef]
- Gichuru, E.; Alwora, G.; Gimase, J.; Kathurima, C. Coffee Leaf Rust (Hemileia vastatrix) in Kenya—A Review. Agronomy 2021, 11, 2590. [Google Scholar] [CrossRef]
- Talhinhas, P.; Batista, D.; Diniz, I.; Vieira, A.; Silva, D.N.; Loureiro, A.; Tavares, S.; Pereira, A.P.; Azinheira, H.G.; Guerra-Guimarães, L.; et al. The coffee leaf rust pathogen Hemileia vastatrix: One and a half centuries around the tropics. Mol. Plant Pathol. 2017, 18, 1039–1051. [Google Scholar] [CrossRef]
- Avelino, J.; Gagliardi, S.; Perfecto, I.; Isaac, M.E.; Liebig, T.; Vandermeer, J.; Merle, I.; Hajian-Forooshani, Z.; Motisi, N. Tree Effects on Coffee Leaf Rust at Field and Landscape Scales. Plant Dis. 2023, 107, 247–261. [Google Scholar] [CrossRef] [PubMed]
- Koutouleas, D.B. Collinge, Coffee Leaf Rust Back with a Vengeance. 2022. Available online: www.bspp.org.uk (accessed on 24 December 2023).
- Nelson, S.C. Cercospora leaf spot and berry blotch of coffee. Plant Dis. 2008, PD-41, 1–6. Available online: http://www.ctahr.hawaii.edu/freepubs (accessed on 24 December 2023).
- Tembo, S.M. Cercospora Leaf Spot of Coffee: Cercospora Coffeicola; (Brown Eye Spot, Berry Blotch in English). PlantwisePlus Knowledge Bank: Beijing, China, 2023. [Google Scholar] [CrossRef]
- Luzinda, H.; Nelima, M.; Wabomba, A.; Kangire, A.; Musoli, P.; Musebe, R. Farmer awareness, coping mechanisms and economic implications of coffee leaf rust disease in Uganda. Uganda J. Agric. Sci. 2016, 16, 207–217. [Google Scholar] [CrossRef]
- Javaid, M.; Haleem, A.; Khan, I.H.; Suman, R. Understanding the potential applications of Artificial Intelligence in the Agriculture Sector. Adv. Agrochem 2023, 2, 15–30. [Google Scholar] [CrossRef]
- Shahi, T.B.; Xu, C.-Y.; Neupane, A.; Guo, W. Recent Advances in Crop Disease Detection Using UAV and Deep Learning Techniques. Remote Sens. 2023, 15, 2450. [Google Scholar] [CrossRef]
- Yashwanth, M.; Chandra, M.L.; Pallavi, K.; Showkat, D.; Kumar, P.S. Agriculture Automation using Deep Learning Methods Implemented using Keras. In Proceedings of the 2020 IEEE International Conference for Innovation in Technology (INOCON 2020), Bangalore, India, 6–8 November 2020; pp. 1–6. [Google Scholar] [CrossRef]
- Paulos, E.B.; Woldeyohannis, M.M. Detection and Classification of Coffee Leaf Disease using Deep Learning. In Proceedings of the 2022 International Conference on Information and Communication Technology for Development for Africa (ICT4DA 2022), Bahir Dar, Ethiopia, 28–30 November 2022; pp. 1–6. [Google Scholar] [CrossRef]
- Abuhayi, B.M.; Mossa, A.A. Coffee disease classification using Convolutional Neural Network based on feature concatenation. Inform. Med. Unlocked 2023, 39, 101245. [Google Scholar] [CrossRef]
- Yamashita, J.V.Y.B.; Leite, J.P.R. Coffee disease classification at the edge using deep learning. Smart Agric. Technol. 2023, 4, 100183. [Google Scholar] [CrossRef]
- Hitimana, E.; Sinayobye, O.J.; Ufitinema, J.C.; Mukamugema, J.; Rwibasira, P.; Murangira, T.; Masabo, E.; Chepkwony, L.C.; Kamikazi, M.C.A.; Uwera, J.A.U.; et al. An Intelligent System-Based Coffee Plant Leaf Disease Recognition Using Deep Learning Techniques on Rwandan Arabica Dataset. Technologies 2023, 11, 116. [Google Scholar] [CrossRef]
- Nguyen, T.H.; Ta, X.T.; Doan, D.; Nguyen, M.S. A Full Framework of Disease Treatment Assistant System for Precision Agriculture. In Proceedings of the 2022 International Conference on Advanced Computing and Analytics, Ho Chi Minh City, Vietnam, 21–23 November 2022; pp. 48–53. [Google Scholar] [CrossRef]
- Jafar, A.; Bibi, N.; Naqvi, R.A.; Sadeghi-Niaraki, A.; Jeong, D. Revolutionizing agriculture with artificial intelligence: Plant disease detection methods, applications, and their limitations. Front. Plant Sci. 2024, 15, 1356260. [Google Scholar] [CrossRef] [PubMed]
- Barman, U.; Sarma, P.; Rahman, M.; Deka, V.; Lahkar, S.; Sharma, V.; Saikia, M.J. ViT-SmartAgri: Vision Transformer and Smartphone-Based Plant Disease Detection for Smart Agriculture. Agronomy 2024, 14, 327. [Google Scholar] [CrossRef]
- Jayashree, A.; Suresh, K.P.; Raaga, R. Advancing Coffee Leaf Rust Disease Management: A Deep Learning Approach for Accurate Detection and Classification Using Convolutional Neural Networks. J. Exp. Agric. Int. 2024, 46, 108–118. [Google Scholar] [CrossRef]
- Babatunde, R.S.; Babatunde, A.N.; Ogundokun, R.O.; Yusuf, O.K.; Sadiku, P.O.; Shah, M.A. A novel smartphone application for early detection of habanero disease. Sci. Rep. 2024, 14, 1423. [Google Scholar] [CrossRef] [PubMed]
- Nzeyimana, I. Optimizing Arabica Coffee Production Systems in Rwanda: A Multiple-Scale Analysis. 2018. Available online: https://www.researchgate.net/publication/325615794_Optimizing_Arabica_coffee_production_systems_in_Rwanda (accessed on 26 October 2023).
- Ian, G.; Bengio, Y.; Courville, A. Deep Learning; MIT Press: Cambridge, MA, USA, 2016; Available online: http://www.deeplearningbook.org (accessed on 10 November 2023).
- He, K.; Zhang, X.; Ren, S.; Sun, J. Deep residual learning for image recognition. In Proceedings of the IEEE Conference on Computer Vision and Pattern Recognition, Las Vegas, NV, USA, 27–30 June 2016; pp. 770–778. [Google Scholar] [CrossRef]
- Patterson, J.; Gibson, A.; Loukides, M.; McGovern, T. Major architectures of deep networks. In Deep Learning A Practitioner’s Approach; O’Reilly Media, Inc.: Sebastopol, CA, USA, 2017; pp. 117–164. Available online: https://www.academia.edu/37119738/Deep_Learning_A_Practitioners_Approach (accessed on 18 November 2023).
- Demilie, W.B. Plant disease detection and classification techniques: A comparative study of the performances. J. Big Data 2024, 11, 5. [Google Scholar] [CrossRef]
- Hitimana, E.; Bajpai, G.; Musabe, R.; Sibomana, L.; Kayalvizhi, J. Implementation of IoT Framework with Data Analysis Using Deep Learning Methods for Occupancy Prediction in a Building. Future Internet 2021, 13, 67. [Google Scholar] [CrossRef]
- Kuradusenge, M.; Hitimana, E.; Hanyurwimfura, D.; Rukundo, P.; Mtonga, K.; Mukasine, A.; Uwitonze, C.; Ngabonziza, J.; Uwamahoro, A. Crop Yield Prediction Using Machine Learning Models: Case of Irish Potato and Maize. Agriculture 2023, 13, 225. [Google Scholar] [CrossRef]
- Tzenetopoulos, A.; Masouros, D.; Koliogeorgi, K.; Xydis, S.; Soudris, D.; Chazapis, A.; Acquaviva, J. EVOLVE: Towards converging big-data, high-performance, and cloud-computing worlds. In Proceedings of the 2022 Design, Automation & Test in Europe Conference & Exhibition, Antwerp, Belgium, 14–23 March 2022; pp. 975–980. [Google Scholar]
- Niu, C.; Wang, L. Big data-driven scheduling optimization algorithm for Cyber-Physical Systems based on a cloud platform. Comput. Commun. 2022, 181, 173–181. [Google Scholar] [CrossRef]
- Wan, S.; Ding, S.; Chen, C. Edge computing enabled video segmentation for real-time traffic monitoring in the Internet of Vehicles. Pattern Recognit. 2022, 121, 108146. [Google Scholar] [CrossRef]
- Zhou, S.; Wei, C.; Song, C.; Pan, X.; Chang, W.; Yang, L. Short-term traffic flow prediction of the smart city using 5G internet of vehicles based on edge computing. IEEE Trans. Intell. Transp. Syst. 2022, 24, 2229–2238. [Google Scholar] [CrossRef]
- Ahmad, J.; Jan, B.; Farman, H.; Ahmad, W.; Ullah, A. Disease detection in plum using convolutional neural network under true field conditions. Sensors 2020, 20, 5569. [Google Scholar] [CrossRef] [PubMed]
- Senington, R.; Pataki, B.; Wang, X.V. Using docker for factory system software management: Experience report. Procedia CIRP 2018, 72, 659–664. [Google Scholar] [CrossRef]
- Mohammed, H.; Faraj, K. A Python-WSGI and PHP-Apache Web Server Performance Analysis by Search Page Generator (SPG). UKH J. Sci. Eng. 2021, 5, 132–138. [Google Scholar] [CrossRef]
- García, L. DEEPaaS API: A REST API for Machine Learning and Deep Learning models. J. Open Source Softw. 2019, 4, 1517. [Google Scholar] [CrossRef]
- Weber, A.S.; D’amato, D.; Atkinson, B.K. Python Regius. Herpetol. Rev. 2022, 53, 632. [Google Scholar] [CrossRef]
- Chethan, K.S.; Donepudi, S.; Supreeth, H.V.; Maani, V.D. Mobile application for classification of plant leaf diseases using image processing and neural networks. In Data Intelligence and Cognitive Informatics; Springer: Singapore, 2021; pp. 287–306. [Google Scholar] [CrossRef]
- Valdoria, J.C.; Caballeo, A.R.; Fernandez, B.I.D.; Condino, J.M.M. iDahon: An Android-based terrestrial plant disease detection mobile application through digital image processing using deep learning neural network algorithm. In Proceedings of the 2019 4th International Conference on Information Technology (InCIT), Bangkok, Thailand, 24–25 October 2019. [Google Scholar] [CrossRef]
- Syamsuri, B.; Negara, I. Plant disease classification using Lite pre-trained deep convolutional neural network on Android mobile device. Int. J. Innov. Technol. Explor. Eng. 2019, 9, 2796–2804. [Google Scholar] [CrossRef]
- Elgendy, M. Deep Learning for Vision Systems; Manning Publications: Shelter Island, NY, USA, 2020; pp. 240–262. ISBN 9781617296192. [Google Scholar]
- Tugrul, B.; Elfatimi, E.; Eryigit, R. Convolutional Neural Networks in Detection of Plant Leaf Diseases: A Review. Agriculture 2022, 12, 1192. [Google Scholar] [CrossRef]
- Shoaib, M.; Shah, B.; Ei-Sappagh, S.; Ali, A.; Ullah, A.; Alenezi, F.; Gechev, T.; Hussain, T.; Ali, F. An advanced deep learning models-based plant disease detection: A review of recent research. Front. Plant Sci. 2023, 14, 1158933. [Google Scholar] [CrossRef] [PubMed]


| Parameters | Inception-v3 | Xception | ResNet50 | DenseNet | VGG16 |
|---|---|---|---|---|---|
| Total layers | 314 | 135 | 178 | 430 | 22 |
| Max pool layers | 4 | 4 | 1 | 1 | 5 |
| Dense layers | 2 | 2 | 2 | 2 | 2 |
| Dropout layers | - | - | 2 | - | 2 |
| Flatten layers | - | - | 1 | - | 1 |
| Filter size | 1 × 1, 3 × 3, 5 × 5 | 3 × 3 | 3 × 3 | 3 × 3, 1 × 1 | 3 × 3 |
| Stride | 2 × 2 | 2 × 2 | 2 × 2 | 2 × 2 | 1 |
| Trainable parameters | 23,905,060 | 22,963,756 | 25,689,988 | 8,091,204 | 15,244,100 |
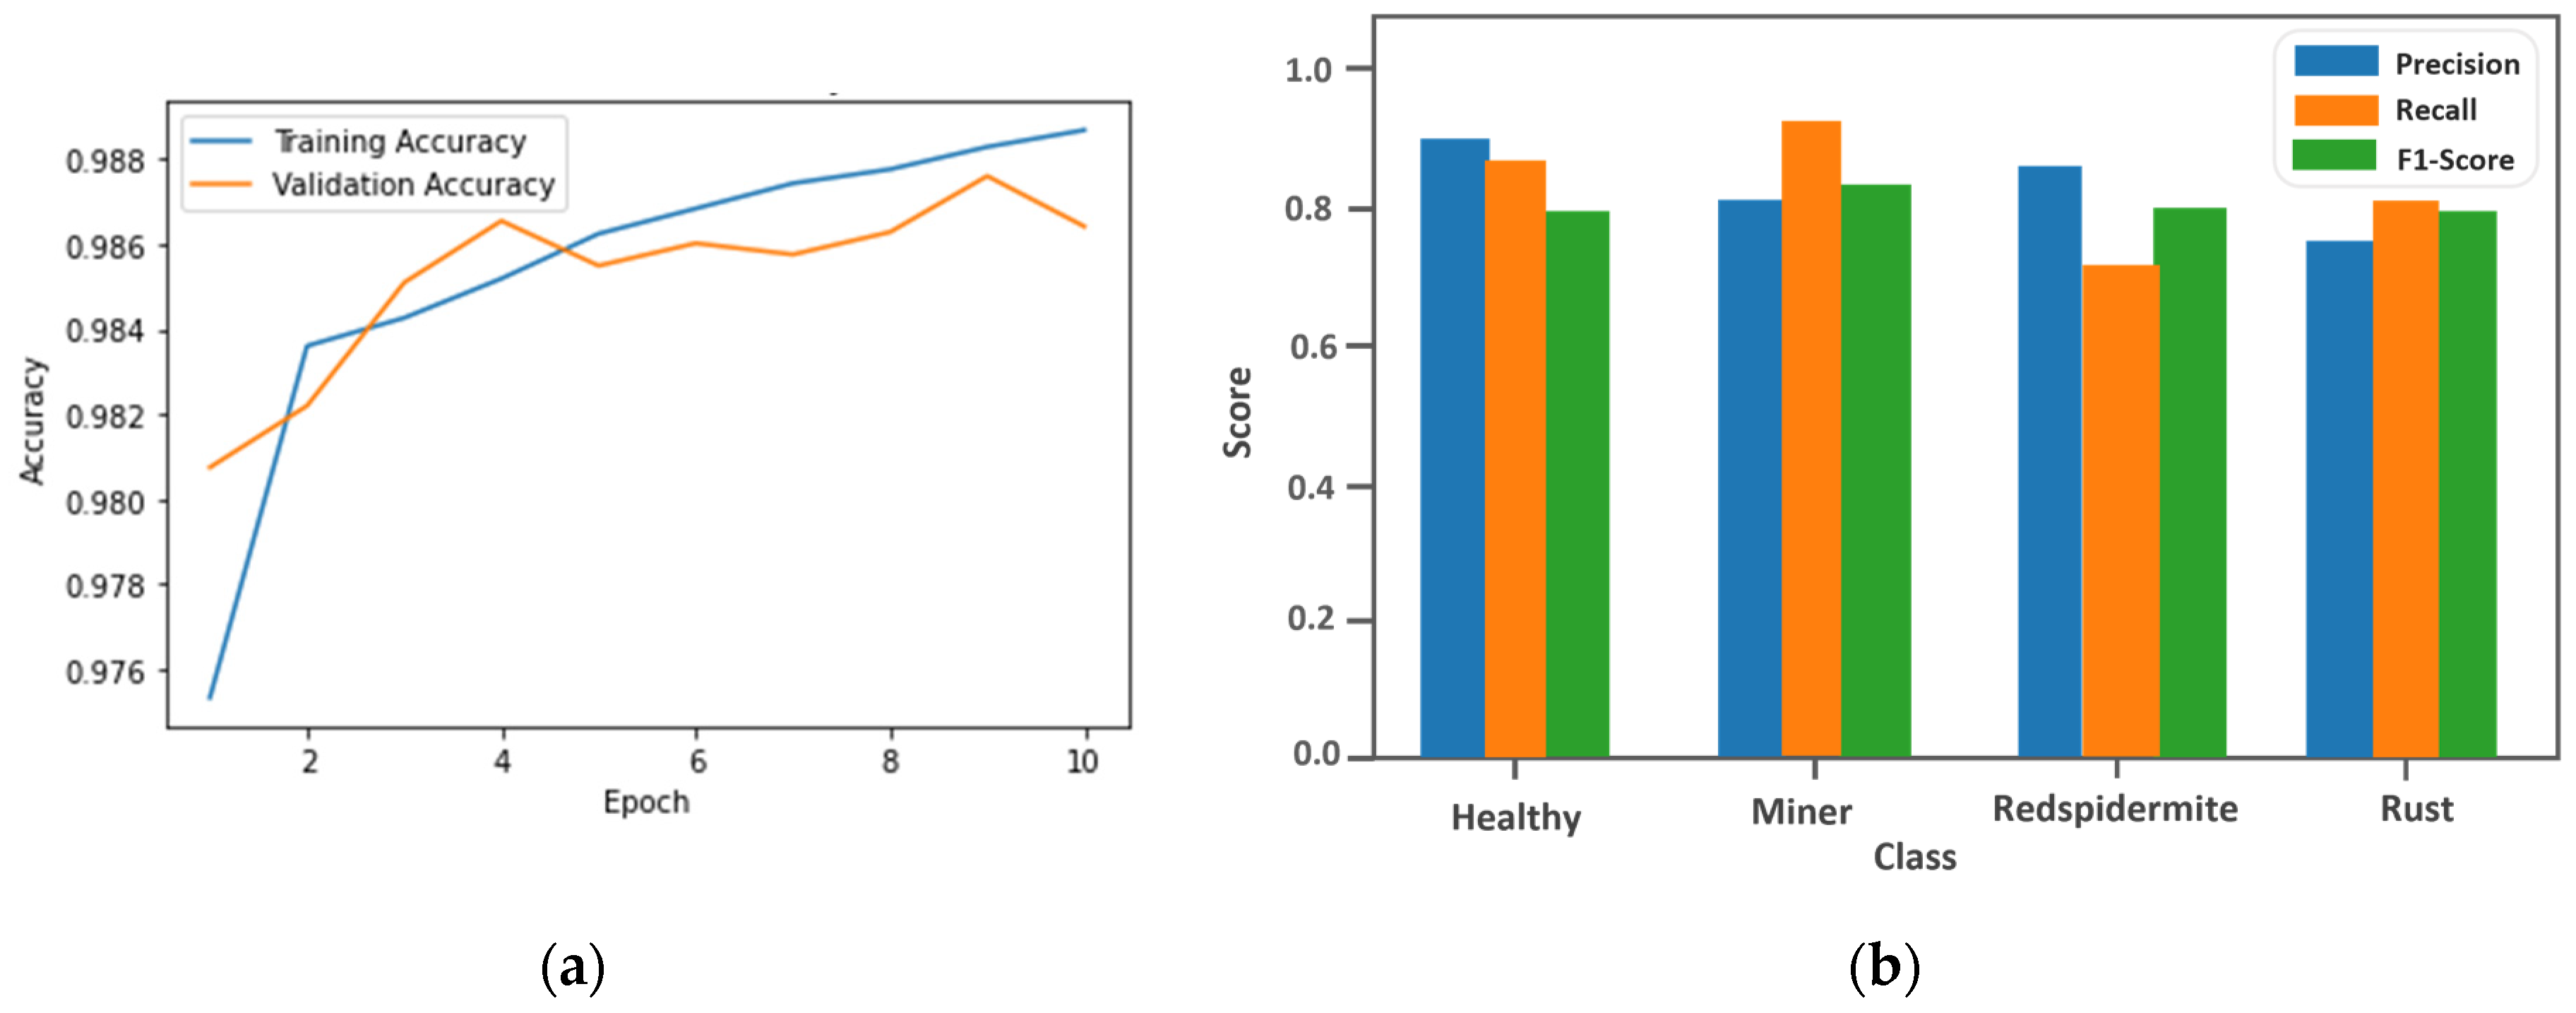
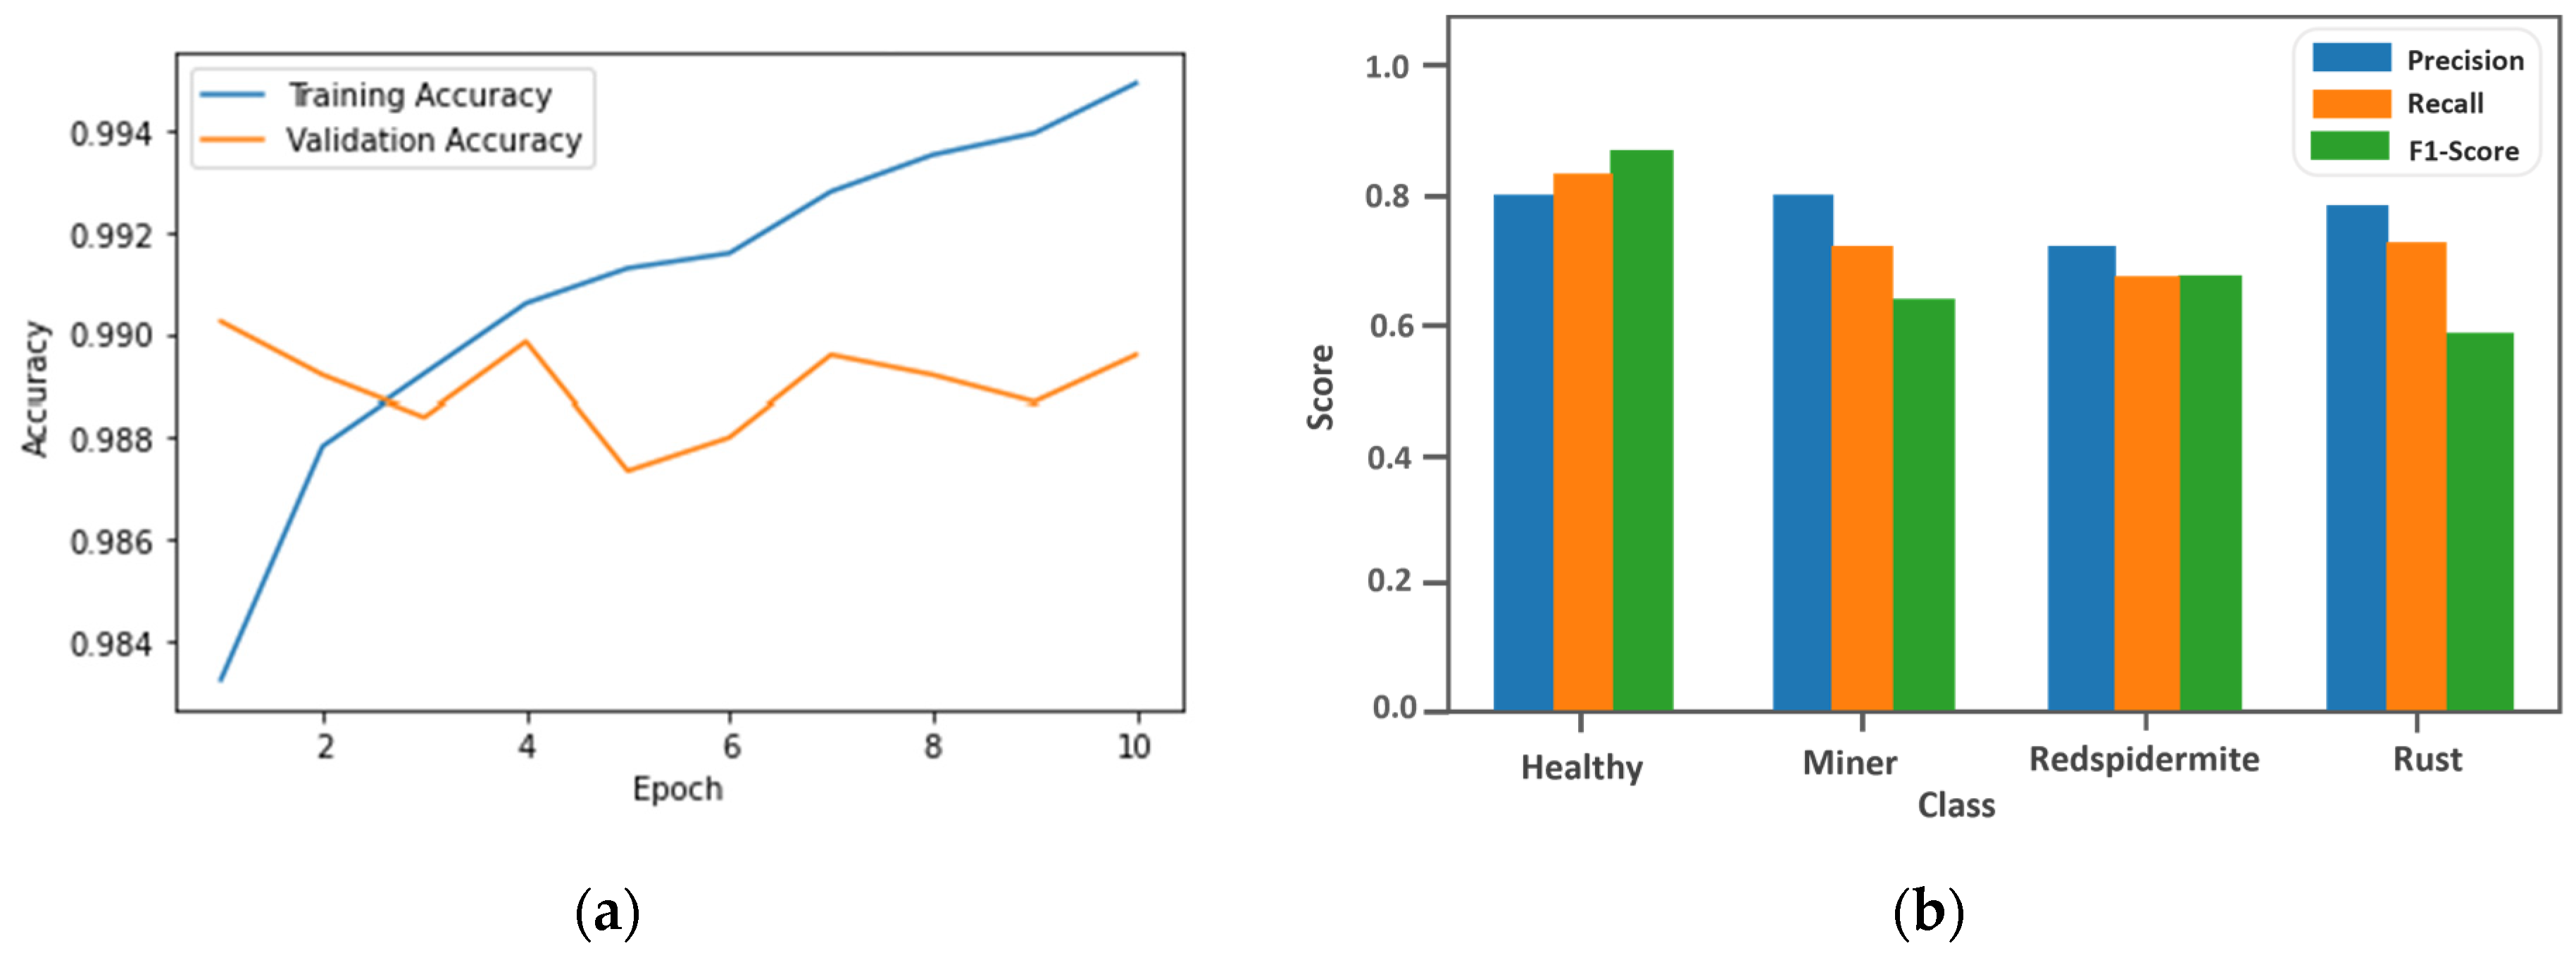
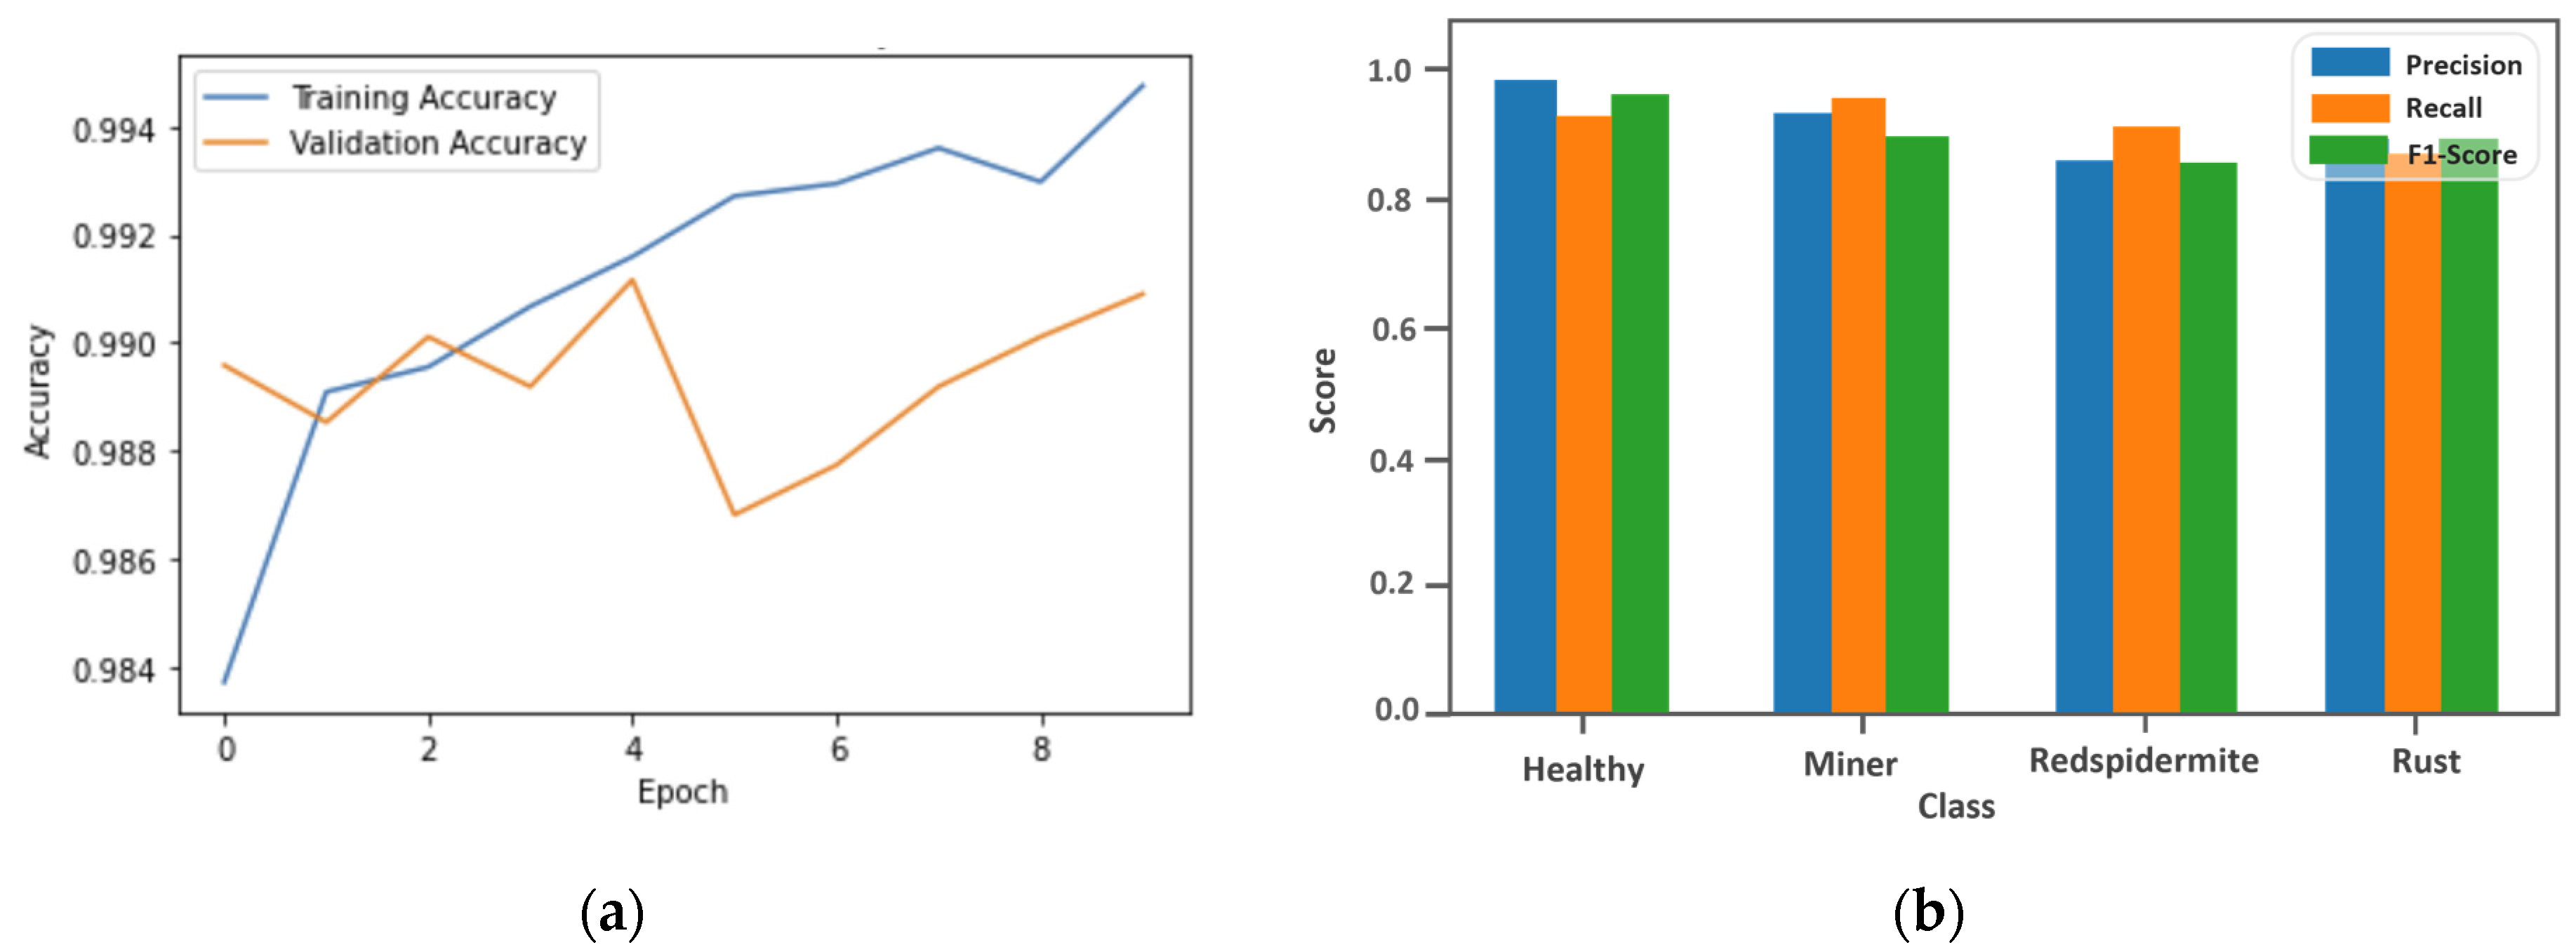
| Model Types | Training Accuracy (%) | Training Loss (%) | Validation Accuracy (%) | Validation Loss (%) |
|---|---|---|---|---|
| Inception-v3 | 99.34 | 0.0167 | 99.01 | 0.0306 |
| ResNet50 | 98.70 | 0.0565 | 97.80 | 0.0577 |
| Xception | 99.40 | 0.0140 | 98.84 | 0.0337 |
| VGG16 | 98.81 | 0.0291 | 97.53 | 0.0668 |
| DenseNet | 99.57 | 0.0135 | 99.09 | 0.0225 |
Disclaimer/Publisher’s Note: The statements, opinions and data contained in all publications are solely those of the individual author(s) and contributor(s) and not of MDPI and/or the editor(s). MDPI and/or the editor(s) disclaim responsibility for any injury to people or property resulting from any ideas, methods, instructions or products referred to in the content. |
© 2024 by the authors. Licensee MDPI, Basel, Switzerland. This article is an open access article distributed under the terms and conditions of the Creative Commons Attribution (CC BY) license (https://creativecommons.org/licenses/by/4.0/).
Share and Cite
Hitimana, E.; Kuradusenge, M.; Sinayobye, O.J.; Ufitinema, C.; Mukamugema, J.; Murangira, T.; Masabo, E.; Rwibasira, P.; Ingabire, D.A.; Niyonzima, S.; et al. Revolutionizing Coffee Farming: A Mobile App with GPS-Enabled Reporting for Rapid and Accurate On-Site Detection of Coffee Leaf Diseases Using Integrated Deep Learning. Software 2024, 3, 146-168. https://doi.org/10.3390/software3020007
Hitimana E, Kuradusenge M, Sinayobye OJ, Ufitinema C, Mukamugema J, Murangira T, Masabo E, Rwibasira P, Ingabire DA, Niyonzima S, et al. Revolutionizing Coffee Farming: A Mobile App with GPS-Enabled Reporting for Rapid and Accurate On-Site Detection of Coffee Leaf Diseases Using Integrated Deep Learning. Software. 2024; 3(2):146-168. https://doi.org/10.3390/software3020007
Chicago/Turabian StyleHitimana, Eric, Martin Kuradusenge, Omar Janvier Sinayobye, Chrysostome Ufitinema, Jane Mukamugema, Theoneste Murangira, Emmanuel Masabo, Peter Rwibasira, Diane Aimee Ingabire, Simplice Niyonzima, and et al. 2024. "Revolutionizing Coffee Farming: A Mobile App with GPS-Enabled Reporting for Rapid and Accurate On-Site Detection of Coffee Leaf Diseases Using Integrated Deep Learning" Software 3, no. 2: 146-168. https://doi.org/10.3390/software3020007
APA StyleHitimana, E., Kuradusenge, M., Sinayobye, O. J., Ufitinema, C., Mukamugema, J., Murangira, T., Masabo, E., Rwibasira, P., Ingabire, D. A., Niyonzima, S., Bajpai, G., Mvuyekure, S. M., & Ngabonziza, J. (2024). Revolutionizing Coffee Farming: A Mobile App with GPS-Enabled Reporting for Rapid and Accurate On-Site Detection of Coffee Leaf Diseases Using Integrated Deep Learning. Software, 3(2), 146-168. https://doi.org/10.3390/software3020007