Article

Sustainable Filters with Antimicrobial Action from Sugarcane Bagasse: A Novel Waste Utilization Approach

by
Rosa Hernández-López
1,
Aurelio López-Malo
1,
Ricardo Navarro-Amador
2 and
Nelly Ramírez-Corona
1,*
1
Department of Chemical, Food and Environmental Engineering, Universidad de las Américas Puebla, San Andrés Cholula 72810, PU, Mexico
2
Department of Chemical and Biological Sciences, Universidad de las Américas Puebla, San Andrés Cholula 72810, PU, Mexico
*
Author to whom correspondence should be addressed.
Waste 2024, 2(1), 122-135; https://doi.org/10.3390/waste2010007
Submission received: 24 November 2023 / Revised: 16 February 2024 / Accepted: 29 February 2024 / Published: 8 March 2024

Abstract

:
Sugarcane bagasse (SCB) is a waste product from Mexico’s sugar industry that is generally burned or discarded. It contains around 48% cellulose, representing a significant source of this component from industrial waste. Eugenol is found in clove oil; it has been used for its medicinal and antimicrobial benefits in the food and pharmaceutical industries. This study aims to develop a filtering material using sugarcane bagasse (SCB) and encapsulated eugenol as an antimicrobial agent. The study involves extracting cellulose from SCB using alkaline hydrolysis with ultrasound, followed by forming composite materials encapsulated in alginate with eugenol concentrations from 0 to 1% v/v. These materials were characterized and tested for antimicrobial efficacy. The findings indicate that the cellulose–eugenol–alginate composite displays high eugenol encapsulation efficiency and effective short-term release. In well-diffusion assays, the material showed inhibition halos up to 20.47 mm against S. aureus, suggesting its potential as an eco-friendly alternative to traditional antimicrobial agents in filter materials.

1. Introduction

Sugarcane bagasse is a fibrous residue generated during sugar extraction in sugar mills. It consists of the woody stalks, leaves, and sugarcane tops that remain after the sucrose-rich juice has been extracted [1]. In Mexico, one of the largest sugarcane producers globally, bagasse is a significant waste byproduct of the sugar industry. However, it also presents several opportunities for utilization in various sectors, contributing to waste reduction, energy production, and the development of sustainable products [2].
Sugarcane bagasse contains around 48% cellulose, generally burned or discarded in the industry. Cellulose extracted from sugar cane bagasse can serve as a component for antimicrobial composites due to its abundance, renewability, and biodegradability [3]. These composites find applications in various fields, such as food packaging, medical devices, and textiles [4].
In recent years, functionalized materials for packaging have been extensively studied, for instance, in nanofibers based on chitosan, carboxyl methylcellulose, or starch for preserving meat, seeds, and fresh fruits [3,5,6]. In the food industry, nanocellulose (NC) has been widely explored as an alternative polymer in membranes and filters, especially in clarifying beverages and treating wastewater and human consumption [7].
In an era marked by increasing concerns about antimicrobial resistance, there is a growing need to broaden the range of safe antimicrobials for use in the food industry. This has led to an exploration of essential oils (EOs) as potential candidates for functional materials to extend the shelf life of food products by preventing the growth of pathogens and microorganisms. For instance, Sayed et al. [8] developed an active biofilm made of polyvinyl alcohol (PVA), cross-linked with alkaline cellulose, with different weight ratios of essential clove oil (0.17, 0.33, or 0.67% v/v), demonstrated antimicrobial efficacy against various pathogens, suggesting these biofilms are well-suited for packaging applications. Cinnamon essential oil, as used by Paris et al. [9] to assess the encapsulation efficiency at a 5% v/v concentration in sodium alginate beads and analyze its controlled release in the vapor phase, showed enhanced antifungal activity against pathogens such as Botrytis cinerea, Penicillium expansum, Alternaria alternata, and Colletotrichum gloeosporioides.
Consequently, recent studies have tested the antimicrobial properties of these oils both in vitro and in food [10]. Staphylococcus aureus (S. aureus) is a bacterium that can cause several infections in humans, and its presence in beverages can lead to health concerns. While S. aureus is not typically associated with high-pH beverages, its presence might occur due to improper handling, storage, or preparation practices. Even in more acidic conditions S. aureus can survive to some extent; thus, the acidic nature of a beverage may affect its growth and survival, but it does not completely eliminate the possibility of its presence.
Therefore, in recent years, there has been an increasing interest in studying the use of functionalized materials for liquid food processing to reduce the number of microorganisms present. For instance, some authors have used silica-based filters with carvacrol, eugenol, thymol, or vanillin for the filtration of waterborne microorganisms from water [11], varying the silica microparticles size and filtration layer thickness, achieving 3 to 5 log reduction values for different microorganisms. Dikic et al. developed composites using natural zeolite, thymol, and carvacrol through supercritical solvent impregnation; the materials showed antibacterial activity against E. coli and S. aureus in spring water and lake water [12]. Peña Gomez et al. proposed silica microparticle-based filtering materials, functionalized with essential oil components (eugenol and vanillin with a final concentration of 35.8 or 114.9 mg/g SiO2), as an alternative preservation approach for apple juice. The study confirms the effective immobilization of antimicrobial compounds on the particle surface, showcasing the filtration system’s ability to reduce Escherichia coli by at least 5-log in apple juice [13].
This study aims to develop functionalized filters of cellulose obtained from sugarcane bagasse, looking for innovative ways to reuse this waste material. Cellulose and a composite of cellulose with polyvinyl alcohol (PVA) were utilized as a support for filters that were functionalized with eugenol. These filters were evaluated by examining their physical properties, chemical composition, and antimicrobial efficacy against S. aureus.

2. Materials and Methods

2.1. Materials

Sugarcane bagasse (SCB) was obtained from the Atencingo Sugarcane Industry in the Izúcar de Matamoros region, Puebla, Mexico (18°30′48″ N, 98°36′20″ O). Ethanol (99.5%), hydrogen peroxide (6%), sodium hydroxide, sulfuric acid, and eugenol (CAS 97-53-0) were obtained from Sigma-Aldrich Co. (St. Louis, MO, USA). Alkaline hydrogen peroxide (PHA) solution was prepared by adding 1 N NaOH in 3% H2O2 solution until reaching a pH of 11.5.

2.2. Sugarcane Bagasse Preparation

The sugarcane bagasse was washed with hot water (70–80 °C) and dried in an oven at 60 °C for 24 h (Food Dehydrator Excalibur, USA), cut into pieces of approximately 2 cm × 2 cm, and pulverized in a mill cutter (GX4100) or 900 W Nutribullet blender (Nutribullet, Los Ángeles, CA, USA); the powder was sieved through mesh plates (30, 45, 60, 70, and 80) and the diameter dispersion was determined. The grilling appliance was selected according to the most suitable diameter for the extraction. The powders were stored in a desiccator at room temperature until further use [2].

2.3. Cellulose Extraction

Hydrolysis was performed with an alkaline hydrogen peroxide (PHA) solution according to the method reported by Sahani et al. [1] to remove hemicellulose and the lignin present in the sugarcane bagasse powder. The pulverized dry powder was continuously stirred in a PHA solution using a magnetic stirrer at 150 rpm at 40 °C for 4 h, periodically maintaining the pH of the solution at 11.5. Then, 300 g of the mixture was neutralized with 3 L of NaOH at a 2 N concentration for 3 h. The insoluble residue was vacuum-filtered and subsequently washed with 80 °C water three times to remove all soluble materials. The remaining cellulose pulp residue (AHP-hydrolyzed cellulose) was dried in the oven at 110 °C for 15 min and then cooled and weighed to function as the support material [1,14].

2.4. Beads Preparation

The following methodology was performed to obtain beads or pellets containing eugenol (E1) as control (1% v/v) and the composite containing cellulose and eugenol (C0, C1, C2 or C3) with different eugenol concentrations (0, 1, 0.5, or 0.1% v/v, respectively).
The concentrations of eugenol were chosen within ranges that exhibited the most effective antimicrobial responses in the studies [8,13]. The highest eugenol concentration was also tested with no cellulose in the composite formulation to verify the effect of the addition of cellulose to the antimicrobial properties of eugenol beads (E1) [9].
A suspension of 0.5% (w/v) AHP-hydrolyzed cellulose in 1% H2O2 was prepared; it was ultrasonically irradiated for 1 h with a low-frequency (20 kHz) ultrasound processor (CP 505, Cole-Parmer, Vernon Hills, IL, USA) with a 13 mm diameter probe, using an output power of 750 W, and an amplitude of 70% with an intermittent cycle: 15 s on–5 s off [1,15].
The composite emulsion was prepared by mixing 60 mL of distilled water or cellulose suspension with 0.9 g of alginate. The mixture was constantly stirred for 20 min at 50 °C. Subsequently, 2 g of PVA, eugenol (0.1, 0.5 or 1% v/v), and 120 μL of tween 80 as emulsifier were incorporated and stirred at 280 g (Ultraturrax, Janke & Kunkel, Staufen, Germany) for 4 min [4,16]. This eugenol in cellulose–water emulsion is used in the well-diffusion assay in Section 2.7.
Approximately 3 g of the emulsion was loaded into a 10 mL syringe. The syringe was adapted to a piston pump (110, Cole-Parmer), and the emulsion was pumped into a 30 mL calcium chloride solution (1 M) at a 0.3 mL/min flow rate. The dropping height was 19.5 cm; after 30 min of curation, the formed beads were recovered, rinsed with distilled water, and softly dried with a paper tissue. Sodium alginate and calcium chloride concentrations were chosen based on the work described by Paris et al. [9].

2.5. Bead Characterization

2.5.1. Size and Sphericity

The average diameter (D) and sphericity factor (SF) of the beads were determined using a micrometer (MDC SB, Mitutoyo Corporation, Kanagawa, Japan) and Equations (1) and (2), respectively [17].
D = d m a x + d m i n 2
S F = d m a x d m i n d m a x + d m i n
where dmax is the maximum diameter of a bead and dmin is the minimum diameter. The experiments were repeated two times using 15 beads for each test.

2.5.2. Water Activity and Moisture Content

The beads’ water activity (aw) was assessed by employing a dew point hygrometer (AQUA LAB, 4 TE V, Decagon Devices, Inc., Pullman, WA, USA), utilizing approximately 1 g of beads. Moisture content (MC) analysis was conducted according to the AOAC 926.08 method, employing an oven at 70 °C and 0.5 g of beads. These experiments were conducted in duplicate [9].

2.5.3. FTIR Spectroscopy

Analysis of obtained cellulose, PVA, eugenol, and the bead C1 (with cellulose and 1% eugenol) was performed using an FTIR (Fourier-transform infrared spectroscopy) spectrometer, equipped with an Attenuated Total Reflectance (ATR) FTIR diamond fixture (Cary 630, Agilent Technologies, Santa Clara, CA, USA). The spectra were obtained at room temperature with a resolution of 4 cm−1 and in the range of 4000–650 cm−1, 16 scans per sample were conducted [18].

2.5.4. Encapsulation Efficiency

The concentration of eugenol encapsulated within the alginate beads was determined by dissolving 0.1 g of the beads in a 20 g phosphate buffer saline solution (pH 7.4). After 24 h, the beads had fully dissolved, and the resulting suspension was vigorously stirred until it became homogenous. Following that, the supernatant was subjected to filtration through a 0.45 μm filter, and the concentration of eugenol was quantified using UV-spectrophotometry (UV-1900i, Shimadzu Cooperation Ltd., Tokyo, Japan) at a wavelength of 282 nm (λmax). Encapsulation efficiency (EE%) was determined using Equation (3). EE% is the total amount of eugenol retrieved from the encapsulation process to the initial quantity introduced into the emulsion [19].
E E % = T o t a l   w e i g t h   o f   l o a d e d   e u g e n o l   o i l I n i t i a l   w e i g t h   o f   e u g e n o l   o i l × 100

2.5.5. Release Studies

The release pattern of composite beads was explored using a shaking incubator (Hanshin Scientific Co., Ltd., Seoul, Republic of Korea). The beads (100 mg) were transferred in 100 mL of deionized water; 10 mL of aliquot solution was withdrawn at different time intervals; and then an equal volume of water was added to maintain a constant volume. The concentration of eugenol was analyzed by UV spectroscopy (UV-1900i, Shimadzu Cooperation Ltd., Tokyo, Japan) at a λmax of 282 nm [20].

2.6. Antimicrobial Activity

2.6.1. Well-Diffusion Assay

The beads’ antibacterial activity was evaluated with a well-diffusion inhibition zone test. Staphylococcus aureus (S. aureus ATCC 29213) was obtained from the Food Microbiology Laboratory of the Universidad de las Americas Puebla (Puebla, Mexico) and used as the test’s model bacteria. A colony of S. aureus was transferred to a test tube with 10 mL of Tryptic Soy Broth (TSB) and incubated at 37 °C for 24 h, to prepare the inoculum. Starting from the previous inoculum, decimal dilutions were performed in sterile nutrient broth. After 24 h at 37 °C, the standard count was conducted on each dilution using nutrient agar, and the results were reported in terms of log10 CFU/mL. Nutrient broth with a microorganism density of 104 CFU/mL was used for subsequent tests. For the first analysis, 100 μL of bacterial suspension of S. aureus and an equal amount of the beads forming solution with different eugenol concentrations (from Section 2.4: C0, E1 (1%), C1 (1%), C2 (0.5%) or C3 (0.1%)) were evenly spread on nutrient agar plates, incubated at 37 °C for 24 h to visualize the direct inhibition of S. aureus. For the well-diffusion assay, inoculated (100 μL) agar plates were punched to form 9 mm diameter holes in 5 positions, and each hole was filled with the beads forming solutions C0, E1, C1, C2, or C3. The Petri dishes were sealed and placed in an incubator at 37 °C for 24 h. The difference in antibacterial performance was evaluated by measuring the diameter of the inhibition zone with a micrometer (model MDC SB, Mitutoyo Corporation, Kanagawa, Japan). All assays were performed in triplicate [21].

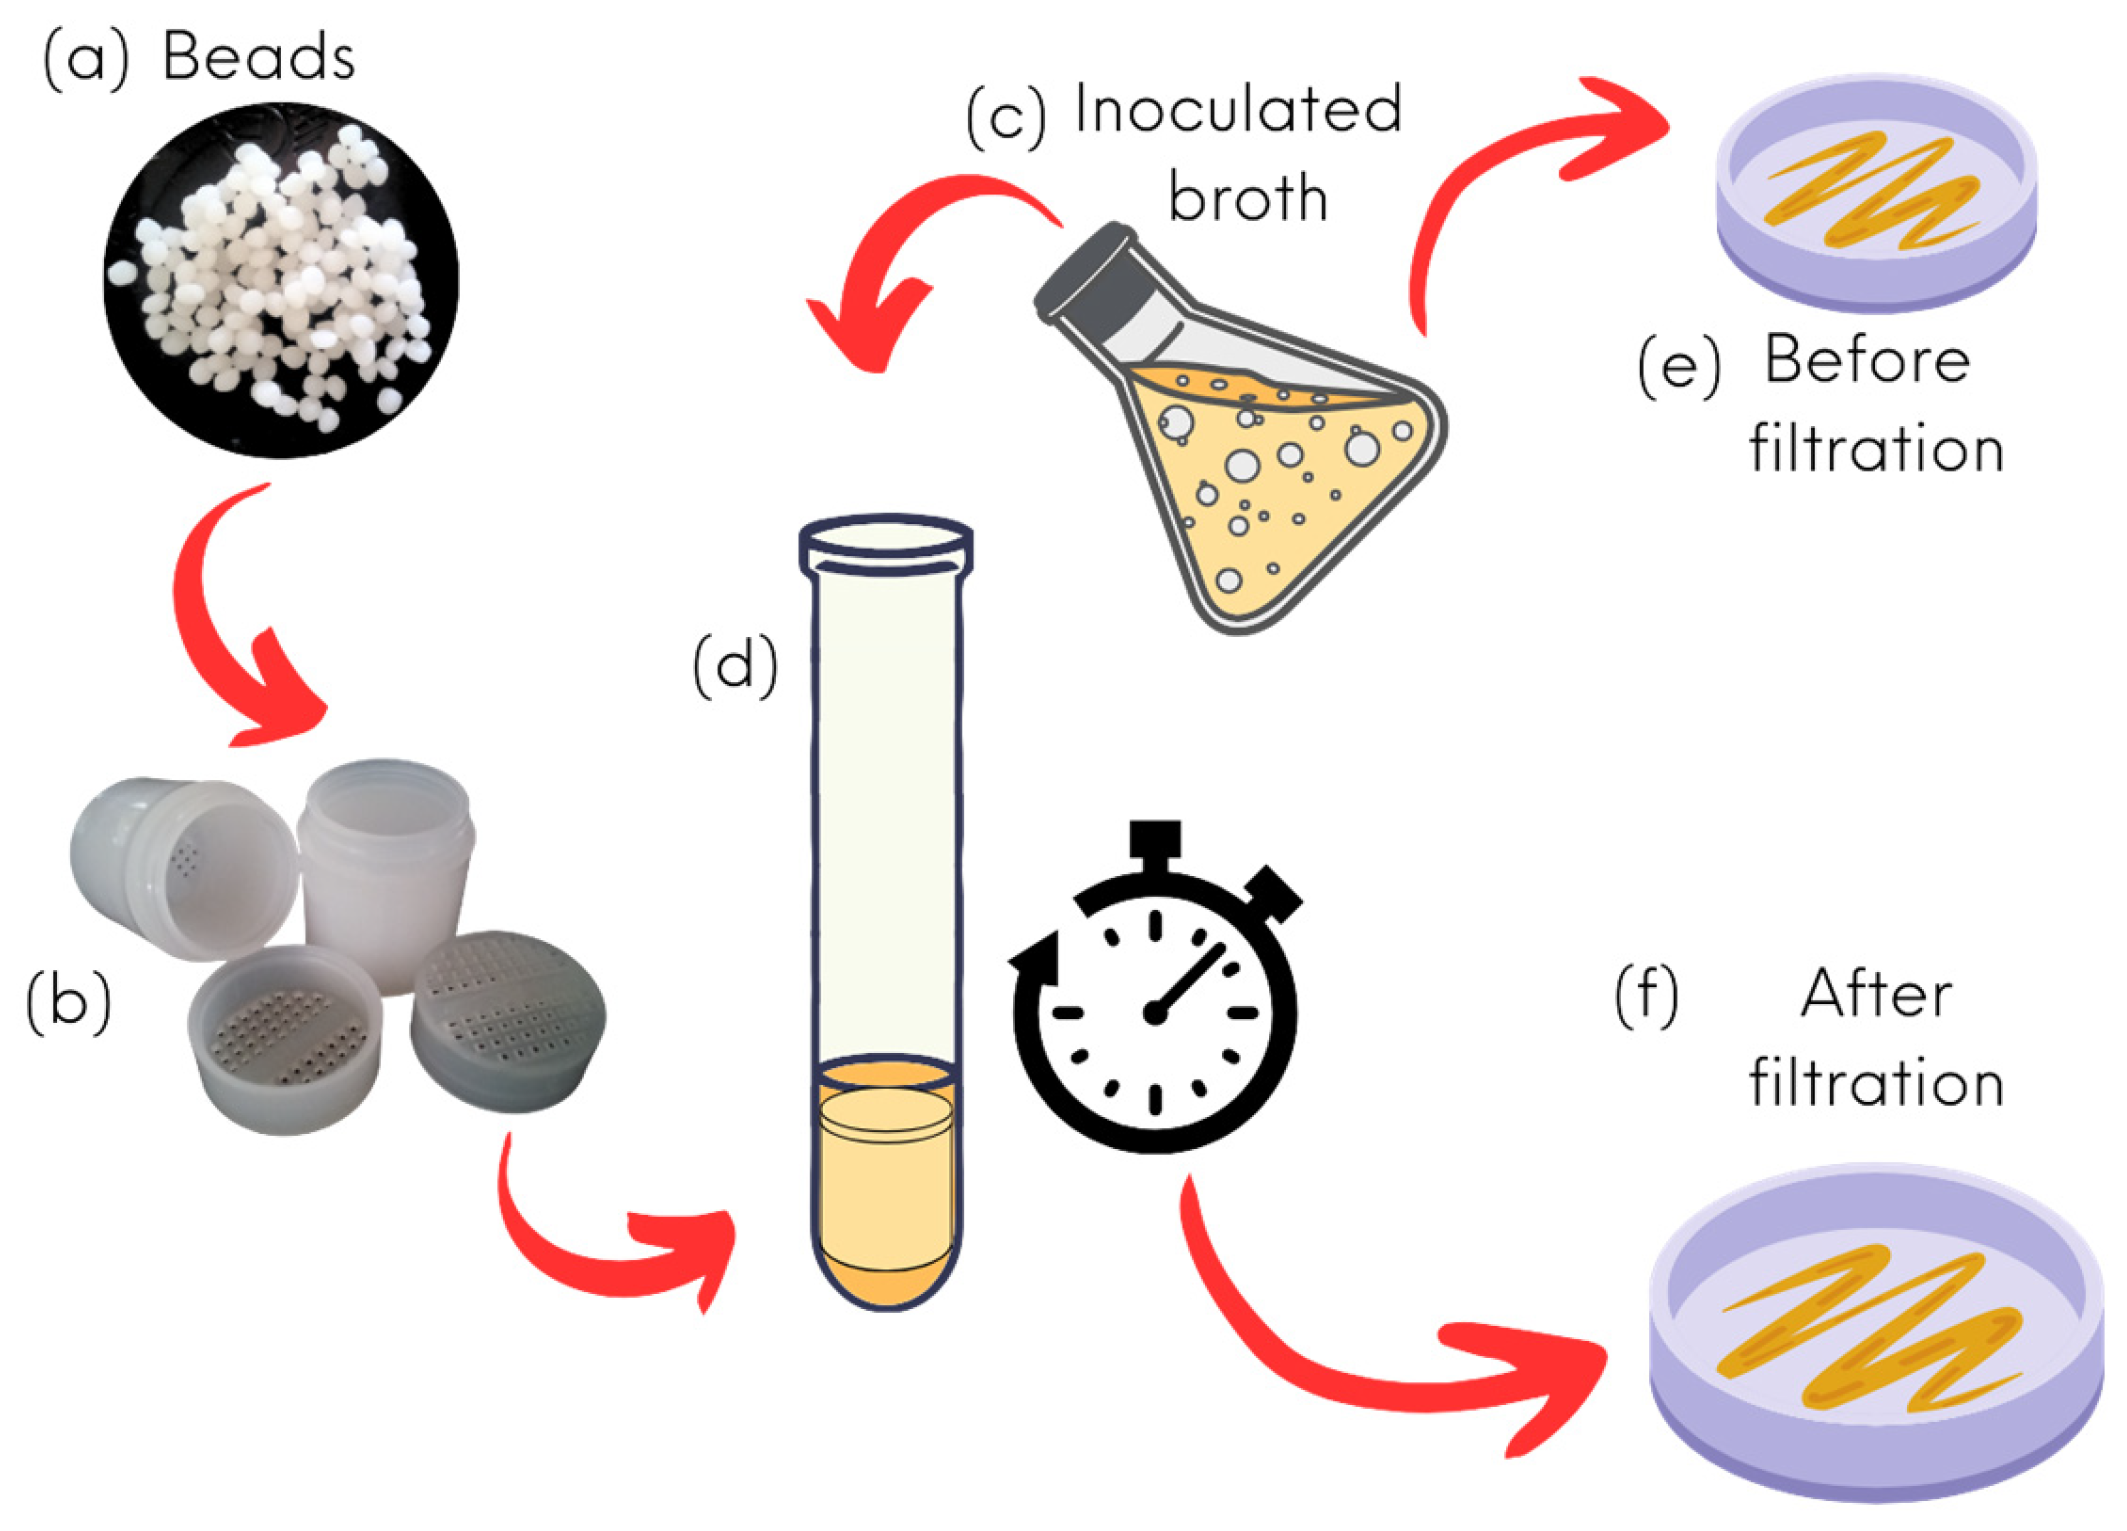
2.6.2. Dilution Assay (In Bead Column) Analysis

To prepare the inoculum, an S. aureus colony was transferred to a test tube with 10 mL of Tryptic Soy Broth (TSB) and incubated at 37 °C for 24 h. The inoculum was centrifuged at 4000 rpm for 10 min, and the precipitated cells were resuspended in 1 L of nutritive soy broth and diluted to obtain a microbial density of 104 CFU/mL [9]. The antimicrobial analysis was evaluated for beads with different eugenol concentrations: C0, E1 (1%), C1 (1%), C2 (0.5%), or C3 (0.1%).
As shown in Figure 1, 0.5 g of beads (a) was placed into a plastic container (b), a column was packed with the container as filtering material (d), and 5 mL of inoculated broth was added to the column (c). It was kept for 1, 2, or 3 h at 37 °C; once the defined time was reached, the bead’s packed column was removed from the liquid. A standard plate count on nutrient agar was performed from the broth before (e) and after (f) being in contact with the beads. After plating and incubating the collected samples in Plate Count Agar (37 °C, 24 h), the count values were logarithmically transformed and expressed as log10 CFU/mL [22]. The analyses were performed in duplicate.

2.7. Statistical Analysis

The results were presented as mean values and standard deviation. The one-way ANOVA and Tukey’s mean comparison test with a 95% confidence level were performed by Minitab 19 software (Minitab Inc., State College, PA, USA).

3. Results and Discussion

3.1. Sugarcane Bagasse (SCB) Pretreatment

In this step, two grilling appliances were used. Figure 2 shows the dispersion and the particle size of the grounded sugarcane bagasse (SCB) obtained by these two grilling devices. It was found that the average diameter of the particles was 250 μm when using GX4100 (mesh 60) and 354 μm obtained with Nutribullet blender (mesh 45). The particle size used for further treatments corresponded to 250 μm, which is the size suggested by [1], followed by ultrasonication for the fabrication of high-strength films from SCB.

3.2. Cellulose Extraction

The first step of the extraction involved alkaline hydrogen peroxide (AHP) hydrolysis, which changed brown sugarcane bagasse into the cellulose-rich creamy white pulp. Under alkaline conditions, the intermolecular ester bond between lignin and carbohydrate is broken [1]. The highly reactive −OH radicals formed during the degradation of H2O2 react rapidly with lignin into low-molecular-weight water-soluble oxidation products responsible for lignin dissolution. The second step involves the ultrasonication of cellulose. The cellulose extraction yield from sugar cane bagasse was 46.7 ± 0.4%, comparable to the 45.9% reported by Sun et al. [2] or the 47.6% of cellulose by Alizadeh et al. [23] for sugarcane.

3.3. Structural Characterization of Beads

3.3.1. Bead Characterization

Beads with an average diameter between 2.18 ± 0.29 mm and 2.66 ± 0.43 mm were obtained, as shown in Table 1. Since the sphericity (SF calculated with Equation (2)) of the beads approached zero, they were considered spherical beads [17]. The obtained alginate/palm oil beads by Sihite et al. [4] had diameters of 2 mm, and beads with an SF below 0.05 were considered spherical. The sphericity impacts the beads’ water sorption properties, eugenol diffusion behavior, and consumers’ acceptability [24]. Furthermore, the more spherical a bead is, the smaller its fracture risk [9].
The water activity changes between the samples with no specific behavior. As shown in Table 1, all samples are significantly different (p < 0.05) in terms of this characteristic. These values are higher than the water activity of alginate beads reported by Paris et al. [9] (0.966). This might be due to the lower eugenol concentrations reached in this study. On the other hand, we observed that the beads with lower eugenol concentration have significantly different moisture content (MC) from those with 1% v/v eugenol concentration, either with cellulose or without it. In the study described by [9], the concentration of cinnamon essential oil in the beads was 5%. Following a similar trend, the moisture content of the beads decreased to 84.32%; this might be related to the initial ratio of water–oil in the forming solution. The moisture content is an important parameter as it can affect the stability and shelf life of the beads, especially when they are intended for storage or use in various applications. High moisture content can lead to issues like microbial growth, degradation of the essential oil, and changes in the physical properties of the beads [25].

3.3.2. Encapsulation Efficiency

The encapsulation efficiency (EE) of eugenol in the alginate beads is presented in Table 2, finding EE ranging from 70.01 to 93.29%, assessed through UV-vis spectrophotometry. The C1 beads exhibited the highest EE; this measurement involved determining the final eugenol concentration in the liquid once the beads were completely dissolved. Considering the volatile nature of eugenol, the encapsulation process can benefit by protecting the bioactive compounds and facilitating a target delivery [26,27]. As we will discuss in further sections, the encapsulation efficiency influences the release kinetics and, consequently, the effectiveness of the antimicrobial filter.
Encapsulation efficiency is crucial in using alginate beads as carriers for various substances, particularly in the pharmaceutical and food industries. Alginate, a natural polysaccharide derived from brown seaweed, has unique gel-forming properties that make it suitable for encapsulation applications. The encapsulation efficiency measures how effectively the desired substance is retained within the alginate beads during encapsulation [28].
The encapsulation efficiency can vary depending on the encapsulation method, such as ionotropic gelation, emulsion, or coacervation, which can impact the release profile. Different methods may result in varying degrees of encapsulation and release rates. The properties of the encapsulating polymer, in this case, alginate, influence the release profile. Factors like polymer concentration and cross-linking density can affect the permeability of the matrix and, consequently, the release rate. The chemical composition of the compound or essential oil, including its volatility, solubility, and molecular weight, plays a significant role. More volatile components may exhibit faster release, while less soluble components may be released slower. Matrix porosity and size of beads: The size and porosity of the encapsulation matrix (alginate beads) influence the diffusion of essential oils. Smaller beads and higher porosity may result in faster release [26,29].
Researchers often study the release profile through techniques such as in vitro dissolution testing, where the encapsulated material is exposed to specific conditions, and the release is monitored over time.

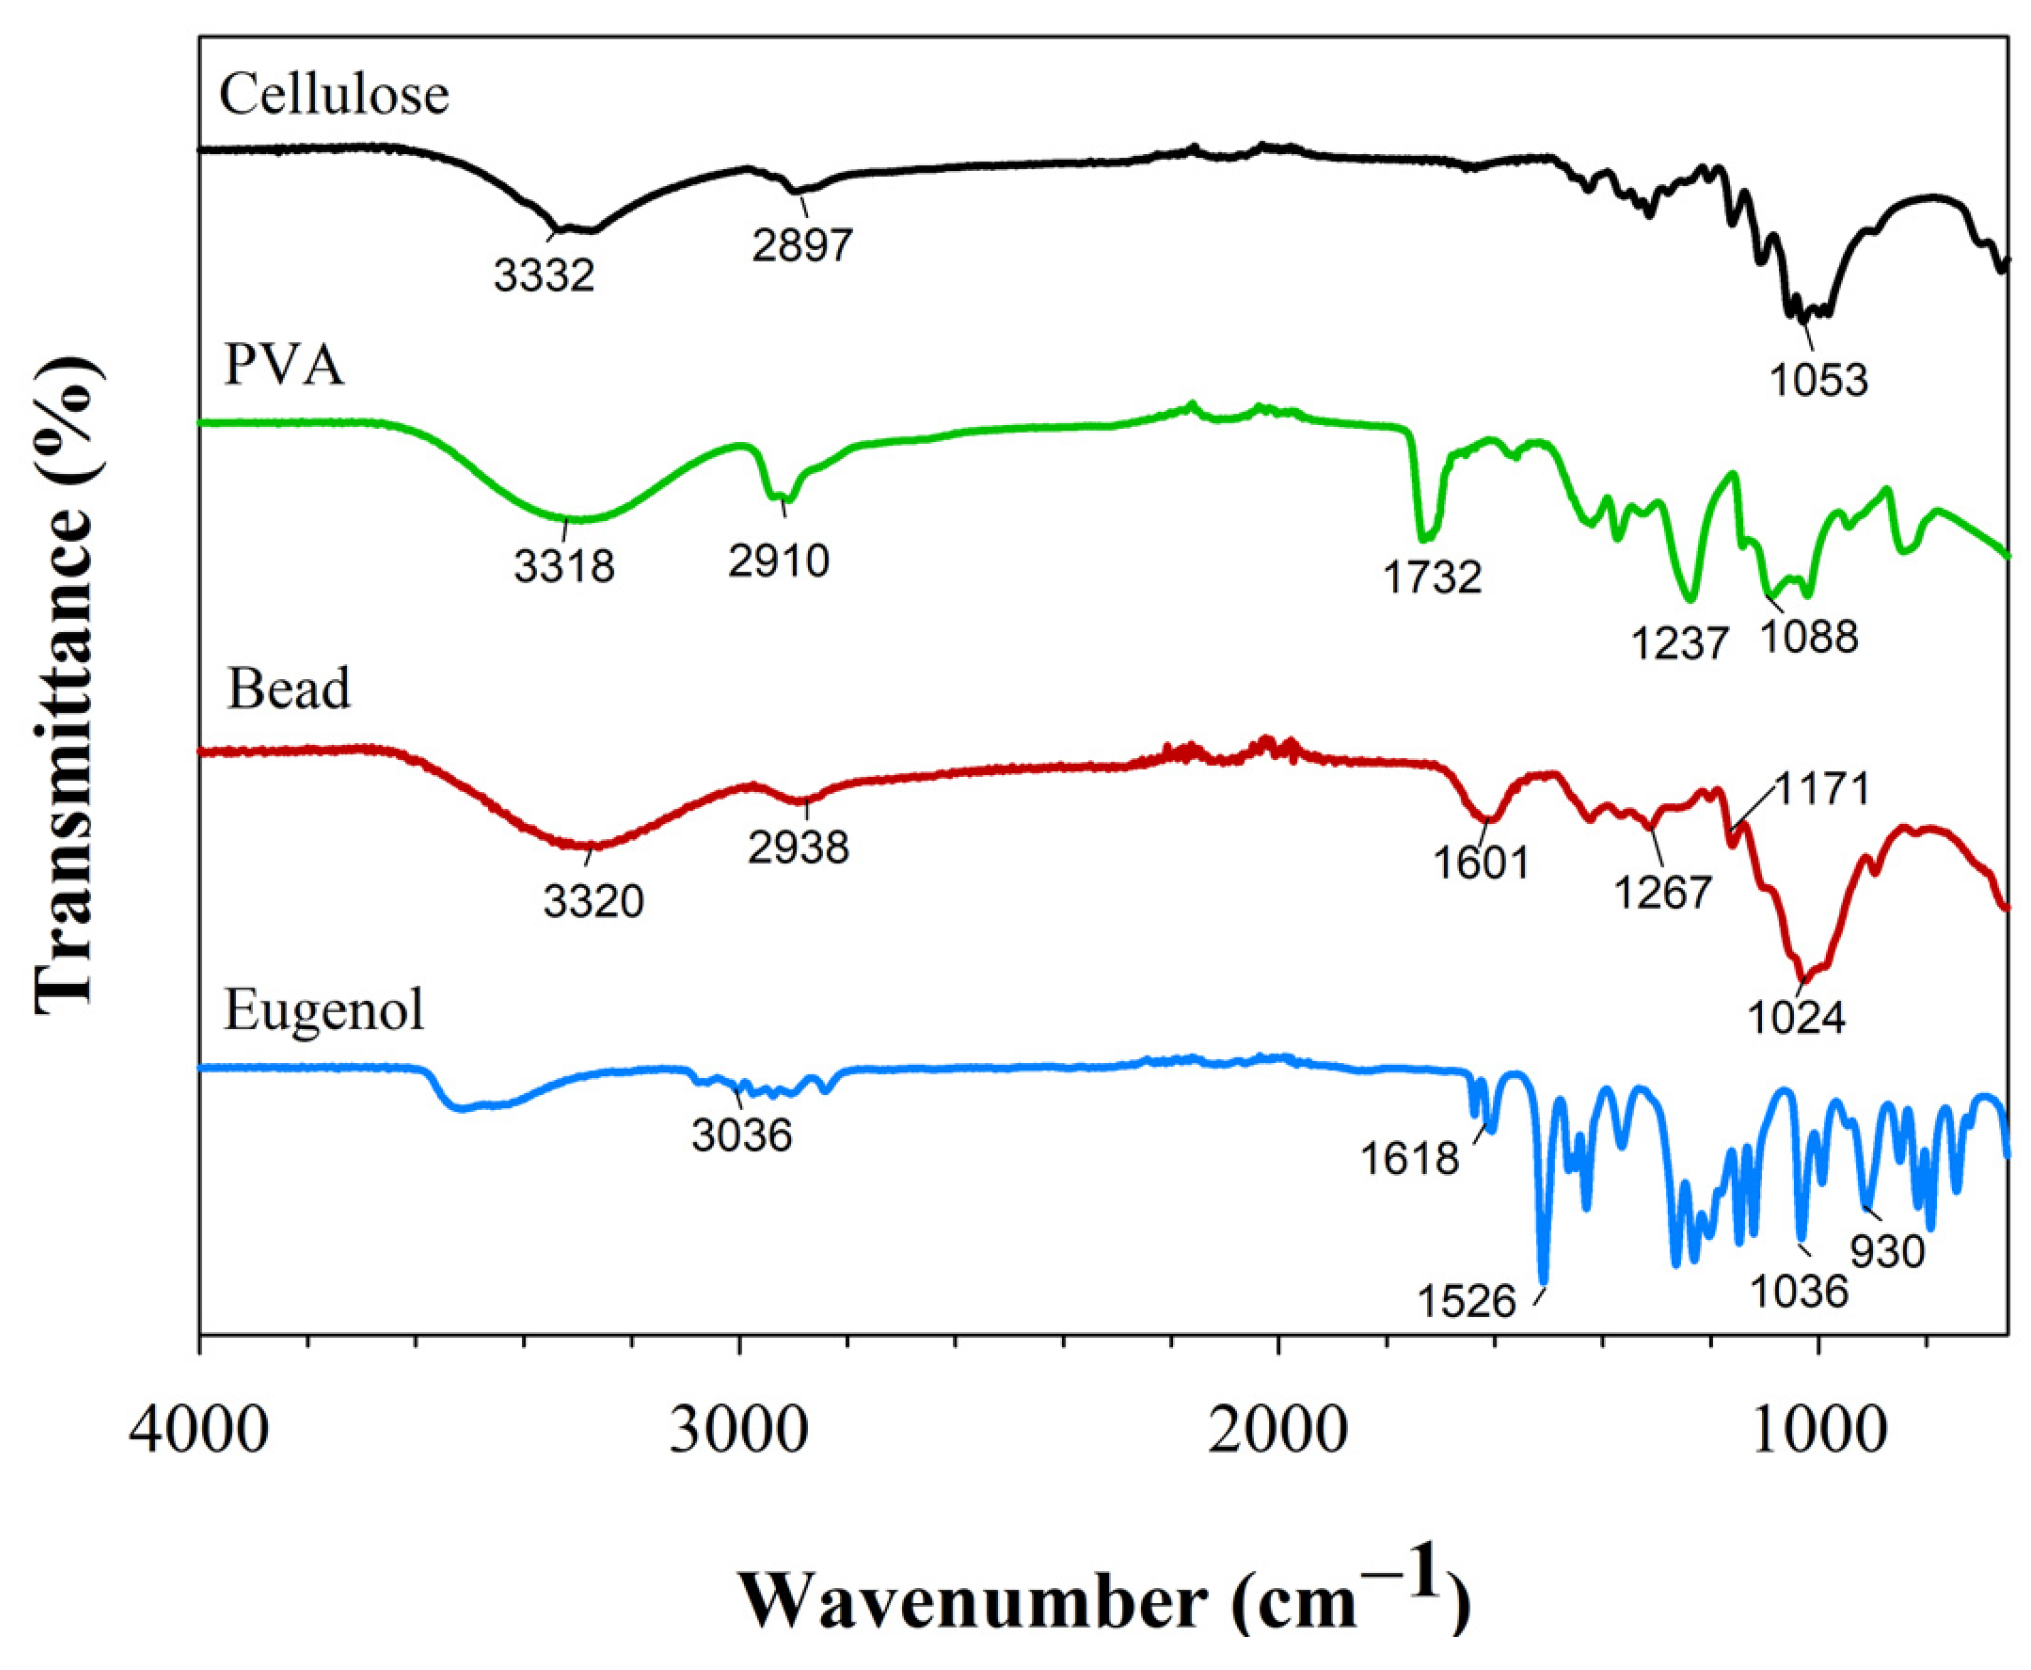
3.3.3. FTIR Spectroscopy

Figure 3 shows FTIR spectra of cellulose, polyvinyl alcohol (PVA), pure eugenol, and C1, which represent the bead containing all three compounds (cellulose, PVA, and 1% eugenol). In the cellulose spectrum, peaks at 1050 cm−1 correspond to the stretching vibration of -C-O- bonds, the peak in the region of 2900 cm−1 represents the stretching vibrations of C-H bonds in the cellulose molecule, and the broad peak around 3300 cm−1 is attributed to the stretching vibration of hydroxyl groups [2].
The PVA spectrum shares peaks in the region of 1050, 2900, and 3300 cm−1 with cellulose, corresponding to C-O in alcohol groups, C-H in the polymer chain, and O-H stretching of the hydroxyl groups, respectively. The peaks at 1250 cm−1 are attributed to the stretching vibrations of carbon–carbon bonds in the polymer backbone, while the peaks around 1725 cm−1 are attributable to the stretching vibrations of carbonyl groups (C=O) present in the acetate side groups of PVA.
In the FTIR spectrum of eugenol, characteristic peaks appear between 3000 and 2800 cm−1 related to the stretching vibrations of C-H bonds. Peaks in the region around 1600 and 1500 cm−1 are indicative of the C=C double bond present in the aromatic ring of eugenol. Additionally, the bending of C=CH2 is observed between 1000 and 900 cm−1 [30].
When comparing the spectrum of C1 beads copolymer with that of pure components, it is evident that the addition of peaks around 1050, 1250, and between 1055 and 1600 cm−1, as well as the peaks between 2800 and 3000 and at 3300 cm−1 are hidden by the O-H bonds from water in the region between 3200 and 3600 cm−1.

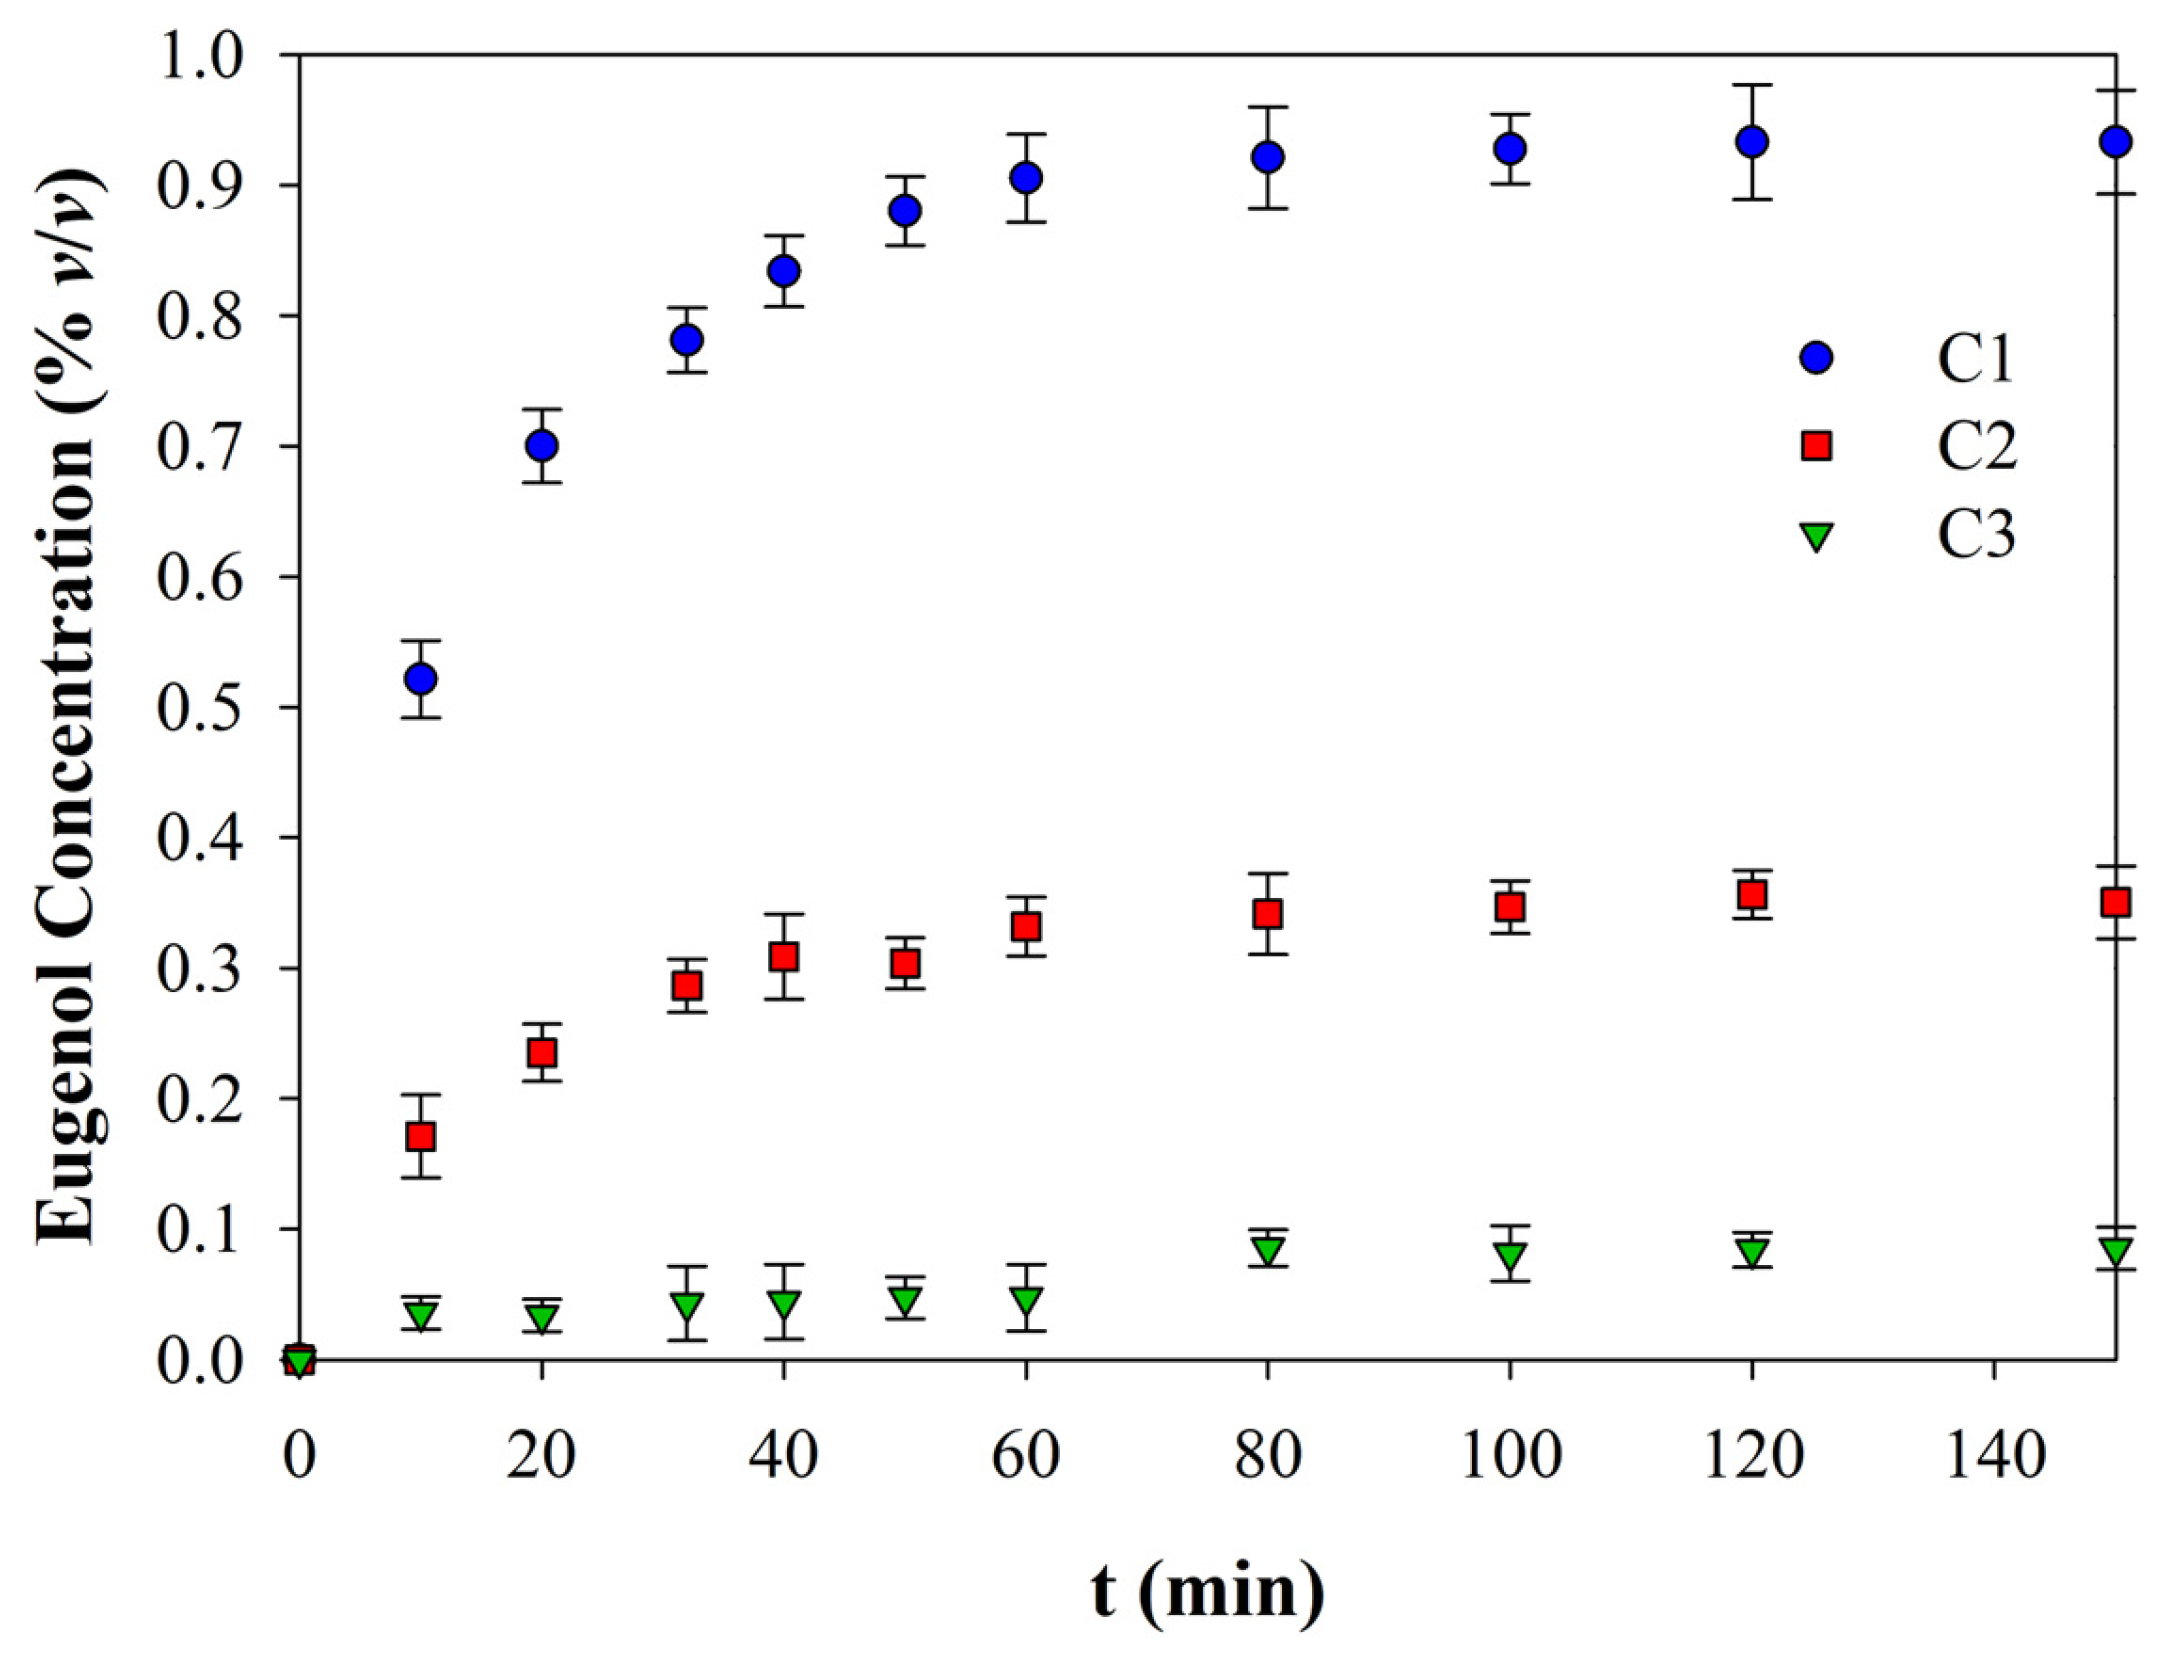
3.4. Eugenol Release

The release of eugenol is an important consideration, especially in applications where controlled release of the active compounds is desired. The release profile refers to how the encapsulated material is released over time under specific conditions [31]. Figure 4 presents the total release profile of eugenol from encapsulation systems alginate beads, considering the initial concentrations C1, C2, or C3 (1, 0.5, or 0.1% v/v of eugenol in the pellets forming solutions, respectively).
The release curves exhibit an initial burst release of eugenol within the first 20 min, without an initial lag phase at the beginning of the release. After the burst release, the release rate stabilized into a sustained phase characterized by a more gradual and controlled release of the encapsulated substance over an extended period. The slope of this phase on the release curve is lower than that of the burst release phase. Eventually, the release curve reaches a plateau, indicating that a maximum release level has been achieved and further release is minimal. This stage was reached about 20 min after the release process started. This could be due to factors such as the depletion of the encapsulated substance within the matrix or the establishment of equilibrium between the encapsulated material and the surrounding environment [32].
The release profile of eugenol from the composite beads is related to the encapsulation efficiency (EE). We observed that C1 exhibited the highest EE at 93.29% and released almost all eugenol after 80 min. In contrast, C2, with an initial eugenol concentration of 0.5%, had an EE of 70.01% and released approximately this amount of eugenol after 150 min.
The kinetics of oil release from encapsulation systems, such as alginate beads or microspheres, involves studying the rate and mechanisms by which the encapsulated oil is released over time. Understanding kinetics is crucial for optimizing the design of encapsulation systems for specific applications. Several mathematical models are commonly used to describe the release kinetics of oils or other substances [33,34].
Experimental release kinetics data from Figure 4 were regressed using MATLAB® version: 9.2.0 (R2017a). Data were fitted to pseudo-first and second-order rate laws using both linear and nonlinear regression methods. The findings revealed that the release of eugenol for the tree concentrations followed pseudo-second-order kinetics, as shown in Figure 5. The current model showed that rate constants (k) can be predicted using Equation (4) [35].
1 C = 1 C 0 + k t
Pseudo-second-order kinetics describe a release process where the release rate is directly proportional to the concentration of the encapsulated substance remaining in the matrix. Table 3 presents the pseudo-second-order regression values of Equation (4) for the release of beads with concentrations C1, C2, and C3.
This model is widely used to analyze the release of substances from matrices, where the release is not solely governed by Fickian diffusion but also involves factors, such as polymer relaxation, swelling, or matrix erosion [36]. The slope of the equations is given by the parameter k as the liberation rate constant, and the 1/C0 corresponds to the inverse of the initial concentration value. This model is consistent with the release models and release mechanism of burst release of EO microcapsules obtained by the cross-linked method as described in [19].
As shown in Table 3, the liberation constant k for C1 has the highest value, indicating a faster release rate, followed by the constants for C3 and C2, respectively. This trend is consistent with the decrease in encapsulation efficiency of these materials.

3.5. Antibacterial Activity

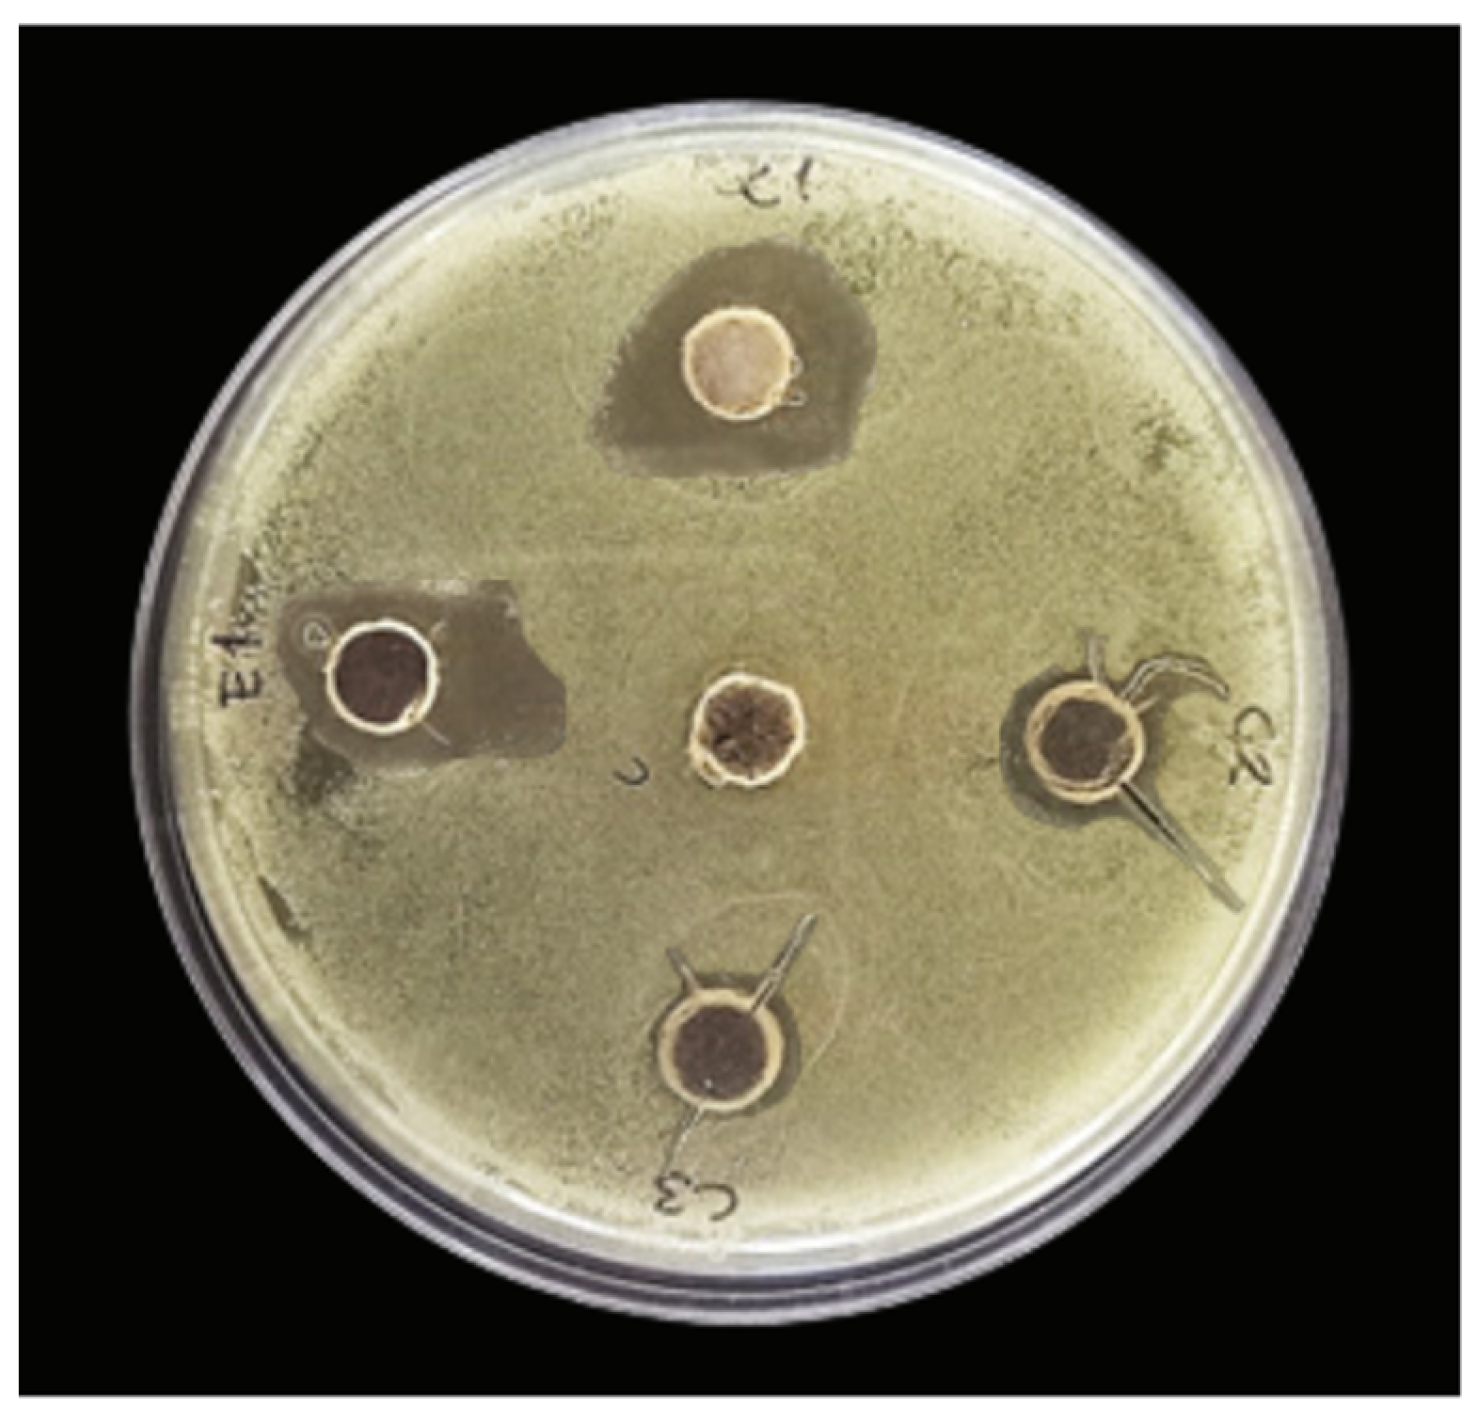
3.5.1. Well-Diffusion Assay

Due to its common presence in non-processed foods or liquids, S. aureus was selected for the antibacterial performance evaluation experiments [19]. In the antimicrobial test in Figure 6a–c, it can be observed that in control (without eugenol) or with low eugenol-loaded materials, the agar plate shows a large number of S. aureus colonies. However, when cocultured with the E1 sample suspension containing eugenol at a 1% concentration, the colony numbers are significantly reduced (p ≤ 0.05) due to the inhibitory effect of eugenol on S. aureus growth.
Figure 7 presents the S. aureus inhibition halo when treated with the different pellet-forming solutions (before being drop-poured into the CaCl2 solution). The C0 (pure cellulose) solution is located at the center, where no inhibition zones were observed through the tested method. Clear inhibition zones appeared near the C1 and E1 samples, and the radius of the inhibition zone is shown in Table 4. These results demonstrate that C0 exhibits no antibacterial activity against S. aureus, and eugenol is responsible for the antibacterial activity observed in E1 and the other composite materials.

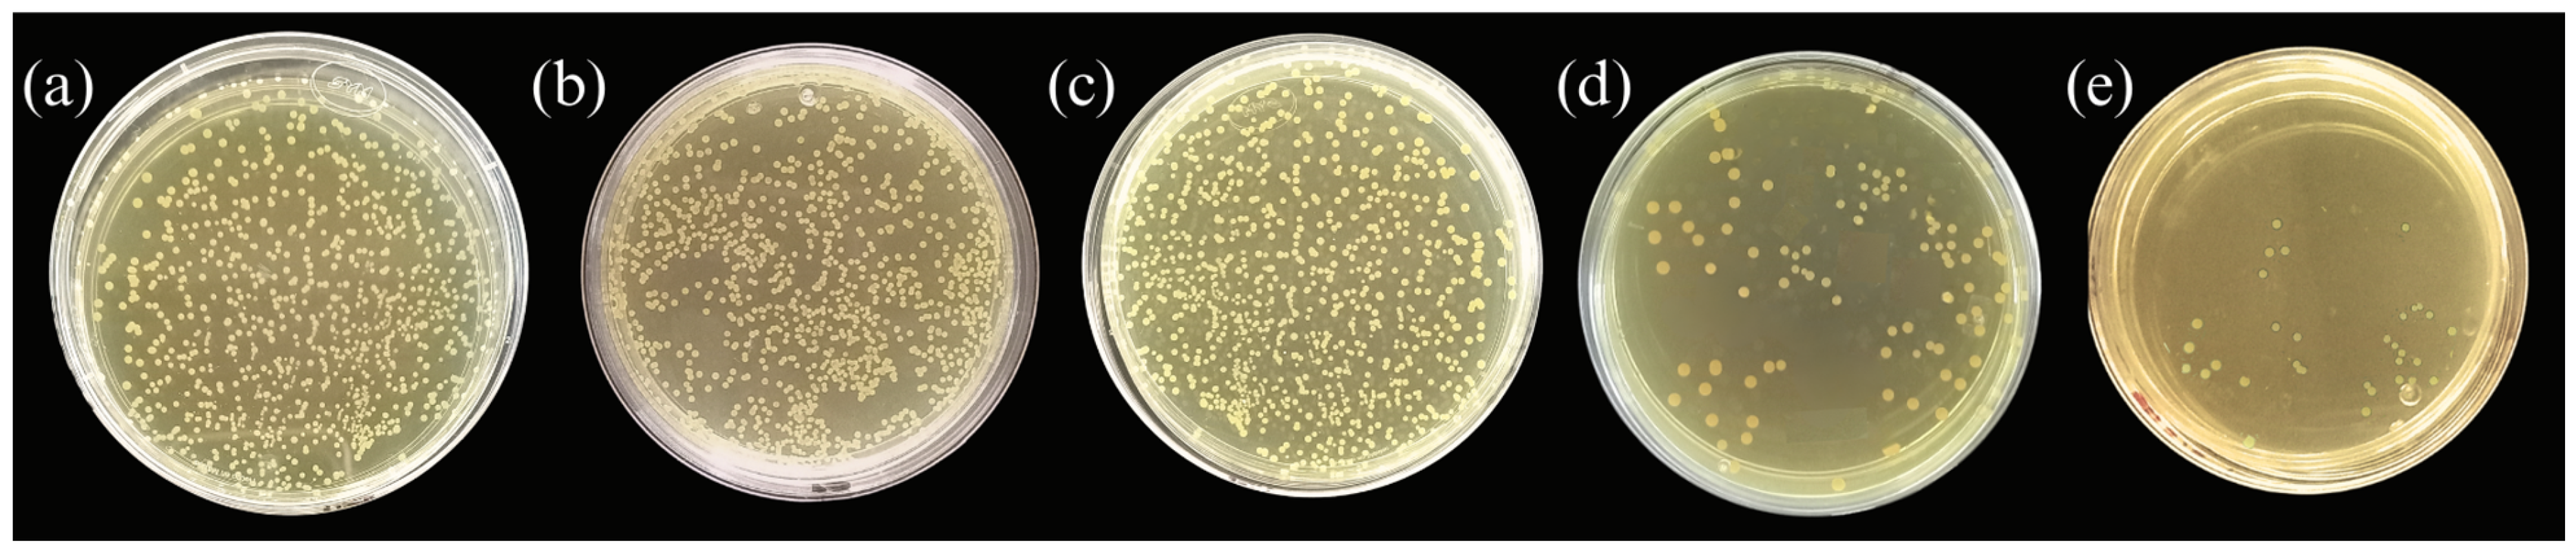
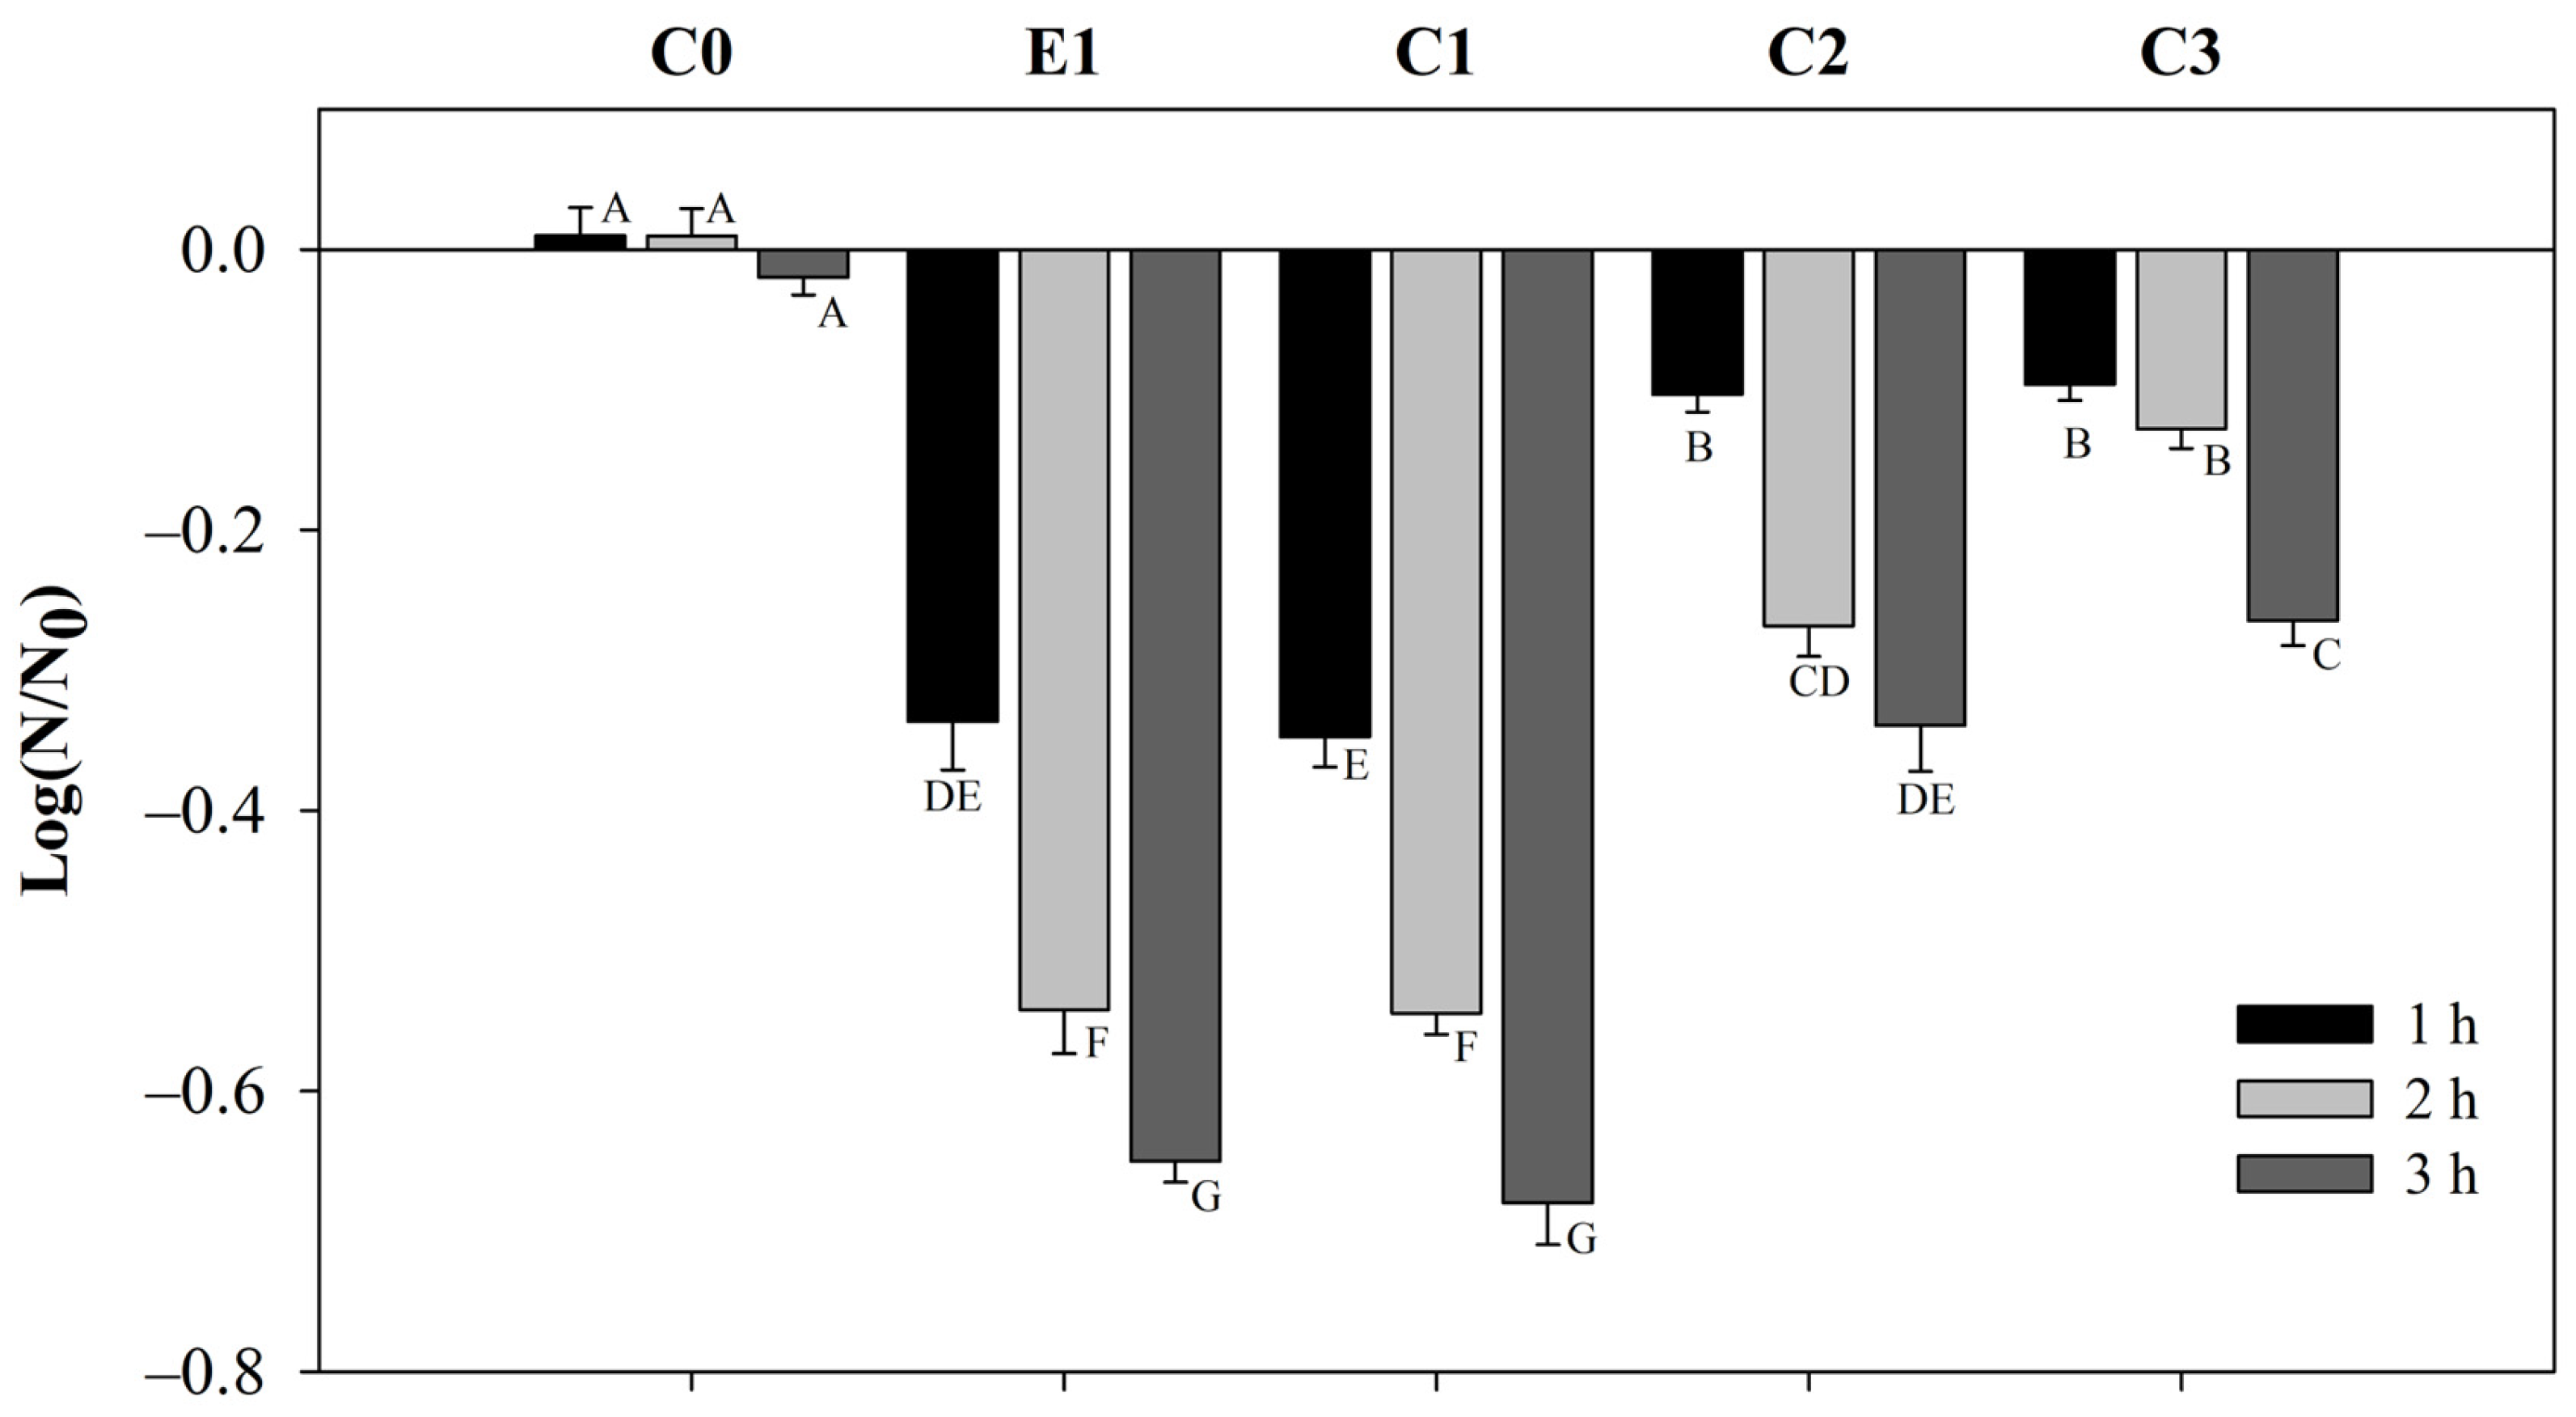
3.5.2. Dilution Assay (Bead Column) Analysis

Initial counts of S. aureus ATCC 29213 were about 104 CFU/mL, and as shown in Figure 8, the microbial population decreased by 0.34 log cycles after 1 h in contact with E1 and 0.35 log cycles with C1. There were no significant differences between beads with the same high eugenol concentration. For C2 and C3, the inhibition in liquid media showed no significant differences between each other (0.5 and 0.1% eugenol) but a difference (p < 0.05) between C1 and E1. The high inhibition activity of C1 and E1 might be related to their encapsulation efficiencies of 93.29% and 84.82%, respectively. Thus, even though both beads started with the same eugenol concentration in the forming solution, the encapsulation process was more efficient in the one containing cellulose, resulting in higher antibacterial activity against S. aureus, although not significantly different.
In the work of [14] about the evaluation of tubular cellulose filters utilized for liquid foods through microbiological analysis, they reported the decrease of Staphylococci to concentrations lower than 1.3 log CFU/g. According to [13], the filtration system through silica microparticles with eugenol to pasteurize apple juice inoculated with E. coli achieved a reduction of 5-log CFU/mL.
As described by [37], the immobilization of natural antimicrobials as processing aids to preserve fruit-derived foods in the past few years has attracted attention to developing filtration systems with both the benefits of the antimicrobial compound and the particle size pore action for the antimicrobial effect in liquid food filtration. Even if the antimicrobial effect of the system proposed in this arrangement is not enough to guarantee disinfection [22,38], the obtained results incentivize looking for longer contact times and increase the number of beads forming the column to be implemented as an alternative as a method of microbial inactivation.

4. Conclusions

Efforts to find innovative and sustainable uses for sugarcane bagasse are ongoing, and research aims to maximize its value and reduce environmental impact. As it is a great source of cellulose, it has gained attention as a promising reinforcement material for antimicrobial composites due to its abundance, renewability, and biodegradability. The cellulose (46.7% yield) from sugarcane bagasse from Atencingo Puebla demonstrated properties like those observed by other researchers and comparable to commercially available cellulose. The encapsulation of eugenol within cellulose–alginate beads demonstrates significant potential for antimicrobial use, offering controlled release, enhanced stability, and versatile application possibilities. The beads exhibited high sphericity and encapsulation efficiency, ranging from 70% to 93%. These parameters result in a burst release mechanism, described by a pseudo-second-order kinetic model, where the release rate is proportional to the concentration of encapsulated eugenol remaining in the bead.
The porous structure of cellulose beads further facilitates the diffusion of eugenol, optimizing its contact with microbes, finding that the forming solution assessed in diffusion assays showed inhibition halos up to 20.27 mm against S. aureus. Further research and exploration may unveil additional dimensions of their antimicrobial properties and broaden their practical use in various applications, as, in the dilution assays, the results obtained encourage exploration of longer contact times and increase the number of beads forming the column as an alternative method for microbial inactivation, as well as trying other concentrations or antimicrobial agents.

Author Contributions

Conceptualization, N.R.-C. and R.N.-A.; methodology, R.H.-L. and R.N.-A.; validation, R.N.-A., A.L.-M. and N.R.-C.; formal analysis, R.H.-L., R.N.-A. and N.R.-C.; investigation, R.H.-L.; resources, A.L.-M.; data curation, R.H.-L.; writing—original draft preparation, R.H.-L.; writing—review and editing, R.N.-A., A.L.-M. and N.R.-C.; supervision, R.N.-A. and N.R.-C.; project administration, A.L.-M. and N.R.-C.; funding acquisition, A.L.-M. All authors have read and agreed to the published version of the manuscript.

Funding

This research received no external funding.

Institutional Review Board Statement

Not applicable.

Informed Consent Statement

Not applicable.

Data Availability Statement

The data presented in this study are available in the article.

Acknowledgments

Author Rosa Hernández-López gratefully acknowledges the financial support for her Ph.D. studies from Universidad de las Americas Puebla (UDLAP).

Conflicts of Interest

The authors declare no conflicts of interest.

References

  1. Shahi, N.; Min, B.; Sapkota, B.; Rangari, V.K. Eco-Friendly Cellulose Nanofiber Extraction from Sugarcane Bagasse and Film Fabrication. Sustainbility 2020, 12, 6015. [Google Scholar] [CrossRef]
  2. Sun, J.X.; Sun, X.F.; Zhao, H.; Sun, R.C. Isolation and characterization of cellulose from sugarcane bagasse. Polym. Degrad. Stab. 2004, 84, 331–339. [Google Scholar] [CrossRef]
  3. Arkoun, M.; Daigle, F.; Holley, R.A.; Heuzey, M.C.; Ajji, A. Chitosan-based nanofibers as bioactive meat packaging materials. Packag. Technol. Sci. 2018, 31, 185–195. [Google Scholar] [CrossRef]
  4. Sihite, R.E.M.; Fahma, F.; Sailah, I.; Yunus, M.; Kusumaatmaja, A.; Mukti, R.R.; Kadja, G.T.M. Production and characterization of PVA/alginate composite filament with cellulose from oil palm empty fruit bunches. In Proceedings of the IOP Conference Series: Earth and Environmental Science, Bogor, Indonesia, 9–10 October 2019; IOP Publishing: Bristol, UK, 2020; Volume 472, p. 012015. [Google Scholar]
  5. Tian, F.; Chen, W.; Wu, C.E.; Kou, X.; Fan, G.; Li, T.; Wu, Z. Preservation of Ginkgo biloba seeds by coating with chitosan/nano-TiO2 and chitosan/nano-SiO2 films. Int. J. Biol. Macromol. 2019, 126, 917–925. [Google Scholar] [CrossRef]
  6. Youssef, A.M.; El-Sayed, S.M. Bionanocomposites materials for food packaging applications: Concepts and future outlook. Carbohydr. Polym. 2018, 193, 19–27. [Google Scholar] [CrossRef]
  7. de Farias, B.S.; Sant’Anna Cadaval Junior, T.R.; de Almeida Pinto, L.A. Chitosan-functionalized nanofibers: A comprehensive review on challenges and prospects for food applications. Int. J. Biol. Macromol. 2019, 123, 210–220. [Google Scholar] [CrossRef] [PubMed]
  8. Sayed, A.; Safwat, G.; Abdel-raouf, M.; Mahmoud, G.A. Alkali-cellulose/Polyvinyl alcohol biofilms fabricated with essential clove oil as a novel scented antimicrobial packaging material. Carbohydr. Polym. Technol. Appl. 2023, 5, 100273. [Google Scholar] [CrossRef]
  9. Paris, M.J.; Ramírez-Corona, N.; Palou, E.; López-Malo, A. Modelling release mechanisms of cinnamon (Cinnamomum zeylanicum) essential oil encapsulated in alginate beads during vapor-phase application. J. Food Eng. 2020, 282, 110024. [Google Scholar] [CrossRef]
  10. Lorenzo-Leal, A.C.; Palou, E.; López-Malo, A. Evaluation of the efficiency of allspice, thyme and rosemary essential oils on two foodborne pathogens in in-vitro and on alfalfa seeds, and their effect on sensory characteristics of the sprouts. Int. J. Food Microbiol. 2019, 295, 19–24. [Google Scholar] [CrossRef]
  11. Ribes, S.; Ruiz-Rico, M.; Moreno-Mesonero, L.; Moreno, Y.; Barat, J.M. Natural antimicrobial compounds immobilised on silica microparticles as filtering materials: Impact on the metabolic activity and bacterial viability of waterborne microorganisms. Environ. Technol. Innov. 2021, 21, 101219. [Google Scholar] [CrossRef]
  12. Dikić, J.; Lukić, I.; Pajnik, J.; Pavlović, J.; Hrenović, J.; Rajić, N. Antibacterial activity of thymol/carvacrol and clinoptilolite composites prepared by supercritical solvent impregnation. J. Porous Mater. 2021, 28, 1577–1584. [Google Scholar] [CrossRef]
  13. Peña-Gómez, N.; Ruiz-Rico, M.; Fernández-Segovia, I.; Barat, J.M. Study of apple juice preservation by filtration through silica microparticles functionalised with essential oil components. Food Control 2019, 106, 106749. [Google Scholar] [CrossRef]
  14. Papafotopoulou-Patrinou, E.; Gialleli, A.I.; Kallis, M.; Plessas, S.; Alexopoulos, A.; Mantzourani, I.; Bezirtzoglou, E.; Bekatorou, A.; Kanellaki, M.; Koutinas, A.A. Microbiological assessment of tubular cellulose filters used for liquid foods cold pasteurization. LWT—Food Sci. Technol. 2016, 67, 151–158. [Google Scholar] [CrossRef]
  15. Feng, Y.H.; Cheng, T.Y.; Yang, W.G.; Ma, P.T.; He, H.Z.; Yin, X.C.; Yu, X.X. Characteristics and environmentally friendly extraction of cellulose nanofibrils from sugarcane bagasse. Ind. Crops Prod. 2018, 111, 285–291. [Google Scholar] [CrossRef]
  16. Jo, Y.J.; Chun, J.Y.; Kwon, Y.J.; Min, S.G.; Hong, G.P.; Choi, M.J. Physical and antimicrobial properties of trans-cinnamaldehyde nanoemulsions in water melon juice. LWT—Food Sci. Technol. 2015, 60, 444–451. [Google Scholar] [CrossRef]
  17. Chan, E.S.; Lee, B.B.; Ravindra, P.; Poncelet, D. Prediction models for shape and size of Ca-alginate macrobeads produced through extrusion-dripping method. J. Colloid Interface Sci. 2009, 338, 63–72. [Google Scholar] [CrossRef]
  18. Hernández-Nava, R.; López-Malo, A.; Palou, E.; Ramírez-Corona, N.; Jiménez-Munguía, M.T. Complex Coacervation Between Gelatin and Chia Mucilage as an Alternative of Encapsulating Agents. J. Food Sci. 2019, 84, 1281–1287. [Google Scholar] [CrossRef]
  19. Zhao, Y.; Wang, Y.; Zhang, Z.; Li, H. Advances in Controllable Release Essential Oil Microcapsules and Their Promising Applications. Molecules 2023, 28, 4979. [Google Scholar] [CrossRef]
  20. Hasheminejad, N.; Khodaiyan, F.; Safari, M. Improving the antifungal activity of clove essential oil encapsulated by chitosan nanoparticles. Food Chem. 2019, 275, 113–122. [Google Scholar] [CrossRef] [PubMed]
  21. Arrioja-Bretón, D.; Mani-López, E.; Palou, E.; López-Malo, A. Antimicrobial activity and storage stability of cell-free supernatants from lactic acid bacteria and their applications with fresh beef. Food Control 2020, 115, 107286. [Google Scholar] [CrossRef]
  22. Peña-Gómez, N.; Ruiz-Rico, M.; Pérez-Esteve, É.; Fernández-Segovia, I.; Barat, J.M. Novel antimicrobial filtering materials based on carvacrol, eugenol, thymol and vanillin immobilized on silica microparticles for water treatment. Innov. Food Sci. Emerg. Technol. 2019, 58, 102228. [Google Scholar] [CrossRef]
  23. Alizadeh Asl, S.; Mousavi, M.; Labbafi, M. Synthesis and Characterization of Carboxymethyl Cellulose from Sugarcane Bagasse. J. Food Process. Technol. 2017, 8, 8. [Google Scholar] [CrossRef]
  24. Tsai, F.H.; Kitamura, Y.; Kokawa, M. Effect of gum arabic-modified alginate on physicochemical properties, release kinetics, and storage stability of liquid-core hydrogel beads. Carbohydr. Polym. 2017, 174, 1069–1077. [Google Scholar] [CrossRef] [PubMed]
  25. Li, Y.; Wen, J.; Xue, Z.; Yin, X.; Yuan, L.; Yang, C. Removal of Cr(VI) by polyaniline embedded polyvinyl alcohol/sodium alginate beads−Extension from water treatment to soil remediation. J. Hazard. Mater. 2022, 426, 127809. [Google Scholar] [CrossRef]
  26. Shlosman, K.; Rein, D.M.; Shemesh, R.; Koifman, N.; Caspi, A.; Cohen, Y. Encapsulation of Thymol and Eugenol Essential Oils Using Unmodified Cellulose: Preparation and Characterization. Polymer 2022, 15, 95. [Google Scholar] [CrossRef]
  27. Montero, Y.; Souza, A.G.; Oliveira, É.R.; dos Santos Rosa, D. Nanocellulose functionalized with cinnamon essential oil: A potential application in active biodegradable packaging for strawberry. Sustain. Mater. Technol. 2021, 29, e00289. [Google Scholar] [CrossRef]
  28. Sarmento, B.; Ribeiro, A.; Veiga, F.; Sampaio, P.; Neufeld, R.; Ferreira, D. Alginate/chitosan nanoparticles are effective for oral insulin delivery. Pharm. Res. 2007, 24, 2198–2206. [Google Scholar] [CrossRef] [PubMed]
  29. Ruiz-Gonzalez, N.; Lopez-Malo, A.; Palou, E.; Ramirez-Corona, N.; Jimenez-Munguia, M.T. Antimicrobial activity and physicochemical characterization of oregano, thyme and clove leave essential oils, nonencapsulated and nanoencapsulated, using emulsification. Appl. Food Biotechnol. 2019, 6, 237–246. [Google Scholar]
  30. Baiya, C.; Nannuan, L.; Tassanapukdee, Y.; Chailapakul, O.; Songsrirote, K. The Synthesis of Carboxymethyl Cellulose-Based Hydrogel from Sugarcane Bagasse Using Microwave-Assisted Irradiation for Selective Adsorption of Copper(II) Ions. Environ. Prog. Sustain. Energy 2019, 38, S157–S165. [Google Scholar] [CrossRef]
  31. Qiao, Y.; Han, Y.; Guan, R.; Liu, S.; Bi, X.; Liu, S.; Cui, W.; Zhang, T.; He, T. Inorganic hollow mesoporous spheres-based delivery for antimicrobial agents. Front. Mater. Sci. 2023, 17, 230631. [Google Scholar] [CrossRef]
  32. Lee, J.H.; Yeo, Y. Controlled drug release from pharmaceutical nanocarriers. Chem. Eng. Sci. 2015, 125, 75–84. [Google Scholar] [CrossRef]
  33. Costa, P.; Sousa Lobo, J.M. Modeling and comparison of dissolution profiles. Eur. J. Pharm. Sci. 2001, 13, 123–133. [Google Scholar] [CrossRef]
  34. Chen, K.; Brennan, C.; Cao, J.; Cheng, G.; Li, L.; Qin, Y.; Chen, H. Characterization of chitosan/eugenol-loaded IRMOF-3 nanoparticles composite films with sustained antibacterial activity and their application in postharvest preservation of strawberries. LWT 2023, 186, 115270. [Google Scholar] [CrossRef]
  35. Cheng, J.; Wang, H.; Kang, S.; Xia, L.; Jiang, S.; Chen, M.; Jiang, S. An active packaging film based on yam starch with eugenol and its application for pork preservation. Food Hydrocoll. 2019, 96, 546–554. [Google Scholar] [CrossRef]
  36. Liburdi, K.; Benucci, I.; Palumbo, F.; Esti, M. Lysozyme immobilized on chitosan beads: Kinetic characterization and antimicrobial activity in white wines. Food Control 2016, 63, 46–52. [Google Scholar] [CrossRef]
  37. Gómez-Llorente, H.; Fernández-Segovia, I.; Pérez-Esteve, É.; Ribes, S.; Rivas, A.; Ruiz-Rico, M.; Barat, J.M. Immobilization of Natural Antimicrobial Compounds on Food-Grade Supports as a New Strategy to Preserve Fruit-Derived Foods. Foods 2023, 12, 2060. [Google Scholar] [CrossRef] [PubMed]
  38. Ruiz-Rico, M.; García-Ríos, E.; Barat, J.M.; Guillamón, J.M. Microbial stabilisation of white wine by filtration through silica microparticles functionalised with natural antimicrobials. LWT 2021, 149, 111783. [Google Scholar] [CrossRef]
Figure 1. Column arrangement for the antimicrobial dilution assay, conformed by (a) composite beads, (b) plastic containers, (c) inoculated broth, (d) column with beads and broth, (e) standard plate count before filtration, and (f) standard plate count on the broth after filtration.
Waste 02 00007 g001
Figure 2. Size distribution of milled sugarcane bagasse using two grilling devices. The data shown correspond to means from three independent measurements.
Waste 02 00007 g002
Figure 3. FTIR spectra of cellulose, PVA, composite bead with 1% eugenol, pure eugenol.
Waste 02 00007 g003
Figure 4. Release profile of eugenol from alginate bead encapsulation systems at different initial concentrations. C1, C2, and C3—cellulose beads with 1.0, 0.5, or 0.1% (v/v) eugenol, respectively.
Waste 02 00007 g004
Figure 5. Second-order kinetics of eugenol release for C1, C2, and C3 beads.
Waste 02 00007 g005
Figure 6. Colony growth of S. aureus after 24 h of incubation with (a) C0, (b) C3 (eugenol 0.1%), (c) C2 (eugenol 0.5%), (d) C1 (eugenol 1%), and (e) E1 (eugenol 1%).
Waste 02 00007 g006
Figure 7. Inhibition zone of S. aureus growth after 24 h of incubation with beads forming solutions. The location of the solutions is C0—center of the plate, C1—top, C2—right, C3—bottom, and E1—left.
Waste 02 00007 g007
Figure 8. Inhibition test of S. aureus after 1, 2, or 3 h of contact with the columns with C0, E1 (eugenol 1%), C1 (eugenol 1%), C2 (eugenol 0.5%), and C3 (eugenol 0.1%).
Waste 02 00007 g008
Table 1. Physical characterization of the different bead materials, including diameter (D), sphericity factor (SF), water activity (aw), and moisture content (MC).
C0E1 (1%)C1 (1%)C2 (0.5%)C3 (0.1%)
D (mm)2.18 ± 0.29 B2.19 ± 0.25 B2.37 ± 0.43 AB2.62 ± 0.37 A2.66 ± 0.43 A
SF (mm)0.118 ± 0.021 AB0.062± 0.038 B0.157 ± 0.095 A0.118 ± 0.057 AB0.117 ± 0.078 AB
aw0.970 ± 0.01 D0.988 ± 0.092 A0.979 ± 0.089 C0.982 ± 0.101 B0.978 ± 0.096 C
MC % (db)93.48 ± 0.18 A92.66 ± 0.11 B92.67 ± 0.01 B93.78 ± 0.06 A93.5 ± 0.19 A
C0 represents the cellulose beads with no eugenol added; E1 represents beads with 1% v/v eugenol and no cellulose; C1, C2, and C3 are the cellulose beads with 1, 0.5, or 0.1% (v/v) eugenol, respectively. The data shown correspond to means ± standard deviations from 15 beads and experiments conducted in duplicate. Different letters in a row indicate significant differences (p < 0.05) in bead characteristics.
Table 2. Encapsulation efficiency of the different bead materials.
E1 (1%)C1 (1%)C2 (0.5%)C3 (0.1%)
Encapsulation
Efficiency %
84.82 ± 0.29 C93.29 ± 0.31 A70.01 ± 0.23 D85.15 ± 0.21 B
E1 represents the cellulose beads with 1% v/v eugenol; C1, C2, and C3 are the cellulose beads with 1, 0.5, or 0.1% (v/v) eugenol, respectively. The data shown correspond to means ± standard deviations, experiments by triplicate. Different letters in a row indicate significant differences (p < 0.05) in EE.
Table 3. Release parameters of the different bead materials.
C1 (1%)C2 (0.5%)C3 (0.1%)
1/C02.3703 ± 0.9829 C4.8498 ± 1.2711 B10.5430 ± 3.8006 A
k, (%v/v)−1(min)−11.020 ± 0.0124 A0.1292 ± 0.0161 C0.4420 ± 0.0481 B
R20.88060.88980.9028
Parameters 1/C0 and k represent the inverse of the initial concentration value and release constant, respectively. C1, C2, and C3 are the cellulose beads with 1, 0.5, or 0.1% (v/v) eugenol, respectively. The data shown correspond to means ± standard deviations. Different letters in a row indicate significant differences (p < 0.05).
Table 4. Inhibition halo for the beads forming solutions.
C0E1 (1%)C1 (1%)C2 (0.5%)C3 (0.1%)
Inhibition halo (mm)ND18.16 ± 5.99 AB20.47 ± 0.14 A13.18 ± 0.43 B12.82 ± 0.968 B
C0 corresponds to the beads forming solution of cellulose with no eugenol added; E1 is the solution for the cellulose beads with 1% v/v eugenol; C1, C2, and C3 are the solutions for cellulose beads with 1, 0.5, or 0.1% (v/v) eugenol, respectively. The data shown correspond to means ± standard deviations, measurement in two directions, and experiments in triplicate. ND means inhibition halo not detected. Different letters in a row indicate significant differences (p < 0.05).
Disclaimer/Publisher’s Note: The statements, opinions and data contained in all publications are solely those of the individual author(s) and contributor(s) and not of MDPI and/or the editor(s). MDPI and/or the editor(s) disclaim responsibility for any injury to people or property resulting from any ideas, methods, instructions or products referred to in the content.

