
W Prime: Evidence-Based Proposal for a New Predictor of Gait Speed in Older Women

 ,
,  , and
, and 
Abstract
:1. Introduction
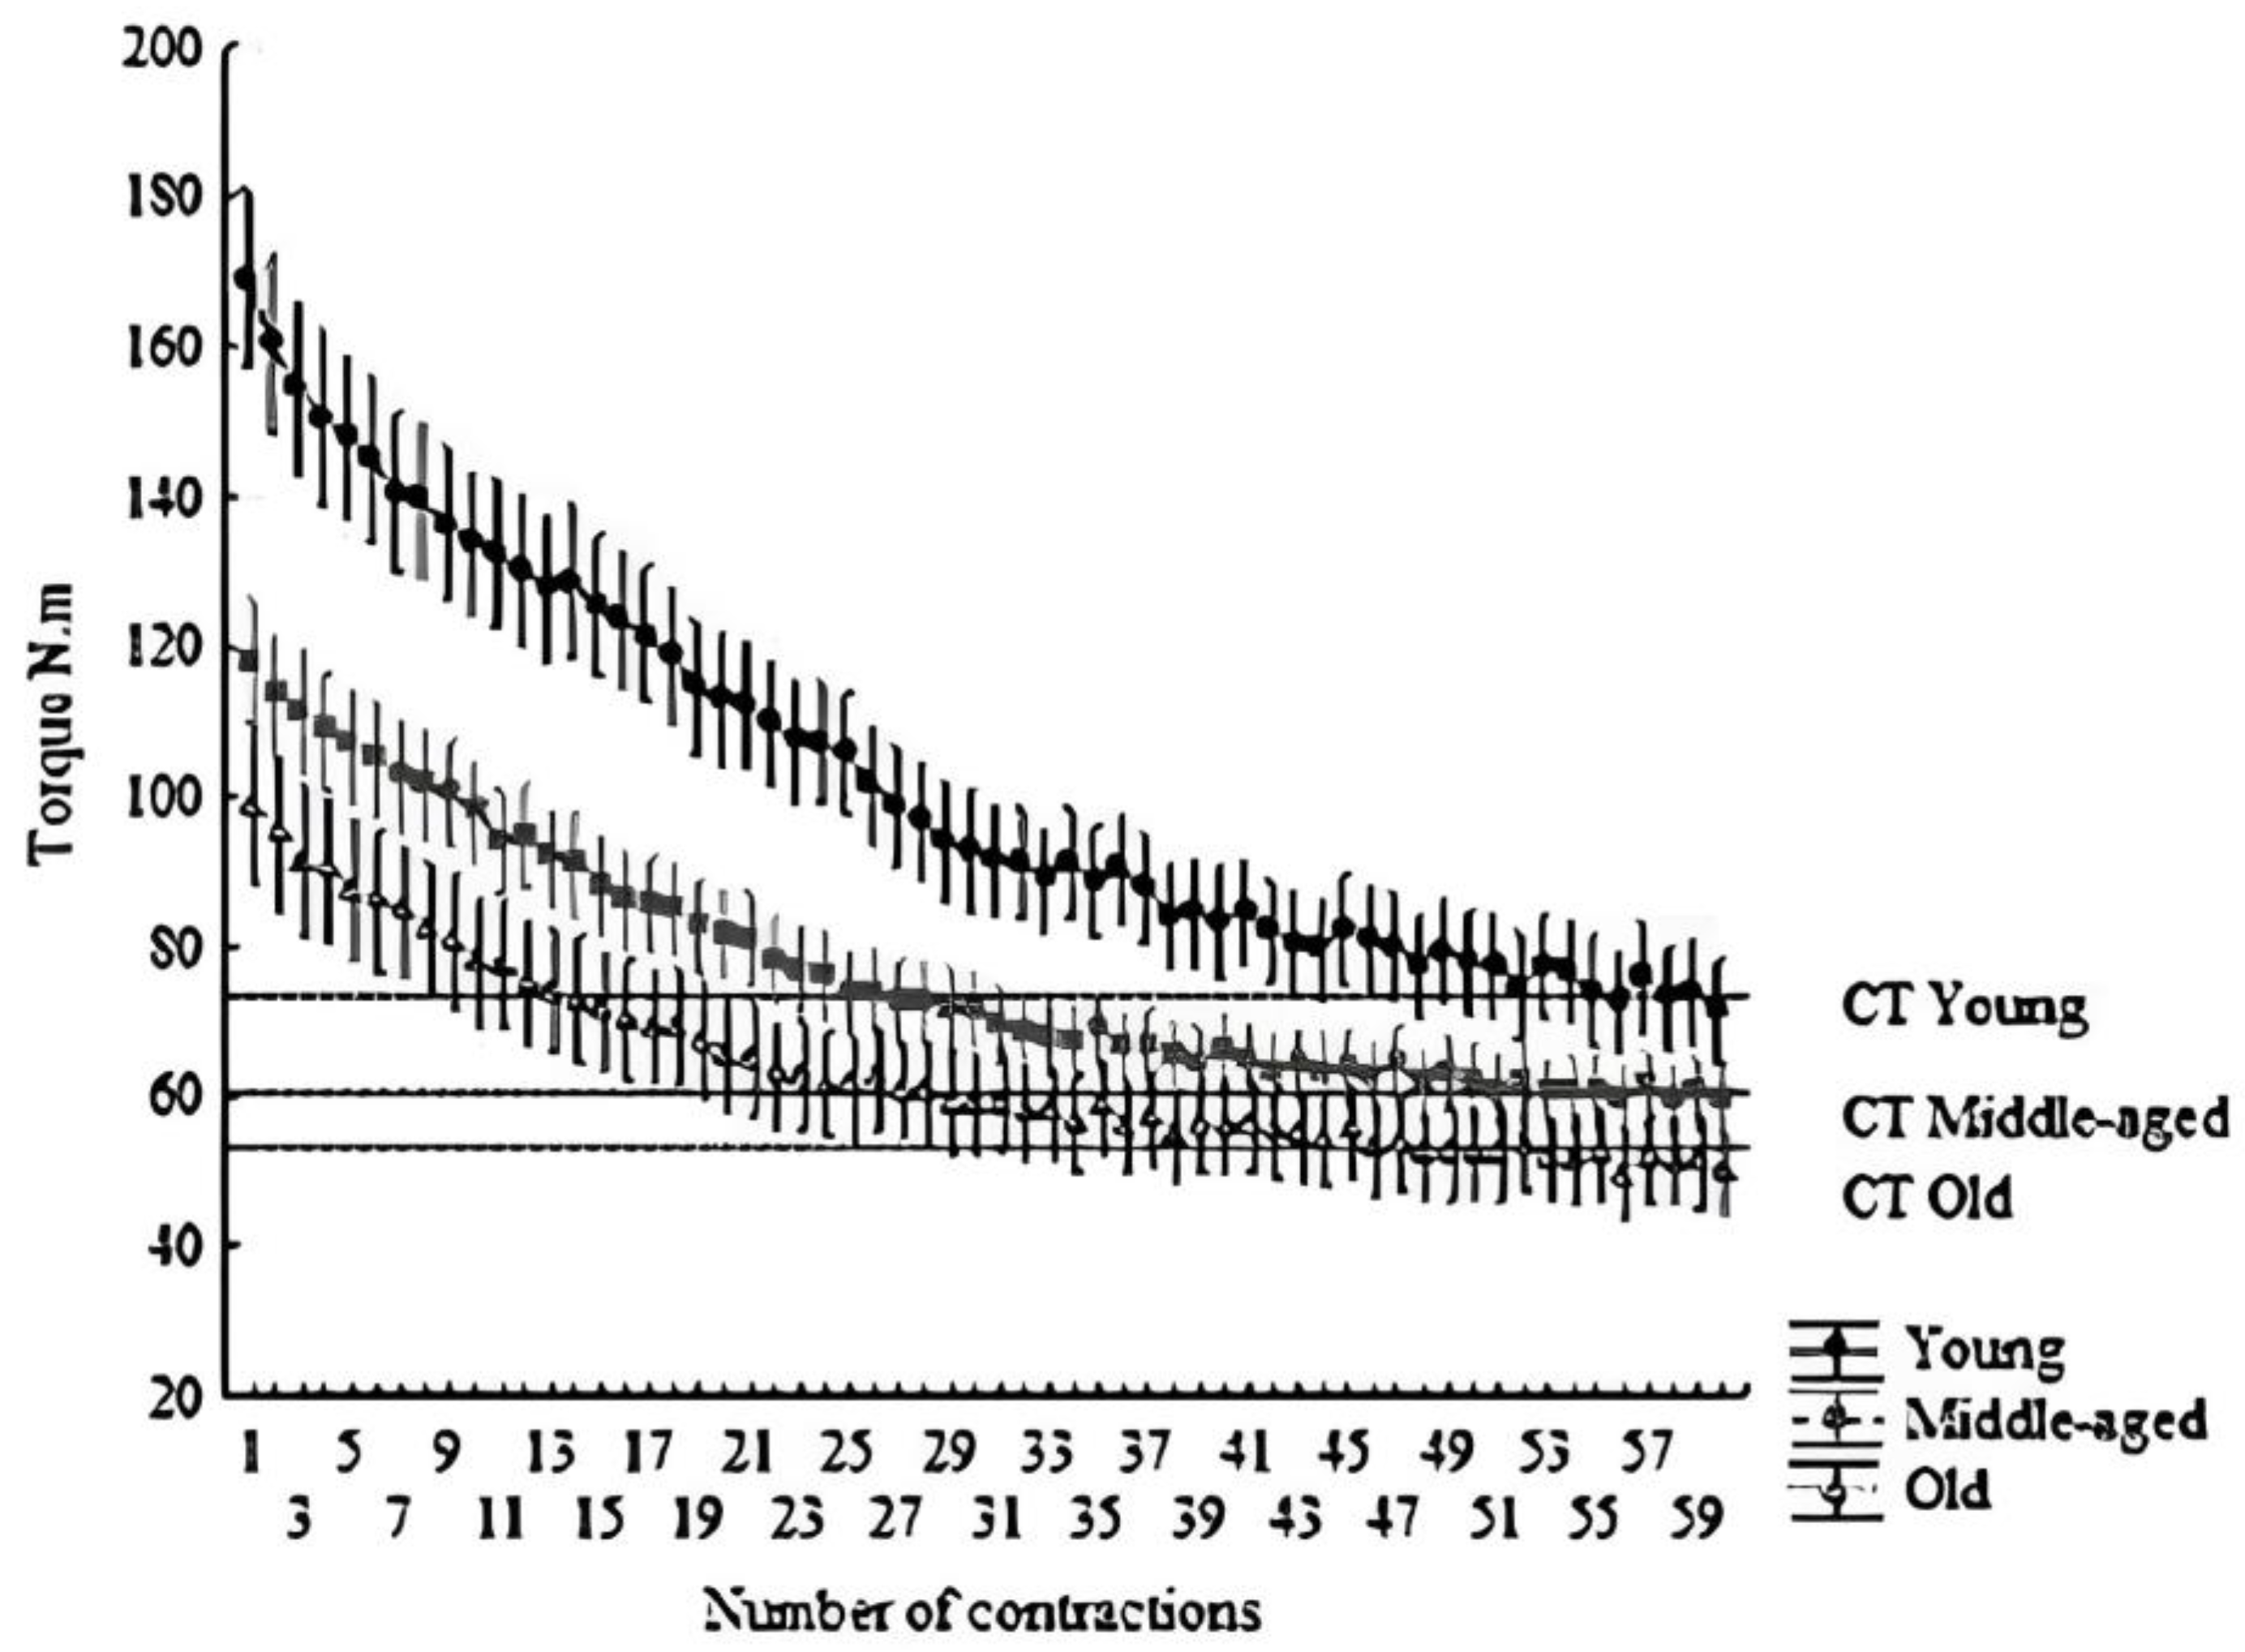
2. Results
3. Discussion
4. Materials and Methods
4.1. Study Design
4.2. Participants
4.3. Anthropometric and Body Composition Assessments
4.4. Gait Speed Assessment
4.5. Maximal Isometric Voluntary Contraction Assessment
4.6. CT and W′ Assessments
4.7. Statistical Analysis
5. Conclusions
Author Contributions
Funding
Institutional Review Board Statement
Informed Consent Statement
Data Availability Statement
Acknowledgments
Conflicts of Interest
References
- Pöllänen, E.; Sipilä, S.; Alen, M.; Ronkainen, P.H.; Ankarberg-Lindgren, C.; Puolakka, J.; Suominen, H.; Hämäläinen, E.; Turpeinen, U.; Konttinen, Y.T.; et al. Differential influence of peripheral and systemic sex steroids on skeletal muscle quality in pre- and postmenopausal women. Aging Cell 2011, 10, 650–660. [Google Scholar] [CrossRef]
- Sirola, J.; Rikkonen, T. Muscle performance after the menopause. J. Br. Menopause Soc. 2005, 11, 45–50. [Google Scholar] [CrossRef]
- Menant, J.C.; Schoene, D.; Sarofim, M.; Lord, S.R. Single and dual task tests of gait speed are equivalent in the prediction of falls in older people: A systematic review and meta-analysis. Ageing Res. Rev. 2014, 16, 83–104. [Google Scholar] [CrossRef]
- Newman, A.B.; Simonsick, E.M.; Naydeck, B.L.; Boudreau, R.M.; Kritchevsky, S.B.; Nevitt, M.C.; Pahor, M.; Satterfield, S.; Brach, J.S.; Studenski, S.A.; et al. Association of long-distance corridor walk performance with mortality, cardiovascular disease, mobility limitation, and disability. JAMA 2006, 295, 2018–2026. [Google Scholar] [CrossRef] [PubMed]
- Studenski, S.; Perera, S.; Patel, K.; Rosano, C.; Faulkner, K.; Inzitari, M.; Brach, J.; Chandler, J.; Cawthon, P.; Connor, E.B.; et al. Gait speed and survival in older adults. JAMA 2011, 305, 50–58. [Google Scholar] [CrossRef]
- Pinedo-Villanueva, R.; Westbury, L.D.; Syddall, H.E.; Sanchez-Santos, M.T.; Dennison, E.M.; Robinson, S.M.; Cooper, C. Health care costs associated with muscle weakness: A UK population-based estimate. Calcif. Tissue Int. 2019, 104, 137–144. [Google Scholar] [CrossRef] [PubMed]
- Cawthon, P.M.; Lui, L.Y.; McCulloch, C.E.; Cauley, J.A.; Paudel, M.L.; Taylor, B.; Schousboe, J.T.; Ensrud, K.E. Sarcopenia and health care utilization in older women. J. Gerontol. A Biol. Sci. Med. Sci. 2017, 72, 95–101. [Google Scholar] [CrossRef]
- Steffl, M.; Sima, J.; Shiells, K.; Holmerova, I. The increase in health care costs associated with muscle weakness in older people without long-term illnesses in the Czech Republic: Results from the survey of health, ageing and retirement in Europe (SHARE). Clin. Interv. Aging 2017, 12, 2003–2007. [Google Scholar] [CrossRef]
- Hairi, N.N.; Cumming, R.G.; Naganathan, V.; Handelsman, D.J.; Le Couteur, D.G.; Creasey, H.; Waite, L.M.; Seibel, M.J.; Sambrook, P.N. Loss of muscle strength, mass (sarcopenia), and quality (specific force) and its relationship with functional limitation and physical disability: The Concord Health and Ageing in Men Project. J. Am. Geriatr. Soc. 2010, 58, 2055–2062. [Google Scholar] [CrossRef] [PubMed]
- Lauretani, F.; Russo, C.R.; Bandinelli, S.; Bartali, B.; Cavazzini, C.; Di Iorio, A.; Corsi, A.M.; Rantanen, T.; Guralnik, J.M.; Ferrucci, L. Age-associated changes in skeletal muscles and their effect on mobility: An operational diagnosis of sarcopenia. J. Appl. Physiol. 2003, 95, 1851–1860. [Google Scholar] [CrossRef]
- Marko, M.; Neville, C.G.; Prince, M.A.; Ploutz-Snyder, L.L. Lower-extremity force decrements identify early mobility decline among community-dwelling older adults. Phys. Ther. 2012, 92, 1148–1159. [Google Scholar] [CrossRef]
- Poole, D.C.; Burnley, M.; Vanhatalo, A.; Rossiter, H.B.; Jones, A.M. Critical Power: An Important Fatigue Threshold in Exercise Physiology. Med. Sci. Sports Exerc. 2016, 48, 2320–2334. [Google Scholar] [CrossRef]
- Hortobagyi, T.; Mizelle, C.; Beam, S.; DeVita, P. Old adults perform activities of daily living near their maximal capabilities. J. Gerontol. Ser. A Biol. Sci. Med. Sci. 2003, 58, M453–M460. [Google Scholar] [CrossRef]
- Ploutz-Snyder, L.L.; Manini, T.; Ploutz-Snyder, R.J.; Wolf, D.A. Functionally relevant thresholds of quadriceps femoris strength. J. Gerontol. Ser. A Biol. Sci. Med. Sci. 2002, 57, B144–B152. [Google Scholar] [CrossRef]
- Justice, J.N.; Mani, D.; Pierpoint, L.A.; Enoka, R.M. Fatigability of the dorsiflexors and associations among multiple domains of motor function in young and old adults. Exp. Gerontol. 2014, 55, 92–101. [Google Scholar] [CrossRef]
- Kent-Braun, J.A.; Callahan, D.M.; Fay, J.L.; Foulis, S.A.; Buonaccorsi, J.P. Muscle weakness, fatigue, and torque variability: Effects of age and mobility status. Muscle Nerve. 2014, 49, 209–217. [Google Scholar] [CrossRef]
- Senefeld, J.; Yoon, T.; Hunter, S.K. Age differences in dynamic fatigability and variability of arm and leg muscles: Associations with physical function. Exp. Gerontol. 2017, 87 Pt A, 74–83. [Google Scholar] [CrossRef]
- Ansdell, P.; Thomas, K.; Hicks, K.M.; Hunter, S.K.; Howatson, G.; Goodall, S. Physiological sex differences affect the integrative response to exercise: Acute and chronic implications. Exp. Physiol. 2020, 105, 2007–2021. [Google Scholar] [CrossRef] [PubMed]
- Zane, A.C.; Reiter, D.A.; Shardell, M.; Cameron, D.; Simonsick, E.M.; Fishbein, K.W.; Studenski, S.A.; Spencer, R.G.; Ferrucci, L. Muscle strength mediates the relationship between mitochondrial energetics and walking performance. Aging Cell 2017, 16, 461–468. [Google Scholar] [CrossRef]
- Sundberg, C.W.; Prost, R.W.; Fitts, R.H.; Hunter, S.K. Bioenergetic basis for the increased fatigability with ageing. J. Physiol. 2019, 597, 4943–4957. [Google Scholar] [CrossRef]
- Layec, G.; Trinity, J.D.; Hart, C.R.; Le Fur, Y.; Zhao, J.; Reese, V.; Jeong, E.-K.; Richardson, R.S. Impaired Muscle Efficiency but Preserved Peripheral Hemodynamics and Mitochondrial Function With Advancing Age: Evidence From Exercise in the Young, Old, and Oldest-Old. J. Gerontol. Ser. A Biol. Sci. Med. Sci. 2018, 73, 1303–1312. [Google Scholar] [CrossRef] [PubMed]
- Ferrucci, L.; Cooper, R.; Shardell, M.; Simonsick, E.M.; Schrack, J.A.; Kuh, D. Age-Related Change in Mobility: Perspectives From Life Course Epidemiology and Geroscience. J. Gerontol. Ser. A Biol. Sci. Med. Sci. 2016, 71, 1184–1194. [Google Scholar] [CrossRef] [PubMed]
- Jones, A.M.; Vanhatalo, A. The ‘Critical Power’ Concept: Applications to Sports Performance with a Focus on Intermittent High-Intensity Exercise. Sports Med. 2017, 47 (Suppl. S1), 65–78. [Google Scholar] [CrossRef] [PubMed]
- Jones, A.M.; Vanhatalo, A.; Burnley, M.; Morton, R.H.; Poole, D.C. Critical power: Implications for determination of VO2max and exercise tolerance. Med. Sci. Sports Exerc. 2010, 42, 1876–1890. [Google Scholar] [CrossRef]
- Neder, J.A.; Jones, P.W.; Nery, L.E.; Whipp, B.J. The effect of age on the power/duration relationship and the intensity-domain limits in sedentary men. Eur. J. Appl. Physiol. 2000, 82, 326–332. [Google Scholar] [CrossRef]
- Overend, T.J.; Cunningham, D.A.; Paterson, D.H.; Smith, W.D. Physiological responses of young and elderly men to prolonged exercise at critical power. Eur. J. Appl. Physiol. Occup. Physiol. 1992, 64, 187–193. [Google Scholar] [CrossRef]
- Burnley, M. Estimation of critical torque using intermittent isometric maximal voluntary contractions of the quadriceps in humans. J. Appl. Physiol. 2009, 106, 975–983. [Google Scholar] [CrossRef]
- Denadai, B.S.; Greco, C.C. Resistance training and exercise tolerance during high-intensity exercise: Moving beyond just running economy and muscle strength. J. Appl. Physiol. 2018, 124, 526–528. [Google Scholar] [CrossRef]
- Kelly, N.A.; Hammond, K.G.; Stec, M.J.; Bickel, C.S.; Windham, S.T.; Tuggle, S.C.; Bamman, M.M. Quantification and characterization of grouped type I myofibers in human aging. Muscle Nerve 2018, 57, E52–E59. [Google Scholar] [CrossRef]
- Lanza, I.R.; Befroy, D.E.; Kent-Braun, J.A. Age-related changes in ATP-producing pathways in human skeletal muscle in vivo. J. Appl. Physiol. 2005, 99, 1736–1744. [Google Scholar] [CrossRef]
- Park, S.Y.; Ives, S.J.; Gifford, J.R.; Andtbacka, R.H.I.; Hyngstrom, J.R.; Reese, V.; Layec, G.; Bharath, L.P.; Symons, J.D.; Richardson, R.S.; et al. Impact of age on the vasodilatory function of human skeletal muscle feed arteries. Am. J. Physiol. Heart Circ. Physiol. 2016, 310, H217–H225. [Google Scholar] [CrossRef] [PubMed]
- Layec, G.; Trinity, J.D.; Hart, C.R.; Le Fur, Y.; Sorensen, J.R.; Jeong, E.-K.; Richardson, R.S. Evidence of a metabolic reserve in the skeletal muscle of elderly people. Aging 2016, 9, 52–67. [Google Scholar] [CrossRef]
- VanderVeen, B.N.; Fix, D.K.; Montalvo, R.N.; Counts, B.R.; Smuder, A.J.; Murphy, E.A.; Koh, H.-J.; Carson, J.A. The regulation of skeletal muscle fatigability and mitochondrial function by chronically elevated interleukin-6. Exp. Physiol. 2019, 104, 385–397. [Google Scholar] [CrossRef] [PubMed]
- Kruger, R.L.; Aboodarda, S.J.; Samozino, P.; Rice, C.L.; Millet, G.Y. Isometric versus Dynamic Measurements of Fatigue: Does Age Matter? A Meta-analysis. Med. Sci. Sports Exerc. 2018, 50, 2132–2144. [Google Scholar] [CrossRef]
- Sawyer, B.J.; Stokes, D.G.; Womack, C.J.; Morton, R.H.; Weltman, A.; Gaesser, G.A. Strength training increases endurance time to exhaustion during high-intensity exercise despite no change in critical power. J. Strength Cond. Res. 2014, 28, 601–609. [Google Scholar] [CrossRef] [PubMed]
- Berg, O.K.; Kwon, O.S.; Hureau, T.J.; Clifton, H.L.; Thurston, T.; Le Fur, Y.; Jeong, E.-K.; Amann, M.; Richardson, R.S.; Trinity, J.D.; et al. Maximal strength training increases muscle force generating capacity and the anaerobic ATP synthesis flux without altering the cost of contraction in elderly. Exp. Gerontol. 2018, 111, 154–161. [Google Scholar] [CrossRef]
- Christie, A.; Snook, E.M.; Kent-Braun, J.A. Systematic review and meta-analysis of skeletal muscle fatigue in old age. Med. Sci. Sports Exerc. 2011, 43, 568–577. [Google Scholar] [CrossRef]
- de Sousa, J.F.R.; Oliveira Júnior, G.N.; Carneiro, M.A.S.; Martins, F.M.; Santagnelo, S.B.; Assumpção, C.O.; Souza, M.V.C.; Orsatti, F.L. Resistance training at different intensities promotes different adaptations on the parameters of torque–duration relationship in postmenopausal women. Sport Sci. Health, 2023; ahead of print. [Google Scholar]
- Yoon, T.; Doyel, R.; Widule, C.; Hunter, S.K. Sex differences with aging in the fatigability of dynamic contractions. Exp. Gerontol. 2015, 70, 1–10. [Google Scholar] [CrossRef]
- Edgerton, V.R.; Smith, J.L.; Simpson, D.R. Muscle fibre type populations of human leg muscles. Histochem. J. 1975, 7, 259–266. [Google Scholar] [CrossRef]
- Johnson, M.A.; Polgar, J.; Weightman, D.; Appleton, D. Data on the distribution of fibre types in thirty-six human muscles: An autopsy study. J. Neurol. Sci. 1973, 18, 111–129. [Google Scholar] [CrossRef]
- Sundberg, C.W.; Kuplic, A.; Hassanlouei, H.; Hunter, S.K. Mechanisms for the age-related increase in fatigability of the knee extensors in old and very old adults. J. Appl. Physiol. 2018, 125, 146–158. [Google Scholar] [CrossRef] [PubMed]
- Maden-Wilkinson, T.M.; Degens, H.; Jones, D.A.; McPhee, J.S. Comparison of MRI and DXA to measure muscle size and age-related atrophy in thigh muscles. J. Musculoskelet. Neuronal Interact. 2013, 13, 320–328. [Google Scholar] [PubMed]
- Buckinx, F.; Landi, F.; Cesari, M.; Fielding, R.A.; Visser, M.; Engelke, K.; Maggi, S.; Dennison, E.; Al-Daghri, N.M.; Allepaerts, S.; et al. Pitfalls in the measurement of muscle mass: A need for a reference standard. J. Cachexia Sarcopenia Muscle. 2018, 9, 269–278. [Google Scholar] [CrossRef]
- Fritz, S.; Lusardi, M. White paper: “Walking speed: The sixth vital sign”. J. Geriatr. Phys. Ther. 2009, 32, 46–49. [Google Scholar] [CrossRef] [PubMed]
- Simonsick, E.M.; Newman, A.B.; Visser, M.; Goodpaster, B.; Kritchevsky, S.B.; Rubin, S.; Nevitt, M.C.; Harris, T.B. Mobility limitation in self-described well-functioning older adults: Importance of endurance walk testing. J. Gerontol. Ser. A Biol. Sci. Med. Sci. 2008, 63, 841–847. [Google Scholar] [CrossRef] [PubMed]
- Chung, J.; Demiris, G.; Thompson, H.J. Instruments to assess mobility limitation in community-dwelling older adults: A systematic review. J. Aging Phys. Act. 2015, 23, 298–313. [Google Scholar] [CrossRef]


| Variable | Young (n = 29) Mean (CI 95%) | Middle-Aged (n = 57) Mean (CI 95%) | Older (n = 45) Mean (CI 95%) | p |
|---|---|---|---|---|
| Age (years) | 23.8 (21.8–25.7) | 52.6 * (51.3–54.0) | 66.6 *,‡ (65.2–68.3) | <0.001 |
| Time of menopause (years) | 0.0 (0.0–0.0) | 6.1 * (4.6–7.6) | 16.2 *,‡ (14.6–17.9) | <0.001 |
| Height (m) | 1.65 (1.63–1.68) | 1.60 * (1.59–1.62) | 1.57 *,‡ (1.56–1.59) | <0.001 |
| Body weight (kg) | 61.0 (56.8–65.2) | 71.3 * (68.2–74.3) | 64.0 ‡ (60.8–67.3) | <0.001 |
| Medication intake | ||||
| Antihyperglycemic | 0 | 1 | 6 | |
| Antihypertensive | 0 | 16 | 13 | |
| Antiasthmatic | 0 | 0 | 2 | |
| Antidepressives | 0 | 9 | 8 | |
| Antianxiolytics | 0 | 2 | 1 | |
| Antihypercholesterolemia | 0 | 8 | 15 | |
| Antiulcer | 0 | 2 | 0 | |
| Calcium | 0 | 2 | 2 | |
| Thyroxin therapy | 0 | 4 | 12 |
| Variable | Young (n = 29) Mean (CI 95%) | Middle-Aged (n = 57) Mean (CI 95%) | Older (n = 45) Mean (CI 95%) | p | Effect Size | Observed Power |
|---|---|---|---|---|---|---|
| TLM (kg) | 5.4 (5.1–5.7) | 4.7 * (4.5–4.9) | 4.3 *,‡ (4.1–4.6) | <0.001 | 0.19 | 1.00 |
| Total fat (kg) | 18.8 (15.9–21.6) | 30.4 * (28.3–32.4) | 25.7 *,‡ (23.5–28.0) | <0.001 | 0.25 | 1.00 |
| Fat (%) | 30.4 (28.4–32.5) | 41.7 * (40.2–43.2) | 39.9 * (38.3–41.5) | <0.001 | 0.39 | 1.00 |
| Maximal torque (N.m) | 184.4 (170.7–198.0) | 133.4 * (123.5–143.2) | 118.4 *,‡ (107.7–129.2) | <0.001 | 0.31 | 1.00 |
| W′ (N.m.s) | 8880.6 (8115.4–9645.8) | 5320.6 * (4769.9–5871.2) | 4004.3 *,‡ (3439.2–4641.4) | <0.001 | 0.43 | 1.00 |
| W′ (%) | 5210.8 (4784.3–5637.3) | 4332.1 * (4025.2–4639.0) | 3953.8 * (3618.8–4288.8) | <0.001 | 0.13 | 0.98 |
| W′/ maximal torque (N.m) | 47.8 (43.9–51.8) | 40.2 * (37.4–43.0) | 34.4 *,‡ (31.3–37.5) | <0.001 | 0.16 | 1.00 |
| CT (N.m) | 73.7 (66.6–80.7) | 60.3 * (55.3–65.4) | 54.2 * (48.6–59.7) | <0.001 | 0.13 | 0.98 |
| CT (%) | 44.0 (40.5–47.4) | 50.8 * (48.3–53.3) | 50.3 * (47.6–53.0) | 0.005 | 0.08 | 0.85 |
| CT/ maximal torque (N.m) | 0.4 (0.4–0.4) | 0.5 * (0.4–0.5) | 0.5 * (0.4–0.5) | 0.032 | 0.05 | 0.65 |
| 10 m (m/s) | 2.4 (2.3–2.5) | 2.0 * (1.9–2.1) | 1.9 *,‡ (1.8–2.0) | <0.001 | 0.38 | 1.00 |
| 400 m (m/s) | 2.1 (2.0–2.2) | 1.8 * (1.8–1.9) | 1.7 *,‡ (1.7–1.8) | <0.001 | 0.41 | 1.00 |
| 6 MWT (m/s) | 2.1 (2.0–2.1) | 1.8 * (1.8–1.8) | 1.7 *,‡ (1.6–1.7) | <0.001 | 0.41 | 1.00 |
| TLM (kg) | 5.4 (5.1–5.7) | 4.7 * (4.5–4.9) | 4.3 *,‡ (4.1–4.6) | <0.001 | 0.19 | 1.00 |
| Variable | 10 m | 400 m | 6 MWT | |||||||||
|---|---|---|---|---|---|---|---|---|---|---|---|---|
| Β | SE β | R² | p | β | SE β | R² | p | β | SE β | R² | p | |
| W′ | 0.484 | 0.077 | 0.23 | <0.001 | 0.534 | 0.074 | 0.28 | <0.001 | 0.504 | 0.076 | 0.25 | <0.001 |
| CT | 0.325 | 0.083 | 0.10 | <0.001 | 0.387 | 0.081 | 0.14 | <0.001 | 0.451 | 0.078 | 0.20 | <0.001 |
| Maximal torque | 0.544 | 0.074 | 0.29 | <0.001 | 0.548 | 0.073 | 0.30 | <0.001 | 0.566 | 0.070 | 0.32 | <0.001 |
| TLM | 0.394 | 0.081 | 0.15 | <0.001 | 0.321 | 0.083 | 0.10 | <0.001 | 0.345 | 0.08 | 0.11 | <0.001 |
| W′% | 0.233 | 0.086 | 0.05 | 0.007 | 0.269 | 0.084 | 0.07 | 0.002 | 0.188 | 0.086 | 0.03 | 0.032 |
| W′/Maximal Torque | 0.201 | 0.086 | 0.04 | 0.021 | 0.262 | 0.085 | 0.07 | 0.002 | 0.187 | 0.086 | 0.03 | 0.032 |
| CT% | −0.005 | 0.009 | 0.00 | 0.955 | −0.096 | 0.087 | 0.01 | 0.274 | −0.051 | 0.088 | 0.00 | 0.564 |
| CT/Maximal Torque | −0.248 | 0.085 | 0.06 | 0.004 | −0.179 | 0.086 | 0.03 | 0.039 | −0.110 | 0.088 | 0.01 | 0.211 |
Disclaimer/Publisher’s Note: The statements, opinions and data contained in all publications are solely those of the individual author(s) and contributor(s) and not of MDPI and/or the editor(s). MDPI and/or the editor(s) disclaim responsibility for any injury to people or property resulting from any ideas, methods, instructions or products referred to in the content. |
© 2023 by the authors. Licensee MDPI, Basel, Switzerland. This article is an open access article distributed under the terms and conditions of the Creative Commons Attribution (CC BY) license (https://creativecommons.org/licenses/by/4.0/).
Share and Cite
de Oliveira Júnior, G.N.; de Sousa, J.d.F.R.; Carneiro, M.A.d.S.; Martins, F.M.; Santagnello, S.B.; Nomelini, R.S.; de Oliveira Assumpção, C.; Souza, M.V.C.; Orsatti, F.L. W Prime: Evidence-Based Proposal for a New Predictor of Gait Speed in Older Women. Muscles 2023, 2, 286-298. https://doi.org/10.3390/muscles2030022
de Oliveira Júnior GN, de Sousa JdFR, Carneiro MAdS, Martins FM, Santagnello SB, Nomelini RS, de Oliveira Assumpção C, Souza MVC, Orsatti FL. W Prime: Evidence-Based Proposal for a New Predictor of Gait Speed in Older Women. Muscles. 2023; 2(3):286-298. https://doi.org/10.3390/muscles2030022
Chicago/Turabian Stylede Oliveira Júnior, Gersiel Nascimento, Jairo de Freitas Rodrigues de Sousa, Marcelo Augusto da Silva Carneiro, Fernanda Maria Martins, Samarita Beraldo Santagnello, Rosekeila Simões Nomelini, Cláudio de Oliveira Assumpção, Markus Vinícius Campos Souza, and Fábio Lera Orsatti. 2023. "W Prime: Evidence-Based Proposal for a New Predictor of Gait Speed in Older Women" Muscles 2, no. 3: 286-298. https://doi.org/10.3390/muscles2030022
APA Stylede Oliveira Júnior, G. N., de Sousa, J. d. F. R., Carneiro, M. A. d. S., Martins, F. M., Santagnello, S. B., Nomelini, R. S., de Oliveira Assumpção, C., Souza, M. V. C., & Orsatti, F. L. (2023). W Prime: Evidence-Based Proposal for a New Predictor of Gait Speed in Older Women. Muscles, 2(3), 286-298. https://doi.org/10.3390/muscles2030022