Article

Visual Analytics for Robust Investigations of Placental Aquaporin Gene Expression in Response to Maternal SARS-CoV-2 Infection

by
Raphael D. Isokpehi
1,*,†,
Amos O. Abioye
2,*,
Rickeisha S. Hamilton
1,
Jasmin C. Fryer
1,
Antoinesha L. Hollman
3,
Antoinette M. Destefano
1,
Kehinde B. Ezekiel
1,
Tyrese L. Taylor
1,
Shawna F. Brooks
1,
Matilda O. Johnson
1,
Olubukola Smile
4,
Shirma Ramroop-Butts
1,
Angela U. Makolo
4 and
Albert G. Hayward II
1
1
Transdisciplinary Data Scholars Development Program, Bethune-Cookman University, Daytona Beach, FL 32114, USA
2
College of Pharmacy & Health Sciences, Belmont University, Nashville, TN 37212, USA
3
Division of Arts and Sciences, Jarvis Christian University, Hawkins, TX 75765, USA
4
University of Ibadan Bioinformatics Group, Department of Computer Science, University of Ibadan, Ibadan 200005, Oyo State, Nigeria
*
Authors to whom correspondence should be addressed.
Current address: Office of Data Science Strategy, National Institutes of Health, Bethesda, MD 20892, USA.
Analytics 2024, 3(1), 116-139; https://doi.org/10.3390/analytics3010007
Submission received: 9 November 2023 / Revised: 22 January 2024 / Accepted: 30 January 2024 / Published: 5 February 2024
(This article belongs to the Special Issue Visual Analytics: Techniques and Applications)

Abstract

:
The human placenta is a multifunctional, disc-shaped temporary fetal organ that develops in the uterus during pregnancy, connecting the mother and the fetus. The availability of large-scale datasets on the gene expression of placental cell types and scholarly articles documenting adverse pregnancy outcomes from maternal infection warrants the use of computational resources to aid in knowledge generation from disparate data sources. Using maternal Severe Acute Respiratory Syndrome Coronavirus 2 (SARS-CoV-2) infection as a case study in microbial infection, we constructed integrated datasets and implemented visual analytics resources to facilitate robust investigations of placental gene expression data in the dimensions of flow, curation, and analytics. The visual analytics resources and associated datasets can support a greater understanding of SARS-CoV-2-induced changes to the human placental expression levels of 18,882 protein-coding genes and at least 1233 human gene groups/families. We focus this report on the human aquaporin gene family that encodes small integral membrane proteins initially studied for their roles in water transport across cell membranes. Aquaporin-9 (AQP9) was the only aquaporin downregulated in term placental villi from SARS-CoV-2-positive mothers. Previous studies have found that (1) oxygen signaling modulates placental development; (2) oxygen tension could modulate AQP9 expression in the human placenta; and (3) SARS-CoV-2 can disrupt the formation of oxygen-carrying red blood cells in the placenta. Thus, future research could be performed on microbial infection-induced changes to (1) the placental hematopoietic stem and progenitor cells; and (2) placental expression of human aquaporin genes, especially AQP9.

1. Introduction

The human placenta is an indispensable, multifunctional, disc-shaped temporary fetal organ that develops in the uterus during pregnancy, connecting the mother and the fetus [1,2,3]. The functions of the placenta include embryonic development, fetal development, fetal protection, gas exchange, hormone secretion, metabolic transfer, and waste elimination [1,3]. Maternal viral infection, such as infection of the enveloped ribonucleic acid (RNA) single-stranded Severe Acute Respiratory Syndrome Coronavirus 2 (SARS-CoV-2), during pregnancy is a risk factor for pregnancy complications, neonatal and fetal complications, and long-term health issues [4,5]. Placental gene expression profiling (placental transcriptomics) studies have revealed evidence of differential expression at different stages of a placenta’s development, physiology, and pathology [6,7,8,9,10]. Typically, genes are categorized into gene families or gene groups based on a variety of characteristics, including shared protein sequences and function [11]. Changes to the gene expression levels of several gene family members could alter the molecular and cellular mechanisms during placental development, leading to impaired placental functions and developmental stages [8,12]. The goal of the research reported here is to understand the potential changes in placental gene expression patterns of members of gene families in response to a maternal SARS-CoV-2 infection.
There are rapidly growing multifaceted data resources available to help us understand the Coronavirus Disease 2019 (COVID-19) caused by SARS-CoV-2. These COVID-19 research resources include genome-wide transcriptomic data from bulk and single-cell RNA sequencing (RNA-Seq) of human cell types, including placental cell types [13]. The opportunity or problem statement for this exploratory research is that the availability of large-scale datasets on the gene expression of placental cell types and scholarly articles documenting adverse pregnancy outcomes from maternal infection warrants computational resources to aid in knowledge generation from disparate data sources. An example of these computational resources for knowledge generation and dissemination is visual analytics software [14]. In RNA-Seq data analysis, interactivity and linking of visualizations allows the users of the visualizations to focus on gene sets of interest [15,16]. We conducted a literature search for gene expression datasets from human placentas studied in the context of COVID-19 and identified a study with datasets on RNA-Seq differential gene expression and gene expression counts from term placenta villi [17]. The study by Lu-Culligan et al. [17] contains heterogeneous datasets on (1) clinical and biological characteristics of placenta samples for gene expression investigation; (2) placental differential gene expression; (3) placental gene expression counts; and (4) human gene nomenclature attributes. The RNA-Seq series of datasets generated by Lu-Culligan and colleagues are shared in the National Center for Biotechnology Information’s Gene Expression Omnibus (GEO) with the identifier GSE171995. Furthermore, Zhao et al. [18] conducted an RNA-Seq data analysis of a GSE171995 dataset with a focus on genes encoding galectins and pregnancy-specific glycoproteins (PSGs). These prior studies on maternal SARS-CoV-2 infection-induced changes to placental gene expression and the opportunity for visual analytics-facilitated knowledge generation led to a working hypothesis for our exploratory research [19]. Our working hypothesis, or statement of expectation, was that visual analytics-facilitated robust data investigations of human placental gene expression data would reveal altered biological processes in human gene groups relevant to pregnancy complications.
In this study, a robust data investigation involves the possibility of performing tasks along the dimensions of data challenges: data flow (i.e., collection, storage, access, and movement); data analytics (i.e., modeling and simulation, statistical analysis, and visual analytics); and data curation (i.e., preservation, publication, security, description, and cleaning) [20,21]. In our experience [22,23,24,25], visual analytics tools support the performance of complex cognitive activities, including understanding and knowledge generation [26]. Thus, our first research objective was to develop and implement visual analytics resources able to integrate clinical and biological features as well as datasets on placental gene expression and gene nomenclature associated with maternal SARS-CoV-2 infection during pregnancy.
We focused our data investigation on the aquaporin (AQP) gene family that encodes small integral membrane proteins (24 to 30 kilodaltons) originally studied for their roles in water transport across cell membranes [27]. Aquaporins are widely distributed in the mammalian body system, including the female reproductive system during pregnancy [28,29,30]. Some aquaporins function in the development of mammalian placentas [31,32,33,34], including the natural apoptosis of trophoblast cells [35]. Aquaporins also function in cellular processes, such as cell proliferation and migration, beyond cellular transmembrane transport of water or some small solutes [36]. The 13 mammalian aquaporins (Aquaporin-0 to Aquaporin-12) can be classified by the amino acid sequence motif in their molecular structure and their functional characteristics, such as permeability [28,37]. Aquaporin-0 (AQP0) (also known as major intrinsic protein (MIP), Aquaporin-1 (AQP1), Aquaporin-2 (AQP2), Aquaporin-4 (AQP4), Aquaporin-5 (AQP5), Aquaporin-6 (AQP6), and Aquaporin-8 (AQP8) are referred to as orthodox aquaporins, or water channels, as they have water-specific permeability. Aquaporin-3 (AQP3), Aquaporin-7 (AQP7), Aquaporin-9 (AQP9) and Aquaporin-10 (AQP10) are aquaglyceroporins typically permeable to small uncharged solutes such as lactate, glycerol, and urea [38]. Aquaporin-11 (AQP11) and Aquaporin-12 (AQP12), called super-aquaporins, have low sequence homology compared to the other mammalian aquaporins and are expressed inside the cell with functions including the transportation of water, glycerol, and hydrogen peroxide [37]. New knowledge about signaling pathways that control aquaporin activation, gating, and trafficking are needed to develop AQP-targeted therapies as well as research and diagnostic tools [39]. In this study, the human placenta villi samples obtained from mothers with SARS-CoV-2 infection and matched healthy controls [17] are the biological samples that are the source of RNA for the RNA-Seq sequencing of human genes, including aquaporins. Thus, our second research objective was to determine the patterns of placental gene expression in human aquaporin genes between control and maternal COVID-19 groups. The findings could be of great value for the identification and validation of therapeutic targets for the development of potent immunotherapeutic agents. The different types of gene expression patterns may include differential, outlier, and coordinated expression.
The primary data source for this data investigation is the RNA-Seq dataset labelled as GSE171995 in the National Center for Biotechnology Information’s (NCBI) Gene Expression Omnibus (GEO) [17]. We present the uniquely integrated datasets and the designs of the interactive visualizations for the data investigations that we implemented using visual analytics software. The implemented interactive visualizations for gene expression analysis are: (1) volcano plot of differential expression; (2) data table of gene names with gene expression patterns defined by binary numbers; (3) data table of placenta samples according to sex of infant, SARS-CoV-2 infection status and severity; (4) box plot of gene expression counts; and (5) heatmap of Z-score normalization for each gene.
The visual analytics resources implemented can support interactive data investigations on SARS-CoV-2-induced changes to the placental expression levels of 18,882 protein-coding human genes and at least 1233 human gene groups/families. Among the 13 human aquaporins, Aquaporin-9 (AQP9) was the only aquaporin downregulated in term placental villi from SARS-CoV-2 positive mothers. Previous studies have found that (1) oxygen modulates placental development and AQP9 expression in the placenta [40,41]; and (2) SARS-CoV-2 can disrupt the formation of the oxygen-carrying red blood cells in the placenta [42]. Thus, the need for further research on the changes in the expression of AQP9 in placental cell types in response to SARS-CoV-2 and other microbial infections is critical for the protection of the fetus during pregnancy. The website link to the datasets and visual analytics resources is available in the Supplementary Materials section of this report.

2. Methods

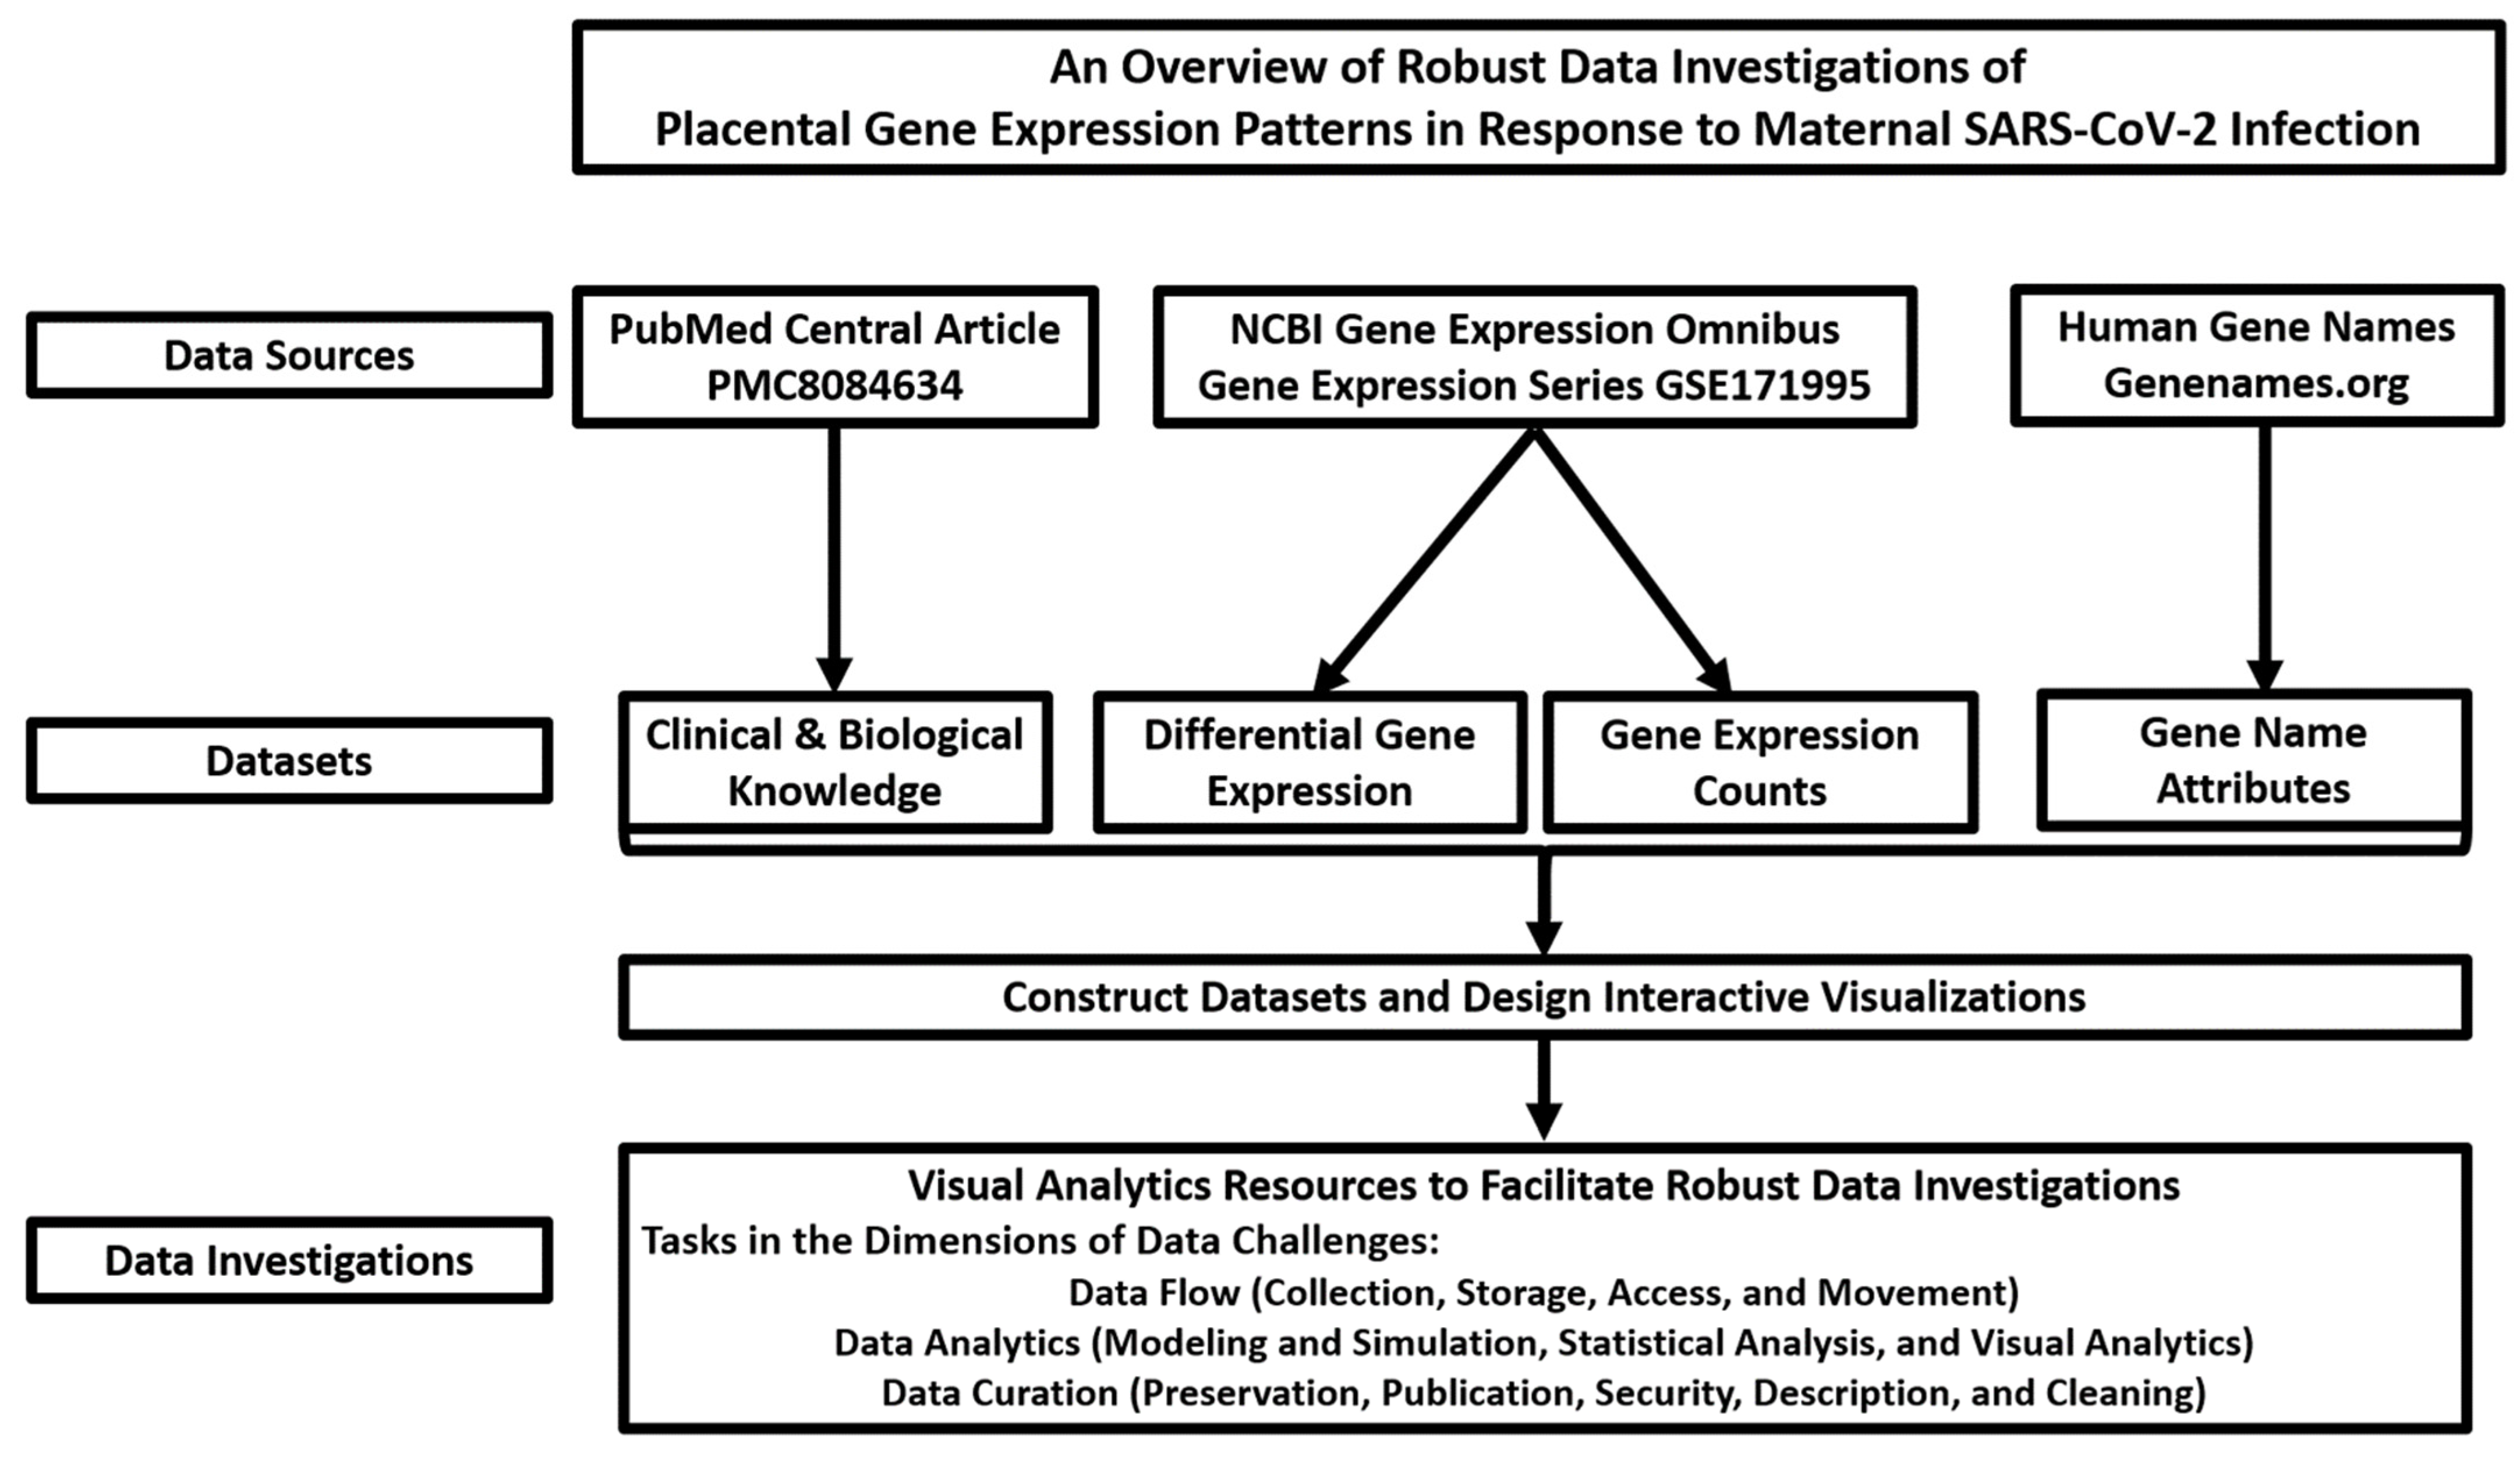
2.1. Data Sources and Overview of Robust Data Investigations of Placental Gene Expression Patterns in Response to Maternal SARS-CoV-2 Infection

The principal data sources of the datasets used to construct value-added datasets and to design interactive visualizations were (1) the scholarly article (PubMed Center: PMC8084634) by Lu-Culligan et al. [17] and (2) the associated processed RNA-Seq datasets available in the National Center for Biotechnology Information (NCBI) Gene Expression Omnibus (GEO) Series GSE171995 [43]. The RNA-seq platform is Illumina HiSeq 2500 (Homo sapiens) (NCBI GEO GPL16791). The bulk RNA sequencing was performed on samples of term placental villi from “pregnant women with COVID-19 (n = 5) and uninfected control individuals matched for maternal age, gestational age, maternal comorbidities, and mode of delivery (n = 3)” [17]. An additional data source, the Human Gene Names database [44], provided the dataset on gene name attributes, including gene groups/families and the unique Ensembl Gene ID from the Ensembl bioinformatics project [45]. We constructed value-added datasets by using visual analytics software to add calculated fields to the datasets obtained from the data sources. Using the visual analytics software and the Ensembl Gene ID as a linking unique identifier, we constructed an integrated dataset by selecting relevant data fields in the value-added datasets. In Figure 1, we present an overview of robust investigations (along the dimensions of data flow, data curation, and data analytics [20]) of placental gene expression patterns in response to maternal SARS-CoV-2 infection.

2.2. Construction of Value-Added Datasets

In the following paragraphs, we provide details of the methods used to collect/assemble datasets, including the addition of calculated fields that add value to the initial datasets.
Gene Expression Levels. The NCBI GEO Series GSE171995 contained processed files of mRNA profiles of placental villous tissue at term delivery from control and SARS-CoV-2-positive mothers [17]. We downloaded the comma separated value (csv) files with RNA sequencing (RNA-Seq) variables for differential expression (e.g., Log2FoldChange and p-value) and abundance (kallisto counts) of mRNA transcripts. Each dataset included data columns for Ensembl Gene Identifier and Gene Symbol. The “differential expression” dataset consisted of 33,576 data rows (genes) and 8 data columns (for example, Ensembl Gene Identifier, Log2FoldChange, p-value and adjusted p-value). The mRNA transcript abundance (“gene expression counts”) dataset consists of 33,576 data rows (genes) and 10 data columns (Ensembl Identifier, Gene Symbol, five placenta samples from SARS-CoV-2 infection positive mothers, and three placenta samples from SARS-CoV-2 infection negative mothers).
Patterns of Gene Expression Levels. RNA-Seq enables measurement of gene expression by digital transcript counting and is thus amenable to the encoding of gene expression counts as binary digits of 0 and 1, depending on the criterion [46,47]. We uploaded the datasets into Tableau Desktop Professional (Tableau) [48] and added new data columns (calculated fields feature in Tableau) to construct binary number patterns (also referred to here as binary patterns) for the data on gene expression levels. These patterns are able to support data investigations by grouping genes according to representations of gene expression levels. The two new data columns were 15-digit and 3-digit binary (presence (1) or absence (0)) patterns. For the 15-digit binary number patterns, in the “gene expression count” dataset, each digit of the 15-digit binary pattern corresponds to the presence (1) or absence (0) of a COVID sample mRNA abundance value that is greater than a control placenta sample. Since there are five placenta samples for SARS-CoV-2 infection and three controls, we constructed a 15-digit binary pattern for each gene. For example, “111111111111” means that all of the five placenta samples associated with maternal SARS-CoV-2 infection (COVID2, COVID3, COVID4, COVID5, and COVID6) have counts greater than the control samples (ctrl1, ctrl2, and ctrl3). In RNA-Seq gene expression data, zero counts can be due to sampling, biological, and technical reasons [49]. To represent zero counts in the control samples of the GSE171995 gene expression count dataset, each digit in the 3-digit binary pattern corresponds to the presence (1) or absence (0) of an mRNA abundance value of zero from a control placenta sample. For example, a gene assigned to “111” indicates that all three control samples have an mRNA abundance value of zero. Using the calculated field feature in Tableau, we combined the 3-digit and 15-digit binary patterns for each gene to form an 18-digit binary pattern data column. It is a possibility that genes that have an identical 18-digit pattern could share biological processes. The visual analytics design that incorporates data filters of the 3-digit and 15-digit binary numbers can support the identification of the set of genes. We constructed another dataset from a “gene expression counts” dataset by reshaping the wide-format to long-format [50]. The long-formatted “gene expression counts” dataset allowed us to construct box plot visuals of the distributions of gene expression counts for the eight placenta samples.
Clinical and Biological Features. Using a spreadsheet software (Microsoft Excel 2016) [51], we constructed a dataset comprising the SARS-CoV-2 infection status (placenta and mother), sex of infant, and severity of SARS-CoV-2 infection (mother) [17]. There are examples of gene family members that have increased expression levels in severe COVID-19 cases, including genes involved in placental development [52]. The presence of placenta sample identifiers (COVID2 to COVID6) in the clinical and biological features dataset allowed us to combine the dataset on clinical features with the dataset on gene expression counts.
Human Gene Names and Symbols. The datasets of genes from the NCBI GEO Series GSE171995 include data fields for Ensembl Gene Identifier and the Human Gene Symbol. We connected the datasets from GSE171995 to additional data fields in the Human Genome Nomenclature Committee’s (HGNC) “Complete HGNC-approved dataset” file with 54 data columns (nomenclature attributes) and 43,177 data rows (human genes including protein-coding genes) [44]. The presence of Ensembl Gene identifiers (prefixed with ENSG) in the HGNC-approved dataset allowed us to (1) combine the dataset on human gene nomenclature with the dataset on differential gene expression; and (2) include the nomenclature attributes of gene families or gene groups.

2.3. Design and Implementation of Visual Analytics Resources

The design and implementation of visual analytics resources were performed in Tableau Desktop Professional and disseminated on the internet using Tableau Public [48]. In this report, four visualizations (heatmap, volcano plot, box plot, and data tables), which are relevant to gene expression data investigation, were designed in the visual analytics software. Following the use of a heatmap visual for scaled RNA-Seq expression data by Zhao et al. [18], we designed an interactive heatmap view to visualize the Z-scores of expression levels for each gene in the GSE171995 dataset. The seven placenta samples compared for each gene were COVID3, COVID4, COVID5, COVID6, Ctrl1, Ctrl2, and Ctrl3. The design of the heatmap view contained a filter for Gene Symbols. When compared to the mean, the Z-scores can be positive (higher than mean), negative (lower than mean), and zero (same as mean) [53].
The volcano plot, a type of scatter plot, displays the effect size estimate [Log2(Fold Change)] on the x-axis and statistical significance [−Log10(p-value)] on the y-axis for genes from a gene expression profiling [54]. The volcano plot of differential gene expression values divides the gene collection according to statistical significance and direction of the changes in expression levels (increased/up or decreased/down). The box plot is a one-dimensional visual that displays the distribution of values and provides five statistical values: maximum, minimum, median, first quartile, and third quartile [55,56,57]. Comparing the shape and statistical values of box plot values supports informal inferential visuo-analytical reasoning [56]. Similar to the published methods [58,59], we used the outlier values detection feature of the box plot to conduct a “sample-centric” data investigation of placental gene expression values associated with members of gene families. The data tables, an example of an enclosure diagram, display values in a matrix of rows and columns, allowing for grouping values and looking up values [60]. In the visual analytics software, we also facilitated robust data investigations by combining interactive visualizations as (1) dashboards (e.g., box plot and heatmap) and (2) blended views (e.g., binary numbers data table and heatmap).

2.4. Verification of Accuracy of Visual Analytics Resources Content and Gene Family Expression Use Cases

We used the heatmap visual for galectins (LGALS) and pregnancy-specific glycoproteins (PSG) to verify the accuracy of the design of the interactive heatmap. We expected that the magnitude of color scaling from our design would be consistent with the heatmap LGALS and PSG gene groups in Zhao et al. [18]. The shape and position of genes in the interactive volcano plot were compared with the static volcano plot in the publication by Lu-Culligan et al. [17], in which HSPA1A (heat shock protein family A (Hsp70) member 1A) is one of the four differentially expressed genes with significant adjusted p-values. Thus, a verification of the accuracy of the interactive visualizations is the finding of the HSPA1A gene expression level and a statistical significance consistent with the source publication [17]. In addition, the color intensity of rectangles (tiles) in the heat map of gene expression levels for the selected 70 top significant genes [17] allowed us to determine the accuracy of the box plot representation. Based on the heat map, we expected that the expression level of HLA-DMB (major histocompatibility complex, class II, DM beta) in the box plot of data for placenta sample COVID2 would be higher than the expression level of HLA-C (major histocompatibility complex, class I, C). In addition, we expected that, in the box plot of data for placenta COVID6 sample, the HLA-C would be higher than the expression of HLA-DMB.
In this study, we investigated the 14 human aquaporin gene family members: MIP, AQP1, AQP2, AQP3, AQP4, AQP5, AQP6, AQP7, AQP8, AQP9, AQP10, AQP11, AQP12A, and AQP12B. We used the 14 gene symbols of aquaporin genes to display the aquaporin-specific (1) list of gene names with gene expression patterns defined by binary numbers, (2) volcano plot of differential expression, (3) box plot of gene expression counts, and (4) heatmap of Z-score normalization for each gene. We selected the aquaporin gene family as a use case because of our prior research on aquaporins [24,28,61,62,63] and the role of aquaporins in placental health and disease [31,34,64,65]. The visual analytics resources allow the selection of gene groups beyond the focus of this report.

2.5. Searches for Biological Networks and Pathways associated with Gene Sets

Visuals of biological networks and pathways are resources for understanding the cellular and molecular mechanisms of genes [66]. Thus, we used the Network Data Exchange Integrated Query (NDEx IQuery) [67] to search for biological networks and pathways associated with a gene set. A gene symbol or multiple gene symbols served as search text for an integrated query of biological network/pathway resources. We conducted searches with (1) the 14 gene symbols for the aquaporin gene family; (2) each aquaporin symbol and gene symbols that share the 18-digit binary pattern with an aquaporin; and (3) upregulated and downregulated genes in term placenta samples from maternal SARS-CoV-2 infection [17]. To enable the NDex IQuery for search gene, we included a web link (uniform research location) action to the visual analytics view of the integrated dataset. We evaluated the results of the NDex networks/pathways search for relevance to infection, pathogen, and placenta.

3. Results

We describe below the designs produced, accuracy of the content, and the findings using example genes and gene groups. The details for access to the constructed datasets and interactive visualizations are available in the Supplementary Materials section of this report. Though the aquaporin gene family is the gene group of interest, researchers can use the datasets and interactive visualizations to investigate other gene groups. The stages of the robust data investigations consist of the following: (1) assemble relevant data sources; (3) construct datasets and design interactive visualizations; and (3) perform data investigations. The constructed datasets included calculated data fields to add value to the datasets. Additionally, some of the produced interactive visualizations included web link actions and objects (such as web page and image) to facilitate robust data investigations.

3.1. Constructed Datasets

We have constructed datasets to understand the potential changes in the placental gene expression patterns of members of gene groups in response to maternal SARS-CoV-2 infection. The datasets were on RNA-Seq differential gene expression and RNA gene transcript counts, as well as biological and clinical features of the placenta samples. A summary of the constructed datasets associated with the visual analytics are available in Supplementary Table S1. The five major gene expression datasets constructed are available in Tables S2–S6. The availability of the human gene nomenclature dataset [68] enabled us to integrate gene groups and locus group (e.g., protein-coding, non-coding, and pseudogene) annotations to the shared gene expression datasets. Furthermore, using the gene expression counts (kallisto counts) from GSE171995, we constructed calculated data fields for seven Z-scores in order to compare the expression levels of a gene across four COVID placenta samples (COVID3, COVID4, COVID5, and COVID6) and three control placenta samples (Ctrl1, Ctrl2, and Ctrl3).
An integrated dataset on placenta gene expression in response to maternal SARS-CoV-2 infection (Table S7) combines data fields from the constructed datasets and the datasets on HGNC gene names. The data fields in the integrated dataset include gene identifiers, differential expression, binary pattern, gene group nomenclature, and the Z-scores for 35,084 genes, including 18,882 protein-coding genes, 8898 pseudogenes, and 80 non-coding RNA genes (Table S7). We have designed and implemented the following interactive visualizations: (1) heatmap of Z-score normalization for each gene; (2) volcano plot of differential expression; (3) data table of gene names with gene expression patterns defined by binary numbers; (4) data table of placenta samples according to sex of infant, SARS-CoV-2 infection status, and severity; and (5) box plot of gene expression counts.

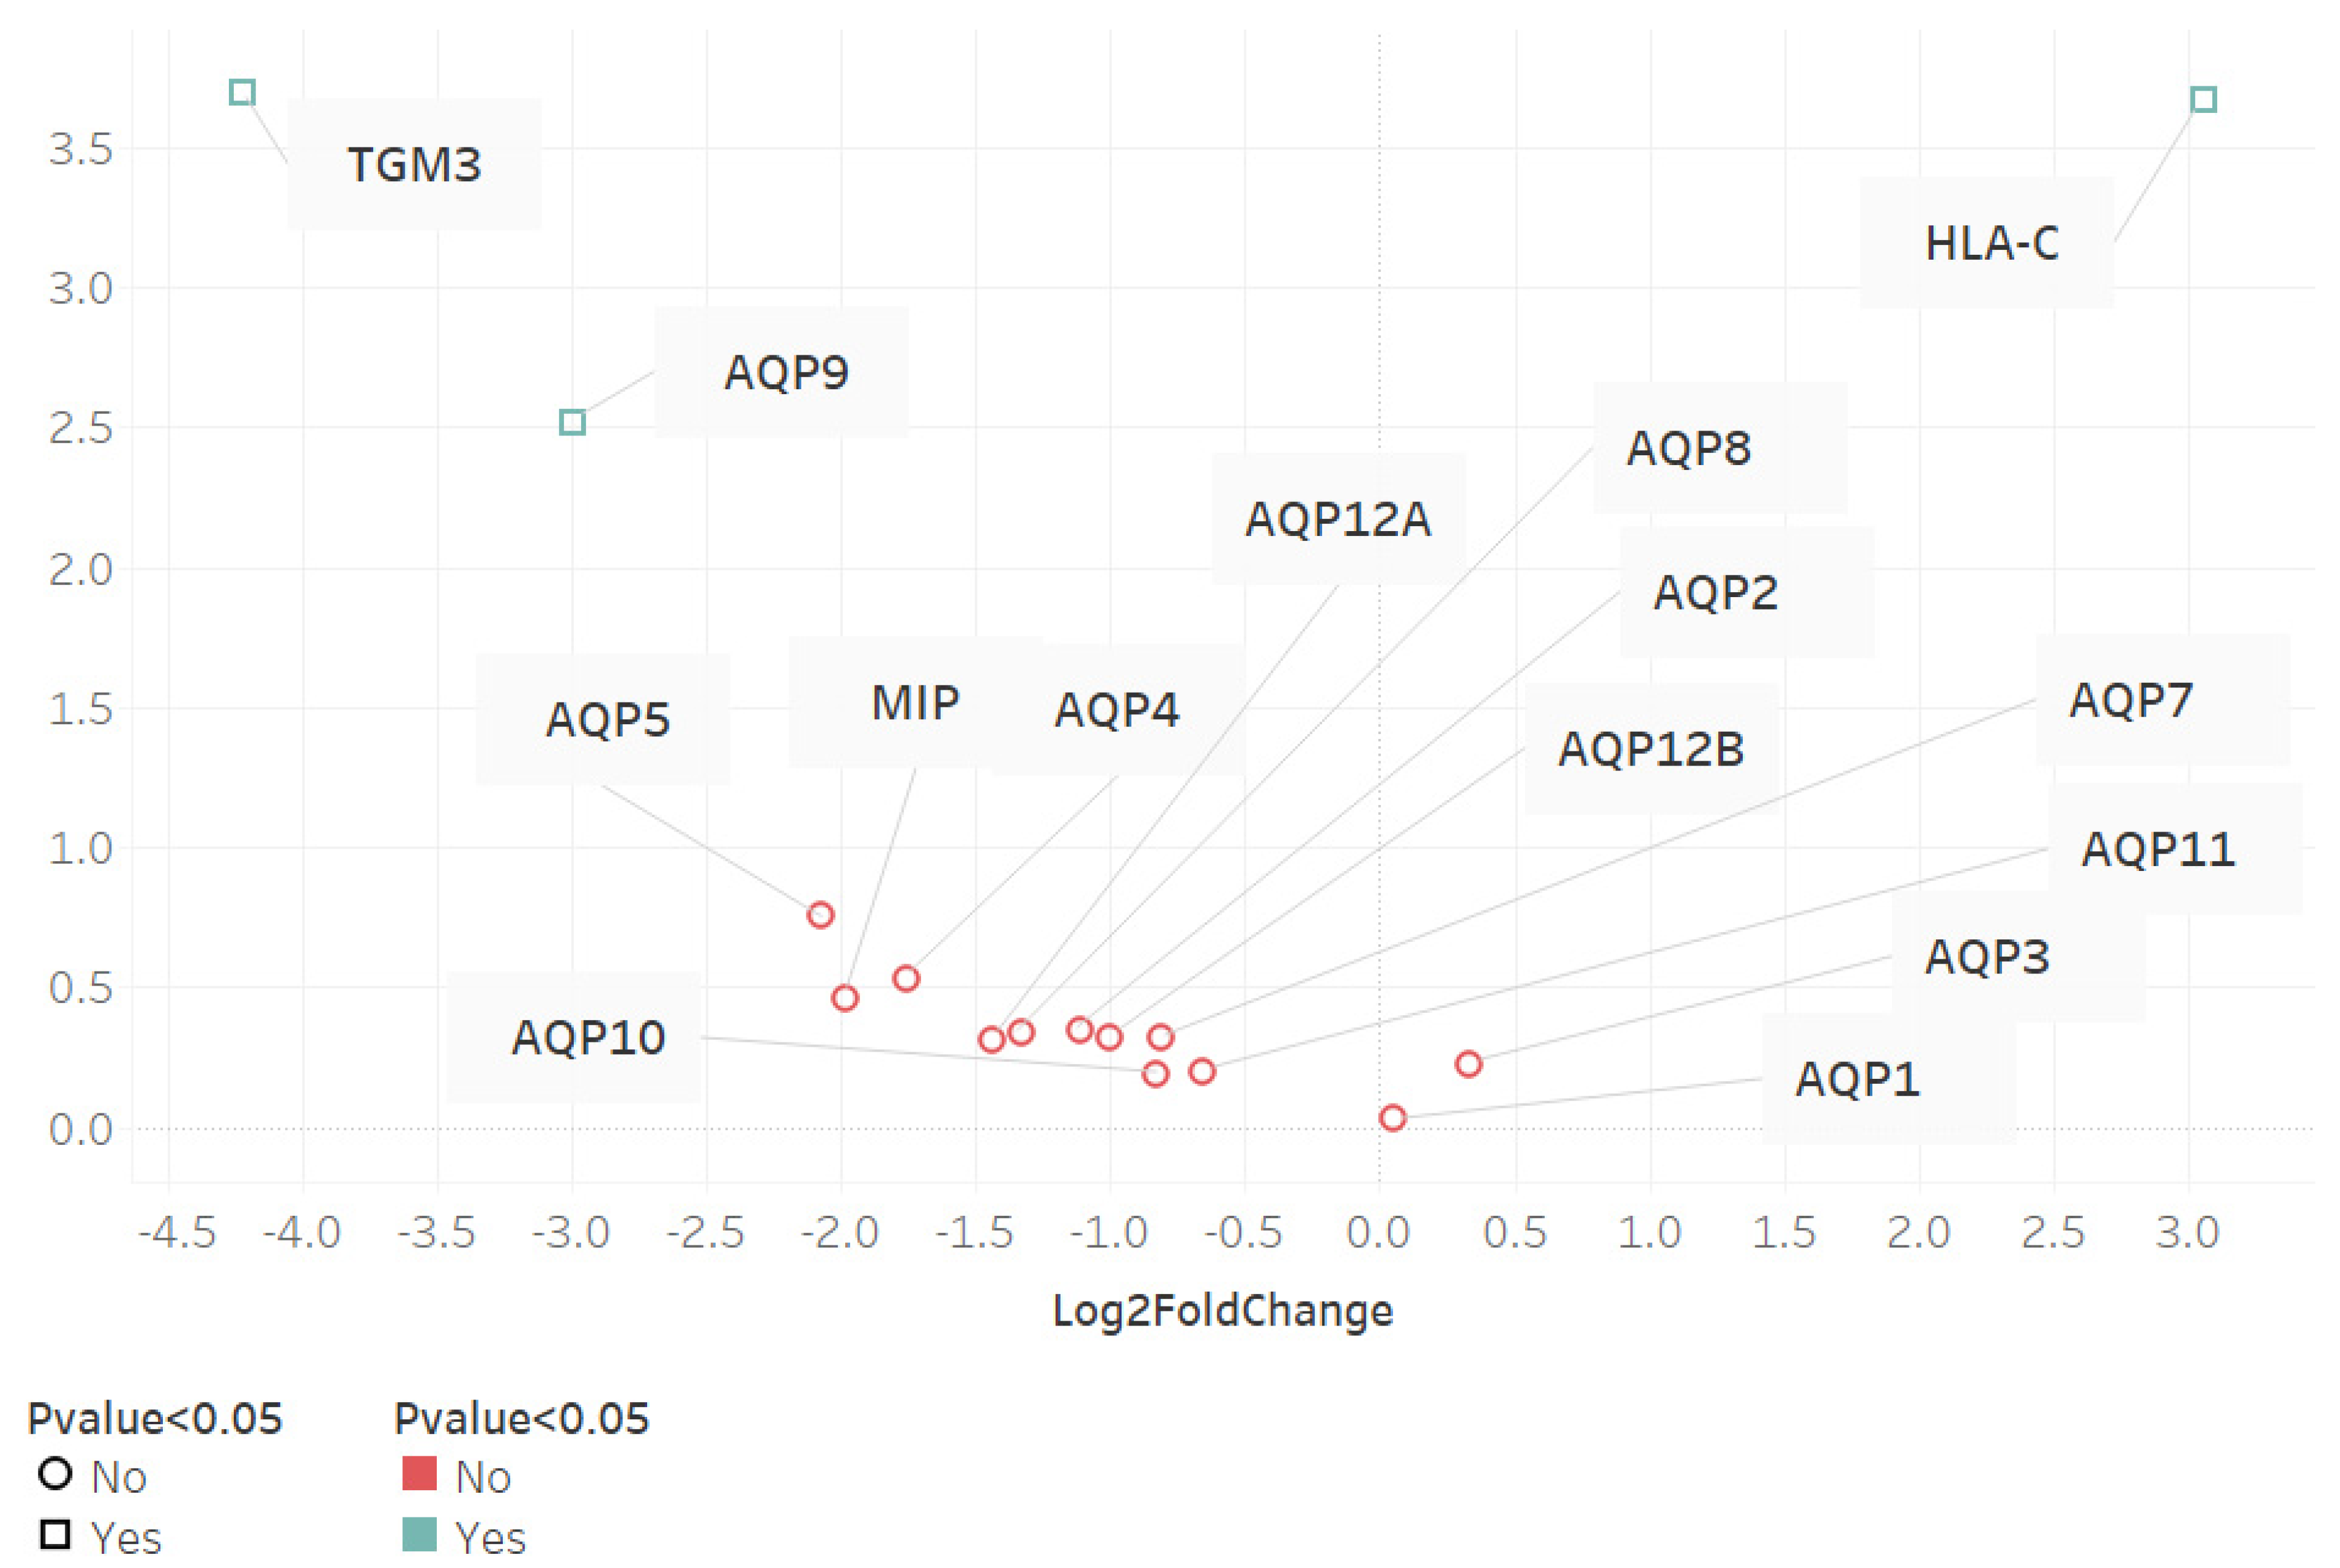
3.2. Volcano Plot of Differential Gene Expression

We have designed the volcano plot with data filters to support decision-making regarding the selection of differentially expressed genes (Figure A1). We represented genes in the volcano plot as square (statistically significant) or circle (statistically insignificant). The shape of the volcano plot was consistent with the source publication (PubMed Central Identifier: PMC8084634) [17]. The differential gene expression patterns for the 14 aquaporin genes and genes for HLA-C (increased expression) and TGM3 (decreased expression) are shown in Figure 2 Aquaporin-3 (AQP3) and Aquaporin-1 (AQP1) are the only aquaporins with a positive fold change differential expression. The Aquaporin-9 gene is the only aquaporin with statistically significant (p < 0.05) decreased expression (negative fold change) in the placenta villi samples from SARS-CoV-2 positive mothers.

3.3. Combination of Gene Expression Box Plots and Data Table of Placenta Samples according to Sex of Infant, SARS-CoV-2 Infection Status, and Severity of SARS-CoV-2 Infection

We obtained the annotations of clinical and biological aspects of placenta samples from the NCBI GEO GSE171995 gene expression series and the PubMed Central PMC8084634 scholarly article. The five placenta samples from mothers with SARS-CoV-2 infection were from two female infants (COVID3 and COVID5) and three male infants (COVID2, COVID4, and COVID6). COVID3 is the only placenta sample with detection of SARS-CoV-2, while COVID6 is the only placenta sample without symptomatic COVID-19. COVID2 and COVID6 are placenta samples from male infants whose mothers had severe COVID-19 based on admission to hospital Intensive Care Unit (ICU) or need for supplemental oxygen. The box plots for the eight placenta samples revealed the distribution patterns of gene expression counts for the 14 aquaporin genes (MIP or AQP0 to AQP12B) (Figure 3). AQP1, AQP3, AQP7, and AQP9 had outlier counts in at least one of the eight placenta samples. AQP7 had outlier counts for Ctrl1, Ctrl3, COVID4, and COVID5 placenta samples. AQP9 had outlier counts for Ctrl2 and COVID3 placenta samples. AQP1 had outlier counts for COVID3, COVID5, and COVID6 placenta samples. AQP3 had outlier counts for COVID5 and COVID6 placenta samples.
Since Lu Calligan et al. [17] detected SARS-CoV-2 by quantitative reverse PCR (qRT-PCR) in only COVID3, we compared the gene expression counts for the two placental samples (COVID3 and COVID5) from female infants (Figure 3 and Figure 4). The gene expression counts for AQP1 and AQP9 in SARS-CoV-2-positive COVID3 were at least two-fold larger than SARS-CoV-2-negative COVID5. The fold values were 2.6 for AQP1 and 9.5 for AQP9. AQP1 had outlier values for COVID3 and COVID5 (Figure 3).

3.4. Data Table of Genes with Gene Expression Values Grouped by Binary Number Patterns

The 15-digit and 3-digit binary number patterns grouped the 35,376 genes in the “gene expression count” dataset to 1470 groups and 8 groups, respectively. The combination of the 15-digit and 3-digit binary number patterns (18-digit binary number patterns) resulted in a dataset of 35,084 genes with gene expression counts for the placenta samples. The 18-digit pattern also grouped the dataset into 2253 groups. A subset of the binary number patterns and associated mRNA abundance values for the aquaporin gene family and other human gene family members revealed that aquaporin genes were grouped according to two types of binary patterns (Figure 4 and Table S8). The aquaporin genes labeled as 000, which had control sample values greater than zero, are AQP1, AQP3, AQP4, AQP5, AQP6, AQP7, AQP9, and AQP11. Additionally, the aquaporin genes labeled as 010, which had the value of control placenta sample Ctrl2 as zero, are MIP, AQP2, AQP8, AQP10, AQP12A, and AQP12B. The gene expression value of AQP9 for the Ctrl2 control sample is 260, which is an outlier value compared to the other aquaporins with values of 0 (MIP, AQP2, AQP8, AQP10, AQP12A, and AQP12B); 1 (AQP4 and AQP5); 3 (AQP6); 6 (AQP1); 10 (AQP7 and AQP11); and 21 (AQP3).
Since placental mRNA expression of two members of the antiviral interferon-induced transmembrane gene family (IFITM) were upregulated in severe COVID-19 disease [52], we included the gene expression patterns and values for comparison to the aquaporin gene family. Inteferon-induced transmembrane protein 1 (IFITM1), IFITM2, and IFITM3 had significantly higher values in placenta villi from severe COVID-19 (13,815 for COVID4) compared to placenta from asymptomatic COVID-19 (1762 for COVID6). We constructed an 18-digit binary number label for each gene by combining the 3-digit and 15-digit. The 14 aquaporin gene transcripts are grouped by 13 binary numbers with AQP6 and AQP7 sharing the same binary pattern (Table 1). In the dataset, AQP9 shares the 18-digit binary number of “000000101000000000” with three genes. The two genes with the HGNC’s official symbol are “peptidase inhibitor 3” (PI3) and “triggering receptor expressed on myeloid cells 1” (TREM1). Our literature search for co-occurrence of AQP9, PI3, and TREM1 retrieved a study where AQP9, PI3, and TREM1 were among the top 10 genes with the greatest significant expression changes in bone marrow hematopoietic stem and progenitor cells (HSPCs) in older adult trauma patients (relative to/vs. age-matched controls) [69].

3.5. Combination of Heatmap and Box Plot of Gene Expression Levels

The heatmap represents normalized values of the gene expression counts as Z-scores. The heatmap of gene groups, galectin (LGALS) and pregnancy-specific glycoprotein (PSG), constructed in this study was similar to the heatmap available in the publication by Zhao et al. [18]. The box plot shows the distribution of the gene expression counts for the placenta samples. The box plot for gene groups constructed in our study can be a representation that is complementary to the heatmap (Figure 5). This finding supports the accuracy of the box plot and heatmap visuals for the placental expression of the aquaporin genes (Figure 6). A finding from both visuals for the aquaporins is that a placenta sample from a healthy control (Ctrl1) has outlier expression levels for AQP2, AQP6, AQP10, AQP12A, and AQP12B. The integration of the box plot and heatmap patterns provides multiple perspectives to help us understand the expression patterns of the members of gene groups/families.

3.6. Biological Networks and Pathways associated with Gene Sets

We compiled the web links of results of biological network and pathway NDex IQqeury searches for gene groups (Tables S9 and S10). The searches were with (1) the 14 gene symbols for the aquaporin gene family; (2) each aquaporin symbol and gene symbols that share the 18-digit binary pattern with an aquaporin; and (3) 301 upregulated and 189 downregulated genes in term placenta samples with maternal SARS-CoV-2 infection. From the searches, we selected 19 for further investigation because of relevance to SARS-CoV-2 infection or placenta (Table S8). Among the results for the 14 gene symbols, AQP7, an aquaglycerporin, was annotated with the placenta-relevant peroxisome proliferator-activated receptors (PPARs) signaling (nuclear hormone receptors that are activated by fatty acids and their derivatives) [70]. Two pathways retrieved involving SARS-CoV-2 for differentially expressed genes are MAPK signaling for upregulated genes (ATF2, BCK2, and IFITM3) and autophagy (ATG16L2). Among genes that share the 18-digit binary pattern for gene expression counts with aquaporins, the following selected retrieved networks or pathways are relevant to SARS-CoV-2 infection or placenta biology.
  • Inflammatory response to SARS-CoV-2 (IFNA8, IFNA13, IFNW1, NOX1, and TLR9)
  • Immune response to SARS-CoV-2 (CSF2, IFNA13, and REN)
  • Linoleic acid metabolism affected by coronavirus infection (ACOT2)
  • Pathogenesis of SARS-CoV-2 mediated by nsp9-nsp10 complex (IGLL1)
  • SARS-CoV-2 host-pathogen interaction (NUP210)
  • Iron metabolism in placenta (HEPHL1)
  • SARS-CoV-2 signaling pathway (HP, ITIH4, and SERPINA10)
  • Microglia pathogen phagocytosis (TREM1)
  • Hematopoietic stem cell differentiation (CSF2)
  • Pregnane X receptor pathway (GSTA2)
  • Prolactin signaling pathway
  • Glycolysis and gluconeogenesis (PGK2)
Since the TREM1 and AQP9 shared the same 18-digit gene expression count pattern (Table 1), we were interested in the differential expression of the 40 human genes involved in the microglia phagocytosis pathway (WikiPathways: WP3937) [71]. Among the 40 human genes in the microglia phagocytosis pathway, 19 were downregulated and 21 upregulated in placenta samples from maternal SARS-CoV-2 infection with five genes (C1QA, C1QB, C1QC, CYBB, and FCER1G), having statistical significance at the 0.05 level (Figure 7). This integration of pathway and differential expression visuals is another resource to aid in the robust investigation of placental gene expression in response to maternal SARS-CoV-2 infection.

3.7. Visual Analytics Resources for Robust Investigations of Placental Gene Expression Data in Response to Maternal SARS-CoV-2 Infection

The integrated dataset (Table S7, Figure A2) combines data fields from the constructed datasets and the dataset on HGNC gene names described in Section 3.1. The Ensembl Gene ID and Gene Symbol are data fields in all the datasets. The datasets and other data fields in the integrated dataset are (1) gene expression counts (Binary Pattern, Placenta Sample ID, and Z-Score); (2) differential gene expression (p value < 0.05 and COVID vs. Control, and Placenta Sample ID); and (3) HGNC gene names (Gene Group, Group ID, and Locus Group). To enable robust data investigations of the dataset, we designed an interactive dashboard that supports the display of gene sets according to data filters with the differential expression as the highest level of grouping (Figure A3). The dashboard supports searches for additional information on scholarly publications and network/pathways associated with the gene of interest. The filters applied in Figure A3 display gene groups for aquaporins and galectins. Another dashboard has the binary pattern for placental gene expression counts as the highest level of grouping (Figure A4). This design allowed us to display the data fields for aquaporin genes, PI3 and TREM1. An 18-digit binary pattern of “000000101000000000” grouped AQP9, PI3, and TREM1 together with AQP9 having a statistically significant downregulation in term placenta villi of maternal SARS-CoV-2 infection. The hyperlinks to scholarly publications and the network/pathway searches are included to facilitate personalized learning of placental biological networks and pathways in health and disease.

4. Discussion

Gene expression profiling studies on placenta cell types are generating new knowledge on cellular and molecular pathways that influence the function, structure, and development of the human placenta in health and disease [2,72,73]. Progress in technologies for profiling genome-wide placental gene expression suitable for knowledge generation from evidence through comparing attributes in datasets from healthy and disease states [74,75]. The visual analytics resources in this report facilitated investigations of datasets on clinical, biological, placental gene expression, and gene nomenclature associated with a study on maternal SARS-CoV-2 infection during pregnancy [17]. Thus, we have designed and implemented visual analytics resources (Figure 2, Figure 3, Figure 4, Figure 5, Figure 6 and Figure 7) comprising visualizations of quantitative data (volcano plot, box plot, heatmap, and data tables) that are relevant to the investigations of gene expression datasets [76]. Similar to previous studies [21,22,23,24], we have applied general-purpose business intelligence/visual analytics software to design and implement interactive visualizations of professionally collected datasets. The integrated dataset with a Z-score for each gene per sample (Table S7 and Figure A2) and select data fields from other constructed datasets is a resource for research on SARS-CoV-2-induced changes to placental gene expression.
In the context of the influence of maternal SARS-CoV-2 infection on placental gene expression (NCBI GEO GSE171995), the visual analytics resources can support the data investigations of 35,084 human genes including 18,882 protein-coding genes and at least 3337 human gene groups. The gene groups were obtained from the HUGO Gene Nomenclature Committee (HGNC) database [68]. The changes in the expression levels of members of human gene families could infer altered signaling pathways relevant to impaired functioning of the human placenta as a direct result of SARS-CoV-2 infection. A secondary data analysis using Z-score normalization and a heatmap visual of GSE171995 gene expression counts identified changes in gene groups of galectins (LGALS), pregnancy-specific glycoproteins (PSGs), and glycosylation pathways during maternal SARS-CoV-2 infection [18]. We used the visuals generated in these two analyses of GSE171995 [17,18] to guide the design of our visualizations and verify the accuracy. The similarity of the volcano plot (Figure A2) and heatmap (Figure 5b) to the visuals produced by Lu-Culligan et al. [17] and Zhao et. al. [18], respectively, provided a basis for robust data investigations of aquaporin genes and other gene groups. The hyperlinks, in the interactive visualizations, to searches for genes in scholarly and network/pathway resources enables access to the latest knowledge regarding the gene(s) of interest.
We have used binary numbers to generate patterns for (1) presence or absence of zero (0) value in the three control samples; and (2) the identification of expression levels of COVID-19 placenta samples that are greater than the control placenta sample (Figure 4). The novel 3-digt and 15-digit binary patterns constructed in this study facilitated the classification of the 35,357 genes in the GSE171995 dataset. The integration of the binary patterns and the gene expression values present an approach to compare values that can prompt gene group-specific analysis (Figure 4). To verify the accuracy and potential biological relevance of the data integration in Figure 4, we included the interferon-induced transmembrane protein (IFITM) gene family, in which some gene members (IFITM1, IFITM2 and IFITM3) [52] encode interferon responsive proteins that inhibit fusion of enveloped viruses with human cell membranes and could also inhibit, with trophoblast, fusion stages in placental development [77]. The 15-digit binary pattern of “000111111111111” was the same for IFITM1, IFITM2, and IFITM3, while IFITM5 and IFITM10 had unique patterns of “011000011000000” and “011010010010010”, respectively. A placenta sample, COVID4, from a mother with severe SARS-CoV-2 infection (Figure 4), had a significantly higher value of 13,815 for IFITM3 compared to 3195 for IFITM2 and 2203 for IFITM1 (Figure 5). Across all the COVID placenta samples, IFITM3 had highest value compared to IFITM1 and IFITM2. This higher gene expression level could be consistent with findings that the IFITM3 protein has the greatest effect on reducing trophoblast fusion [52,78,79].
New knowledge on signaling pathways that control aquaporin activation, gating, and trafficking are needed for developing AQP-targeted therapies as well as research and diagnostic tools [39]. The Aquaporin-9 (AQP9) gene transcript is the only aquaporin gene transcript that was significantly downregulated (p < 0.05) in SARS-CoV-2-infected placenta samples (Figure 2). In the three control samples, AQP9 had gene expression counts above the zero level and labeled with the 3-digit pattern of “000” (Figure 4). Additionally, the 15-digit binary pattern for AQP9 was “000101000000000”, which represents the fact that the COVID3 placenta sample had higher gene expression counts than the Ctrl1 and Ctr3 placenta samples. The 3-digit and 15-digit binary number patterns of AQP9 were shared with two genes: “peptidase inhibitor 3” (PI3) and “triggering receptor expressed on myeloid cells 1” (TREM1). Furthermore, the heatmap visual revealed generally similar patterns with expression in the Ctrl2 placenta sample for the three genes (Figure A4). Coincidentally, AQP9, PI3, and TREM1 are among the top 10 genes with the greatest significant expression changes in bone marrow hematopoietic stem and progenitor cells (HSPCs) in older adult trauma patients (relative to/vs. age-matched controls) [69]. The human placenta is a potent niche for the formation of blood cells and contains HSPCs throughout development [80]. The adult-type definitive erythroid cell (EryD) expresses AQP9 [81]. The PI3 gene is expressed in the human placenta [82] and encodes trappin2/elafin, a key component of the innate immune system, which functions in antimicrobial and anti-inflammatory pathways [83,84].
In a gene expression study of individuals with acute respiratory distress syndrome (ARDS), the PI3 gene was downregulated in the blood of patients with an acute stage of ARDS [83]. Hypoxia or low oxygen availability in cells is a severe, life-threatening manifestation of ARDS caused by severe acute respiratory syndrome coronaviruses [85]. SARS-CoV-2 virus, the causative agent for Coronavirus Disease 2019 (COVID-19), can infect erythroid precursors and progenitors with the consequence of hypoxia to cells and tissues [42]. Hypoxia induced by SARS-CoV-2 may cause the placental pathology of maternal vascular malperfusion (MVM) [86]. Among the term placenta samples from SARS-CoV-2 infected mothers, only COVID4 had MVM with an additional description of intervillous thrombi [17]. In normal pregnancy, at approximately 20 weeks, hemotrophic nutrition is the mode of fetal nutrition, as the source of energy, and is characterized by oxidative phosphorylation [74] and a three-fold increase in intraplacental oxygen tension [87]. Considering that oxygen modulates placenta development [40] and oxygen tension could modulate AQP9 expression in the human placenta [41], there is need for further research on SARS-CoV-2 and other microbial infection-induced changes to the expression of AQP9 in placenta cell types. Additional reasons for further research on AQP9 in placenta structure, function, and development include the role of AQP9 in (1) preterm premature rupture of membrane (PPROM) [88], (2) early-onset pre-eclampsia [89], and (3) recurrent spontaneous abortion [65].
We used NDEx Integrated Query [67] to retrieved biological networks and pathways for genes of interest. Based on a shared binary pattern of gene expression counts for AQP9 and TREM1, we selected the microglia phagocytosis pathway for further investigation by retrieving the differential gene expression data for 40 genes in the pathway (Figure 7). Prins et al. [90] described microglia as the missing link in maternal immune activation and fetal neurodevelopment and speculated that “microglia as possible link in preeclampsia and disturbed neurodevelopment”. We combined the WikiPathways (WP3937) visual and the visual representation of placental differential expression for the 40 genes (Figure 7). The genes for complement proteins (C1QA, C1QB, and C1QC), cytochrome b-245 beta chain (CYBB), and Fc epsilon receptor Ig (FCER1G) were upregulated with statistical significance in the placenta samples of mothers with SARS-CoV-2 infection. TREM1 is an immune receptor on the microglia and a potent amplifier of inflammation [91]. The prolactin signaling pathway (WikiPathways: WP2037) and mammary gland development pathway—pregnancy and lactation (Stage 3 of 4) (WikiPathways WP2817)—were retrieved based on a shared binary pattern of gene expression counts for prolactin (PRL) and aquaporin-12A (AQP12A) (Table 1). The placenta can be seen as a “pharmacological organ” [92] that secretes the prolactin (PRL) growth hormone (GH) family of proteins to support adaptations to maternal physiological processes during pregnancy and lactation [92,93]. The post-natal influences on maternal and child health of the placental hormone warrant visual analytics projects to construct visual representations of differential placental gene expression and integrate them with network/pathway visuals, such as WikiPathways [71]. These integrated visualizations can support hypothesis generation and pharmacological research on hormones unique to pregnancy and lactation. Thus, the placental differential gene expression visual presents a value-added feature to the network/pathway connection visuals retrieved by NDex IQuery.
We have conducted robust data investigations using the published datasets available from scholarly data repositories. Thus, the findings could have limitations associated with the datasets. For example, the gene expression of a placenta sample may be atypical for the category as seen in the COVID2 sample of the GSE171995 dataset [17]. A recent analysis of GSE171995 did not include the COVID2 sample [18]. Thus, to enhance the usefulness of the visual analytics resources presented, we verified the computational patterns with independently published experimental results on placental expression of gene families in response to SARS-CoV-2 infection [18,77]. The overall approach (Figure 1) and the designs of worksheets and dashboards could be useful for similar studies. The constructed datasets, available as comma separated values and spreadsheet files, as well as the visual analytics resources used in this study, are available online (details in Supplementary Materials section). Researchers can use the computational resources to facilitate collaborative and personalized data investigations and learning of human placental gene expression patterns in response to SARS-CoV-2 infection.
The working hypothesis to guide this exploratory study was that visual analytics-facilitated robust data investigations of human placental gene expression data would reveal altered biological processes of human gene groups relevant to pregnancy complications. The visual analytics approach helped connect placental gene expression to placental biological processes involving aquaporins and other gene groups. Future studies with the datasets could consider hypothesis-driven analysis of the datasets and grammar-based approaches to a hypothesis-driven theory of visual analytics [94,95]. We generated volcano plots, box plots, enclosure data tables, and heatmaps to visualize the RNA-Seq gene expression data. Future studies could design other interactive visuals, such as a multidimensional scaling (MDS) plot [15], principal component analysis (PCA) plot [96], and scatter plot [76]), to support further understanding of SARS-CoV-2-induced changes to placenta function, structure, and development.

5. Conclusions

The human placenta is a multiscale complex versatile organ of pregnancy described as a fetal life-support system [97,98]. The computational products reported here are interactive visual analytics resources, which can support interactive robust data investigations of the gene expression patterns of 35,084 human genes, including 18,882 protein coding genes in five placenta samples from mothers with SARS-CoV-2 infection and three placenta samples from mothers without SARS-CoV-2 infection. A focused data investigation of the 13 members of the human aquaporin gene family revealed noteworthy findings on Aquaporin-9, whose placental expression could be modulated by oxygen tension. Thus, future research could consider studies on microbial infection-induced changes to the placental hematopoietic stem and progenitor cells, as well as placental expression of human aquaporin genes, especially AQP9.

Supplementary Materials

The following supporting information can be downloaded at: https://www.mdpi.com/article/10.3390/analytics3010007/s1. The interactive versions of the figures, worksheets, and dashboards are available at https://public.tableau.com/app/profile/qeubic/viz/gse171995_analytics/abstract (accessed on 8 November 2023). The visual analytics file can also be downloaded and used as offline software using the free Tableau Reader: https://www.tableau.com/products/reader/download (accessed on 8 November 2023). Table S1: Description of datasets; Table S2: Differential gene expression dataset; Table S3: Gene Expression counts (wide format) dataset; Table S4: Gene expression counts (long format); Table S5: Gene expression scores dataset (wide format); Table S6: Gene expression scores (long format); Table S7: Integrated dataset of placental gene expression in response to maternal SARS-CoV-2 infection; Table S8: Gene expression counts and binary patterns for aquaporin and selected genes; Table S9: NDex IQuery network search; Table S10: Website Links to selected pathway diagrams.

Author Contributions

Conceptualization, R.D.I., A.O.A., M.O.J., A.U.M., S.R.-B. and A.G.H.II; methodology, R.D.I., A.O.A., R.S.H., J.C.F., A.L.H., A.M.D., K.B.E., T.L.T., S.F.B., M.O.J., O.S., S.R.-B., A.U.M. and A.G.H.II; data curation, R.D.I., A.O.A., R.S.H., J.C.F., A.L.H., A.M.D. and K.B.E.; writing—original draft preparation, R.D.I., A.O.A., R.S.H., J.C.F. and K.B.E.; writing—review and editing, R.D.I., A.O.A., R.S.H., J.C.F., A.L.H., A.M.D., K.B.E., T.L.T., S.F.B., M.O.J., O.S., S.R.-B., A.U.M. and A.G.H.II; visualization, R.D.I., A.L.H. and K.B.E.; supervision, R.D.I., M.O.J., S.R.-B. and A.G.H.II; project administration, R.D.I., S.F.B., O.S., A.U.M., S.R.-B. and A.G.H.II; funding acquisition, R.D.I., M.O.J., S.F.B., A.U.M., S.R.-B. and A.G.H.II. All authors have read and agreed to the published version of the manuscript.

Funding

This research was funded by (1) United States Department of Education, grant award P031B170091; (1) National Institutes of Health, grant award U41HG006941; (2) National Science Foundation, grant awards EHR-1435186, EHR-1623371, EHR-1626602, EHR-2029363, CSE-1829717, DUE-2142465, and EES-2241376.

Institutional Review Board Statement

Not applicable.

Informed Consent Statement

Not applicable.

Data Availability Statement

The data availability for data sources and constructed datasets are itemized below. Last date of access was 28 October 2023. Integrated datasets and visual analytics files: https://github.com/qeubic/gse171995_analytics. The gene expression data sources for differential gene expression and gene expression counts: https://www.ncbi.nlm.nih.gov/geo/query/acc.cgi?acc=GSE171995. Data source for clinical features of placenta samples: https://www.ncbi.nlm.nih.gov/pmc/articles/PMC8084634/. Data source of human gene nomenclature: https://www.genenames.org/download/statistics-and-files/.

Acknowledgments

Transdisciplinary Data Scholars Development Program at Bethune-Cookman University and the Train-the-Trainer Project of the H3Africa Bioinformatics Network.

Conflicts of Interest

The authors declare no conflicts of interest. The funders had no role in the design of the study; in the collection, analyses, or interpretation of data; in the writing of the manuscript; or in the decision to publish the results.

Appendix A

This appendix section provides three additional screenshots of visual analytics (Figure A1, Figure A3 and Figure A4) and spreadsheet (Figure A2) resources for robust investigation of the gene expression patterns of members of gene families (Figure A1, Figure A2, Figure A3 and Figure A4). These computational resources can support the performance of tasks along the dimensions of data challenges: data flow (i.e., collection, storage, access, and movement); data analytics (i.e., modeling and simulation, statistical analysis, and visual analytics); and data curation (i.e., preservation, publication, security, description, and cleaning) [20,21].
Figure A1. A design of an interactive volcano plot of differential gene expression by RNA-Sequencing between placenta villous samples from SARS-CoV-2 positive and SARS-CoV-2 negative mothers. This worksheet view can be a component of an interactive dashboard. The genes represented with squares have significant differential expression at p < 0.05. The labels are examples of genes with increased and decreased expression levels in SARS-CoV2 placenta tissue. Gene symbol and names are as follows. AQP9: aquaporin-9; HLA-C: major histocompatibility complex, class I, C; HSPA1A: heat shock protein family A (Hsp70) member 1A; PPP1R11: protein phosphatase 1 regulatory inhibitor subunit 11; TGM3: transglutaminase 3. The accuracy of the volcano plot was determined by comparison with the static volcano plot in the publication with PubMed Central Identifier of PMC8084634 [17]. The differential expression of HSPA1A position is similar to the plot in Lu Calligan and co-authors [17]. In this figure, we provide two additional examples of genes with significant increased expression levels (HLA-C and PPP1R11) and two genes with significant decreased expression levels (AQP9 and TGM3). The dataset for the volcano plot is available at https://www.ncbi.nlm.nih.gov/geo/query/acc.cgi?acc=GSE171995 (accessed on 28 October 2023).
Analytics 03 00007 g0a1
Figure A2. A screenshot of a spreadsheet section of the integrated dataset of placenta gene expression in response to maternal SARS-CoV-2 infection. The integrated dataset was constructed from data fields in datasets on differential gene expression, gene expression counts, and human gene nomenclature [17,68]. The Ensembl Gene ID and Gene Symbol are data fields in all the datasets. The datasets and other data fields in the integrated dataset are (1) gene expression counts (Binary Pattern, Placenta Sample ID, and Z-Score); (2) differential gene expression (p value < 0.05 and COVID vs. Control, and Placenta Sample ID); and (3) HGNC gene names (Gene Group, Group ID, and Locus Group). The dataset is available as a spreadsheet file (Table S7). The spreadsheet worksheet has data filters for each column to allow for interaction.
Analytics 03 00007 g0a2
Figure A3. A screenshot of the interactive dashboard for interacting with the integrated dataset of differential expression, gene expression counts, and human gene nomenclature for response to maternal SARS-CoV-2 infection. The display is for gene groups of aquaporins, aquaporins|blood group antigens, galectins, and receptor ligand|galectins. The insert image is for website links to scholarly publications relevant to placenta and network/pathways for a gene (LGALS9 in this example). The dataset for the heatmap: https://www.ncbi.nlm.nih.gov/geo/query/acc.cgi?acc=GSE171995 (accessed on 28 October 2023).
Analytics 03 00007 g0a3
Figure A4. A screenshot of the interactive dashboard that groups genes by binary patterns of RNA-Seq gene expression counts from placenta samples from mothers with and without SARS-CoV-2 infection. The design allows for website link actions to display additional knowledge on a selected gene. The selected gene in this case is AQP9, which shares the 18-digit binary pattern with PI3 and TREM1.
Analytics 03 00007 g0a4

References

  1. Griffiths, S.K.; Campbell, J.P. Placental structure, function and drug transfer. Contin. Educ. Anaesth. Crit. Care Pain 2015, 15, 84–89. [Google Scholar] [CrossRef]
  2. Guttmacher, A.E.; Maddox, Y.T.; Spong, C.Y. The Human Placenta Project: Placental structure, development, and function in real time. Placenta 2014, 35, 303–304. [Google Scholar] [CrossRef]
  3. Ortega, M.A.; Fraile-Martínez, O.; García-Montero, C.; Sáez, M.A.; Álvarez-Mon, M.A.; Torres-Carranza, D.; Álvarez-Mon, M.; Bujan, J.; García-Honduvilla, N.; Bravo, C. The pivotal role of the placenta in normal and pathological pregnancies: A focus on preeclampsia, fetal growth restriction, and maternal chronic venous disease. Cells 2022, 11, 568. [Google Scholar] [CrossRef] [PubMed]
  4. Mate, A.; Reyes-Goya, C.; Santana-Garrido, Á.; Sobrevia, L.; Vázquez, C.M. Impact of maternal nutrition in viral infections during pregnancy. Biochim. Biophys. Acta Mol. Basis Dis. 2021, 1867, 166231. [Google Scholar] [CrossRef] [PubMed]
  5. Yu, W.; Hu, X.; Cao, B. Viral infections during pregnancy: The big challenge threatening maternal and fetal health. Matern. Fetal Med. 2022, 4, 72–86. [Google Scholar] [CrossRef]
  6. Yang, Y.; Guo, F.; Peng, Y.; Chen, R.; Zhou, W.; Wang, H.; OuYang, J.; Yu, B.; Xu, Z. Transcriptomic profiling of human placenta in gestational diabetes mellitus at the single-cell level. Front. Endocrinol. 2021, 12, 679582. [Google Scholar] [CrossRef]
  7. Sood, R.; Zehnder, J.L.; Druzin, M.L.; Brown, P.O. Gene expression patterns in human placenta. Proc. Natl. Acad. Sci. USA 2006, 103, 5478–5483. [Google Scholar] [CrossRef]
  8. Saben, J.; Zhong, Y.; McKelvey, S.; Dajani, N.K.; Andres, A.; Badger, T.M.; Gomez-Acevedo, H.; Shankar, K. A comprehensive analysis of the human placenta transcriptome. Placenta 2014, 35, 125–131. [Google Scholar] [CrossRef]
  9. Gheorghe, C.P.; Goyal, R.; Mittal, A.; Longo, L.D. Gene expression in the placenta: Maternal stress and epigenetic responses. Int. J. Dev. Biol. 2010, 54, 507. [Google Scholar] [CrossRef]
  10. Martinez, V.D.; Cohn, D.E.; Telkar, N.; Minatel, B.C.; Pewarchuk, M.E.; Marshall, E.A.; Price, E.M.; Robinson, W.P.; Lam, W.L. Profiling the small non-coding RNA transcriptome of the human placenta. Sci. Data 2021, 8, 166. [Google Scholar] [CrossRef]
  11. Gray, K.A.; Seal, R.L.; Tweedie, S.; Wright, M.W.; Bruford, E.A. A review of the new HGNC gene family resource. Hum. Genom. 2016, 10, 6. [Google Scholar] [CrossRef]
  12. Cox, B.; Leavey, K.; Nosi, U.; Wong, F.; Kingdom, J. Placental transcriptome in development and pathology: Expression, function, and methods of analysis. Am. J. Obstet. Gynecol. 2015, 213, S138–S151. [Google Scholar] [CrossRef]
  13. Ilieva, M.; Tschaikowski, M.; Vandin, A.; Uchida, S. The current status of gene expression profilings in COVID-19 patients. Clin. Transl. Discov. 2022, 2, e104. [Google Scholar] [CrossRef]
  14. Sacha, D.; Stoffel, A.; Stoffel, F.; Kwon, B.C.; Ellis, G.; Keim, D.A. Knowledge generation model for visual analytics. IEEE Trans. Vis. Comput. Graph. 2014, 20, 1604–1613. [Google Scholar] [CrossRef]
  15. Rutter, L.; Moran Lauter, A.N.; Graham, M.A.; Cook, D. Visualization methods for differential expression analysis. BMC Bioinform. 2019, 20, 458. [Google Scholar] [CrossRef]
  16. Ludt, A.; Ustjanzew, A.; Binder, H.; Strauch, K.; Marini, F. Interactive and reproducible workflows for exploring and modeling RNA-seq data with pcaExplorer, Ideal, and GeneTonic. Curr. Protoc. 2022, 2, e411. [Google Scholar] [CrossRef]
  17. Lu-Culligan, A.; Chavan, A.R.; Vijayakumar, P.; Irshaid, L.; Courchaine, E.M.; Milano, K.M.; Tang, Z.; Pope, S.D.; Song, E.; Vogels, C.B. Maternal respiratory SARS-CoV-2 infection in pregnancy is associated with a robust inflammatory response at the maternal-fetal interface. Med 2021, 2, 591–610.e510. [Google Scholar] [CrossRef]
  18. Zhao, F.; Tallarek, A.-C.; Wang, Y.; Xie, Y.; Diemert, A.; Lu-Culligan, A.; Vijayakumar, P.; Kittmann, E.; Urbschat, C.; Bayo, J. A unique maternal and placental galectin signature upon SARS-CoV-2 infection suggests galectin-1 as a key alarmin at the maternal–fetal interface. Front. Immunol. 2023, 14, 1196395. [Google Scholar] [CrossRef]
  19. Casula, M.; Rangarajan, N.; Shields, P. The potential of working hypotheses for deductive exploratory research. Qual. Quant. 2021, 55, 1703–1725. [Google Scholar] [CrossRef]
  20. Ahalt, S.; Bedard, D.; Carsey, T.; Crabtree, J.; Green, K.; Jeffries, C.; Knowles, D.; Kum, H.; Lander, H.; Nassar, N. Establishing a National Consortium for Data Science; Renaissance Computing Institute, University of North Carolina at Chapel Hill: Chapel Hill, NC, USA, 2012. [Google Scholar]
  21. Isokpehi, R.D.; Johnson, M.O.; Campos, B.; Sanders, A.; Cozart, T.; Harvey, I.S. Knowledge visualizations to inform decision making for improving food accessibility and reducing obesity rates in the United States. Int. J. Environ. Res. Public Health 2020, 17, 1263. [Google Scholar] [CrossRef]
  22. Isokpehi, R.D.; Johnson, C.P.; Tucker, A.N.; Gautam, A.; Brooks, T.J.; Johnson, M.O.; Cozart, T.; Wathington, D.J. Integrating datasets on public health and clinical aspects of sickle cell disease for effective community-based research and practice. Diseases 2020, 8, 39. [Google Scholar] [CrossRef]
  23. Isokpehi, R.D.; Simmons, S.S.; Johnson, M.O.; Payton, M. Genomic evidence for bacterial determinants influencing obesity development. Int. J. Environ. Res. Public Health 2017, 14, 345. [Google Scholar] [CrossRef]
  24. Isokpehi, R.D.; Valero, K.C.W.; Graham, B.E.; Pacurari, M.; Sims, J.N.; Udensi, U.K.; Ndebele, K. Secondary data analytics of aquaporin expression levels in glioblastoma stem-like cells. Cancer Inform. 2015, 14, 95–103. [Google Scholar] [CrossRef]
  25. Makolo, A.U.; Smile, O.; Ezekiel, K.B.; Destefano, A.M.; McCall, J.L.; Isokpehi, R.D. Leveraging H3Africa scholarly publications for technology-enhanced personalized bioinformatics education. Educ. Sci. 2022, 12, 859. [Google Scholar] [CrossRef]
  26. Sedig, K.; Parsons, P. Interaction design for complex cognitive activities with visual representations: A pattern-based approach. AIS Trans. Hum. Comput. Interact. 2013, 5, 84–133. [Google Scholar] [CrossRef]
  27. King, L.S.; Agre, P. Pathophysiology of the aquaporin water channels. Annu. Rev. Physiol. 1996, 58, 619–648. [Google Scholar] [CrossRef] [PubMed]
  28. Isokpehi, R.D.; Rajnarayanan, R.V.; Jeffries, C.D.; Oyeleye, T.O.; Cohly, H.H. Integrative sequence and tissue expression profiling of chicken and mammalian aquaporins. BMC Genom. 2009, 10, S7. [Google Scholar] [CrossRef] [PubMed]
  29. Day, R.E.; Kitchen, P.; Owen, D.S.; Bland, C.; Marshall, L.; Conner, A.C.; Bill, R.M.; Conner, M.T. Human aquaporins: Regulators of transcellular water flow. Biochim. Biophys. Acta Gen. Subj. 2014, 1840, 1492–1506. [Google Scholar] [CrossRef] [PubMed]
  30. Sha, X.-y.; Xiong, Z.-f.; Liu, H.-s.; Di, X.-d.; Ma, T.-h. Maternal-fetal fluid balance and aquaporins: From molecule to physiology. Acta Pharmacol. Sin. 2011, 32, 716–720. [Google Scholar] [CrossRef] [PubMed]
  31. Guo, J.; He, H.; Liu, H.; Liu, Q.; Zhang, L.; Liu, B.; Sugimoto, K.; Wu, Q. Aquaporin-1, a new maternally expressed gene, regulates placental development in the mouse. Biol. Reprod. 2016, 95, 41–49. [Google Scholar] [CrossRef] [PubMed]
  32. Alejandra, R.; Natalia, S. The blocking of aquaporin-3 (AQP3) impairs extravillous trophoblast cell migration. Biochem. Biophys. Res. Commun. 2018, 499, 227–232. [Google Scholar] [CrossRef]
  33. Liu, H.; Wintour, E.M. Aquaporins in development—A review. Reprod. Biol. Endocrinol. 2005, 3, 18. [Google Scholar] [CrossRef] [PubMed]
  34. Hua, Y.; Jiang, W.; Zhang, W.; Shen, Q.; Chen, M.; Zhu, X. Expression and significance of aquaporins during pregnancy. Front. Biosci.-Landmark 2013, 18, 1373–1383. [Google Scholar]
  35. Szpilbarg, N.; Castro-Parodi, M.; Reppetti, J.; Repetto, M.; Maskin, B.; Martinez, N.; Damiano, A.E. Placental programmed cell death: Insights into the role of aquaporins. Mol. Hum. Reprod. 2016, 22, 46–56. [Google Scholar] [CrossRef]
  36. Galán-Cobo, A.; Ramírez-Lorca, R.; Echevarría, M. Role of aquaporins in cell proliferation: What else beyond water permeability? Channels 2016, 10, 185–201. [Google Scholar] [CrossRef]
  37. Ishibashi, K.; Tanaka, Y.; Morishita, Y. The role of mammalian superaquaporins inside the cell: An update. Biochim. Biophys. Acta 2021, 1863, 183617. [Google Scholar] [CrossRef] [PubMed]
  38. Calamita, G.; Delporte, C. Involvement of aquaglyceroporins in energy metabolism in health and disease. Biochimie 2021, 188, 20–34. [Google Scholar] [CrossRef]
  39. Wagner, K.; Unger, L.; Salman, M.M.; Kitchen, P.; Bill, R.M.; Yool, A.J. Signaling mechanisms and pharmacological modulators governing diverse aquaporin functions in human health and disease. Int. J. Mol. Sci. 2022, 23, 1388. [Google Scholar] [CrossRef]
  40. Burton, G.J.; Cindrova-Davies, T.; wa Yung, H.; Jauniaux, E. Hypoxia and reproductive health: Oxygen and development of the human placenta. Reproduction 2021, 161, F53–F65. [Google Scholar] [CrossRef]
  41. Castro-Parodi, M.; Szpilbarg, N.; Dietrich, V.; Sordelli, M.; Reca, A.; Abán, C.; Maskin, B.; Farina, M.; Damiano, A.E. Oxygen tension modulates AQP9 expression in human placenta. Placenta 2013, 34, 690–698. [Google Scholar] [CrossRef]
  42. Elahi, S. Hematopoietic responses to SARS-CoV-2 infection. Cell. Mol. Life Sci. 2022, 79, 187. [Google Scholar] [CrossRef]
  43. Sayers, E.W.; Beck, J.; Bolton, E.E.; Bourexis, D.; Brister, J.R.; Canese, K.; Comeau, D.C.; Funk, K.; Kim, S.; Klimke, W. Database resources of the national center for biotechnology information. Nucleic Acids Res. 2021, 49, D10. [Google Scholar] [CrossRef]
  44. Tweedie, S.; Braschi, B.; Gray, K.; Jones, T.E.; Seal, R.L.; Yates, B.; Bruford, E.A. Genenames.org: The HGNC and VGNC resources in 2021. Nucleic Acids Res. 2021, 49, D939–D946. [Google Scholar] [CrossRef] [PubMed]
  45. Cunningham, F.; Allen, J.E.; Allen, J.; Alvarez-Jarreta, J.; Amode, M.R.; Armean, I.M.; Austine-Orimoloye, O.; Azov, A.G.; Barnes, I.; Bennett, R. Ensembl 2022. Nucleic Acids Res. 2022, 50, D988–D995. [Google Scholar] [CrossRef] [PubMed]
  46. Glusman, G.; Caballero, J.; Robinson, M.; Kutlu, B.; Hood, L. Optimal scaling of digital transcriptomes. PLoS ONE 2013, 8, e77885. [Google Scholar] [CrossRef] [PubMed]
  47. Jiang, R.; Sun, T.; Song, D.; Li, J.J. Statistics or biology: The zero-inflation controversy about scRNA-seq data. Genome Biol. 2022, 23, 31. [Google Scholar] [CrossRef] [PubMed]
  48. Beard, L.; Aghassibake, N. Tableau (version 2020.3). J. Med. Libr. Assoc. JMLA 2021, 109, 159. [Google Scholar] [CrossRef]
  49. Silverman, J.D.; Roche, K.; Mukherjee, S.; David, L.A. Naught all zeros in sequence count data are the same. Comput. Struct. Biotechnol. J. 2020, 18, 2789–2798. [Google Scholar] [CrossRef] [PubMed]
  50. Bailer, A.J. Combining, Extracting, and Reshaping Data. In Statistical Programming in SAS; Chapman and Hall/CRC: Boca Raton, FL, USA, 2020; pp. 137–190. [Google Scholar]
  51. Niglas, K. Media Review: Microsoft Office Excel Spreadsheet Software. J. Mix. Methods Res. 2007, 1, 297–299. [Google Scholar] [CrossRef]
  52. Mourad, M.; Jacob, T.; Sadovsky, E.; Bejerano, S.; Simone, G.S.-D.; Bagalkot, T.R.; Zucker, J.; Yin, M.T.; Chang, J.Y.; Liu, L. Placental response to maternal SARS-CoV-2 infection. Sci. Rep. 2021, 11, 14390. [Google Scholar] [CrossRef]
  53. Curtis, A.E.; Smith, T.A.; Ziganshin, B.A.; Elefteriades, J.A. The mystery of the Z-score. Aorta 2016, 4, 124–130. [Google Scholar] [CrossRef] [PubMed]
  54. Clarkson-Townsend, D.A.; Kennedy, E.; Everson, T.M.; Deyssenroth, M.A.; Burt, A.A.; Hao, K.; Chen, J.; Pardue, M.T.; Marsit, C.J. Seasonally variant gene expression in full-term human placenta. FASEB J. 2020, 34, 10431–10442. [Google Scholar] [CrossRef] [PubMed]
  55. Barrett, T.; Wilhite, S.E.; Ledoux, P.; Evangelista, C.; Kim, I.F.; Tomashevsky, M.; Marshall, K.A.; Phillippy, K.H.; Sherman, P.M.; Holko, M. NCBI GEO: Archive for functional genomics data sets—Update. Nucleic Acids Res. 2012, 41, D991–D995. [Google Scholar] [CrossRef] [PubMed]
  56. Pfannkuch, M. Year 11 students’ informal inferential reasoning: A case study about the interpretation of box plots. Int. Electron. J. Math. Educ. 2007, 2, 149–167. [Google Scholar] [CrossRef] [PubMed]
  57. Carter, M.G. A picture is worth a thousand words: A cross-curricular approach to learning about visuals in STEM. Int. J. Eng. Edu. 2013, 29, 822–828. [Google Scholar]
  58. Nuzzo, A.; Carapezza, G.; Di Bella, S.; Pulvirenti, A.; Isacchi, A.; Bosotti, R. KAOS: A new automated computational method for the identification of overexpressed genes. BMC Bioinform. 2016, 17, 5–14. [Google Scholar] [CrossRef] [PubMed]
  59. Krzywinski, M.; Altman, N. Visualizing samples with box plots: Use box plots to illustrate the spread and differences of samples. Nat. Methods 2014, 11, 119–121. [Google Scholar] [CrossRef]
  60. Parsons, P.; Sedig, K. Common visualizations: Their cognitive utility. In Handbook of Human Centric Visualization; Springer: Berlin/Heidelberg, Germany, 2014; pp. 671–691. [Google Scholar]
  61. Simmons, S.S.; Isokpehi, R.D.; Brown, S.D.; McAllister, D.L.; Hall, C.C.; McDuffy, W.M.; Medley, T.L.; Udensi, U.K.; Rajnarayanan, R.V.; Ayensu, W.K. Functional annotation analytics of Rhodopseudomonas palustris genomes. Bioinform. Biol. Insights 2011, 5, 115–129. [Google Scholar] [CrossRef]
  62. Isokpehi, R.D.; Udensi, U.K.; Simmons, S.S.; Hollman, A.L.; Cain, A.E.; Olofinsae, S.A.; Hassan, O.A.; Kashim, Z.A.; Enejoh, O.A.; Fasesan, D.E. Evaluative profiling of arsenic sensing and regulatory systems in the human microbiome project genomes. Microbiol. Insights 2014, 7, MBI. S18076. [Google Scholar] [CrossRef]
  63. Fadiel, A.; Isokpehi, R.D.; Stambouli, N.; Hamza, A.; Benammar-Elgaaied, A.; Scalise, T.J. Protozoan parasite aquaporins. Expert Rev. Proteom. 2009, 6, 199–211. [Google Scholar] [CrossRef]
  64. Damiano, A.E. Aquaporins during pregnancy. In Vitamins and Hormones; Elsevier: Amsterdam, The Netherlands, 2020; Volume 112, pp. 327–355. [Google Scholar]
  65. Ma, N.; Liu, B.; Jin, Y.; Wang, J.; Qin, W.; Zheng, F.; Qin, R.; Li, J.; Hang, F.; Qin, A. AQP9 causes recurrent spontaneous abortion by inhibiting trophoblast cell EMT and invasion through the PI3K/AKT pathway. Biol. Reprod. 2023, 109, 736–748. [Google Scholar] [CrossRef]
  66. Sun, Y.V. Integration of biological networks and pathways with genetic association studies. Hum. Genet. 2012, 131, 1677–1686. [Google Scholar] [CrossRef]
  67. Pillich, R.T.; Chen, J.; Churas, C.; Fong, D.; Gyori, B.M.; Ideker, T.; Karis, K.; Liu, S.N.; Ono, K.; Pico, A. NDEx IQuery: A multi-method network gene set analysis leveraging the Network Data Exchange. Bioinformatics 2023, 39, btad118. [Google Scholar] [CrossRef]
  68. Seal, R.L.; Braschi, B.; Gray, K.; Jones, T.E.; Tweedie, S.; Haim-Vilmovsky, L.; Bruford, E.A. Genenames.org: The HGNC resources in 2023. Nucleic Acids Res. 2023, 51, D1003–D1009. [Google Scholar] [CrossRef]
  69. Darden, D.B.; Stortz, J.A.; Hollen, M.K.; Cox, M.C.; Apple, C.G.; Hawkins, R.B.; Rincon, J.C.; Lopez, M.-C.; Wang, Z.; Navarro, E.; et al. Identification of unique mRNA and miRNA expression patterns in bone marrow hematopoietic stem and progenitor cells after trauma in older adults. Front. Immunol. 2020, 11, 1289. [Google Scholar] [CrossRef]
  70. Matsuda, S.; Kobayashi, M.; Kitagishi, Y. Expression and function of PPARs in placenta. PPAR Res. 2013, 2013, 256508. [Google Scholar] [CrossRef]
  71. Martens, M.; Ammar, A.; Riutta, A.; Waagmeester, A.; Slenter, D.N.; Hanspers, K.; Miller, R.; Digles, D.; Lopes, E.N.; Ehrhart, F.; et al. WikiPathways: Connecting communities. Nucleic Acids Res. 2021, 49, D613–D621. [Google Scholar] [CrossRef]
  72. Herrera, C.L.; Kim, M.J.; Do, Q.N.; Owen, D.M.; Fei, B.; Madhuranthakam, A.J.; Xi, Y.; Lewis, M.A.; Twickler, D.M.; Spong, C.Y. The Human Placenta Project: Funded projects, imaging innovation, and persistent gaps. Am. J. Obstet. Gynecol. 2022, 226, S233–S234. [Google Scholar] [CrossRef]
  73. Herrera, C.L.; Kim, M.J.; Do, Q.N.; Owen, D.M.; Fei, B.; Twickler, D.M.; Spong, C.Y. The human placenta project: Funded studies, imaging technologies, and future directions. Placenta 2023, 142, 27–35. [Google Scholar] [CrossRef] [PubMed]
  74. O’Brien, K.; Wang, Y. The Placenta: A Maternofetal Interface. Annu. Rev. Nutr. 2023, 43, 301–325. [Google Scholar] [CrossRef] [PubMed]
  75. Yong, H.E.; Chan, S.-Y. Current approaches and developments in transcript profiling of the human placenta. Hum. Reprod. Update 2020, 26, 799–840. [Google Scholar] [CrossRef]
  76. McDermaid, A.; Monier, B.; Zhao, J.; Liu, B.; Ma, Q. Interpretation of differential gene expression results of RNA-seq data: Review and integration. Brief. Bioinform. 2019, 20, 2044–2054. [Google Scholar] [CrossRef]
  77. Buchrieser, J.; Schwartz, O. Pregnancy complications and Interferon-induced transmembrane proteins (IFITM): Balancing antiviral immunity and placental development. Comptes Rendus Biol. 2021, 344, 145–156. [Google Scholar] [CrossRef]
  78. Buchrieser, J.; Degrelle, S.A.; Couderc, T.; Nevers, Q.; Disson, O.; Manet, C.; Donahue, D.A.; Porrot, F.; Hillion, K.-H.; Perthame, E. IFITM proteins inhibit placental syncytiotrophoblast formation and promote fetal demise. Science 2019, 365, 176–180. [Google Scholar] [CrossRef]
  79. Zani, A.; Zhang, L.; McMichael, T.M.; Kenney, A.D.; Chemudupati, M.; Kwiek, J.J.; Liu, S.-L.; Yount, J.S. Interferon-induced transmembrane proteins inhibit cell fusion mediated by trophoblast syncytins. J. Biol. Chem. 2019, 294, 19844–19851. [Google Scholar] [CrossRef]
  80. Robin, C.; Bollerot, K.; Mendes, S.; Haak, E.; Crisan, M.; Cerisoli, F.; Lauw, I.; Kaimakis, P.; Jorna, R.; Vermeulen, M. Human placenta is a potent hematopoietic niche containing hematopoietic stem and progenitor cells throughout development. Cell Stem Cell 2009, 5, 385–395. [Google Scholar] [CrossRef]
  81. Fraser, S.T. The modern primitives: Applying new technological approaches to explore the biology of the earliest red blood cells. Int. Sch. Res. Not. 2013, 568928. [Google Scholar] [CrossRef] [PubMed]
  82. King, A.; Paltoo, A.; Kelly, R.; Sallenave, J.-M.; Bocking, A.; Challis, J. Expression of natural antimicrobials by human placenta and fetal membranes. Placenta 2007, 28, 161–169. [Google Scholar] [CrossRef] [PubMed]
  83. Wang, Z.; Beach, D.; Su, L.; Zhai, R.; Christiani, D.C. A genome-wide expression analysis in blood identifies pre-elafin as a biomarker in ARDS. Am. J. Respir. Cell Mol. Biol. 2008, 38, 724–732. [Google Scholar] [CrossRef] [PubMed]
  84. Kothiyal, P.; Schulkers, K.; Liu, X.; Hazrati, S.; Vilboux, T.; Gomez, L.M.; Huddleston, K.; Wong, W.S.; Niederhuber, J.E.; Conrads, T.P. Differences in maternal gene expression in Cesarean section delivery compared with vaginal delivery. Sci. Rep. 2020, 10, 17797. [Google Scholar] [CrossRef]
  85. Brundage, J.F. Interactions between influenza and bacterial respiratory pathogens: Implications for pandemic preparedness. Lancet Infect. Dis. 2006, 6, 303–312. [Google Scholar] [CrossRef] [PubMed]
  86. Sharps, M.C.; Hayes, D.J.; Lee, S.; Zou, Z.; Brady, C.A.; Almoghrabi, Y.; Kerby, A.; Tamber, K.K.; Jones, C.J.; Waldorf, K.M.A. A structured review of placental morphology and histopathological lesions associated with SARS-CoV-2 infection. Placenta 2020, 101, 13–29. [Google Scholar] [CrossRef] [PubMed]
  87. Tuuli, M.; Longtine, M.; Nelson, D. Oxygen and trophoblast biology–a source of controversy. Placenta 2011, 32, S109–S118. [Google Scholar] [CrossRef] [PubMed]
  88. Ölmez, F.; Oğlak, S.C.; Can, E. The implication of aquaporin-9 in the pathogenesis of preterm premature rupture of membranes. Z. Geburtshilfe Neonatol. 2022, 226, 233–239. [Google Scholar] [CrossRef] [PubMed]
  89. Ölmez, F.; Oğlak, S.C.; Gedik Özköse, Z. Increased maternal serum aquaporin-9 expression in pregnancies complicated with early-onset preeclampsia. J. Obstet. Gynaecol. Res. 2022, 48, 647–653. [Google Scholar] [CrossRef]
  90. Prins, J.R.; Eskandar, S.; Eggen, B.J.; Scherjon, S.A. Microglia, the missing link in maternal immune activation and fetal neurodevelopment; and a possible link in preeclampsia and disturbed neurodevelopment? J. Reprod. Immunol. 2018, 126, 18–22. [Google Scholar] [CrossRef]
  91. Xu, P.; Zhang, X.; Liu, Q.; Xie, Y.; Shi, X.; Chen, J.; Li, Y.; Guo, H.; Sun, R.; Hong, Y. Microglial TREM-1 receptor mediates neuroinflammatory injury via interaction with SYK in experimental ischemic stroke. Cell Death Dis. 2019, 10, 555. [Google Scholar] [CrossRef]
  92. Linzer, D.I.; Fisher, S.J. The placenta and the prolactin family of hormones: Regulation of the physiology of pregnancy. Mol. Endocrinol. 1999, 13, 837–840. [Google Scholar] [CrossRef]
  93. Napso, T.; Yong, H.E.; Lopez-Tello, J.; Sferruzzi-Perri, A.N. The role of placental hormones in mediating maternal adaptations to support pregnancy and lactation. Front. Physiol. 2018, 9, 1091. [Google Scholar] [CrossRef]
  94. He, M.; Liu, P.; Lawrence-Dill, C.J. A hypothesis-driven approach to assessing significance of differences in RNA expression levels among specific groups of genes. Curr. Plant Biol. 2017, 11, 46–51. [Google Scholar] [CrossRef]
  95. Suh, A.; Jiang, Y.; Mosca, A.; Wu, E.; Chang, R. A Grammar for Hypothesis-Driven Visual Analysis. arXiv 2022, arXiv:2204.14267. [Google Scholar]
  96. Guo, W.; Tzioutziou, N.A.; Stephen, G.; Milne, I.; Calixto, C.P.; Waugh, R.; Brown, J.W.; Zhang, R. 3D RNA-seq: A powerful and flexible tool for rapid and accurate differential expression and alternative splicing analysis of RNA-seq data for biologists. RNA Biol. 2021, 18, 1574–1587. [Google Scholar] [CrossRef] [PubMed]
  97. Weinberg, D.H. Human Placenta Project. Available online: https://www.nichd.nih.gov/research/supported/human-placenta-project/default (accessed on 25 July 2023).
  98. Clark, A.R.; Chernyavsky, I.L.; Jensen, O.E. The complexities of the human placenta. Phys. Today 2023, 76, 26–32. [Google Scholar] [CrossRef]
Figure 1. An overview of robust data investigations of placental gene expression patterns in response to maternal SARS-CoV-2 infection. The dimensions of data challenges were obtained from Ahalt et al. [20].
Analytics 03 00007 g001
Figure 2. Differential gene expression pattern of aquaporins, HLA-C (major histocompatibility complex, class I, C), and TGM3 (transglutaminase 3). The decreased expression of Aquaporin-9 (AQP9) is statistically significant (p < 0.05). MIP is the official symbol for Aquaporin-0.
Analytics 03 00007 g002
Figure 3. Patterns of distributions of gene expression values for the aquaporin gene family in eight placental villous samples from mothers with and without SARS-CoV-2 infections. The visual integrates designs of enclosure data table showing clinical features of the placental villous sample and box plots of gene expression counts for 14 human aquaporin genes. The dashboard design supports sample-centric analysis, including identifying outlier values and differences in distribution patterns.
Analytics 03 00007 g003
Figure 4. An image of the enclosure table constructed in visual analytics software for aquaporin genes and other selected human gene family members grouped by binary number patterns that represent comparison of gene expression counts between placenta samples from maternal SARS-CoV-2 infection and control samples. The 3-digit binary number patterns indicate presence (1) or absence (0) of mRNA abundance values of zero for each of the three control samples. The 15-digit binary numbers encode patterns for comparing the transcript counts between the five COVID samples and the control samples. Each COVID sample pattern encodes three binary digits where “1” is for presence and “0” is for absence of mRNA abundance value in the COVID sample that is greater than the three placenta samples from mothers without SARS-CoV-2 infection. The combination of the three-digit binary numbers for the five COVID samples resulted in the 15-digit binary number pattern. The website links to obtain interactive versions of the visuals are available in the Supplementary Materials section of this report.
Analytics 03 00007 g004
Figure 5. Placental expression patterns of genes encoding galectins (LSGALS) and pregnancy-specific glycoproteins (PSG) in placenta samples of mothers with (COVID series) and without (Ctrl series) SARS-CoV-2 infection. (a) Box plot patterns and (b) heatmap patterns. Source of data is the GSE171995 sample series available at the NCBI Gene Expression Omnibus. The gene expression pattern represented by the interactive heatmap constructed in this study is similar to the heatmap available in the publication by Zhao et al. [18]. The website links to obtain interactive versions of the visuals are available in the Supplementary Materials section of this report.
Analytics 03 00007 g005
Figure 6. Placental expression patterns of genes encoding aquaporins in placenta samples of mothers with (COVID series) and without (Ctrl series) SARS-CoV-2 infection. (a) Box plot patterns and (b) heatmap patterns. Source of data is the GSE171995 sample series available at the NCBI Gene Expression Omnibus. The website links to obtain interactive versions of the visuals are available in the Supplementary Materials section of this report.
Analytics 03 00007 g006
Figure 7. A visual of microglia phagocytosis pathway from WikiPathways (WP3937) and visual representation of differential gene expression of 40 genes in the microglia phagocytosis pathway in response to maternal SARS-CoV-2 infection. The HGNC Nomenclature website provides additional information on the gene symbols. Trem3 is a mouse gene. The website links to obtain interactive versions of the visuals are available in the Supplementary Materials section of this report.
Analytics 03 00007 g007
Table 1. Constructed binary number patterns for gene expression counts of NCBI GEO GSE171995.
AquaporinBinary Number Pattern of Gene ExpressionGenes with Binary Number PatternExample Genes with Binary Number Pattern *
AQP0 (MIP)010010000010000000656ESX1 TLX1
AQP100001111101111101145BRCA1 CD9
AQP201001101001000001095TSLP VIP
AQP300001101101001111117HOXD8 TPRV2
AQP400001001001000000054CD1C NOX1
AQP500001001000001000015HEPHL1 KLF4
AQP6, AQP7000011010010010000588CFTR HNF4A
AQP8010011010010000000352CALHM1 FGF21
AQP90000001010000000004PI3 TREM1
AQP10010011000010010000212OR4C16 TLR9
AQP1100001101101100000025IL4I1 SLC6A4
AQP12A01001000000000001036MDFIC2 PRL
AQP12B010011010010010010473CETP CACNA1I
* Genes have evidence in Google Scholar for research in the context of mammalian placenta or pregnancy. The full names of the gene symbols are available at the HUGO Gene Nomenclature Committee (HGNC) website.
Disclaimer/Publisher’s Note: The statements, opinions and data contained in all publications are solely those of the individual author(s) and contributor(s) and not of MDPI and/or the editor(s). MDPI and/or the editor(s) disclaim responsibility for any injury to people or property resulting from any ideas, methods, instructions or products referred to in the content.

