Article

Barrier to Methyl Internal Rotation and Equilibrium Structure of 2-Methylthiophene Determined by Microwave Spectroscopy

1
Univ Paris Est Creteil and Université Paris Cité, CNRS, LISA, 94010 Créteil, France
2
Institute of Physical Chemistry, RWTH Aachen University, Landoltweg 2, D-52074 Aachen, Germany
3
Laboratory of Spectroscopy, Molecular Modeling, Materials, Nanomaterials, Water, and Environment, Faculty of Sciences, Mohammed V University, Av Ibn Battouta, B.P. 1014, Rabat, Morocco
4
Faculty of Sciences, University of Ulm, 89069 Ulm, Germany
5
Université de Lille, 59000 Lille, France
6
Institut Universitaire de France (IUF), 1 Rue Descartes, 75231 Paris, France
*
Authors to whom correspondence should be addressed.
Spectrosc. J. 2023, 1(1), 49-64; https://doi.org/10.3390/spectroscj1010005
Submission received: 31 March 2023 / Revised: 28 April 2023 / Accepted: 19 May 2023 / Published: 30 May 2023
(This article belongs to the Special Issue Feature Papers in Spectroscopy Journal)

Abstract

:
The microwave spectrum of 2-methylthiophene was recorded in a frequency range from 2 to 26.5 GHz using a molecular-jet Fourier transform microwave spectrometer with a Fabry–Pérot type resonator chamber and coaxial arrangement of the resonator and the molecular beam. Measuring and assigning spectra of the 34S and 13C isotopologues allowed the determination of the semiexperimental equilibrium structure ( r e SE ). Comparing the structure to that of thiophene revealed a decrease in the ∠(S−C2−C3) angle from 111.595(6)° to 111.37(1)° by addition of the methyl group to the C(2) position, as well as an increase in the S−C2 bond length from 1.7102(1) Å to 1.7219(2) Å. A–E splittings from internal rotation of the methyl group were observed, and the V3 potential in the vibrational ground state was determined to be 197.7324(18) cm−1. The V3 value and the rotational constants A, B, C were calculated with a large number of different methods and basis sets for benchmarking purposes by comparing them to the fitted parameters. The V3 value was also compared to those of other thiophene and furan derivatives to gain a better understanding of the steric and electrostatic effects in these classes of compounds.

Graphical Abstract

1. Introduction

Thiophene was discovered in 1882 by Meyer in the indophenine test of a decarboxylation reaction. In articles concerning benzene of different origins, he proposed thiophene as a more reactive agent to act as the reacting compound [1]. Henceforth, thiophene became an interesting chemical for numerous organic syntheses. Similar to its analogous five-membered ring compounds on the base of furan and pyrrole, it serves as building block for a variety of biological processes and complex chemical reactions [2,3,4]. An important thiophene derivative, 2-methylthiophene (2MTP), is a base, an intermediate, or a side product of various reaction chains. As a side product of aquathermolysis [5], 2MTP continues to react to 2,5-dimethylthiophene, which has applications as a ligand in complexes with noble metals [6]. The photolytic reactions of 2MTP in the presence of TiO2 as a catalyst for either oxidizing the monomer or engaging 2MTP in a chain reaction form poly-2MTP [7]. The chemical and biological applications associated with this scaffold make the structure of 2MTP interesting.
To determine the structure of a molecule, microwave spectroscopy is a powerful tool. The rotational constants are primary parameters that can be deduced from microwave transition frequencies, and they are linked directly to the atomic mass distribution in the molecule. In an early investigation, the microwave spectrum of 2MTP in the torsional ground state was measured by Pozdeev et al., where the rotational constants, dipole moment components, and V3 potential barrier of 555 cal/mol (194.1 cm−1) hindering the methyl internal rotation were determined from a small number of low-J transitions [8]. A few years later, the authors also reported some frequencies assigned to the first torsional excited state of the A torsional symmetry, which were fitted using perturbation terms included in an effective Hamiltonian model to yield a V3 value of 209.7 cm−1. Introducing a V6 term in the model led to a V3/V6 ratio of 208.9 cm−1/1.5 cm−1 [9]. A later work by Tanabe et al. re-examined the molecule using gas electron diffraction combined with microwave data from Pozdeev et al., focusing on structure determination [10]. To accurately determine the molecular structure and methyl internal rotation parameters of 2MTP, in the present study, we applied a state-of-the-art molecular jet Fourier-transform microwave (MJ-FTMW) spectroscopy technique combined with modern quantum chemical calculations. This theory–experiment joint-venture has become the method of choice to investigate many small molecular systems similar to 2MTP [11,12,13,14,15]. The high sensitivity and resolution of the experimental setup also enabled the observation of the 34S and 13C isotopologues in natural abundance, allowing the determination of the structure of 2MTP in the gas phase for the heavy atom backbone.
The structure determination of 2MTP is challenging because the methyl internal rotation with a relatively low torsional barrier leads to splittings of all rotational transitions into A–E doublets. The Hamiltonian model needs to consider these splittings. As a consequence, the rotational constants required for structure determination are strongly perturbed. A simple method to solve this problem and determine unperturbed rotational constants was proposed for molecules containing methyl internal rotation in Ref. [16], as successfully applied for 2-acetylfuran [17] and 2-acetylthiophene [18]. We will also use this method to determine the structure of 2MTP. As not many methylthiophene derivatives have been investigated, the experimental and theoretical results regarding 2MTP will serve as benchmarks for further research in this molecular class. The barrier to methyl internal rotation has been compared with those of other thiophene derivatives in Ref. [19] and will be discussed in more detail here.

2. Quantum Chemical Calculations

2.1. Geometry Optimizations

Quantum chemical calculations were first carried out with the Gaussian 16 suite of programs [20] to optimize the geometry of 2MTP and determine relevant geometry parameters, especially the rotational constants. A series of calculations with different methods and basis sets were employed for benchmarking purposes, including the ab initio MP2 [21] and coupled cluster methods (including single and double excitations [22] augmented with a perturbational estimate of the effects of connected triple excitations [23]). Calculations with density functional theory (DFT) employed the Becke’s three-parameter exchange functional with the Lee-Yang-Parr fit for the correlation functional (B3LYP) [24,25] and the Becke’s three-parameter exchange functional with Perdew and Wang’s gradient-correlated correlation functional (B3PW91) [24,25,26]. Additionally, the M06-2X [27], ωB97X-D [28], MN15 [29], and PBE [30] functionals were used. For all functionals where dispersion corrections are not included, calculations were carried out with Grimme’s dispersion correction (D3) [31], with or without Becke-John damping (D3BJ) [32], and partly with the Coulomb-attenuation method (CAM-B3LYP) [33]. Various basis sets of different resource intensity were associated with the methods. The Pople basis sets [34] allow for fast calculations with either primitive functions (6-31G, 6-311G), with or without diffuse functions (+ or ++) but always with polarization functions (d,p), (df,pd), (2d,2p), (2df,2pd), (3df,3pd). The Dunning basis sets [35] were used in their regular (cc-pVDZ, cc-pVTZ) and augmented form (aug-cc-pVDZ, aug-cc-pVTZ) [36].
For all calculations, bond lengths and angles were allowed to relax and converged into the minimum shown in Figure 1 with an anti-orientation between the in-plane hydrogen atom and the sulfur atom, confirming the planarity as a result of the delocalized π-electrons of the aromatic ring. The syn-configuration is a transition state. The nuclear coordinates obtained from calculations at the MP2/6-311++G(d,p) level of theory (with very tight converging criteria) are listed in Table S1 in the Supporting Information. A complete list of the predicted rotational constants across all aforementioned levels of theory can be found in Table S2.
For a precise molecular structure determination, we calculated the ab initio Born–Oppenheimer (BO) equilibrium structure r e B O using the CCSD(T) method, two basis sets (correlation-consistent polarized weighted core-valence triple zeta (cc-pwCVTZ), and quadruple zeta (cc-pwCVQZ) [37]). All electrons were correlated (ae). The CCSD(T) calculations were performed with Molpro [38,39]. The results are given in Table 1.
The cc-pwCVTZ basis set was used to check the convergence. The largest differences for the bond lengths are for the S–C bonds (0.0043 Å for S–C5 and 0.0048 Å for S–C2). This is compatible with the results of thiophene, c-C4H4S, where the enlargement of the basis set from cc-pwCVTZ to cc-pwCVQZ at the CCSD(T) level of theory leads to a shortening of the S–C bond of 0.0045 Å [18]. For the other bond lengths, the shortening is less than 0.002 Å. For the bond angles, the largest difference is only 0.15° for the ∠(C2−S−C3) angle. Furthermore, in the case of thiophene, the CCSD(T)_ae/cc-pwCVQZ structure is in almost perfect agreement with both the best semiexperimental structure and the best theoretical estimate, with the only significant difference being for the ∠(S−C2−H) angle [18]. The small discrepancy for the ∠(S−C2−H) angle can be easily explained by the fact that the Cartesian coordinates of C(2) and H are small. In such a case, the theoretical value is expected to be more accurate [42]. These results confirm the stated accuracy for the CCSD(T)_ae/cc-pwCVQZ structure.

2.2. Methyl Internal Rotation

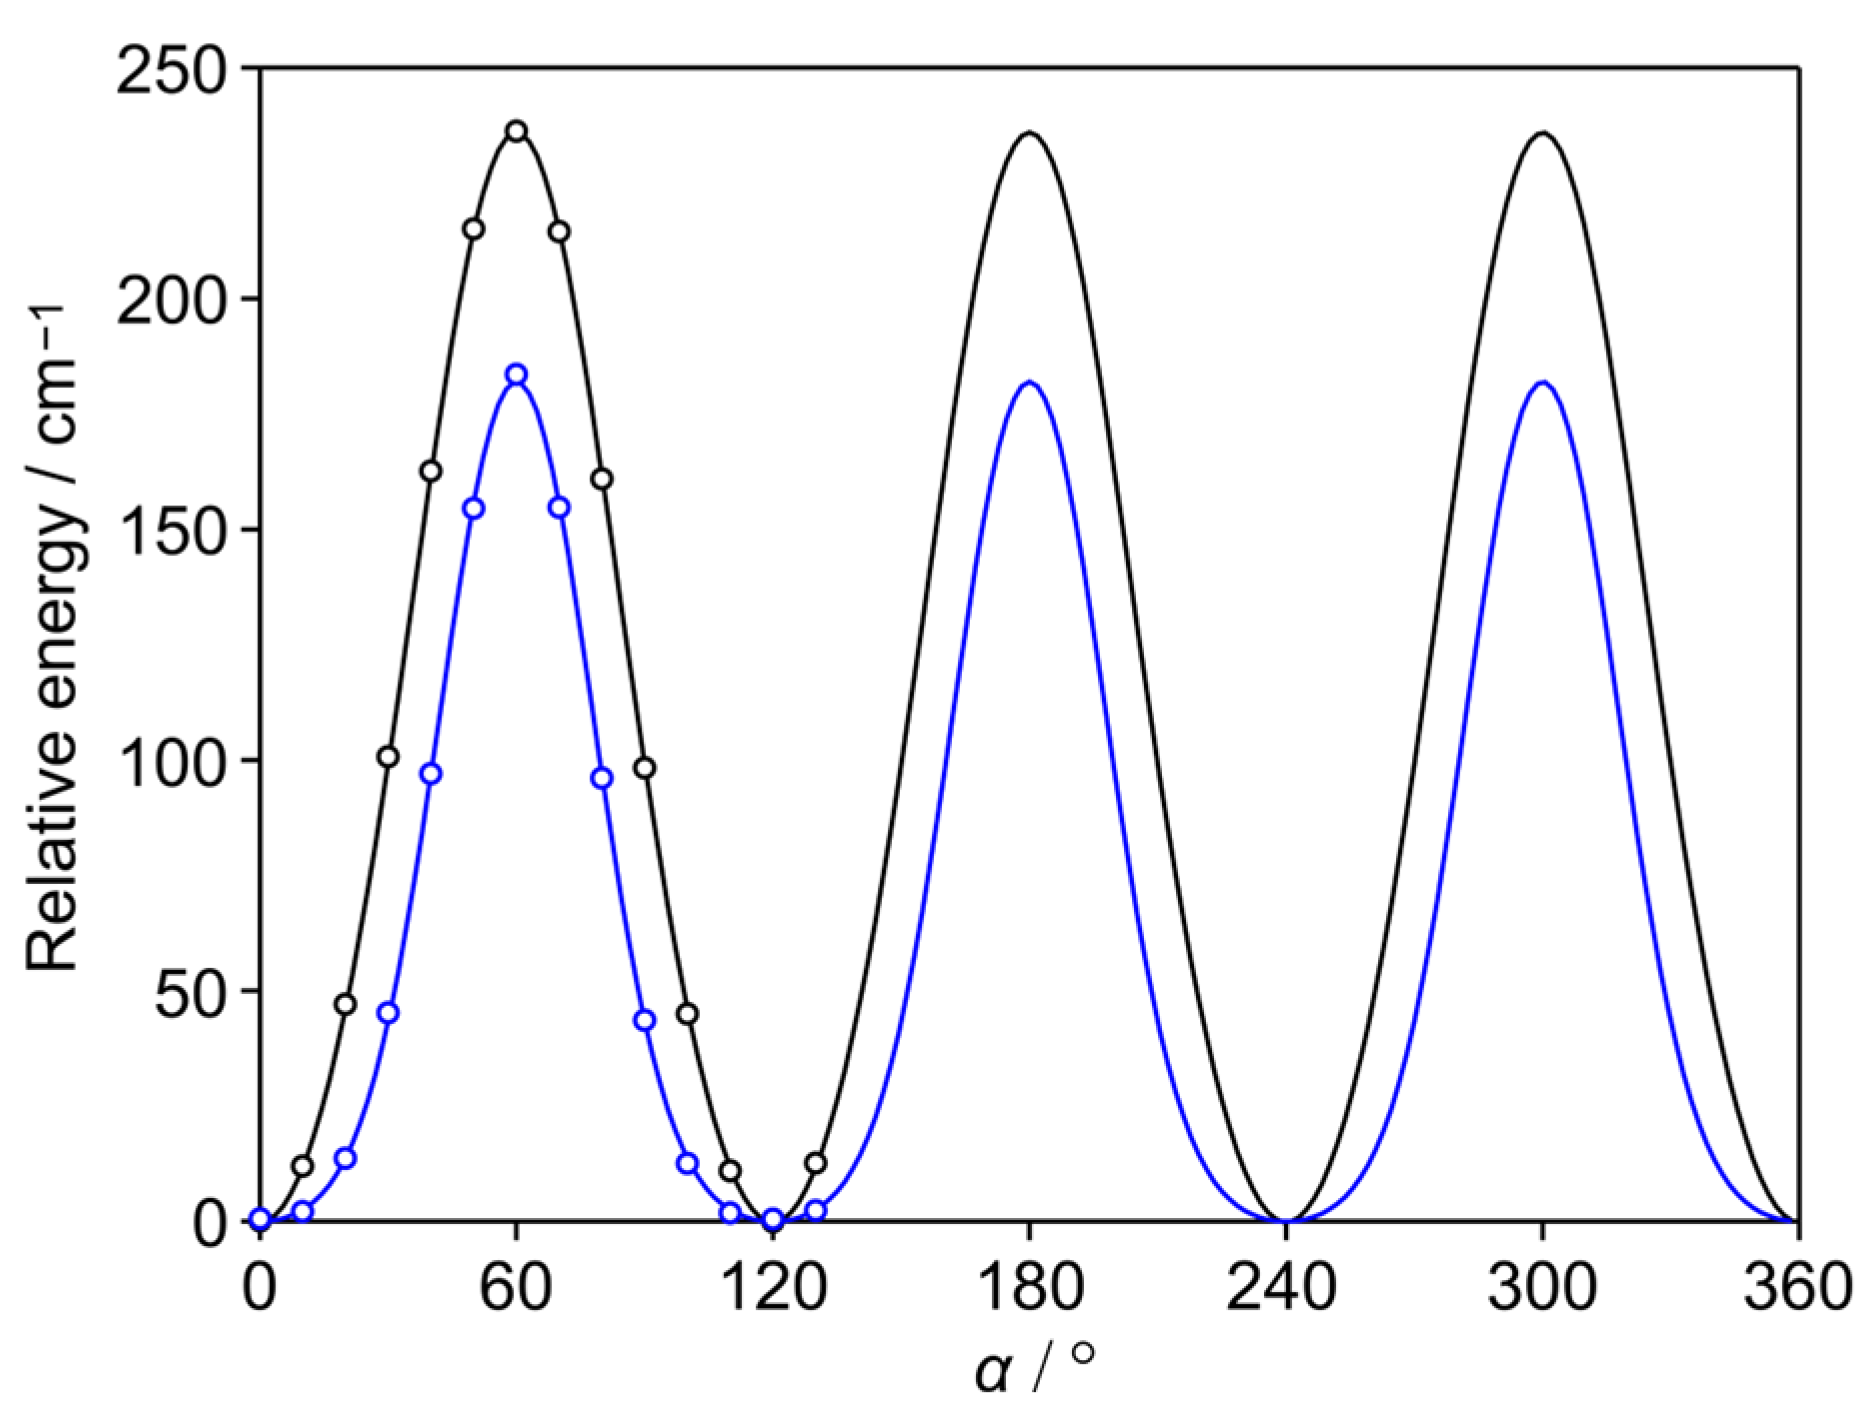
2MTP has a methyl group next to the sulfur hetero-atom undergoing internal rotation. The potential energy curve of the methyl torsion was modeled by altering the dihedral angle α = ∠(C3–C2–C9–H12) and calculating the energy, while all other geometry parameters were optimized at the MP2/6-311++G(d,p) and B3LYP-D3BJ/6-311++G(d,p) levels. Taking advantage of the C3 symmetry of the methyl group, α was only varied in 14 steps of 10° to model a full methyl rotation. The obtained energy values were parameterized with a Fourier expansion and drawn as a contour plot, which is shown in Figure 2. The Fourier coefficients are in Table S3 of the Supporting Information. The V3 term is 183.02 cm−1 in the MP2 and 236.31 cm−1 in the B3LYP-D3BJ calculation. Subsequently, we applied all levels of theory used for benchmarking the geometry of 2MTP mentioned in Section 2.1. to calculate the methyl torsional barrier. The results are also given in Table S2.

3. Microwave Spectroscopy

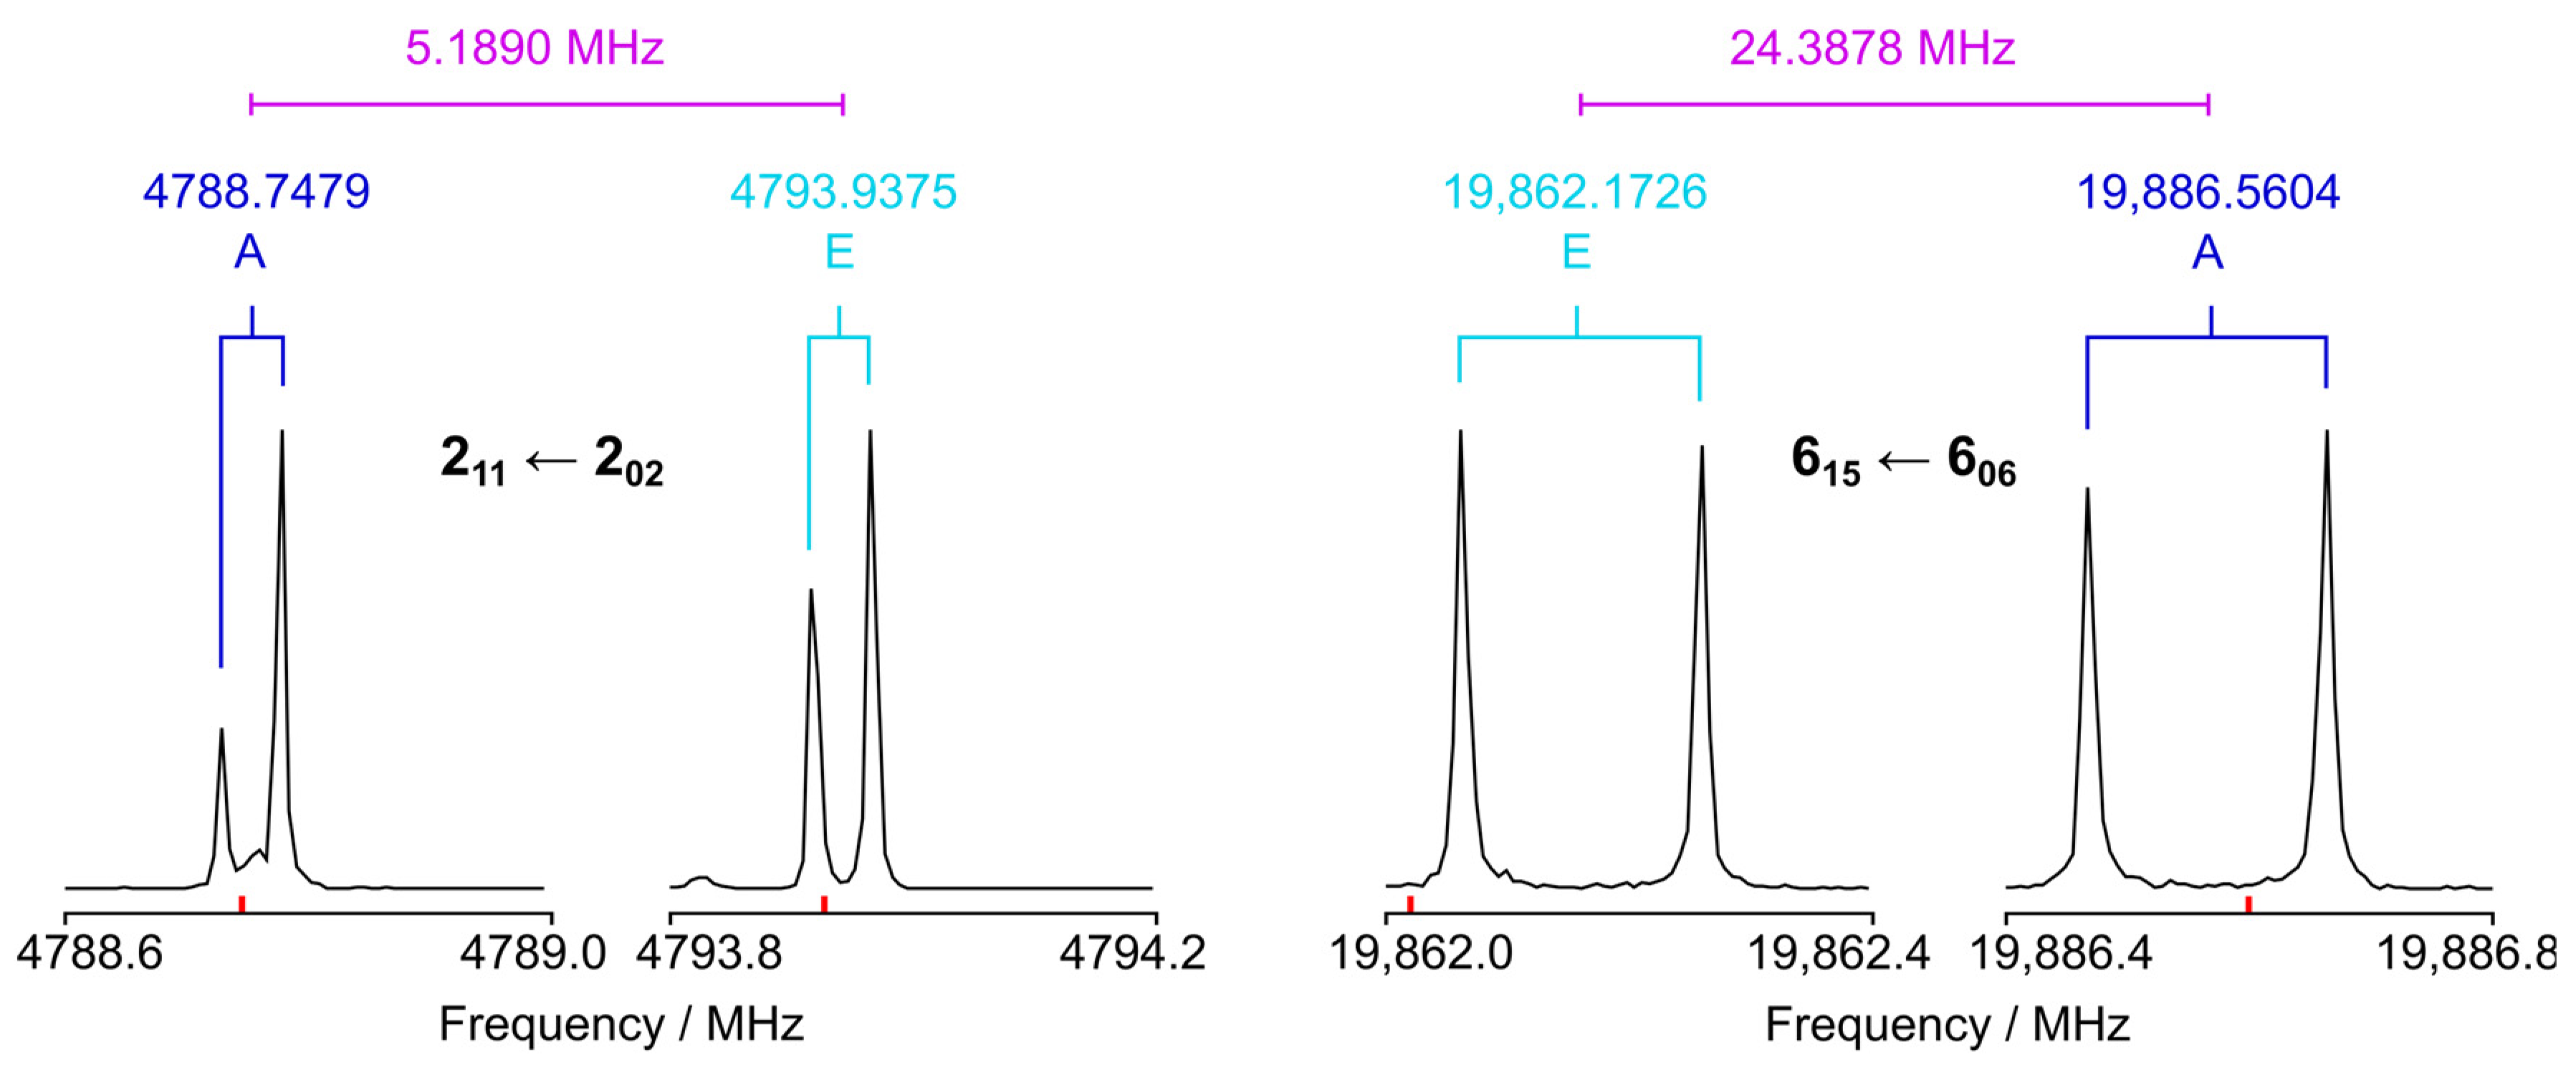
The microwave spectra of 2MTP were measured using a MJ-FTMW spectrometer with a Fabry–Pérot type resonator vacuum chamber, operating from 2 to 26.5 GHz with an experimental resolution of 2 kHz [43]. The substance was purchased from Sigma-Aldrich with a purity of >98% and was used as received. A pipe cleaner for use as a reservoir was loaded with the sample and placed upstream of the pulsed nozzle. Helium was streamed over the reservoir held at a pressure of 1.8 bar, and the 2MTP-helium gas mixture was expanded into the vacuum chamber at a pressure of 10−6 mbar, cooling the molecules down to about 2 K rotational temperature. The A and E transitions from Pozdeev et al. [8] were first remeasured and fitted using the XIAM program [44]. Note that the frequency of the 221 ← 110 E-species transition was misinterpreted in Ref. [8]. We then used the molecular parameters obtained from this fit to predict and measure further lines in the frequency range of the spectrometer without recording survey scans. The measured branches were J+10,J+1J0,J, J+11,J+1J1,J, and J+11,JJ1,J−1 for the a-type transitions, with Ka ≤ 2 and J ≤ 6. The main branches for the b-type transitions were J+11,J+1J0,J, J+10,J+1J1,J, J1,J−1J0,J, and J2,J−1J1,J, with Ka ≤ 5 and J ≤ 9. Each rotational transition appeared as a Doppler doublet from the coaxial arrangement of the resonators and the molecular beam. The A–E splitting ranges from a few MHz to a few tens or hundreds of MHz, as shown exemplarily in Figure 3.
A total of 75 A and 73 E lines were fitted using the XIAM program [44], with the utilization of the rotational constants, quartic centrifugal distortion constants in Watson S reduction, the V3 potential term, and the angle δ between the internal rotor axis and the a-principal axis. To check whether the reduction choice affects the values of the rotational constants [45], the same data set was fitted with Watson A reduction. The rotational constants and internal rotation parameters have almost the same values as in the fits with Watson S reduction—confirming that the centrifugal distortion corrections have a negligible effect on the derived structure. This is usually the case for heavy molecules with small rotational constants [46]. Furthermore, we also fitted three higher order parameters, D p i 2 J , D p i 2 K , D p i 2 , which described the coupling between the overall rotation and the internal rotor (often illustrated as the centrifugal distortion of the internal rotor). These parameters have a major impact on the accuracy of all other fitted parameters, especially the rotational constants, as well as the overall standard deviation of the fits. Two best fits that we performed were those where (1) D p i 2 J , D p i 2 K , and D p i 2 are fitted and (2) only D p i 2 J and D p i 2 K are fitted, as shown in Tables S4–S6 in the Supporting Information. It is clear from Table S4 that fitting D p i 2 is essential to obtain not only better standard deviations for the parent species and the 34S isotopologue fits but also a better accuracy of the rotational constants. However, the accuracy of the rotational constants for all 13C isotopologue fits is lower than for the parent species and the 34S isotopologue fits if D p i 2 is fitted, probably due to the smaller data sets. Therefore, D p i 2 was fixed to the value of the parent species fit in all 13C isotopologue fits.
The spectrum of 2MTP is of low intensity as a result of the weak dipole moment components μa = 0.375(5) D and μb = 0.560(5) D [8]. The ab-plane containing all heavy atoms acts as a symmetry plane, leading to a c-dipole moment value of zero, and only a- and b-type spectra are observable for the A species. Despite the small μa and μb values, we still searched for the 34S and 13C isotopologue spectra. The rotational constants of these minor isotopologues were calculated by substituting the mass of the 32S atom with that of the 34S atom or the mass of the 12C atom with that of the corresponding 13C atom. The minor isotopologue frequencies predicted using these rotational constants were additionally corrected with the differences between the experimental frequencies of the main species and the frequencies predicted with the B e ξ (with ξ = a, b, c) constants calculated at the MP2/6-311++G(d,p) level (see Equations (1) and (2) of Ref. [47]). Small scans around the predicted shifted frequencies (max. ±15 MHz) were needed to find the first three transitions of each minor isotopologue. Fitting them enabled us to straightforwardly identify all other A species lines. The signal to noise ratio was much lower than that of the parent species, accounting for a low natural abundance of 4.25% for the 34S isotopologue and 1.07% for the 13C isotopologues. While the same branches as that of the parent species were measured, they only reached J ≤ 5 and Ka ≤ 1, resulting in the less accurate determination of centrifugal distortion constants. The barrier to internal rotation was not expected to vary upon isotopologic substitution. To find E species transitions, the V3 value of the parent species was taken and only δ was adjusted. The predicted E-species frequencies were sufficiently accurate, and the lines were found straightforwardly. The A–E splittings remained almost the same between different isotopologues. The experimental parameters and the frequency lists are presented in Table 2 and Tables S7–S13 in the Supporting Information, respectively.
Finally, we also search for the spectrum of the 33S isotopologue, since 33S spectra could be observed for another thiophene derivative, 2-thiophenecarboxaldehyde, using the same experimental setup [48]. Due to the 33S nuclear spin of I = 3/2, hyperfine splittings are expected for all rotational transitions. To locate the 33S F-components of a rotational transition, scan measurements by overlapping high-resolution spectra with 250 kHz steps were carried out within a range of about 20 to 30 MHz around the frequency predicted using the isotopic shift. For each measurement, 1000 FIDs were co-added due to the expected very low line intensity, which results from the low abundance of 0.75% of the 33S isotopologue in addition to the splittings into various hyperfine components together with the A–E splittings. Combined with the already small dipole moment components, we only found a few 33S transitions with their most intense F-components, and the number of lines was too small to establish a reliable fit. Figure S1 in the Supporting Information shows a 33S spectrum of the 313 ← 202 transition.

4. Semiexperimental Equilibrium Structure

In the semiexperimental method, the equilibrium rotational constants are derived from experimental ground state rotational constants B 0 ξ and rovibrational corrections Δ B vib ξ calculated from a quantum chemical force field [46]. There is a much smaller electronic correction Δ B elec ξ , which is estimated by using the diagonal elements of the rotational g-tensor. The g-tensor was computed at the B3LYP/6-31+G(3df,2pd) level. Here, the values for the parent species are gaa = −0.0595, gbb = −0.0597, and gcc = 0.0148. The contributions of the electronic correction of 173 kHz for A, 102 kHz for B, and 16 kHz for C are small but not negligible. There is still a much smaller correction Δ B cent ξ originating from the centrifugal distortion. However, in the present case of 2MTP with small rotational constants, it is completely negligible. The structure is obtained by fitting only the equilibrium moments of inertia.
The equilibrium rotational constants B e ξ may be written as:
B e ξ = B 0 ξ + Δ B vib ξ + Δ B elec ξ
with
Δ B vib ξ = 1 2 i α i ξ
and
Δ B elec ξ = m e m p g ξ ξ B BO ξ
In these equations, α i ξ is the vibration–rotation interaction constant, m e m p the electron-proton mass ratio, and B BO ξ the BO-equilibrium rotational constant of the r e BO structure computed at the CCSD(T) level. In order to calculate the rovibrational corrections, the anharmonic force field of all isotopologues was calculated at the B3LYP-D3/6-311+G(3df,2pd) level using Gaussian 16 [20]. The corrections to the ground state rotational constants and the equilibrium rotational constants are given in Table 3.
There are 20 independent parameters to determine, and the experimental constants of six isotopologues provide only 18 moments of inertia. This is not enough to determine a structure, especially since the rotational constants of the deuterated species are unknown. For this reason, the mixed estimation method was used [49,50,51]. The CCSD(T)_ae/cc-pwCVQZ structure was used as supplementary data in the least-squares fit. This method has the advantages of determining all the structural parameters without bias and of checking the compatibility of the ab initio structure with the semiexperimental equilibrium rotational constants. The uncertainties used to estimate the weights are 0.002 Å for the bond lengths and 0.3° for the angles. To estimate the uncertainty of the rotational constants, the iteratively reweighted method was used [52] (see also Section 9.5 of Ref. [42]). The results are given in Table 1, and the residuals of the fit are listed in Table 3. The fitted parameters are quite close to the BO structure, and the standard deviations of the fitted parameters are smaller than the uncertainties of the predicates. This indicates that the semiexperimental and BO structures are compatible.
As a further check, the method developed by Kummli et al. [53,54] was employed. The idea is to extrapolate (or interpolate) the ab initio CCSD(T)_ae/cc-pwCVTZ and CCSD(T)_ae/cc-pwCVQZ values in order to reproduce the experimental rotational constants. For details, see Refs. [42,53,54]. Each parameter is determined three times using the three rotational constants. The range R of the obtained values allows us to estimate the standard deviations using the following equation [55]:
s = R 1.40 n 1 / 3
where n is the number of data (here n = 3). Note that this equation does not take into account the probable systematic errors. In other words, s is probably too small. This “extrapolated” structure, also given in Table 1 (structure II), is in good agreement with the semiexperimental structure, confirming its accuracy. Nevertheless, the “extrapolated” C−H bond lengths seem to be more accurate than the semiexperimental values. However, the differences are small, and we need to remember that the fitted values are determined by the predicates. This can be validated again by comparing the C5−H and C4−H bond lengths shown in Table 1 to the respective values of 1.07714(17) and 1.07856(14) Å determined for thiophene where over 20 isotopologues, including deuteriums, were available [56].
Finally, this “extrapolated” structure was used as a predicate. The results (also given in Table 1 as structure III) are fully compatible with the semiexperimental structure obtained with the help of the CCSD(T)_ae/cc-pwCVQZ values as predicates (structure I). It is worth noting that three semiexperimental bending angles, ∠(H6−C2−S), ∠(H7−C4−C2), and ∠(H8−C2−C4), are slightly less precise. This can be explained by the fact that the b coordinate of C(2), b(C2) = −0.2050(6) Å, is quite small.
We note that overall, different computational levels were used, e.g., B3LYP/6-31+G(3df,2pd) level for the g-tensor, B3LYP-D3/6-311+G(3df,2pd) (this work) or B2PLYP-D3/6-311+G(3df,2pd) [18] for the anharmonic force field constants, and CCSD(T) for the BO rotational constants. To calculate a reliable equilibrium structure, the CCSD(T) method is generally required. Therefore, it was used to calculate the BO structure. Concerning the calculation of the Δ B vib ξ correction, there is not much difference between the B3LYP-D3 and B2PLYP-D3 results. In both cases, there is a small systematic error, which does not significantly affect the structure. Finally, for the Δ B elec ξ correction, it is an almost negligible correction; thus, it requires calculations with less accuracy. From our experience working with many molecules, the B3LYP method gives satisfactorily results to calculate Δ B elec ξ . For this correction, nearly identical results are obtained with B3LYP and B3LYP-D3.
To evaluate the importance of all these corrections, we performed a simple Kraitchman analysis [40] to obtain the rs substitution structure using Kisiel’s programs KRA and EVAL available from the PROSPE website [57] with the experimental rotational constants without any corrections. The determinable bond lengths and angles are shown in Table 1. They show the large difference between the rs and the re structure. This is comprehensible since the rs structure is determined with rotational constants of the vibrational ground state. We then re-performed the Kraitchman analysis using only a simple cubic force field correction calculated at the MP2/6-311++G(d,p) level of theory. The r e SE structure obtained with this correction, also given in Table 1 (structure IV), is closer to the re structure than the rs structure is, but the low precision of the determined bond lengths and angles clearly demonstrate the need of using the additional corrections mentioned above.
As a final remark on the structure determination, it is important to note that MJ-FTMW spectroscopy is a sensitive technique, allowing the measurements of many minor isotopologues in natural abundance, such as 34S (4.2%) and 13C (1.1%), as for the present study on 2MTP, and in some cases, even 15N (0.35%) and 18O (0.21%), as reported in many investigations in the literature where microwave structures have been determined. However, the sensitivity is not enough to measure deuterated isotopologues at natural abundance, and a synthesis is not always straightforward. Therefore, cases where an insufficient amount of isotopologues are available are often found, and there are not enough independent moments of inertia to determine all geometry parameters. For future studies, carrying out H/D exchange syntheses to obtain access to deuterated isotopologues might prove worthwhile [56,58,59,60,61].

5. Discussion

5.1. Molecular Parameters

For the parent species of 2MTP, 148 lines could be fitted to a standard deviation of 4.4 kHz using the XIAM program. The calculated values for the molecular parameters are in good agreement with the experiment. Transitions with high J and Ka values, such as 945 ← 936 and 551 ← 542, are still considered to improve the accuracy of the determined centrifugal distortion constants despite individual deviations up to 20 kHz, therefore trading by the slightly higher standard deviation of the fit. The ground state rotational constants A = 5299.85002(45) MHz, B = 3114.09632(30) MHz, and C = 1985.26582(21) MHz are determined with high precision. For the 13C and 34S isotopologues, the accuracy of the deduced parameters is slightly lower since fewer transitions are available with lower values of J and Ka, but the standard deviations of all fits are satisfactory.
For the rotational constants, the fitted parameters in the ground state A0, B0, and C0 are compared to the calculated equilibrium parameters from combinations of different methods and basis sets to find the level that gives the best match. Theoretically, this comparison is not meaningful, and the best level of theory should be the most elaborated and the most resource-intensive level, e.g., MP2/6-311++G(3df,3pd) and CCSD/cc-pVDZ. Practically, experimentalists are searching for an accidental match between equilibrium rotational constants obtained from resource-efficient geometry optimizations with experimental ground state rotational constants as assignment guidance rather than performing expensive anharmonic frequency calculations to access computed ground state rotational constants. Only after the experimental constants are available, such expensive calculations become meaningful, as have been performed in the present study to obtain high quality r e SE structures. In this work, the best BeB0 matches were achieved at the B3LYP/6-311(++)G(2df,2dp) and B3LYP/6-311(++)G(3df,3dp) levels. Grimme’s dispersion correction, with or without Becke-Johnson damping or with or without diffuse functions, has no effect on the results. The Dunning basis sets (aug-)cc-pVTZ work well in combination with the B3LYP method. The B3LYP, M06-2X, ωB97X-D, and MN15 functionals provide comparable results in combination with the 6-311(++)G(d,p) basis sets.
Although the mean equilibrium pseudo-inertial defect at −3.11138 uÅ2 is larger than the ground state one (−3.07986 uÅ2), it is rather small, indicating that the two out-of-plane hydrogen atoms are not too distant (HaHa = 1.96 Å). This may be explained by the value of the ∠(Ha−C9−Ha) angle at 107.43° being much smaller than the standard tetrahedral value of 109.47° due to interactions between the Ha and the sulfur atoms. The distance between these two atoms is only 3.08 Å; the sum of the van der Waals radii is 3.09 Å. This could also explain the large value of the ∠(Ha−C9−C2) angle, which is responsible for the asymmetry of the methyl group. According to the ligand close-packing model [62], the distance between two non-bonded atoms attached to the same atom is nearly constant and is the sum of the ligand radii of the two atoms. Actually, the ligand radius depends on the charge of the atom, and it decreases as the charge becomes less negative (or more positive). The charges on the atoms were calculated with the Charge Model 5 [63]. The values of q(Ha) = +0.089 a.u. explain the small radii of the out-of-plane hydrogen atoms.
Although the CHs and CHa bond lengths of 1.089 Å and 1.090 Å, respectively, are close, the methyl group is asymmetric, with the ∠(Ha−C9−C2) angle being 2.3(3)° larger than ∠(Hs−C9−C2). This is usual for an asymmetric top, and the consequence is a methyl tilt. The angle of the C2−C9 bond with the a-axis is 5.05°, whereas the angle of the internal rotation axis with the a-axis is 3.70°. The C2−C9 bond length at 1.4943 Å is quite close to the value found in propene for the C−C single bond, which is 1.495 Å [64]. The bond multiplicity of 5 is the same in propene and 2MTP, and Stoicheff established that the C−C bond lengths decrease with the bond multiplicity [65]. This was later confirmed by Kuchitsu [66], see also Section 8.5.3.4 of Ref. [42].
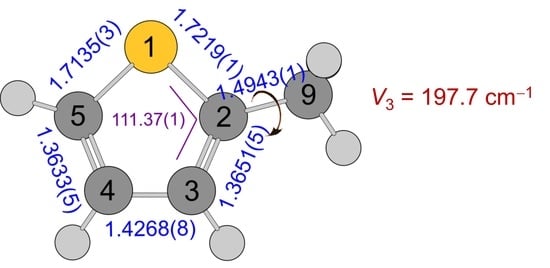
The comparison of the structure of 2MTP with two other mono-substituted thiophenes, 2-acetylthiophene and 2-thiophenecarboxaldehyde, as well as the unsubstituted thiophene, reported in Ref. [18], confirms the asymmetric deformation of the ring. Whereas the two sulfur bonds of thiophene are equal with r e SE = 1.7102(1) Å, the addition of the methyl group at C(2) increases the bond length to r e SE (S−C2) = 1.7219(2) Å and r e SE (S−C5) = 1.7135(3) Å, respectively. This change in length and the added asymmetry to the ring were also observed for 2-acetylthiophene [18] and 2-thiophenecarboxaldehyde [48]. As a result, the angle ∠(S–C2=C3) changes and is smaller for 2MTP compared to thiophene. Figure 4 visualizes the differences in structure between 2MTP and the other thiophene derivatives.

5.2. Methyl Internal Rotation

The barrier to methyl internal rotation of 2MTP (molecule (1) in Figure 5) was determined to be 197.7324(18) cm−1, which is different than the value of 194.1 cm−1 determined by Pozdeev et al. [8]. This is partly due to the misinterpretation of an E-species line in combination with the much smaller number of lines used in Ref. [8], but mainly because different Hamiltonian models are utilized. We tested by refitting the data set of Ref. [8] with the fitted parameters used in Table 2 and obtained a V3 value close to 197.7 cm−1. We also note that V3 strongly correlates with the moment of inertia F0 of the methyl internal rotor. Because only data in the torsional ground state are available, we decided to fix F0 to 160 GHz, a value often found for methyl groups and close to the value of 159.808(80) GHz that is obtained if F0 is fitted. This value is also close to the value of 159.707(19) GHz reported for 2,5-dimethylthiophene [67]. Changing the fixed value of F0 would lead to a change in the V3 value. For example, if F0 is fixed to 158 GHz, we find a V3 value of 195.3 cm−1.
Comparing the barriers of the parent species and the minor isotopologues, Table 2 shows that the values are different outside the errors. Since the threefold internal rotation barrier V3 is an electronic property, it should be the same for all isotopic variants. In the Hamiltonian, the V3 term is multiplied with (1 − cos3α). Only the angle δ between the internal rotor axis and the a-principal axis could vary upon different isotopologues. If only V3 and δ would be fitted, the V3 value of all minor isotopologue fits could be fixed to that of the parent species fit. However, when D p i 2 J , D p i 2 K , and D p i 2 are fitted, a correlation between the rotational constants A, B, and C with V3 appears through these parameters. Because the rotational constants change upon isotopic substitution, these changes affect D p i 2 J , D p i 2 K , and D p i 2 , and the changes in D p i 2 J , D p i 2 K , and D p i 2 affect V3, causing differences in the V3 values of isotopic variants.
Comparing the experimental V3 value to the calculated values given in Table S2 in the Supporting Information, the predictions are generally good. There are many levels of theory that yield values with less than 10 cm−1 deviation from the experimental one. This kind of benchmarking regarding the methyl torsional barriers is still in a very early stage and has only been performed previously for the three derivatives of acetylmethylthiophene [68]. Further investigations are needed to recognize a trend and find out the levels that can be recommended to calculate the barrier to methyl internal rotation in methylthiophene derivatives.
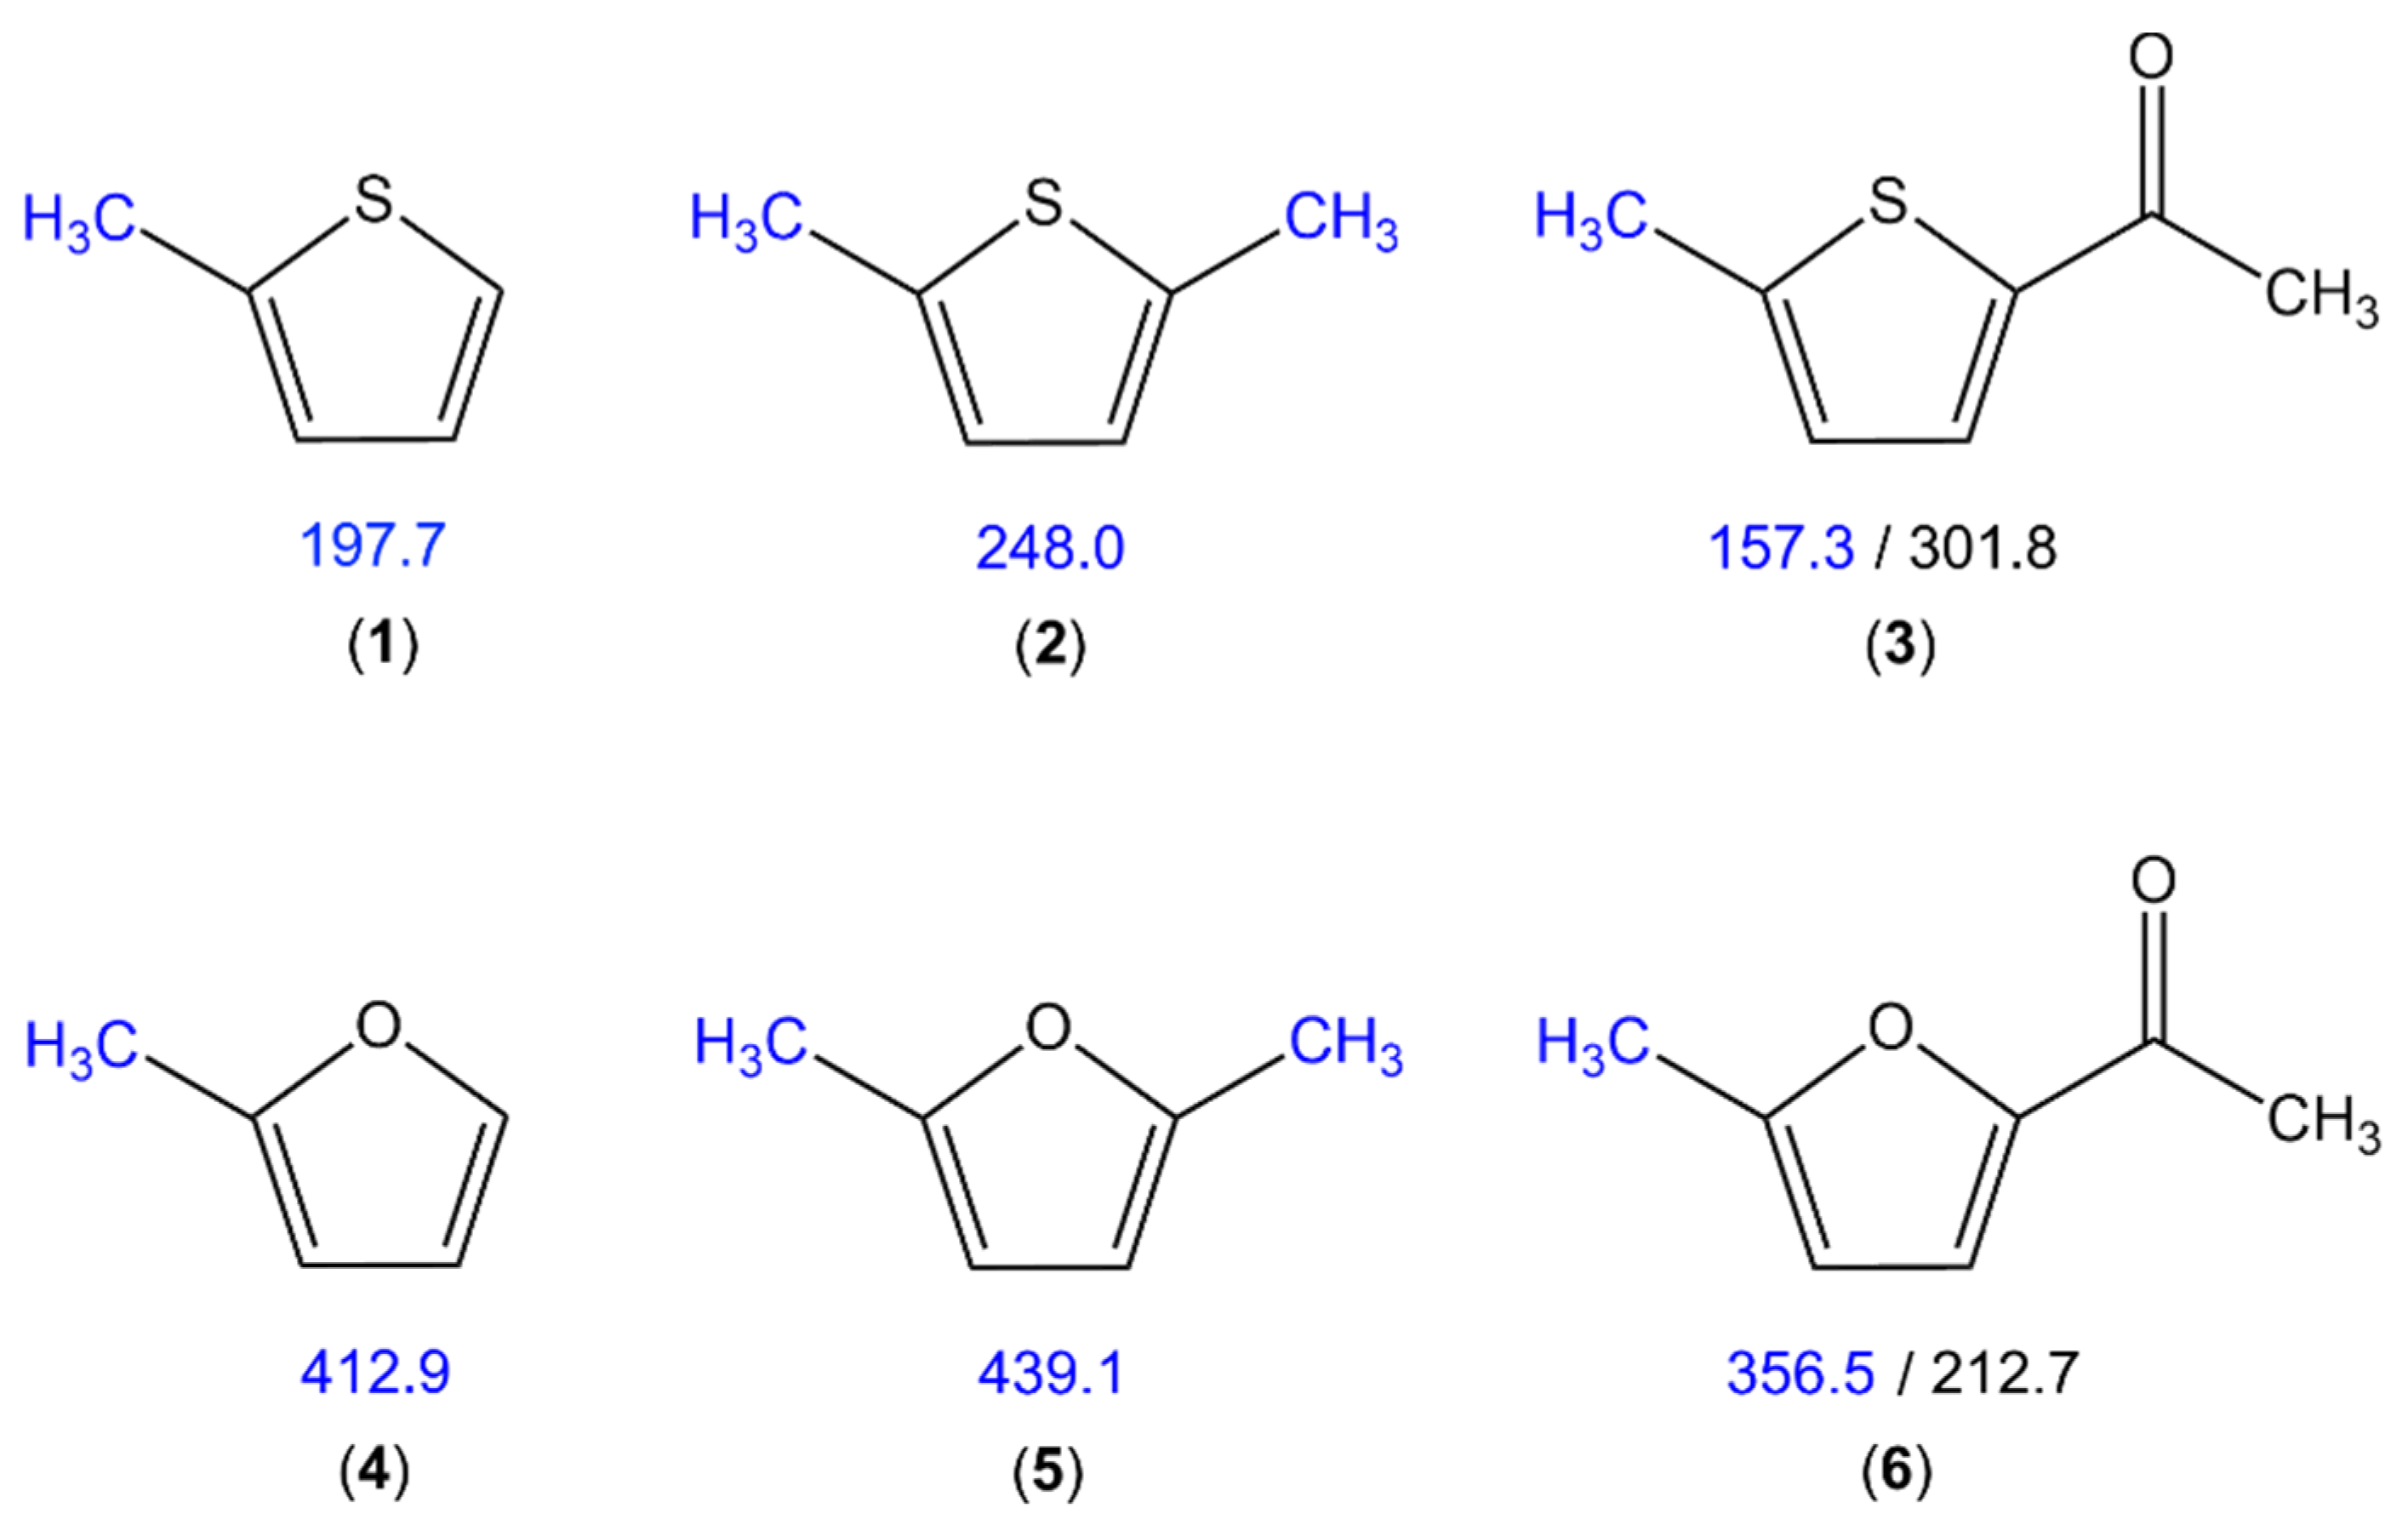
The V3 value of 2MTP is lower than that found for 2,5-dimethylthiophene (2) (248.0 cm−1) [67] where an electron releasing methyl group with +I effect is present at the 5-position of the ring, whereas it is higher than the value of 157.3 cm−1 in 2-acetyl-5-methylthiophene (3) [68] where the 5-position is occupied by an electron withdrawing acetyl group with −I effect. Since substituents at the 2- and the 5-positions cannot interact sterically, the electronic properties of the other substituent on the ring are most probably the reason why the 2-methyl torsional barrier is tuned. It is also well-known that the methyl torsional barriers in sulfur-containing molecules are usually lower than their oxygen analogs. This trend is observed for all thiophene/furan pairs shown in Figure 5. The electronic effects on methyl torsions mentioned above are also well-demonstrated by the three furan derivatives: 2-methylfuran (4) [69], 2,5-dimethylfuran (5) [70], and 2-acetyl-5-methylfuran (6) [71].

6. Conclusions

The microwave spectrum of 2MTP was measured in the range of 2 to 26.5 GHz to precisely deduce the V3 potential hindering the methyl internal rotation in the torsional ground state, which transpired to be 197.7324(18) cm−1, using the XIAM program. Spectra of 34S and 13C isotopologues were also observable. With the accurately determined rotational constants A, B, C for the parent species and the minor isotopologues, in the presence of A–E methyl torsional splittings, the semiexperimental equilibrium structure r e SE was determined, which is in good agreement with the Born–Oppenheimer structure obtained at the CCSD(T)_ae/cc-pwCVQZ level. The addition of a methyl group neighboring the sulfur atom results in structural changes, as evidenced by an increase in the C−S bond length from r e SE (S−C) = 1.7102(1) Å for thiophene to r e SE (S−C2) = 1.7219(2) Å. Consequently, the bond angle ∠(S−C2−C3) decreases from 111.595(6) Å in thiophene to 111.37(1) Å in 2MTP. Furthermore, the methyl group was found to be asymmetric. While the C−Hs and C−Ha bond lengths vary only between 1.089 Å and 1.090 Å, the ∠(Ha−C9−C2) bond angle is 2.3(3)° larger than the ∠(Hs−C9−C2) angle. This results in a tilt angle of 5.05° of the C2−C9 bond with the a-axis, whereas the angle δ between the internal rotor and the a-axis is 3.70°.

Supplementary Materials

The following supporting information can be downloaded at: https://www.mdpi.com/article/10.3390/spectroscj1010005/s1, Table S1. Nuclear coordinates of 2MTP in the principal axis system calculated at the MP2/6-311++G(d,p) level of theory; Table S2. Equilibrium rotational constants A, B, C and the V3 torsional barrier for 2MTP calculated at different levels of theory and their deviations to the experimental values ΔA, ΔB, ΔC; Table S3. Coefficients of the Fourier expansion for the potential energy curves of the methyl internal rotation of 2MTP given in Figure 2; Figure S1. Four spectra of the b-type R-branch 313 ← 202 transition of the 33S isotopologue of 2MTP, featuring the A- and E-species from methyl internal rotation and some components of the quadrupole hyperfine structure; Table S4. Rotational constants of 2MTP for all observed isotopologues obtained with the XIAM program when D p i 2 J , D p i 2 K , and D p i 2 are fitted. For all 13C isotopologue fits, the values of DK and d2 were fixed to those of the parent species; Table S5. A section of Table 2 showing the rotational constants of 2MTP for all observed isotopologues obtained with the XIAM program when D p i 2 J , D p i 2 K , and D p i 2 are fitted for the parent species and the 34S isotopologue fits. For all 13C isotopologue fits, the values of DK, d2, and D p i 2 were fixed to those of the parent species; Table S6. Rotational constants of 2MTP for all observed isotopologues obtained with the XIAM program when only D p i 2 J and D p i 2 K are fitted. For all 13C isotopologue fits, the values of DK and d2 were fixed to those of the parent species; Table S7. Observed frequencies (νobs) of the parent species of 2MTP; Table S8. Observed frequencies (νobs) of the 34S isotopologues; Table S9. Observed frequencies (νobs) of the 13C(2) isotopologues; Table S10. Observed frequencies (νobs) of the 13C(3) isotopologues; Table S11. Observed frequencies (νobs) of the 13C(4) isotopologues; Table S12. Observed frequencies (νobs) of the 13C(5) isotopologues; Table S13. Observed frequencies (νobs) of the 13C(9) isotopologues.

Author Contributions

Conceptualization, H.V.L.N.; methodology, H.V.L.N.; validation, J.D. and H.V.L.N.; formal analysis, K.J.K., J.D. and H.V.L.N.; investigation, K.J.K., H.E.H., A.L., N.V., J.D. and H.V.L.N.; resources, H.V.L.N.; data curation, K.J.K., J.D. and H.V.L.N.; writing—original draft preparation, K.J.K., J.D. and H.V.L.N.; writing—review and editing, K.J.K., H.E.H., A.L., N.V., J.D. and H.V.L.N.; visualization, K.J.K. and H.V.L.N.; supervision, A.L. and H.V.L.N.; project administration, H.V.L.N.; funding acquisition, H.V.L.N. All authors have read and agreed to the published version of the manuscript.

Funding

This work was supported by the European Union (ERC 101040480-LACRIDO) and the European project “International Network for a Research and Innovation Staff Exchange” (RISE), Marie Curie Action (call: H2020-MSCA-RISE-2019). However, the views and opinions expressed within the manuscript are those of the authors only and do not necessarily reflect those of the European Union or the European Research Council. Neither the European Union nor the granting authority can be held responsible for them. Part of the simulations were performed with computing resources granted by the RWTH Aachen University under the project rwth0506.

Institutional Review Board Statement

Not applicable.

Informed Consent Statement

Not applicable.

Data Availability Statement

Data are contained within the article and Supplementary Materials.

Acknowledgments

K.J.K. thanks the Université Paris-Est Créteil (UPEC) for a post-doctoral fellowship.

Conflicts of Interest

The authors declare no conflict of interest.

References

  1. Cameron, M.D. Victor Meyer and the Thiophene Compounds. J. Chem. Educ. 1949, 26, 521–524. [Google Scholar] [CrossRef]
  2. Ware, D.N.; Pillai, S. Thiophene: Versatile Medicine. J. Biol. Chem. Chron. 2019, 5, 150–162. [Google Scholar]
  3. Banerjee, R.; Banerjee, M. Medicinal Significance of Furan Derivates: A Review. Int. J. Rev. Life. Sci. 2012, 2, 7–16. [Google Scholar]
  4. Gholap, S.S. Pyrrole: An Emerging Scaffold for Construction of Valuable Therapeutic Agents. Eur. J. Med. Chem. 2016, 110, 13–31. [Google Scholar] [CrossRef] [PubMed]
  5. Katritzky, A.R.; Balasubramanian, M.; Siskin, M. Aqueous High-Temperature Chemistry of Carbo- and Heterocycles. 17. Thiophene, Tetrahydrothiophene, 2-Methylthiophene, 2,5-Dimethilthiophene, Benzo[b]thiophene, and Dibenzothiophene. Energy Fuels 1992, 6, 431–438. [Google Scholar]
  6. Chen, J.; Young, V.G.; Angelici, R.J. Reactions of the Iridathiabenzene Complex Cp*Ir(2,5-dimethylthiophene) with Co2(CO)8, Co4(CO)12, and (η6-C6H3Me3)Co4(CO)9. Organometallics 1996, 15, 1414–1421. [Google Scholar] [CrossRef]
  7. Sokmen, M.; Allen, D.; Hewson, A.; Clench, M. Photocatalytic Oxidative Degradation of 2-Methylthiophene in Suspensions of TiO2: Identification of Intermediates and Degradation Pathways. J. Photochem. Photobiol. A 2001, 141, 63–67. [Google Scholar] [CrossRef]
  8. Pozdeev, N.M.; Latypova, R.G.; Shapkin, A.A. Microwave Spectrum, Internal Rotation, and Dipole Moment of 2-Methyl Thiophene. Opt. Spektrosk. 1970, 28, 254. [Google Scholar]
  9. Pozdeev, N.M.; Latypova, R.G.; Gunderova, L.N. Microwave Spectrum of 2-Methylthiophene in an Excited Torsional State and the Form of the Potential Barrier. J. Struc. Chem. 1976, 17, 313–314. [Google Scholar] [CrossRef]
  10. Tanabe, M.; Kuze, N.; Fujiwara, H.; Takeuchi, H.; Konaka, S. Molecular Structure of 2-Methylthiophene Studied by Gas Electron Diffraction Combined with Microwave Spectroscopic Data. J. Mol. Struct. 1995, 372, 173–180. [Google Scholar]
  11. Bermudez, C.; Motiyenko, R.A.; Cabezas, C.; Ilyushin, V.V.; Margulès, L.; Endo, Y.; Guillemin, J.-C. Internal Rotation Analysis of the Microwave and Millimeter Wave Spectra of Fluoral (CF3CHO). Spectrochim. Acta A 2022, 274, 121071. [Google Scholar] [CrossRef]
  12. Rodríguez, C.; Macario, A.; López, J.C.; Blanco, S. The Conformational Landscape of α-Aminoglycine. J. Mol. Spectrosc. 2022, 387, 111667. [Google Scholar] [CrossRef]
  13. Ma, J.; Insausti, A.; Mort, A.N.; Xu, Y. Rotation-Tunneling Spectra and Barriers of Isotopologues of 2,2,2-Trifluoroethanol and 2,2,3,3,3-Pentafluoropropanol. J. Mol. Spectrosc. 2022, 388, 111687. [Google Scholar] [CrossRef]
  14. Melli, A.; Melosso, M.; Lengsfeld, K.G.; Bizzocchi, L.; Rivilla, V.M.; Dore, L.; Barone, V.; Grabow, J.-U.; Puzzarini, C. Spectroscopic Characterization of 3-Aminosoxazole, a Prebiotic Precursor of Ribonucleotides. Molecules 2022, 27, 3278. [Google Scholar] [CrossRef] [PubMed]
  15. Gougoula, E.; Medcraft, C.; Heitkämper, J.; Walker, N.R. Barriers to Internal Rotation in Methylimidazole Isomers Determined by Rotational Spectroscopy. J. Chem. Phys. 2019, 151, 144301. [Google Scholar] [CrossRef] [PubMed]
  16. Demaison, J.; Vogt, N.; Nguyen, H.V.L. Determination of Rotational Constants in the Presence of Methyl Internal Rotation: 2-Acetylfuran and 2-Acetylthiophene as Examples. Chem. Phys. Lett. 2022, 794, 139488. [Google Scholar] [CrossRef]
  17. Dindić, C.; Lüchow, A.; Vogt, N.; Demaison, J.; Nguyen, H.V.L. Equilibrium Structure in the Presence of Methyl Internal Rotation: Microwave Spectroscopy and Quantum Chemistry Study of the Two Conformers of 2-Acetylfuran. J. Phys. Chem. A 2021, 125, 4986–4997. [Google Scholar] [CrossRef] [PubMed]
  18. Dindić, C.; Ludovicy, J.; Terzi, V.; Lüchow, A.; Vogt, N.; Demaison, J.; Nguyen, H.V.L. Determination of the Semiexperimental Equilibrium Structure of 2-Acetylthiophene in the Presence of Methyl Internal Rotation and Substituent Effects Compared to Thiophene. Phys. Chem. Chem. Phys. 2022, 24, 3804–3815. [Google Scholar] [CrossRef]
  19. Nguyen, H.V.L.; Caminati, W.; Grabow, J.-U. The LAM of the Rings: Large Amplitude Motions in Aromatic Molecules Studied by Microwave Spectroscopy. Molecules 2022, 27, 3948. [Google Scholar] [CrossRef]
  20. Frisch, M.J.; Trucks, G.W.; Schlegel, H.B.; Scuseria, G.E.; Robb, M.A.; Cheeseman, J.R.; Scalmani, G.; Barone, V.; Petersson, G.A.; Nakatsuji, H.; et al. Gaussian 16; Gaussian, Inc.: Wallingford, CT, USA, 2016. [Google Scholar]
  21. Møller, C.; Plesset, M.S. Note on an Approximation Treatment on Many-Electron Systems. Phys. Rev. 1934, 46, 618. [Google Scholar] [CrossRef]
  22. Purvis, G.D., III; Bartlett, R.J. A Full Coupled-Cluster Singles and Doubles Model: The Inclusion of Disconnected Triples. J. Chem. Phys. 1982, 76, 1910–1918. [Google Scholar] [CrossRef]
  23. Raghavachari, K.; Trucks, G.W.; Pople, J.A.; Head-Gordon, M. A Fifth-Orders Perturbation Comparison of Electron Correlation Theories. Chem. Phys. Lett. 1989, 157, 479–483. [Google Scholar] [CrossRef]
  24. Becke, A.D. A New Mixing of Hartree-Fock and Local Density-Functional Theories. J. Chem. Phys. 1993, 98, 1372. [Google Scholar] [CrossRef]
  25. Lee, C.; Yang, W.; Parr, R.G. Development of the Colle-Salvetti Correlation-Energy Formula into a Functional of the Electron Density. Phys. Rev. B 1988, 37, 785. [Google Scholar] [CrossRef] [PubMed]
  26. Perdew, J.P.; Wang, Y. Erratum: Accurate and Simple Analytic Representation of the Electron-Gas Correlation Energy. Phys. Rev. B 1992, 45, 13244. [Google Scholar] [CrossRef]
  27. Zhao, Y.; Truhlar, D.G. The M06 Suite for Density Functionals for Main Group Thermochemistry, Thermochemical Kinetics, Noncovalent Interactions, Excited States, and Transition Elements: Two New Functionals and Systematic Testing of for M06-Class Functionals and 12 Other Functionals. Theor. Chem. Acc. 2008, 120, 215. [Google Scholar]
  28. Chai, J.-D.; Head-Gordon, M. Long-Range Corrected Hybrid Density Functionals with Damped Atom-Atom Dispersion Corrections. Phys. Chem. Chem. Phys. 2008, 10, 6615. [Google Scholar] [CrossRef]
  29. Yu, H.S.; He, X.; Li, S.L.; Truhlar, D.G. MN15: A Kohn-Sham Global-Hybrid Exchange-Correlation Density Functional with Broad Accuracy for Multi-Reference and Single-Reference Systems and Noncovalent Interactions. Chem. Sci. 2016, 7, 5032–5051. [Google Scholar] [CrossRef]
  30. Ernzerhof, M.; Scuseria, G.E. Assessment of the Perdew-Burke-Ernzerhof Exchange-Correlation Functional. J. Chem. Phys. 1999, 110, 5029–5036. [Google Scholar] [CrossRef]
  31. Grimme, S.; Antony, J.; Ehrlich, S.; Georigk, L. Effect of the Damping Function in Dispersion Corrected Density Functional Theory. J. Comput. Chem. 2011, 32, 1456. [Google Scholar] [CrossRef]
  32. Grimme, S.; Antony, J.; Ehrlich, S.; Krieg, H. A Consistent and Accurate Ab Initio Parametrization of Density functional Dispersion Correction (DFT-D) for the 94 Elements, H.-Pu. J. Chem. Phys. 2010, 132, 154104. [Google Scholar] [CrossRef] [PubMed]
  33. Yanai, T.; Tew, D.; Handy, N.C. A New Hybrid Exchange-Correlation Functional Using the Coulomb-Attenuating Method (CAM-B3LYP). Chem. Phys. Lett. 2004, 393, 51–57. [Google Scholar] [CrossRef]
  34. Frisch, M.J.; Pople, J.A.; Binkley, J.S. Self-Consistent Molecular Orbital Methods 25. Supplementary Functions for Gaussian Basis Sets. J. Chem. Phys. 1984, 80, 3265. [Google Scholar]
  35. Dunning, T.H. Gaussian Basis Sets for Use in Correlated Molecular Calculations. I. The Atoms Boron Through Neon and Hydrogen. J. Chem. Phys. 1989, 90, 1007. [Google Scholar]
  36. Kendall, R.A.; Dunning, T.H.; Harrison, R.J. Electron Affinities of the First-Row Atoms Revisited. Systematic Basis Sets and Wave Functions. J. Chem. Phys. 1992, 96, 6796. [Google Scholar]
  37. Peterson, K.A.; Dunning, T.H. Accurate Correlation Consistent Basis Sets for Molecular Core-Valence Correlation Effects: The Second Row Atoms Al-Ar, and the First Row Atoms B-Ne Revisited. J. Chem. Phys 2002, 117, 10548–10560. [Google Scholar] [CrossRef]
  38. Werner, H.-J.; Knowles, P.J.; Knizia, G.; Manby, V.; Schütz, M.; Celani, P.; Györffy, W.; Kats, D.; Korona, T.; Lindh, R.; et al. MOLPRO, Version 2020.1, a Package of ab Initio Programs. Available online: https://www.molpro.net (accessed on 29 March 2023).
  39. Werner, H.-J.; Knowles, P.J.; Manby, F.R.; Black, J.A.; Doll, K.; Heßelmann, A.; Kats, D.; Köhn, A.; Korona, T.; Kreplin, D.A.; et al. The Molpro Quantum Chemistry Package. J. Chem. Phys. 2020, 152, 144107. [Google Scholar] [CrossRef]
  40. Kraitchman, J. Determination of Molecular Structure from Microwave Spectroscopic Data. Am. J. Phys. 1953, 21, 17–24. [Google Scholar] [CrossRef]
  41. Costain, C.C. Further Comments on the Accuracy of rs Substitution Structures. Trans. Am. Crystallogr. Assoc. 1966, 2, 157. [Google Scholar]
  42. Demaison, J.; Vogt, N. Accurate Structure Determination of Free Molecules; Springer Nature Switzerland AG: Cham, Switzerland, 2020. [Google Scholar]
  43. Grabow, J.-U.; Stahl, W.; Dreizler, H. A Multioctave Coaxially Oriented Beam-Resonator Arrangement Fourier-Transform Microwave Spectrometer. Rev. Sci. Instrum. 1996, 67, 4072. [Google Scholar] [CrossRef]
  44. Hartwig, H.; Dreizler, H. The Microwave Spectrum of Trans-2,3-Dimethyloxirane in Torsional Excited States. Z. Naturforsch. 1996, 51a, 923–932. [Google Scholar] [CrossRef]
  45. Watson, J.K.G. Aspects of Quartic and Sextic Centrifugal Effects on Rotational Energy Levels. In Vibrational Spectra and Structure; Durig, J.R., Ed.; Elsevier: New York, NY, USA, 1977; Volume 6, pp. 1–89. [Google Scholar]
  46. Vázquez, J.; Stanton, J.F. Semiexperimental Equilibrium Structures: Computational Aspects. In Equilibrium Molecular Structures: From Spectroscopy to Quantum Chemistry; Demaison, J., Boggs, J.E., Császár, A.G., Eds.; CRC Press: Boca Raton, FL, USA, 2011; pp. 53–87. [Google Scholar]
  47. Dindić, C.; Stahl, W.; Nguyen, H.V.L. 2-Propionylthiophene: Planar, or Not Planar, That is the Question. Phys. Chem. Chem. Phys. 2020, 22, 19704. [Google Scholar] [CrossRef]
  48. Hakiri, R.; Derbel, N.; Bailey, W.C.; Nguyen, H.V.L.; Mouhib, H. The Heavy Atom Structures and 33S Quadrupole Coupling Constants of 2-Thiophenecarboxaldehyde: Insights from Microwave Spectroscopy. Mol. Phys. 2020, 118, e1728406. [Google Scholar] [CrossRef]
  49. Demaison, J.; Boggs, J.E.; Császár, A.G. The Method of Least Squares. In Equilibrium Molecular Structures; CRC Press: Boca Raton, FL, USA, 2010. [Google Scholar]
  50. Belsey, D.A. Conditioning Diagnostics; Wiley: New York, NY, USA, 1991; pp. 298–299. [Google Scholar]
  51. Bartell, L.S.; Romanesko, D.J.; Wong, T.C. Chemical Society Specialist Periodical Report No. 20; Sim, G.A., Sutton, L.E., Eds.; The Chemical Society: London, UK, 1975; Volume 3, pp. 72–79. [Google Scholar]
  52. Hamilton, L. Regression with Graphics: A Second Course in Applied Statistics; Duxbury Press, Wadsworth: Belmont, CA, USA, 1992. [Google Scholar]
  53. Kummli, D.S.; Frey, H.M.; Leutwyler, S. Femtosecond Degenerate Four-Wave Mixing of Carbon Disulfide: High-Accuracy Rotational Constants. J. Chem. Phys. 2006, 124, 144307. [Google Scholar] [CrossRef] [PubMed]
  54. Kummli, D.S.; Lobsiger, S.; Frey, H.-M.; Leutwyler, S.; Stanton, J.F. Accurate Determination of the Structure of Cyclooctatetraene by Femtosecond Rotational Coherence Spectroscopy and Ab Initio Calculations. J. Phys. Chem. A 2008, 112, 9134–9143. [Google Scholar] [CrossRef] [PubMed]
  55. Kyker, G.C. The Range of a Data Set: A Quick Estimator of the Standard Deviation. Am. J. Phys. 1983, 51, 852. [Google Scholar] [CrossRef]
  56. Orr, V.L.; Ichikawa, Y.; Patel, A.R.; Kougias, A.M.; Kobayashi, K.; Stanton, J.F.; Esselman, B.J.; Woods, R.C.; McMahon, R.J. Precise Equilibrium Structure Determination of Thiophene (c-C4H4S) by Rotational Spectroscopy-Structure of a Five-Membered Heterocycle Containing a Third-Row Atom. J. Chem. Phys. 2021, 154, 244310. [Google Scholar] [CrossRef]
  57. Kisiel, Z. Prospe—Programs for Rotational Spectroscopy. Available online: http://info.ifpan.edu.pl/~kisiel/prospe.htm (accessed on 29 March 2023).
  58. Esselman, B.J.; Kougias, S.M.; Fellows, M.D.; Woods, R.C.; McMahon, R.J. The 130-360 GHz Rotational Spectrum of Isocyanocyclobutane (C4H7NC) and Cyanocyclobutane (C4H7CN). J. Mol. Spectrosc. 2022, 388, 111684. [Google Scholar] [CrossRef]
  59. Esselman, B.J.; Zdanovskaia, M.A.; Smith, H.H.; Woods, R.C.; McMahon, R.J. The 130–500 GHz Rotational Spectroscopy of Cyanopyrazine (C4H3N2-CN). J. Mol. Spectrosc. 2022, 389, 111703. [Google Scholar] [CrossRef]
  60. Owen, A.N.; Zdanovskaia, M.A.; Esselman, B.J.; Stanton, J.F.; Woods, R.C.; McMahon, R.J. Semi-Experimental Equilibrium (reSE) and Theoretical Structures of Pyradizine (o-C4H4N2). J. Phys. Chem. A 2021, 125, 7976–7987. [Google Scholar]
  61. Esselman, B.J.; Zdanovskaia, M.A.; Owen, A.N.; Stanton, J.F.; Woods, R.C.; McMahon, R.J. Precise Equilibrium Structure of Thiazole (c-C3H3NS) from Twenty-Four Isotopologues. J. Chem. Phys. 2021, 155, 054302. [Google Scholar] [CrossRef]
  62. Gillespie, R.J.; Popelier, P.L.A. Chemical Bonding and Molecular Geometry; Oxford University Press: Oxford, UK, 2001. [Google Scholar]
  63. Marenich, A.V.; Jerome, S.V.; Cramer, C.J.; Truhlar, D.G. Charge Model 5: An Extension of Hirshfeld Population Analysis for the Accurate Description of Molecular Interactions in Gaseous and Condensed Phases. J. Chem. Theory Comput. 2012, 8, 527. [Google Scholar] [CrossRef]
  64. Demaison, J.; Craig, N.C.; Gurusinghe, R.; Tubergen, M.J.; Rudolph, H.D.; Coudert, L.H.; Szálay, P.G.; Császár, A.G. Fourier Transform Microwave Spectrum of Propene-3-d1 (CH2=CHCH2D), Quadrupole Coupling Constants of Deuterium, and a Semiexperimental Equilibrium Structure of Propene. J. Phys. Chem. A 2017, 121, 3155–3166. [Google Scholar] [CrossRef]
  65. Stoicheff, B. The Variation of Carbon-Carbon Bond Lengths with Environment as Determined by Spectroscopic Studies of Simple Polyatomic Molecules. Tetrahedron 1962, 17, 135–145. [Google Scholar] [CrossRef]
  66. Kuchitsu, K. Gas Electron Diffraction. In Molecular Structure and Properties; Allen, G., Ed.; Butterworth: Baltimore, MD, USA, 1972; pp. 203–240. [Google Scholar]
  67. Van, V.; Stahl, W.; Nguyen, H.V.L. Two Equivalent Methyl Internal Rotations in 2,5-Dimethylthiophene Investigated by Microwave Spectroscopy. Phys. Chem. Chem. Phys. 2015, 17, 32111–32114. [Google Scholar] [CrossRef]
  68. Dindić, C.; Nguyen, H.V.L. Benchmarking Acetylthiophene Derivates: Methyl Internal Rotations in the Microwave Spectrum of 2-Acetyl-5-Methylthiophene. Phys. Chem. Chem. Phys. 2023, 25, 509–519. [Google Scholar] [CrossRef]
  69. Finneran, I.A.; Shipman, S.T.; Weaver, S.L.W. Rotational Spectroscopy of 2-Methylfuran from 8.7 to 960 GHz. J. Mol. Spectrosc. 2012, 280, 27–33. [Google Scholar] [CrossRef]
  70. Van, V.; Bruckhuisen, J.; Stahl, W.; Ilyushin, V.; Nguyen, H.V.L. The Torsional Barriers of Two Equivalent Methyl Internal Rotations in 2,5-Dimethylfuran Investigated by Microwave Spectroscopy. J. Mol. Spectrosc. 2018, 343, 121–125. [Google Scholar] [CrossRef]
  71. Van, V.; Stahl, W.; Nguyen, H.V.L. The Structure and Torsional Dynamics of Two Methyl Groups in 2-Acetyl-5-Methylfuran as Observed by Microwave Spectroscopy. Chem. Phys. Chem. 2016, 17, 3223–3228. [Google Scholar] [CrossRef] [PubMed]
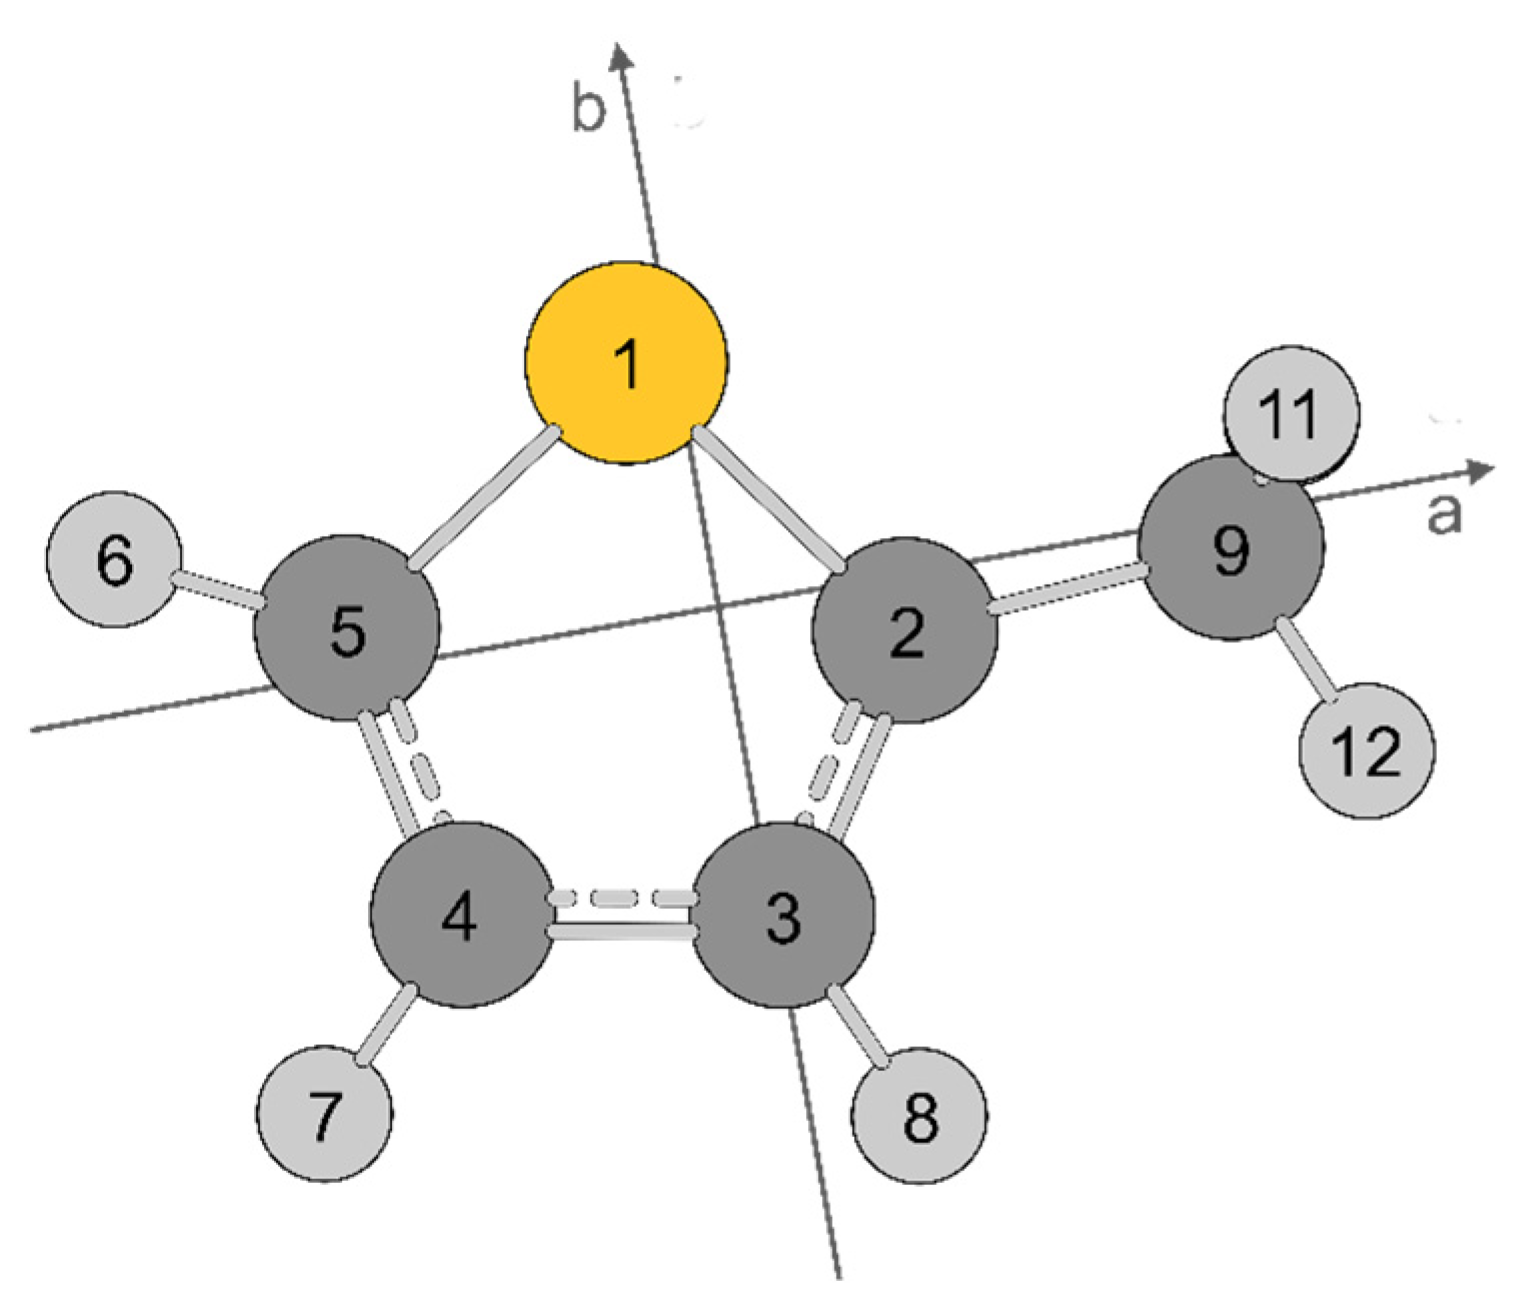
Figure 1. Geometry of 2MTP in the principal axis system optimized at the MP2/6-311++G(d,p) level of theory, including atomic labeling. H(10) lies behind H(11). The hydrogen atoms are in light gray, the carbon atoms are in dark gray, and the sulfur atom is yellow.
Spectroscj 01 00005 g001
Figure 2. Potential energy curves of 2MTP by varying the dihedral angle α = ∠(C3–C2–C9–H12) in steps of 10° while other geometry parameters were optimized at the MP2/6-311++G(d,p) (blue curve) and B3LYP-D3BJ/6-311++G(d,p) (black curve) levels of theory. Energies are given relative to the energy minimum (EMP2 = −591.2452610 Hartree, EB3LYP = −592.4225408 Hartree).
Spectroscj 01 00005 g002
Figure 3. Four high-resolution spectra of the b-type Q-branch 211 ← 202 and 615 ← 606 transitions of 2MTP. The Doppler splittings are connected by brackets. The transition frequencies are indicated and marked by the corresponding torsional species. The A–E torsional splittings are 5.1890 MHz and 24.3878 MHz, respectively, showing that the A–E splitting depends on the J and Ka quantum numbers. For the spectra from lower to higher frequencies, 32, 17, 28, and 40 free-induction decays (FIDs) were co-added. The polarization frequencies are marked with red lines. Intensities are given in arbitrary units and normalized for all spectra.
Spectroscj 01 00005 g003
Figure 4. Comparison of the r e S E ∠(S–C2=C3) angle (purple, in degree) and bond lengths (blue, in Å) of 2MTP (this work) with thiophene [18] and the syn-conformers of 2-acetylthiophene (2AT) [18] and 2-thiophenecarboxaldehyde (2TPC) [48].
Spectroscj 01 00005 g004
Figure 5. Comparison of the V3 potential (in cm−1) of methyl groups at the 2-position of thiophene or furan derivatives (marked in blue). (1) 2MTP (this work), (2) 2,5-dimethylthiophene [67], (3) syn-2-acetyl-5-methylthiophene [68], (4) 2-methylfuran [69], (5) 2,5-dimethylfuran [70], (6) syn-2-acetyl-5-methylfuran [71].
Spectroscj 01 00005 g005
Table 1. Optimized structures of 2MTP (distances in Å, angles in degree).
r e  a r e SE  b r e SE  c r e SE  d r e SE  e r s  f
cc-pwCVTZcc-pwCVQZIIIIIIIV
C5–S1.71891.71461.7135(3)1.7137(4)1.7139(4)1.721(77)1.7314(79)
C4–C51.36531.36401.3633(5)1.3637(1)1.3628(6)1.3676(75)1.3654(75)
C3–C41.42641.42461.4268(7)1.4242(2)1.4267(7)1.428(30)1.428(35)
C2–C31.36771.36661.3651(5) 1.3654(75)1.3676(75)
C2–S1.72721.72251.7219(1)1.7215(5)1.7221(2)1.7253(67)1.7158(70)
C2–C91.49691.49531.49434(6)1.4950(1)1.49434(6)1.5083(22)1.5108(22)
C9–Ha1.09041.08961.090(1)1.08942(8)1.089(1)
C9–Hs1.08911.08831.089(2)1.08817(7)1.089(2)
C5–H61.07701.07651.078(2)1.07634(5)1.077(2)
C4–H71.07961.07901.081(2)1.07882(6)1.081(2)
C3–H81.08071.08011.081(2)1.07992(6)1.081(2)
S–C5–C4111.449111.377111.37(1)111.362(7)111.39(2)111.32(22)111.24(22)
C3–C4–C5112.349112.348112.354(7)112.34788(5)112.359(8)112.36(25)112.57(30)
C2–S–C392.36492.51692.55(1)92.55(1)92.52(3)92.66(27)91.64(27)
S–C2–C9121.316121.358121.303(8)121.367(4)121.298(8)121.63(67)121.75(57)
Ha–C9–C2111.593111.574111.6(1)111.570(2)111.6(1)
Hs–C9–C2109.498109.490109.4(3)109.4883(8)109.42(2)
H6–C5–S120.361120.346120.6(3)120.343(1)120.6(3)
H7–C4–C5123.468123.444123.5(2)123.439(2)123.5(2)
H8–C3–C4124.087124.122123.5(2)124.129(3)123.6(3)
Ha–C9–C2–S60.35360.35060.1(1)60.3495(2)60.2(1)
a Both basis sets are combined with the CCSD(T)_ae method. b Using the CCSD(T)_ae/cc-pwCVQZ values as predicates. The errors are with 1σ uncertainties. c Extrapolation of the CCSD(T) structure using the semiexperimental rotational constants. d Using the extrapolated structure as predicates. e Using Kraitchman’s equations [40] with experimental ground state rotational constants corrected with only cubic force field obtained at the MP2/6-311++G(d,p) level of theory. Errors are estimated with Costain’s rule [41]. f Substitution structure using Kraitchman’s equations with experimental ground state rotational constants without any correction.
Table 2. Molecular parameters of 2MTP for all observed isotopologues obtained with the XIAM program, including the rotational constants A, B, C, the centrifugal distortion constants DJ, DJK, DK, d1, d2, and the V3 potential. For atom numbering, see Figure 1.
Par aUnitParent34S13C(2)13C(3)13C(4)13C(5)13C(9)
A0MHz5299.85002(45)5161.33031(63)5296.47565(86)5194.52016(96)5232.18924(71)5297.71936(65)5298.8233(15)
B0MHz3114.09632(30)3112.72380(44)3101.70161(38)3114.13512(38)3078.91352(30)3064.14021(29)3015.87188(63)
C0MHz1985.26582(21)1964.94486(32)1979.75497(20)1970.31198(19)1961.46901(20)1964.55468(18)1944.73180(31)
DJkHz0.1659(41)0.1625(75)0.1461(76)0.1397(73)0.1471(64)0.1584(60)0.126(11)
DJKkHz1.1631(57)1.135(11)1.330(74)1.100(79)1.170(50)1.245(45)1.39(12)
DKkHz0.252(15)0.214(31)0.252 b0.252 b0.252 b0.252 b0.252 b
d1kHz−0.06917(83)−0.0703(13)−0.0633(41)−0.0522(41)−0.0588(28)−0.0633(28)−0.0526(68)
d2kHz−0.02293(29)−0.02415(50)−0.02293 b−0.02293 b−0.02293 b−0.02293 b−0.02293 b
V3cm−1197.7324(18)197.5735(27)197.8327(16)197.8717(15)197.6937(15)197.7704(14)197.8801(24)
D p i 2 J kHz−14.93(65)−18.25(97)−14.31(44)−14.09(39)−14.24(44)−14.310(40)−12.61(62)
D p i 2 K kHz−296.9(19)−286.49(28)−298.2(35)−278.0(32)−288.1(31)−294.9(26)−347.7(55)
D p i 2 kHz8.22(46)7.36(71)8.22 b8.22 b8.22 b8.22 b8.22 b
∠(i,a)deg3.678(23)4.013(32)3.871(18)3.712(17)2.313(27)3.976(16)3.898(27)
∠(i,bcdeg86.322(23)85.987(32)86.129(18)86.288(17)87.687(27)86.024(16)86.102(27)
c  d2−3.079855(50)−3.077964(76)−3.080517(60)−3.079360(62)−3.079026(54)−3.080329(50)−3.07801(11)
N  e 1481275147555442
σ  fkHz4.45.62.82.52.92.63.8
a All parameters refer to the principal axis system. Watson’s S reduction in Ir representation was used. Standard error in parentheses is in the units of the last significant digits. b Value fixed to that of the parent species. c Derived from the fitted parameter δ, ∠(i,c) was fixed to 90° due to symmetry. d Inertial defect, IcIaIb. e Number of lines. f Standard deviation of the fit.
Table 3. Corrections to the ground state rotational constants and semiexperimental equilibrium rotational constants (in MHz). For atom numbering, see Figure 1.
Isotopologueξ B e ξ Exp−calc a Δ B vib ξ Δ B elec ξ
Parenta5331.4578−0.000431.4350.1728
b3134.16320.004719.9650.1019
c1998.10470.000912.855−0.0161
34S(1)a5191.7574−0.024430.2630.1639
b3132.69540.004219.870.1018
c1977.57400.000112.645−0.0158
13C(2)a5225.53640.000430.8470.1693
b3134.0950−0.006719.8580.1019
c1983.0151−0.001312.719−0.0159
13C(3)a5329.1650−0.024131.2750.1706
b3083.82880.001919.5900.0987
c1977.2129−0.002212.674−0.0158
13C(4)a5263.0555−0.000130.6990.1672
b3098.7631−0.003619.7500.0996
c1974.11430.000312.661−0.0157
13C(5)a5327.83730.000131.1890.1727
b3121.4697−0.000519.6670.1011
c1992.43300.000012.694−0.0160
13C(9)a5330.42160.000031.4290.1683
b3035.07350.000019.1070.0956
c1957.22530.000012.509−0.0155
a Residuals of the fit using the CCSD(T)_ae/cc-pwCVQZ values as predicates.
Disclaimer/Publisher’s Note: The statements, opinions and data contained in all publications are solely those of the individual author(s) and contributor(s) and not of MDPI and/or the editor(s). MDPI and/or the editor(s) disclaim responsibility for any injury to people or property resulting from any ideas, methods, instructions or products referred to in the content.