Article

Development of Interface-Specific Two-Dimensional Vibrational–Electronic (i2D-VE) Spectroscopy for Vibronic Couplings at Interfaces

by
Yuqin Qian
,
Zhi-Chao Huang-Fu
,
Jesse B. Brown
and
Yi Rao
*
Department of Chemistry and Biochemistry, Utah State University, Logan, UT 84322, USA
*
Author to whom correspondence should be addressed.
These authors contributed equally to this work.
Spectrosc. J. 2025, 3(1), 1; https://doi.org/10.3390/spectroscj3010001
Submission received: 2 December 2024 / Revised: 24 December 2024 / Accepted: 28 December 2024 / Published: 3 January 2025

Abstract

:
Bulk 2D electronic–vibrational (2D-EV) and 2D vibrational–electronic spectroscopies (2D-VE) were previously developed to correlate the electronic and vibrational degrees of freedom simultaneously, which allow for the study of couplings between electronic and vibrational transitions in photo-chemical systems. Such bulk-dominated methods have been used to extensively study molecular systems, providing unique information such as coherence sensitivity, molecular configurations, enhanced resolution, and correlated states and their dynamics. However, the analogy of interfacial 2D spectroscopy has fallen behind. Our recent work presented interface-specific 2D-EV spectroscopy (i2D-EV). In this work, we develop interface-specific two-dimensional vibrational–electronic spectroscopy (i2D-VE). The fourth-order spectroscopy is based on a Mach–Zehnder IR interferometer that accurately controls the time delay of an IR pump pulse pair for vibrational transitions, followed by broadband interface second-harmonic generation to probe electronic transitions. We demonstrate step-by-step how a fourth-order i2D-VE spectrum of AP3 molecules at the air/water interface was collected and analyzed. The line shape and signatures of i2D-VE peaks reveal solvent correlations and the spectral nature of vibronic couplings. Together, i2D-VE and i2D-EV spectroscopy provide coupling of different behaviors of the vibrational ground state or excited states with electronic states of molecules at interfaces and surfaces. The methodology presented here could also probe dynamic couplings of electronic and vibrational motions at interfaces and surfaces, extending the usefulness of the rich data that are obtained.

1. Introduction

Nonlinear optical/IR coherent multidimensional spectroscopy (CMDS) methods, akin to multidimensional nuclear magnetic resonance (NMR), have been proven to be powerful tools for materials science, biological systems, catalysis, energy conversion, etc. [1,2,3,4,5,6,7]. CMDS techniques rely on multiple incident laser pulses to excite multiple quantum states and measure relationships between the excited modes, as well as changes in the states, in electronic or vibrational domains [8]. The essential feature of these techniques which makes them applicable to modern chemistry is their coherent nature, which can provide information about correlations between states that linear optical methods are not sensitive to [9]. For example, CMDS was used to investigate amyloid processes, where it identified an unknown intermediate connected to fibril formation, which can lead to diseases such as diabetes [10]. Such multidimensional methods have also been used to thoroughly characterize the semiconducting character of carbon nanotubes by the ultrafast monitoring of competing pathways which were dependent or independent of the bandgap [11]. CMDS has been used to extensively study molecular aggregates, providing unique information that cannot be obtained with other methods such as enhanced resolution, coherence sensitivity, correlations between electronic states in aggregates, dynamics monitoring, and molecular configurations [12]. In other examples, it has been used to monitor the structure and dynamics of electronic couplings [13], as well as biological hydrogen-boned frameworks and vibrations of small anions [14] and solvation complexes including chemical exchange and water dynamics [15]. More recently, CMDS uncovered intense vibrational couplings which were the result of intensity borrowing [16]. Specific examples of CMDS are two-dimensional electronic spectroscopy (2D-ES) [12,17,18,19,20,21] and two-dimensional infrared spectroscopy (2D-IR) [15,22,23,24,25,26]. The first 2D-ES spectra were presented by Hyib et al. in 1998 [17], based on work presented in 1985 demonstrating the fundamental process [27]. The analogous 2D-IR experiments were presented in the same year by Hamm et al., using IR radiation to excite and investigate the structure of the amide-I band in peptides [28]. These 2D experiments solve the problem in time-resolved techniques, where experimenters have to choose between high spectral or temporal resolution [29]. Two-dimensional spectroscopies excite the sample with a pump pulse pair that forms an interference pattern controlled by their relative time delay to enhance the spectral resolution of the excitation frequency. By plotting the data in a 2D map with excitation and detection frequencies on horizontal or vertical axes, correlations between multiple resonances are then formed.
To correlate the electronic and vibrational degrees of freedom simultaneously, 2D electronic–vibrational spectroscopy (2D-EV) and 2D vibrational–electronic spectroscopy (2D-VE) were developed, which allow for the study of couplings between electronic and vibrational transitions in photo-chemical and photo-biochemical systems. 2D-EV was first presented in 2014 by Oliver et al., where the third-order nonlinear process was utilized to correlate electronic and nucleic dynamics, where sub-ps electronic dynamics drive the longer-lived nuclear motions [30]. For the study of bulk media, Khalil et al. investigated mode-dependent vibronic coupling strengths in a transition metal mixed valence compound using 2D-VE spectroscopy [31,32]. Notably, 2D-VE spectra exhibit different vibronic signal pathways compared to 2D-EV spectra [32]. This is because 2D-EV probes vibrations after electronic excitation, while 2D-VE probes electronic states after vibrational excitation. Interestingly, the signals observed in 2D-VE spectroscopy appear to be less sensitive to quadratic vibronic coupling and more sensitive to linear vibronic coupling [33,34,35]. As compared with those 2D techniques in bulk, interface-specific 2D techniques are under-developed.
Recently we have extended 2D-EV into interface-specific two-dimensional electronic–vibrational spectroscopy (i2D-EV) for studies of vibrational couplings, orientational couplings, and solvation dynamics at interfaces [36,37,38]. In the first implementation, i2D-EV was realized using a translating wedge-based identical pulse encoding system (TWINS) system to shape the incident electronically resonant pump pulse pair, which was tedious to align and resulted in extensive data acquisition times on the order of several hours [36]. Nevertheless, these pioneering investigations using i2D-EV directly measured vibronic coupling in dye molecules at the air/water interface, identifying strong coupling between locally excited states and high-frequency modes [37,38,39]. Further analysis of the air/water interface using the improved i2D-EV showed that vibronic coupling was more prevalent at the interface compared to the bulk, as analyzed by traditional 2D-EV. Using these two complementary techniques, the relative orientations of coupled vibrational and electronic degrees of freedom were determined, and it was found that the different solvent conditions of the two regions significantly affect the coupled modes’ orientations [37]. While these developments shed light on interfacial vibronic couplings, they do so in one direction by pumping the electronic modes and measuring the subsequent vibrational dynamics. As a result, EV techniques are often probing vibrational transitions in the excited electronic state, not the ground electronic state. A more complete picture can be developed of these important photochemical processes by analyzing the structure and dynamics in both EV and VE directions.
Here, we extend the interface-specific 2D technique for studies of surfaces and interfaces to so-called interface-specific two-dimensional vibrational–electronic spectroscopy(i2D-VE). Like i2D-EV, 2D vibrational–electronic SHG is an interface-/surface-specific 2D Fourier transformation (2D-FT) spectroscopy that directly provides information on the couplings between electronic and vibrational transitions. We provide a step-by-step process for analyzing the rich data using an azo dye molecule at the air/water interface as an example. The line shape of the i2D-VE peaks reveal solvent correlations and the spectral nature of vibronic couplings, and the further implementation of the method will provide a more robust viewpoint for understanding dynamic vibronic coupling at surfaces and interfaces.

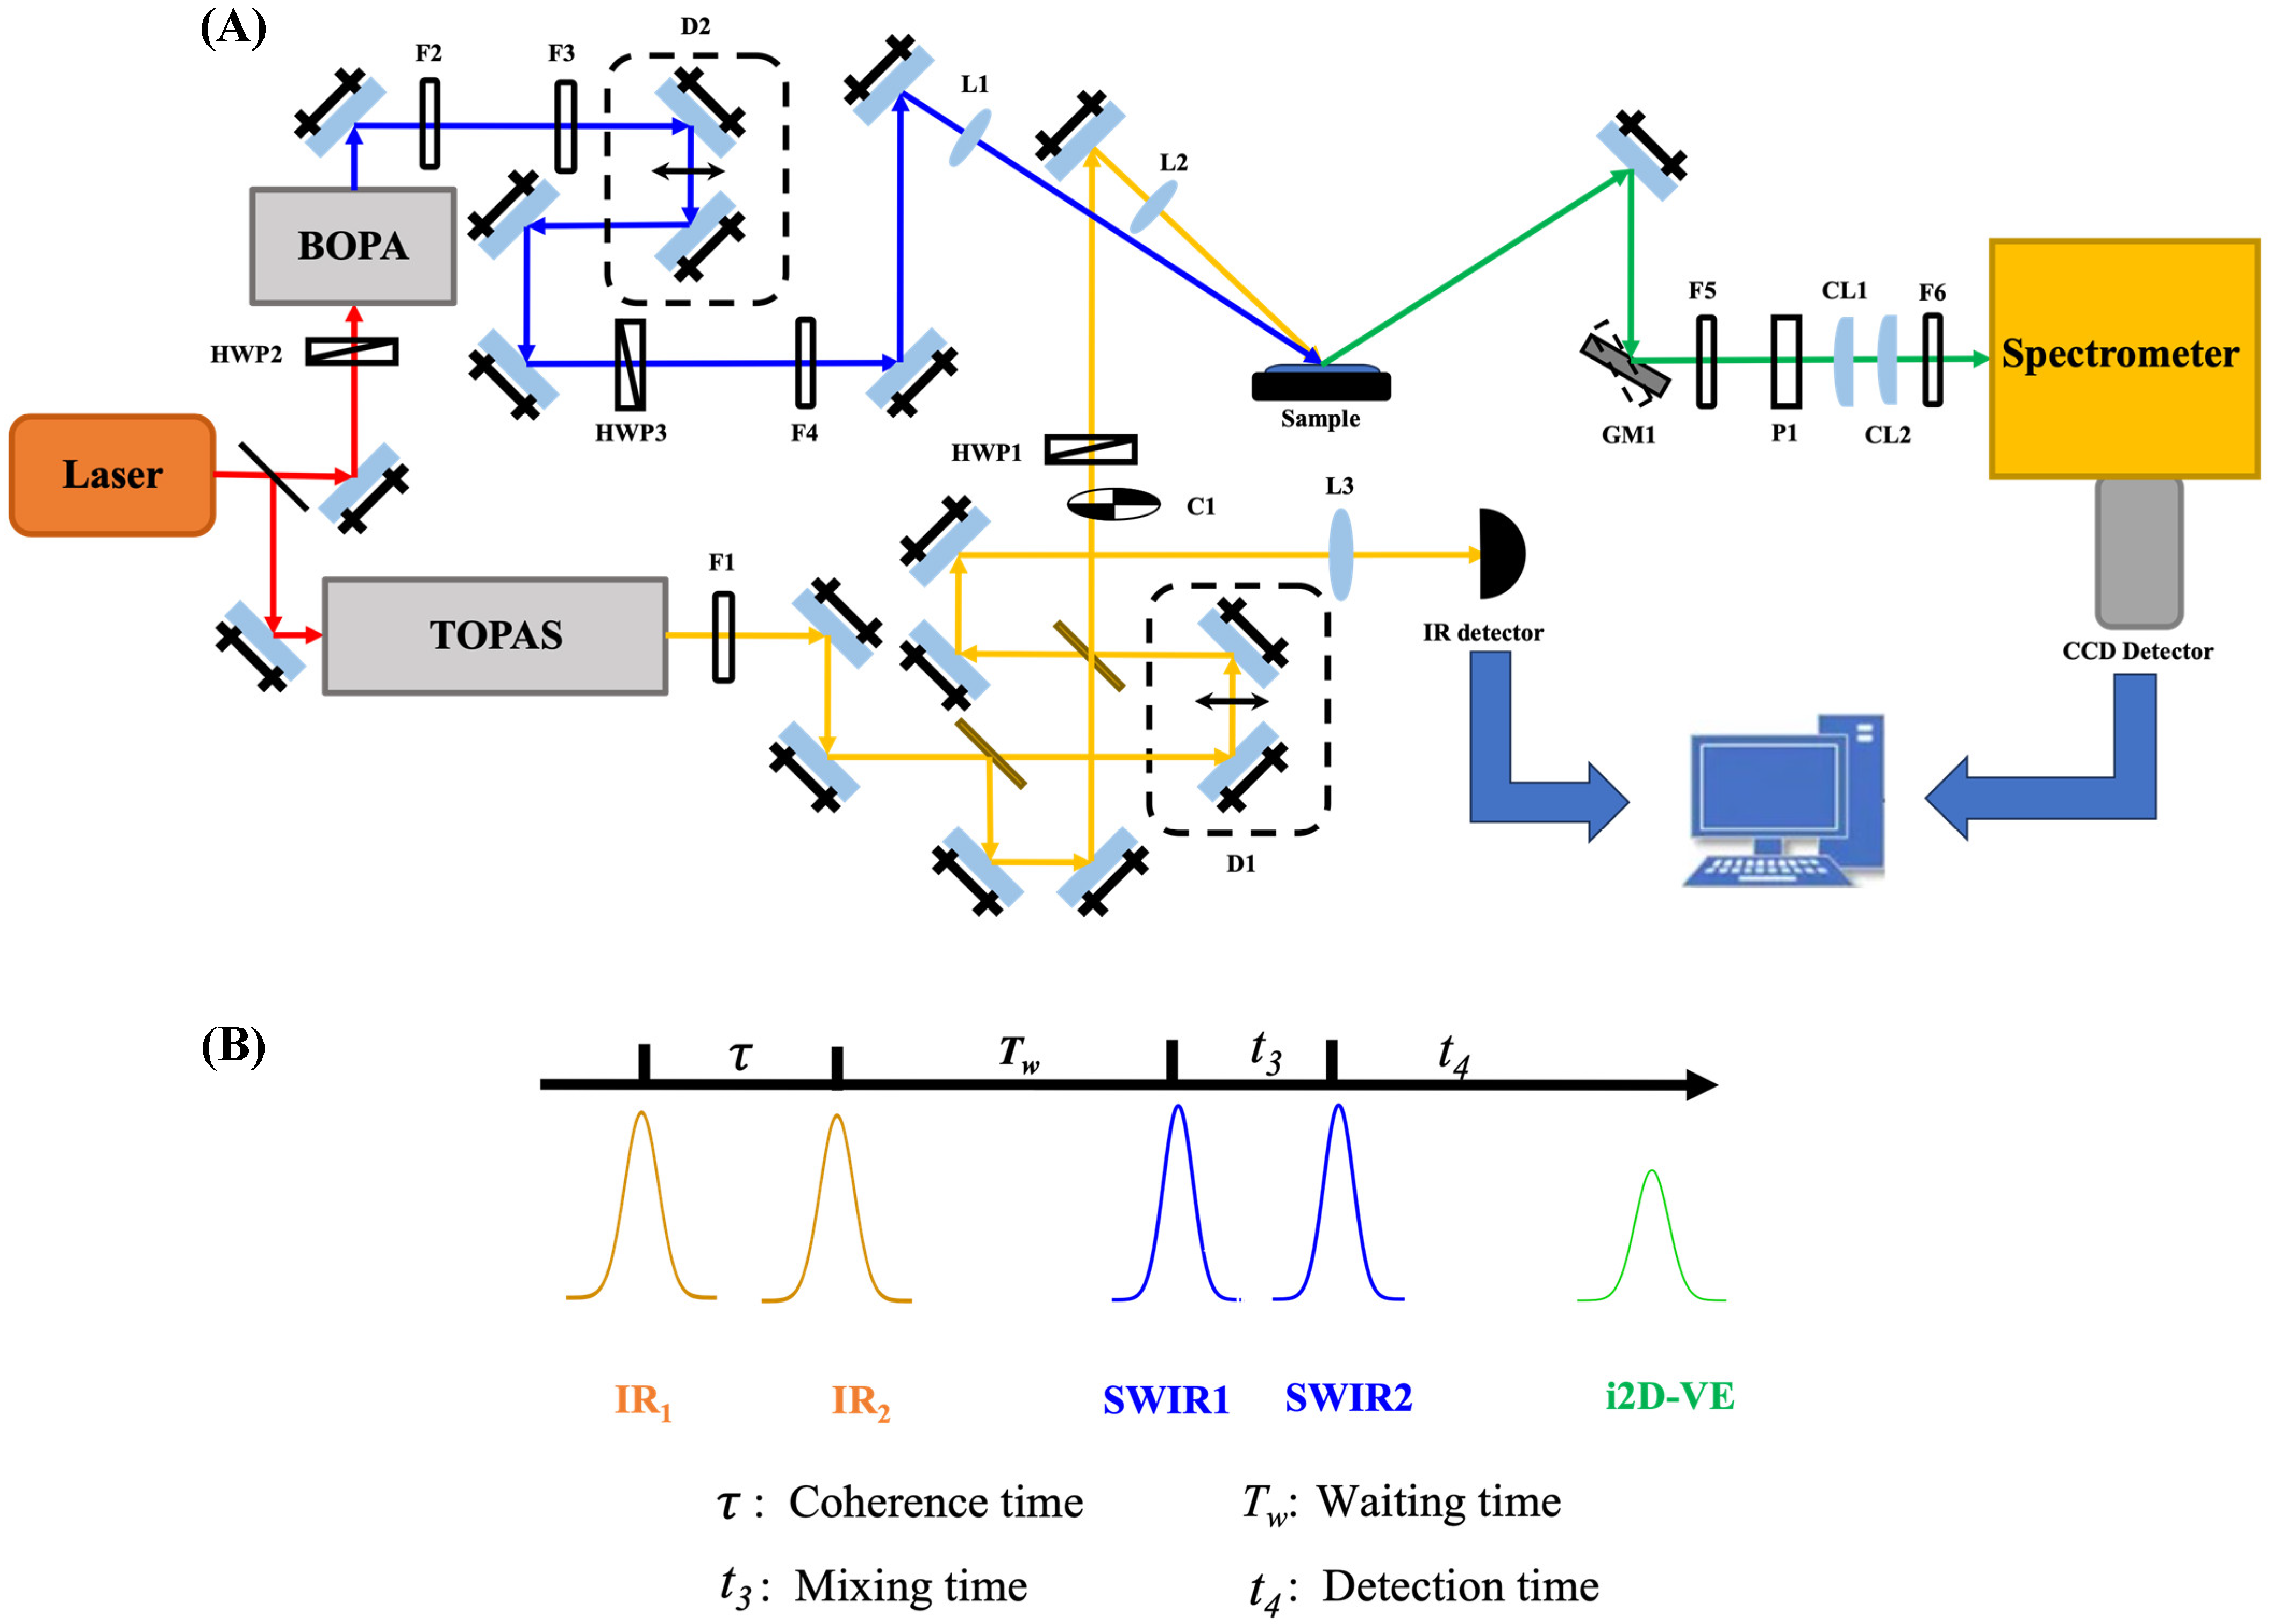
2. Materials and Methods

Laser systems: A Ti/sapphire regenerative amplifier (UpTek Solutions, Bohemia, New York, United States, 800 nm, 100 fs, ∼4.0 mJ, 1 kHz repetition rate) was used to generate a mid-IR pump and a broadband short-wave IR (SWIR) beam, as shown in Figure 1A. Specifically, a portion of 3.0 mJ from the fundamental 800 nm was used to pump a collinear optical parametric amplifier (TOPAS, Light Conversion, Vilnius, Lithuania) with a AgGaS2 difference frequency generation (DFG) crystal, producing tunable mid-IR pulses. The mid-IR pulse, chosen using a 4500 nm long-pass filter (F1), was then directed into a home-built Mach–Zehnder interferometer with two 50/50 CaF2 beam splitters and the transmitted pulses from the second beam splitter were used for the i2D-VE experiments. A programable motorized translational stage (D1, Klinger, Artisan Technology Group, Champaign, Illinois, United States) inside the interferometer was used to precisely control the delay between the mid-IR pulses from the two arms, which corresponds to the coherence time, τ . For this experiment, the mid-IR pulse was tuned to 6000 nm with a full width at half maximum (FWHM) of ca. 200 cm−1. The mid-IR pulse pair was regulated with a chopper (C1) and a half-wave plate (HWP1). The rest of the fundamental light (1 mJ) was polarization-controlled (HWP2) and used to pump a home-built broadband optical parametric amplifier (BOPA) for the SWIR pulse. Residual light from the BOPA was filtered out with an 800 nm long-pass filter (F2) and a 1000 nm Si long-pass filter (F3). A detailed description of the BOPA has been made in our previous work [40,41]. An ultra-broadband SWIR pulse tunable from 1200 to 2400 nm with an energy of 30 μJ and duration of ~200 fs was generated. A programable motorized translational stage (D2, ILS150BPP, Newport Corporation, Irvine, California, United States) was used to control the time delay, Tw, between the pump pulse pair and the SWIR pulse. The SWIR pulse was regulated before incidence on the sample with a half-wave plate (HWP3) and a 1600 nm short-pass filter (F4).
i2D-VE experimental layout: A reflection geometry was used for i2D-VE experiments, as shown in Figure 1B. All pulses were aligned into one incident plane. The SWIR of 1.5 µJ was focused onto sample surfaces with a spot diameter of 40 µm by a 10 cm focal length quartz lens (L1) at an incident angle of 60° relative to the surface normal. The mid-IR pump pair was focused by a 7.5 cm focal length BaF2 lens (L2) to a spot diameter of 60 µm at an incident angle of 45°and spatially overlapped with the SWIR probe. The polarizations of the i2D-VE, SWIR, and pump pair pulses were controlled with P1, HWP3, and HWP1 and set to be p-, p-, and p-polarized, respectively. p-polarized light is defined to be parallel to the incident plane.
Detection system: The detection system was similar to those reported previously [37,38,40,41]. Briefly, a single-axis Galvo mirror (GM1, Thorlabs, Newton, NJ, United States) synchronized with a chopper (C1) rotated up and down at an angle of 1.5° and a frequency of 500 Hz to vertically separate the signals with and without the pump. A 785 nm short-pass filter (F5) was placed before the polarizer (P1). With a vertically focal cylindrical lens of 25 cm (CL1) for spatial separation and a horizontally focal cylindrical lens of 10 cm (CL2) for spectral resolution, pump-on and pump-off signals were imaged into two spatially separated strips on a charge-coupled device (CCD) detector chip. For each experimental step, the normalized intensity difference was calculated and averaged for 5000 total shots (5 s). A spectrometer (Kymera 328i-C, Andor Technology, Bristol, United Kingdom) fitted with a 750 nm short-pass prefilter (F6) and a thermally cooled CCD (iDus DU420A-BVF, 1024 × 255, Andor Technology) was used to collect the spectra. Two 780 nm short-pass filters (Thorlabs) were used to remove the fundamental light and other light from the surroundings before the spectrometer. Andor Solis software version 4.31 from Andor Technology and a self-compiled LabVIEW program version 5.1 [42] were used to implement data acquisition for i2D-VE experiments.
Tracking the interference of IR pump pulse pairs: The reflected pulses from the second beam splitter in the home-built Mach–Zehnder interferometer were routed and focused (L3) onto a liquid nitrogen-cooled mercury cadmium telluride (MCT) IR detector (MCT-13-4.0, Infrared Associates, Inc., Stuart, Florida, United Sates) with a preamplifier (MCT-1000, Infrared Systems Development Corporation, Winter Park, Florida, United States) during the i2D-VE experiments. The interference signal from the IR pulses synchronized with the i2D-VE signal was collected for each coherence time to track the accuracy and precision of the stage.
Chemicals: [(E)-4-((4-(dihexylamino) phenyl)diazinyl)-1-methylpyridin-1-lum] (AP3) was used in our experiments. The chemical structure, synthesis, and characterization of AP3 were described in our early work [36,39].

3. Results

i2D-VE is a fourth-order nonlinear spectroscopy that involves four field-matter interactions. These interactions include two mid-IR pump pulses, initiating a coherent superposition of the ground and excited vibrational states by the first, followed by a population either in the ground or excited state by the second. As shown in Figure 1B, the time delay between the first ( k p 1 ) and the second ( k p 2 ) IR pulses is defined as the coherence time, τ . The two pulses overlap completely in time when τ = 0, and the first IR goes before the second one when τ < 0 . The time delay between the second and third pulse ( k S W I R ) is defined as the waiting time, T w . The delay between the third pulse and fourth pulse ( k S W I R ) is defined as the mixing time, t 3 , which is set to be zero in this case: an SHG scheme. By this convention, all involved pulses are defined relative to the second IR pump pulse. The i2D-VE signal with the detection time, t 4 , is measured in wavelength domain λ 4 . The direction of the radiated i2D-VE signal obeys the conservations of energy and momentum ( k p 1 ± k p 2 + k S W I R + k S W I R ).
To obtain an i2D-VE spectrum, we collected the spectral signals both with and without the mid-IR pump pair, I p u m p o n τ , T w , t 3 , λ 4 and I p u m p o f f t 3 , λ 4 , respectively. The latter is proportional to the second-order surface susceptibility, | χ 2 ( t 3 , λ 4 ) | 2 , while the former is proportional to | χ 2 ( t 3 , λ 4 ) + χ 4 τ , T w , t 3 , λ 4 | 2 . Here, χ 4 τ , T w , t 3 , λ 4 is the desired fourth-order i2D-VE signal. Thus, one can obtain the i2D-VE spectra, S τ , T w , t 3 , λ 4 , from the change in measured intensity given by
S τ , T w , t 3 , λ 4 I p u m p o n τ , T w , t 3 , λ 4 I p u m p o f f t 3 , λ 4 I p u m p o f f t 3 , λ 4 2 χ 4 τ , T w , t 3 , λ 4 χ 2 t 3 , λ 4
For each waiting time, T w , a series of i2D-EV spectra are collected by scanning the coherence time, τ . The accuracy and precision of τ are crucial in extracting i2D-VE spectra so that we can determine absolute time zero of τ for Fourier transformation and phase correction from the measurement of τ .
The determination of absolute time zero and constant phase between the IR pump pulse pair: At a specific T w , a series of spectra were recorded by scanning the first IR pump pulse to negative delays (shorter optical path length) with respect to the second mid-IR pump. For vibrations in the IR range of 6000 nm, the corresponding optical periods are on the order of ~16–20 fs. The sampling interval of τ should be less than 8 fs based on the Nyquist–Shannon sampling theorem [43]. To rule out experimental drift in finding τ = 0 , τ is scanned in 0.667 fs steps near τ = 0 . At each waiting time, an i2D-VE spectrum was acquired for a series of τ , including 60 steps in every interval of 0.667 fs from −20 to 20 fs, 200 steps in every interval of 4 fs from 20 to 820 fs, and 200 steps in every interval of 6 fs from 820 to 2020 fs. The zero point is verified from the IR interferogram obtained simultaneously with 2D-VESFG data. Figure 2A shows a time domain interference pattern of the IR pulses. The inset is the interference fringe at the early time window of 0.3 ps, which suggests that the IR pulse duration is on the order of. 85 fs.
In a 2D experiment with pump–probe geometry, the total phase of the detected signal depends on the phase difference in the pump pair ϕ 21 = ϕ 2 ϕ 1 . An ideal Mach–Zehnder interferometer could create a pair of pulses with spectral phase difference ϕ 21 ω = ω τ + ϕ 0 , where ϕ 0 is a constant phase difference between the two pulses in actual experiments due to the difference in the two beam splitters. To eliminate the constant phase, ϕ 0 , we used the method proposed by Hamm et al. [44]. The determination of the coherence time, τ , also affects the accuracy of ϕ 0 . As we described earlier, τ should be chosen to be as close to zero as possible. As shown in Figure 2B, the amplitude and phase spectra of the IR pump pulse pair, a flat constant phase and absolute time zero were found by choosing the optimal time delay from Figure 2A. As we see later, it is necessary to characterize the IR pump pair to correctly extract an i2D-VE spectrum.
Extraction of a purely absorptive i2D-VE spectrum: From the detected signals to the desired i2D-VE spectra, several steps need to be performed, which is similar to the data processing of i2D-ES [39,45,46]. First, we must determine the constant phase between the two pump pulses at the time zero from the pump pulse interferogram [47,48]. As an example, we illustrate how we extract i2D-EV spectra from an original set of time-dependent data, shown in Figure 3A.
Step 1: a Jacobian transformation and a subsequent interpolation along the frequency axis were implemented from S τ , T w , t 3 , λ 4 to extract S τ , T w , t 3 , f 4 , where f 4 is the detection frequency.
Step 2: The symmetry condition was satisfied, namely we reorganized the data to be symmetric with respect to τ = 0 , leading to its Fourier transformation along τ to produce the purely real response. Then, we performed a fast Fourier transformation (FFT) to obtain S f 1 , T w , t 3 , f 4 , where f 1 is the excitation frequency.
Step 3: an inverse FFT of R e S f 1 , T w , t 3 , f 4 was performed to determine S t 1 , T w , t 3 , f 4 , where t 1 is the dummy time for the IR pump pair.
Step 4: A second inverse FFT was performed, producing S t 1 , T w , t 3 , t 4 from S t 1 , T w , t 3 , f 4 , where t 4 is the detection time. Causality was applied by setting the signal to zero for t 4 < 0 .
Step 5: Another FFT was taken along both the t 1 and t 4 axes into frequency domains S ν 1 , T w , t 3 , ν 4 , where ν 1 and ν 4 are wavenumber axes for the excitation and detection frequencies. The complex absorptive i2D-VE signal, S 2 D ν 1 , T w , t 3 , ν 4 , is then obtained by considering ϕ 0 via
S 2 D ν 1 , T w , t 3 , ν 4 = S ν 1 , T w , t 3 , ν 4 × e i ϕ 0
The real and imaginary parts of S 2 D ν 1 , T w , t 3 , ν 4 correspond to the purely absorptive and dispersive spectra, respectively. Now, we can finally extract the purely absorptive i2D-VE response from the complex response.
i2D-VE spectra: Figure 3A shows an original time domain spectrum of 10 μM AP3 at the air/water interface at T w = 0.9 ps. The time domain signal is dominated by negative contributions with weakly positive signals on both sides of the detection wavelength. The vertically sliced trace at 590 nm presents an oscillatory feature, which decays within 1200 fs, as shown in Figure 3B. The decay time represents the vibrational dephasing time of the measured modes.
Using the data analysis scheme described above, an i2D-VE spectrum was extracted and is presented in Figure 3C, showing both negative and positive features. Both the hyperpolarizability of a state and its change in population contribute to these spectral signatures. In our case, the IR excitation pulses populate a vibrational excited state, thereby depopulating the vibrational ground state. The hyperpolarizabilities for the ground state and excited state could have the same or opposite signs. Ground state bleaching (GSB) and stimulated emission (SE) exhibit negative signatures when the hyperpolarizability for a ground state is positive and vice versa. On the other hand, excited state absorption (ESA) or photoinduced absorption (PIA) exhibit positive signatures when their hyperpolarizability is also positive and vice versa. The signature of hyperpolarizabilities for ground state and excited states vary, depending on the molecules. One should justify their signatures by considering other information such as static vibrational and electronic features in addition to the change in population.
Now, we analyze the spectrum along both the vibrational and electronic frequency axes. (1) Along the vibrational excitation frequency axis, five negative peaks show up at 1622.7, 1598.0, 1565.0, 1540.0, and 1504.4 cm−1 for the detection spectrum slice at 16,500 cm−1 shown in Figure 3D. These results are qualitatively consistent with those from i2D-EV [36], except that the peak at 1551.8 cm−1 was split into 1565.0 and 1540.0 cm−1. From computational and IR/Raman spectral analyses, the four modes were attributed to the ring-breathing mode, in-plane bending mode, ring-scissoring mode predominantly on benzene, and ring-scissoring mode predominantly on pyridinium, respectively, as reported previously [36]. Thus, the negative contributions in the i2D-VE spectrum originate from Franck–Condon transitions from the vibrational ground states of the ground electronic state due to the GSB process with positive hyperpolarizabilities. Two positive peaks also occur in the spectrum, with one at 1580 cm−1 and another at 1598 cm−1. The positive peak at 1598 cm−1 is only apparent from 16,000 to 16,100 cm−1. The two positive peaks correspond to the ESA processes at 1622.7 and 1598.0 cm−1, which transition from the first excited vibrations of the ground electronic state to a higher excited state. (2) Along the electronic detection frequency axis, the negative signal was dominant, with a main peak centered at 16,820 cm−1 (ca. 595 nm) for the sliced excitation spectrum at 1594 cm−1, as shown in Figure 3E. The negative signal was attributed to the GSB process, which is consistent with that from the electronic transition of AP3 at the air/water interface [36]. These results suggest that i2D-VE reveals both the vibrational ground and excited states coupled with electronic transitions at the interface.
The line shapes of the peaks in the i2D-VE spectral measurements reveal the correlation of a vibrational excitation frequency with an electronic detection frequency at the air/water interface. Dominant inhomogeneous dephasing over the intrinsic homogeneous dephasing could cause a tilted 2D line shape, which is manifested in a partial loss of electronic and vibrational frequency correlation due to environmental fluctuations and local inhomogeneity. Such a correlation could be positive, negative, or non-existent. Here, we found a positive correlation of the mode at (1520 cm−1, 16,500 cm−1) with an electronic transition at the waiting time of 0.9 ps and a negative correlation of the mode at (1560 cm−1, 16,500 cm−1) with an electronic transition. We also found the other modes show no or negligible correlation with the electronic transition. As such, i2D-VE spectra enable us to understand the coupling of different behaviors of the vibrational ground state or excited states with electronic states of molecules at interfaces and surfaces. In the future, T w -dependent i2D-VE experiments will be conducted to track line shapes for dynamical solvent couplings at interfaces.
The intensity of an i2D-VE peak arises from both the transition amplitude and orientational correlation. The transition amplitude is the product of vibrational transition dipole moments, the electronic transition dipole moment, and the transition polarizability of interfacial molecules. The orientational correlation measures the relative orientations of a vibrational mode with respect to an electronic transition at an interface. This holds true for different vibrational modes coupled with the same electronic transition. Thus, the mode-specific electronic coupling strength could be obtained in i2D-VE spectral measurements. In future investigations, T w -dependent i2D-VE experiments under different polarizations could be employed to obtain dynamical orientational couplings of electronic and vibrational modes at interfaces.

4. Discussion

Our i2D-VE experiment reveals the coupling of vibrational states of the ground electronic state with vibronic transitions of AP3 at the air/water interface. This methodology offers mode-specific coupling strength, solvent couplings, and the relative orientation of molecules at interfaces. i2D-VE is focused on the vibrational states of the ground electronic state and is complementary to i2D-EV, which mainly probes vibrational states of the electronic excited states. The excellent methodology of IR-tuned double-resonant SFG (DR-SFG) developed recently by the Ren group provides structural couplings of interfacial molecules [49]. On the other hand, the i2D-VE methodology could provide solvent couplings and orientational dynamics in addition to vibronic coupling. Further theoretical considerations are needed to include non-Condon effects in the vibronic coupling observed in i2D-VE experiments.
Experimentally, our methodology was based upon a Mach–Zehnder interferometer for the introduction of an IR pump pair, whose implementation is relatively straightforward. However, the collection of the i2D-VE data with a long time delay for spectral resolution was time-consuming, since the sampling frequency must be more than twice the Nyquist frequency. Further improvements will be made by introducing an IR pulse shaper to implement data collection in a rotating frame to reduce experimental acquisition times [44,50]. In addition, we have demonstrated the method with broadband SHG, but the fundamental pulse could be readily mixed with the SWIR pulse for a tunable ESFG probe.
The development of i2D-VE bridges the gaps between bulk 2D-VE and DR-SFG by probing couplings with interfacial specificity. As such, it offers several advantages over these techniques. For example, the interfering pump pulses adopted from 2D methods offer temporal resolution of coupling processes by varying their time delay with respect to the ESHG/ESFG probe, T w , from sub-ps to ns, a feature that is absent form DR-SFG [50,51,52], and it is given interfacial specificity through its fourth-order nature. Furthermore, the Fourier-transformed nature of i2D-VE provides enhanced sensitivity by allowing us to observe weak responses form the system due to reduced noise. Due to these improvements and the ubiquity of interfaces, i2D-VE has extensive opportunities for applications throughout science and technology. For example, DR-SFG has provided important vibronic structure information about interfaces [53,54]. However, i2D-VE and i2D-EV methods may be applied to probe electronic and vibronic structural dynamics at this interface to investigate their variability on ultrafast time scales to improve electrochemical performance. On the other hand, bulk-restricted 2D-VE and 2D-EV spectroscopies have extracted valuable information about coupled states in photochemical [55] and charge transfer systems [56]. Yet, these systems and others would benefit from interfacial specificity from biological to catalytic interfaces. For these reasons, we believe i2D-VE and i2D-EV methods will uncover breakthrough phenomena, which will advance many areas of science and technology for years to come.

5. Conclusions

In summary, we developed novel interface-specific two-dimensional vibrational–electronic spectroscopy (i2D-VE) to investigate couplings of vibrational and electronic motions of molecules at surfaces and interfaces. The fourth-order spectroscopy was based on a Mach–Zehnder IR interferometer that accurately controls the time delay of an IR pump pair for vibrational transitions, followed by two degenerate SWIR pulses for interfacial electronic transitions. Through this mechanism, i2D-VE spectroscopy provides the coupling of vibrational transitions of the ground electronic state with vibronic transitions of upper excited states at interfaces. We have also presented the stepwise i2D-VE data extraction scheme to promote its implementation and improvement. Different spectral signatures in the i2D-VE spectra provide ground state bleaching or excited state absorption due to the Franck–Condon electronic transition from the ground or excited vibrational states in the ground electronic state. The line shape of the coupled modes also revealed the solvent correlation of the vibrational motion and excited electronic motion. The development of i2D-VE spectroscopy together with i2D-EV spectroscopy extends interface-specific spectroscopy and applications of coherent femtosecond multidimensional spectroscopy. We believe that this i2D-VE methodology could be applied to reveal more structural and dynamic couplings at interfaces and surfaces beyond those observable with other methods such as bulk-dominant 2D-VE and DR-SFG. As such, i2D-VE will be especially well suited for applications in solar energy conversion, photocatalysis, environmental photochemical aging, light-driven biological events, and so on.

Author Contributions

Conceptualization: Y.R., methodology: Y.Q. and Z.-C.H.-F., software: Y.Q. and Z.-C.H.-F., data validation: Y.R. and Z.-C.H.-F., writing—original draft preparation, Y.R., Y.Q., and J.B.B.; writing—review and editing, Y.R. and J.B.B.; visualization, Y.Q., Z.-C.H.-F., Y.R. and J.B.B.; supervision, Y.R.; project administration, Y.R.; funding acquisition, Y.R. All authors have read and agreed to the published version of the manuscript.

Funding

This research was funded by the National Science Foundation grant number [2045084].

Institutional Review Board Statement

Not applicable.

Informed Consent Statement

Not applicable.

Data Availability Statement

Data can be made available upon request.

Conflicts of Interest

The authors declare no conflicts of interest.

References

  1. Mukamel, S.; Tanimura, Y.; Hamm, P. Coherent Multidimensional Optical Spectroscopy. Acc. Chem. Res. 2009, 42, 1207–1209. [Google Scholar] [CrossRef] [PubMed]
  2. Wright, J.C. Coherent multidimensional vibrational spectroscopy. Int. Rev. Phys. Chem. 2002, 21, 185–255. [Google Scholar] [CrossRef]
  3. Cundiff, S.T.; Mukamel, S. Optical multidimensional coherent spectroscopy. Phys. Today 2013, 66, 44–49. [Google Scholar] [CrossRef]
  4. Bruder, L.; Bangert, U.; Binz, M.; Uhl, D.; Stienkemeier, F. Coherent multidimensional spectroscopy in the gas phase. J. Phys. B At. Mol. Opt. Phys. 2019, 52, 183501. [Google Scholar] [CrossRef]
  5. Petti, M.K.; Lomont, J.P.; Maj, M.; Zanni, M.T. Two-Dimensional Spectroscopy Is Being Used to Address Core Scientific Questions in Biology and Materials Science. J. Phys. Chem. B 2018, 122, 1771–1780. [Google Scholar] [CrossRef]
  6. Baiz, C.; Bredenbeck, J.; Cho, M.; Jansen, T.; Krummel, A.; Roberts, S. Celebrating 25 years of 2D IR spectroscopy. J. Chem. Phys. 2024, 160, 010401. [Google Scholar] [CrossRef]
  7. Biswas, S.; Kim, J.; Zhang, X.; Scholes, G.D. Coherent Two-Dimensional and Broadband Electronic Spectroscopies. Chem. Rev. 2022, 122, 4257–4321. [Google Scholar] [CrossRef]
  8. Wright, J.C. Multiresonant Coherent Multidimensional Spectroscopy. Annu. Rev. Phys. Chem. 2011, 62, 209–230. [Google Scholar] [CrossRef]
  9. Schultz, J.D.; Yuly, J.L.; Arsenault, E.A.; Parker, K.; Chowdhury, S.N.; Dani, R.; Kundu, S.; Nuomin, H.; Zhang, Z.; Valdiviezo, J.; et al. Coherence in Chemistry: Foundations and Frontiers. Chem. Rev. 2024, 124, 11641–11766. [Google Scholar] [CrossRef]
  10. Buchanan, L.E.; Dunkelberger, E.B.; Tran, H.Q.; Cheng, P.-N.; Chiu, C.-C.; Cao, P.; Raleigh, D.P.; de Pablo, J.J.; Nowick, J.S.; Zanni, M.T. Mechanism of IAPP amyloid fibril formation involves an intermediate with a transient β-sheet. Proc. Natl. Acad. Sci. USA 2013, 110, 19285–19290. [Google Scholar] [CrossRef]
  11. Mehlenbacher, R.D.; McDonough, T.J.; Grechko, M.; Wu, M.-Y.; Arnold, M.S.; Zanni, M.T. Energy transfer pathways in semiconducting carbon nanotubes revealed using two-dimensional white-light spectroscopy. Nat. Commun. 2015, 6, 6732. [Google Scholar] [CrossRef] [PubMed]
  12. Ginsberg, N.S.; Cheng, Y.-C.; Fleming, G.R. Two-Dimensional Electronic Spectroscopy of Molecular Aggregates. Acc. Chem. Res. 2009, 42, 1352–1363. [Google Scholar] [CrossRef] [PubMed]
  13. Harel, E.; Fidler, A.F.; Engel, G.S. Real-time mapping of electronic structure with single-shot two-dimensional electronic spectroscopy. Proc. Natl. Acad. Sci. USA 2010, 107, 16444–16447. [Google Scholar] [CrossRef]
  14. Kim, Y.S.; Hochstrasser, R.M. Applications of 2D IR Spectroscopy to Peptides, Proteins, and Hydrogen-Bond Dynamics. J. Phys. Chem. B 2009, 113, 8231–8251. [Google Scholar] [CrossRef]
  15. Zheng, J.; Kwak, K.; Fayer, M.D. Ultrafast 2D IR Vibrational Echo Spectroscopy. Acc. Chem. Res. 2007, 40, 75–83. [Google Scholar] [CrossRef]
  16. Fernández-Terán, R.; Ruf, J.; Hamm, P. Vibrational Couplings in Hydridocarbonyl Complexes: A 2D-IR Perspective. Inorg. Chem. 2020, 59, 7721–7726. [Google Scholar] [CrossRef]
  17. Hybl, J.D.; Albrecht, A.W.; Gallagher Faeder, S.M.; Jonas, D.M. Two-dimensional electronic spectroscopy. Chem. Phys. Lett. 1998, 297, 307–313. [Google Scholar] [CrossRef]
  18. Gallagher Faeder, S.M.; Jonas, D.M. Two-Dimensional Electronic Correlation and Relaxation Spectra:  Theory and Model Calculations. J. Phys. Chem. A 1999, 103, 10489–10505. [Google Scholar] [CrossRef]
  19. Hybl, J.D.; Albrecht Ferro, A.; Jonas, D.M. Two-dimensional Fourier transform electronic spectroscopy. J. Chem. Phys. 2001, 115, 6606–6622. [Google Scholar] [CrossRef]
  20. Brixner, T.; Mančal, T.; Stiopkin, I.V.; Fleming, G.R. Phase-stabilized two-dimensional electronic spectroscopy. J. Chem. Phys. 2004, 121, 4221–4236. [Google Scholar] [CrossRef]
  21. Schlau-Cohen, G.S.; Ishizaki, A.; Fleming, G.R. Two-dimensional electronic spectroscopy and photosynthesis: Fundamentals and applications to photosynthetic light-harvesting. Chem. Phys. 2011, 386, 1–22. [Google Scholar] [CrossRef]
  22. Zanni, M.T.; Ge, N.-H.; Kim, Y.S.; Hochstrasser, R.M. Two-dimensional IR spectroscopy can be designed to eliminate the diagonal peaks and expose only the crosspeaks needed for structure determination. Proc. Natl. Acad. Sci. USA 2001, 98, 11265–11270. [Google Scholar] [CrossRef] [PubMed]
  23. Khalil, M.; Demirdöven, N.; Tokmakoff, A. Coherent 2D IR Spectroscopy:  Molecular Structure and Dynamics in Solution. J. Phys. Chem. A 2003, 107, 5258–5279. [Google Scholar] [CrossRef]
  24. Kwak, K.; Park, S.; Finkelstein, I.J.; Fayer, M.D. Frequency-frequency correlation functions and apodization in two-dimensional infrared vibrational echo spectroscopy: A new approach. J. Chem. Phys. 2007, 127, 124503. [Google Scholar] [CrossRef] [PubMed]
  25. Park, S.; Kwak, K.; Fayer, M.D. Ultrafast 2D-IR vibrational echo spectroscopy: A probe of molecular dynamics. Laser Phys. Lett. 2007, 4, 704. [Google Scholar] [CrossRef]
  26. Hochstrasser, R.M. Two-dimensional spectroscopy at infrared and optical frequencies. Proc. Natl. Acad. Sci. USA 2007, 104, 14190–14196. [Google Scholar] [CrossRef]
  27. Weiner, A.M.; De Silvestri, S.; Ippen, E.P. Three-pulse scattering for femtosecond dephasing studies: Theory and experiment. J. Opt. Soc. Am. B 1985, 2, 654–662. [Google Scholar] [CrossRef]
  28. Hamm, P.; Lim, M.; Hochstrasser, R.M. Structure of the Amide I Band of Peptides Measured by Femtosecond Nonlinear-Infrared Spectroscopy. J. Phys. Chem. B 1998, 102, 6123–6138. [Google Scholar] [CrossRef]
  29. Fuller, F.D.; Ogilvie, J.P. Experimental Implementations of Two-Dimensional Fourier Transform Electronic Spectroscopy. Annu. Rev. Phys. Chem. 2015, 66, 667–690. [Google Scholar] [CrossRef]
  30. Oliver, T.A.A.; Lewis, N.H.C.; Fleming, G.R. Correlating the motion of electrons and nuclei with two-dimensional electronic–vibrational spectroscopy. Proc. Natl. Acad. Sci. USA 2014, 111, 10061–10066. [Google Scholar] [CrossRef]
  31. Courtney, T.L.; Fox, Z.W.; Estergreen, L.; Khalil, M. Measuring Coherently Coupled Intramolecular Vibrational and Charge-Transfer Dynamics with Two-Dimensional Vibrational–Electronic Spectroscopy. J. Phys. Chem. Lett. 2015, 6, 1286–1292. [Google Scholar] [CrossRef] [PubMed]
  32. Courtney, T.L.; Fox, Z.W.; Slenkamp, K.M.; Khalil, M. Two-dimensional vibrational-electronic spectroscopy. J. Chem. Phys. 2015, 143, 154201. [Google Scholar] [CrossRef] [PubMed]
  33. Gaynor, J.D.; Khalil, M. Signatures of vibronic coupling in two-dimensional electronic-vibrational and vibrational-electronic spectroscopies. J. Chem. Phys. 2017, 147, 094202. [Google Scholar] [CrossRef] [PubMed]
  34. Gaynor, J.D.; Weakly, R.B.; Khalil, M. Multimode two-dimensional vibronic spectroscopy. I. Orientational response and polarization-selectivity. J. Chem. Phys. 2021, 154, 184201. [Google Scholar] [CrossRef]
  35. Weakly, R.B.; Gaynor, J.D.; Khalil, M. Multimode two-dimensional vibronic spectroscopy. II. Simulating and extracting vibronic coupling parameters from polarization-selective spectra. J. Chem. Phys. 2021, 154, 184202. [Google Scholar] [CrossRef]
  36. Deng, G.-H.; Qian, Y.; Zhang, T.; Han, J.; Chen, H.; Rao, Y. Two-dimensional electronic–vibrational sum frequency spectroscopy for interactions of electronic and nuclear motions at interfaces. Proc. Natl. Acad. Sci. USA 2021, 118, e2100608118. [Google Scholar] [CrossRef]
  37. Huang-Fu, Z.-C.; Qian, Y.; Zhang, T.; Deng, G.-H.; Brown, J.B.; Fisher, H.; Schmidt, S.; Chen, H.; Rao, Y. Orientational Coupling of Molecules at Interfaces Revealed by Two-Dimensional Electronic–Vibrational Sum Frequency Generation (2D-EVSFG). JACS Au 2023, 3, 1413–1423. [Google Scholar] [CrossRef]
  38. Huang-Fu, Z.-C.; Qian, Y.; Deng, G.-H.; Zhang, T.; Schmidt, S.; Brown, J.; Rao, Y. Development of Two-Dimensional Electronic-Vibrational Sum Frequency Generation (2D-EVSFG) for Vibronic and Solvent Couplings of Molecules at Interfaces and Surfaces. ACS Phys. Chem. Au 2023, 3, 374–385. [Google Scholar] [CrossRef]
  39. Huang-Fu, Z.-C.; Tkachenko, N.V.; Qian, Y.; Zhang, T.; Brown, J.B.; Harutyunyan, A.; Chen, G.; Rao, Y. Conical Intersections at Interfaces Revealed by Phase-Cycling Interface-Specific Two-Dimensional Electronic Spectroscopy (i2D-ES). J. Am. Chem. Soc. 2024, 146, 20996–21007. [Google Scholar] [CrossRef]
  40. Zhang, T.; Huang-Fu, Z.-C.; Qian, Y.; Gao, H.; Brown, J.B.; Rao, Y. Photoinduced Surface Electric Fields and Surface Population Dynamics of GaP(100) Photoelectrodes. J. Phys. Chem. C 2022, 126, 6531–6541. [Google Scholar] [CrossRef]
  41. Zhang, T.; Qian, Y.; Gao, H.; Huang-Fu, Z.-C.; Brown, J.B.; Rao, Y. Surface States for Photoelectrodes of Gallium Phosphide (GaP) with Surface-Specific Electronic Spectra and Phase Measurements. J. Phys. Chem. C 2022, 126, 6761–6772. [Google Scholar] [CrossRef]
  42. Bitter, R.; Mohiuddin, T.; Nawrocki, M. LabView: Advanced Programming Techniques, 2nd ed.; CRC Press: Boca Raton, FL, USA, 2007. [Google Scholar] [CrossRef]
  43. Hamm, P.; Zanni, M. Concepts and Methods of 2D Infrared Spectroscopy; Cambridge University Press: Cambridge, UK, 2011. [Google Scholar] [CrossRef]
  44. Shim, S.-H.; Zanni, M.T. How to turn your pump–probe instrument into a multidimensional spectrometer: 2D IR and Vis spectroscopiesvia pulse shaping. Phys. Chem. Chem. Phys. 2009, 11, 748–761. [Google Scholar] [CrossRef] [PubMed]
  45. Tyagi, P.; Saari, J.I.; Walsh, B.; Kabir, A.; Crozatier, V.; Forget, N.; Kambhampati, P. Two-Color Two-Dimensional Electronic Spectroscopy Using Dual Acousto-Optic Pulse Shapers for Complete Amplitude, Phase, and Polarization Control of Femtosecond Laser Pulses. J. Phys. Chem. A 2013, 117, 6264–6269. [Google Scholar] [CrossRef]
  46. Huang-Fu, Z.-C.; Qian, Y.; Zhang, T.; Brown, J.B.; Rao, Y. Development of phase-cycling interface-specific two-dimensional electronic sum frequency generation (2D-ESFG) spectroscopy. J. Chem. Phys. 2024, 161, 114201. [Google Scholar] [CrossRef]
  47. Helbing, J.; Hamm, P. Compact implementation of Fourier transform two-dimensional IR spectroscopy without phase ambiguity. J. Opt. Soc. Am. B 2011, 28, 171–178. [Google Scholar] [CrossRef]
  48. Deng, G.-H.; Qian, Y.; Wei, Q.; Zhang, T.; Rao, Y. Interface-Specific Two-Dimensional Electronic Sum Frequency Generation Spectroscopy. J. Phys. Chem. Lett. 2020, 11, 1738–1745. [Google Scholar] [CrossRef]
  49. Zeng, W.-W.; Luo, T.; Xu, P.; Zhou, C.; Yang, X.; Ren, Z. Vibronic coupling of Rhodamine 6G molecules studied by doubly resonant sum frequency generation spectroscopy with narrowband infrared and broadband visible. J. Chem. Phys. 2024, 160, 024705. [Google Scholar] [CrossRef]
  50. Laaser, J.E.; Xiong, W.; Zanni, M.T. Time-Domain SFG Spectroscopy Using Mid-IR Pulse Shaping: Practical and Intrinsic Advantages. J. Phys. Chem. B 2011, 115, 2536–2546. [Google Scholar] [CrossRef]
  51. Huang, J.Y.; Shen, Y.R. Theory of doubly resonant infrared-visible sum-frequency and difference-frequency generation from adsorbed molecules. Phys. Rev. A 1994, 49, 3973–3981. [Google Scholar] [CrossRef]
  52. Raschke, M.B.; Hayashi, M.; Lin, S.H.; Shen, Y.R. Doubly-resonant sum-frequency generation spectroscopy for surface studies. Chem. Phys. Lett. 2002, 359, 367–372. [Google Scholar] [CrossRef]
  53. Yang, S.; Noguchi, H.; Uosaki, K. Electronic Structure of the CO/Pt(111) Electrode Interface Probed by Potential-Dependent IR/Visible Double Resonance Sum Frequency Generation Spectroscopy. J. Phys. Chem. C 2015, 119, 26056–26063. [Google Scholar] [CrossRef]
  54. Sengupta, S.; Bromley Iii, L.; Velarde, L. Aggregated States of Chalcogenorhodamine Dyes on Nanocrystalline Titania Revealed by Doubly Resonant Sum Frequency Spectroscopy. J. Phys. Chem. C 2017, 121, 3424–3436. [Google Scholar] [CrossRef]
  55. Arsenault, E.A.; Yoneda, Y.; Iwai, M.; Niyogi, K.K.; Fleming, G.R. The role of mixed vibronic Qy-Qx states in green light absorption of light-harvesting complex II. Nat. Commun. 2020, 11, 6011. [Google Scholar] [CrossRef] [PubMed]
  56. Gaynor, J.D.; Petrone, A.; Li, X.; Khalil, M. Mapping Vibronic Couplings in a Solar Cell Dye with Polarization-Selective Two-Dimensional Electronic–Vibrational Spectroscopy. J. Phys. Chem. Lett. 2018, 9, 6289–6295. [Google Scholar] [CrossRef]
Figure 1. (A) Schematic of the i2D-VE experimental setup; (B) pulse sequence of i2D-VE experiments. (A) C1: chopper; CL1: vertically cylindrical lens (15 cm focal length); CL2: horizontally cylindrical lens (10 cm focal length); D1: delay stage for mid-IR; D2: delay stage for SWIR; HWP1: half-wave plate 1; HWP2: half-wave plate 2; HWP3: half-wave plate 3; F1: 4500 nm long-pass; F2: 800 nm long-pass filter; F3: 1000 nm Si long-pass filter; F4: 1600 nm short-pass filter; F5: 785 nm short-pass filter; F6: 750 nm short-pass filter; P1: polarizer; L1: quartz lens of 10 cm focal length; L2: CaF2 lens of 7.5 cm focal length; L3: inch CaF2 lens of 10 cm focal length.
Spectroscj 03 00001 g001
Figure 2. (A) Time domain interference pattern of the IR pump pair centered at ca. 6000 nm. The inset is the interference fringe at the early time window of 0.3 ps. (B) The amplitude and phase spectra of the IR pump pulse pair obtained from a fast Fourier transformation as a function of wavelength.
Spectroscj 03 00001 g002
Figure 3. (A) Pseudo-2D plot of time-dependent interfacial electronic spectra of 10 μM AP3 at the air/water interface at a waiting time of 0.9 ps. (B) Sliced kinetic profile at 590 nm. (C) i2D-VE spectrum. (D) Sliced spectrum at 16,500 cm−1. (E) Sliced spectrum at 1600 cm−1. All polarizations for IR, SWIR, and detection were set to P-polarized.
Spectroscj 03 00001 g003
Disclaimer/Publisher’s Note: The statements, opinions and data contained in all publications are solely those of the individual author(s) and contributor(s) and not of MDPI and/or the editor(s). MDPI and/or the editor(s) disclaim responsibility for any injury to people or property resulting from any ideas, methods, instructions or products referred to in the content.

