Article

Non-Destructive Inspection of Additively Manufactured Classified Components in a Nuclear Installation

Engie Laborelec, 1630 Linkebeek, Belgium
*
Author to whom correspondence should be addressed.
NDT 2024, 2(3), 228-248; https://doi.org/10.3390/ndt2030014
Submission received: 8 April 2024 / Revised: 25 June 2024 / Accepted: 27 June 2024 / Published: 11 July 2024

Abstract

:
Additive Manufacturing (AM) of parts used in nuclear power plants can solve many issues like those related to obsolescence. Of the gap limiting the use of AM parts in nuclear is the need of reliable non-destructive inspection capable to meet the qualification requirements. Recently, efforts in this direction have been made worldwide within several research projects, like the EU Horizon 2020 NUCOBAM. In the framework of NUCOBAM, this article presents the activity related to the inspection of 316-L AM nuclear parts produced by L-PBF and inspected via advanced ultrasonic (UT) methods, like MultiPoint Focusing (MPF) and Total Focusing Method (TFM). Multiple UT array probes are used, linear, matrix and annular. Emphasis is dedicated to the inspection of classified valve bodies produced with known internal seeding flaws. The analysis of the results shows the effect of AM induced anisotropy on the propagation of the ultrasonic wave characteristics, the sound velocity increased with 3% when the sound beam deviated 15° against the perpendicular axis. The TFM method contributed significantly regarding defect detection, Signal to Noise Ratios (SNR) increased with at least 9 dB compared to the Multi-Point Focusing method. Smaller errors were noticed when examination frequency was increased and TFM was applied. The combination of an annular array with TFM and mechanical scanning demonstrated to be the best approach.

1. Introduction

Over the past decade, Additive Manufacturing (AM) has surged in popularity due to its inherent advantages over traditional manufacturing methods. Unlike subtractive manufacturing, which eliminates excess material, AM typically offers swifter production, minimized waste, decreased error risks, and the potential for lightweight design enhancements. These benefits have the potential to substantially lower manufacturing expenses. AM has been used in different applications, especially in aeronautical and automotive sector. In the near future a growth of AM is likely to happen also in the nuclear industry [1,2], where the use of AM parts could help to solve challenges linked to obsolescence management. Obsolescence management remains a technical challenge for asset owners, because Original Equipment Manufacturers (OEMs) may not be willing to maintain highly demanding and costly nuclear quality assurance systems for the fabrication of unique parts or small batches on a non-recurring basis. Many Nuclear Power Plants (NPPs) in operation nowadays were designed and build in the 1970s and 1980s, and OEMs have disappeared or have left the nuclear sector. As a result, plant operators are required to identify if the relevant spare parts are still available in the supply chain. Alternatively, they may be required to develop and implement reverse-engineer methodologies or to conduct in-depth qualifications to validate new manufacturers or components and equipment. Conventional manufacturing processes require many intermediate stages. As a result, the fabrication and qualification of unique spare components or small batches generally take considerable time and resources, which could impede the delivery of critical spare parts and contribute to an increase of unplanned shutdown periods. Metal AM has the unique potential to produce near-to-shape components in a one-step manufacturing process, followed by post-processing steps. In 2017 pump impeller produced via AM was installed at a Slovenian reactor [3]. In this case AM was chosen since the original drawings for the component were missing. In 2021 the Oak Ridge National Laboratory (ORNL) printed brackets called channel fasteners and installed them in a nuclear power reactor where will remain till 2027 when they will be removed for inspection and evaluation [3]. In 2022, the first AM stainless steel fuel component was installed by Framatome at the Forsmark NPP in Sweden [3].
One of the challenges related to the introduction of AM parts in nuclear power plants is related to the capability to perform reliable non-destructive testing (NDT) on such AM components and on the determination of standard inspection procedures matching the stringent requirements of the nuclear codes. NDT on AM parts is not straightforward. For instance the printing direction might have an effect on sound velocity and this has to be kept in consideration along with other effects like high ultrasonic attenuation and the change of sound velocity vs. propagation angle induced by anisotropy [4,5]. An exhaustive review of the challenges of performing NDT on parts produced with AM is out of the scope of this paper and are exhaustively addressed in [6].
In addition to what is stated above, an additional challenge in working within the Nuclear sector is linked to the limitations and requirements imposed by the different codes on the NDT systems. In particular, the qualification requirements on the systems used for the inspection especially on components so called important for safety, always translate in the need of using standards and industrial ready devices and systems incorporating algorithms (like Full Matrix Capture—FMC and Total Focusing Method—TFM) commonly proved for their reliability and accepted by the nuclear operators and legislators. This is even more true in the absence of standards, like often happens for the NDT inspection of AM components or for all those algorithms not yet included in software considered the nuclear golden standards for inspection simulation, like for instance CIVA. This is one of the reasons, according to the authors, for which recently proposed methods like elastic reverse time migration (ERTM) [7], frequency-domain reverse-time migration (FD-RTM) or global FD-RTM (gFD-RTM) [8] have not yet found a vast applicability in the nuclear field.
In Europe, the NUCOBAM (NUclear COmponents Based on Additive Manufacturing) project, which brings together a group of 13 organizations (among which Laborelec) in 6 European countries, is conducting research to develop the qualification and evaluation process that would allow AM to be used in NPPs. The challenges related to the NDT of metallic AM parts are also being addressed within NUCOBAM. This paper presents the NDT methodology proposed and adopted by Laborelec for advanced ultrasonic (UT) inspection of the 316L stainless steel parts produced via laser powder bed fusion (L-PBF) within the scope of the NUCOBAM project. The UT methodology proposed by Laborelec was tested and tuned on AM test blocks, AM reference and calibration blocks, and finally applied on three valve bodies: one containing reference defects and two healthy ones produced to undergo functional testing.
Section 2 is dedicated to the definition of the base material, specimens and types of defects addressed during the NDT campaign. Three types of hardware components were proposed with defined geometries to address specific requirements. Tests blocks were proposed to demonstrate that specific defects can be induced intentionally during the LPB-F process in a stable and reliable way. Reference blocks were proposed to test and determine the general ultrasonic sound propagation behavior while calibration blocks were printed to study the AM effect on the UT Signal to Noise Ratio (SNR) and to assess the NDT detection sizing capabilities of eventual defects. Section 3 presents the UT equipment (probes, software, scanners) and methods applied on all tested components (reference blocks, calibration blocks and valves bodies) while Section 4 contains the acceptance criteria proposed by Laborelec. Section 5 is dedicated to the analysis of the results. The conclusive remarks are included at the end of this work.

2. Materials, Flaws and Specimens

All the test specimens included in this report were manufactured using the following feedstock material:
  • Grade: stainless steel 316L ASTM F138/A276 all parts being produced using one single powder batch that was qualified within the NUCOBAM project.
Based on LPB-F process and NDT standards three different flaw types were used for the tests:
  • Flat Bottom Hole (FBH), also referred as mechanical flaw
  • Planar, also referred as seeding planar flaw
  • Volumetric, also referred as seeding volumetric flaw
FBH type of defects were selected since they are conventionally used in NDT standards dealing with casted and/or forged steels. FBH type of defects with a diameter Φ of 3 mm were drilled in two calibration blocks using electron discharge machining. Planar and Volumetric defects are here referred as seeding flaw (SF) types in accordance with [9]. Both types of seeding flaws were obtained via CAD seeding: defects of specific geometries and sizes were added in the CAD design at specific locations and then introduced in the manufactured part by finely tuning the LPB-F parameters. Before introducing the SFs in the calibration blocks and valve body, test blocks with specific SFs were manufactured. This allowed to validate the reproducibility and repeatability of the approach.
Planar seeding flaws are representative of embedded flat defects (2D type of defect similar to a disk), like horizontal and vertical lack of fusion (HLOF, VLOF). Planar seeding flaws were embedded in four calibration blocks, however, only two of these calibration blocks were used for the tests included in this paper. The planar SF included in the calibration blocks were conceived to be always perpendicular to the inspection probe axis. Moreover, they were printed in such a way to be representative both of HLOF (i.e., perpendicular to the printing direction like) and of VLOF (i.e., parallel to the printing direction like). Planar SF were also introduced in the valve bodies. In this case, two additional types of planar SF were manufactured: Planar Skewed Radial (PSR) SF and Planar Skewed Circumferential (PSC) SF. Both types were conceived to be representative of defect parallel to the inspection probe axis, with the PSR being skewed in the radial direction of the valve body and PSC being skewed along the circumferential direction. Volumetric seeding flaws are representative of trapped or unconsolidated powder and were designed to have a spherical shape with a diameter Φ of 4 mm. Volumetric SF were included in the NDT valve body (“valve body 2”). Both planar and volumetric SFs were placed at different depths in the specimens. Some SFs were included at 2 mm from the inspection surface. Other SFs were placed in correspondence of the mid-plane of the specimen while some others were placed deeper. However, independently from specimens and/or valve bodies, the flaw-design adopted throughout this report is summarized in Table 1.

2.1. Specimens

2.1.1. Test Blocks

Test blocks were manufactured to demonstrate that SFs could be intentionally induced during the LPB-F process in a stable and reliable manner. Two types of blocks were produced, pTstblck containing planar defects and vTstblck blocks containing volumetric defects. The defects were positioned over three predetermined depths along the Z-axis. The reason for these variable depths is twofold: first along the LPB-F building height the 3D printing parameters may change (therefore printing stability needs to be verified); moreover each depth implies specific challenges regarding UT detectability. Two blocks of each type were produced. Several SFs were introduced into each block. The blocks were successively inspected by X-ray and subjected to metallographic assessment.
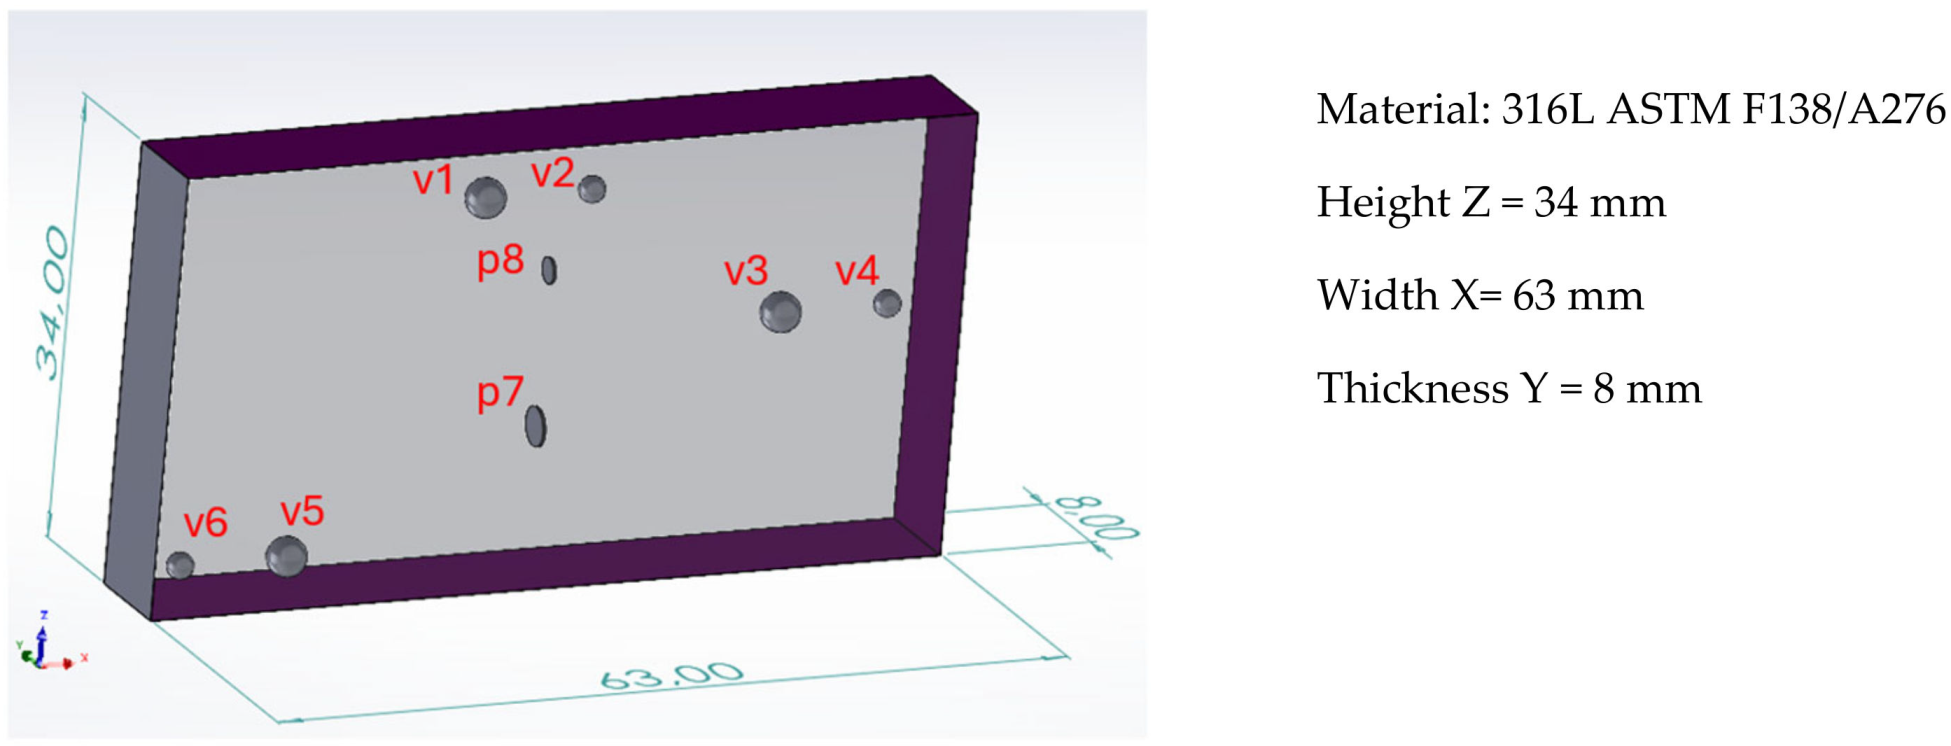
The details relative to the pTstblck blocks are reported in Figure 1 and Table 2. Eight SFs were included in the pTstblck. All SFs were designed to be representative of planar defects like HLOF and VLOF. Two pTstblck blocks were produced: one was subjected to X-ray inspection whereas the second underwent metallographic inspection (macro-slicing process).
The details of the vTstblck are shown in Figure 2 and Table 3. The variable distances measured from the top plane served to prove the stability of the LBP-F along the printing height (Z) as well as the UT detection capabilities. Previous UT tests were conducted on these Tstblcks to optimize the design of the subsequent reference blocks. Hereby the 5 mm deep defects (=further referred as “sub surface” A flaws) should demonstrate the UT resolution at front wall, the 15.75 mm deep defects represents the mid-section along the depth to be inspected (=further referred as “bulk” B flaws) and the 31.5 mm deep defects (=further referred as far surface C flaws) are representing half of the entire specimen thickness this in order to assure at least half of the valve body could penetrated by the UT signal (63 mm).
Eight SFs were included in vTstblck. Six volumetric SFs were designed to be representative of volumetric defects such as unconsolidated or trapped powder whereas two planar SFs were representative of planar defects. Two vTstblck blocks were produced: one was subjected to X-ray inspection while the second underwent metallographic inspection (macro-slicing process).
Overall, both the X-ray and macro-slicing test proved that all SFs were in the CAD tolerances. The planar SFs were more difficult to be detected and sized compared to the volumetric ones.

2.1.2. Reference Blocks

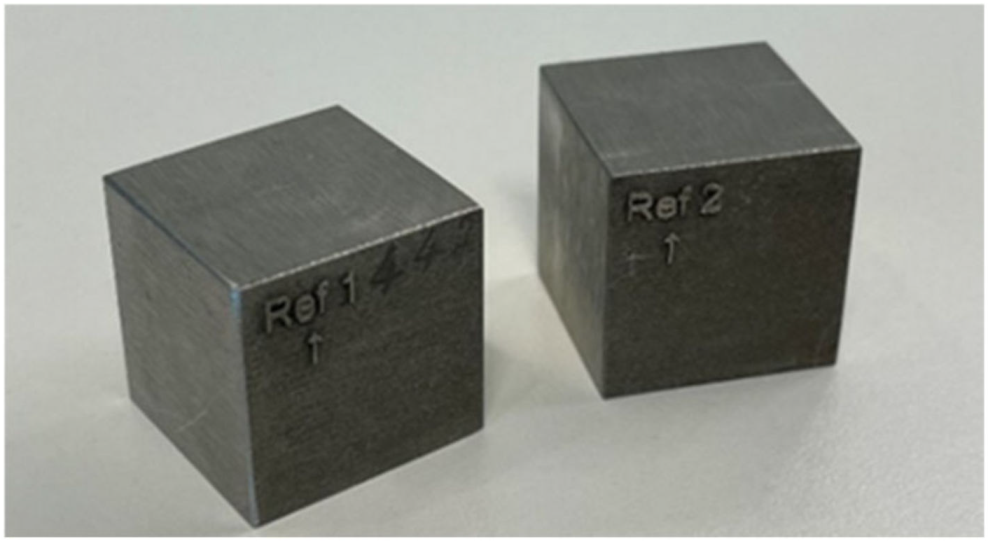
To test and determine the general ultrasonic sound propagation behaviour, two cubic (25 mm × 25 mm) reference blocks were printed in Laborelec LPB-F equipment. Figure 3 shows the reference blocks after machining. The arrow in the picture (immediately below the name) indicates the build direction (BD).

2.1.3. Calibration Blocks

The calibration blocks (Figure 4) were printed to study the effect of AM on the UT SNR and on the capability to detect and correctly size eventual defects. The dimensions of the calibration block were selected considering that the final NDT inspection would target the valve body. Therefore, the dimensions were 123 mm × 36 mm × 8 mm, with 36 mm being the valve body depth and 8 mm the valve body thickness. The calibration blocks were machined only on the surface exposed to the UT probe (top sides indicated by arrow in Figure 4a). FBH with Φ = 3 mm were machined in CAL Z and CAL XY. Three flaw positions in depth (A = 2 mm, B = 17 mm and C = 31mm) were used as indicated in Table 1.

2.1.4. Valve Bodies

A dedicated valve body design was agreed upon by the NUCOBAM partners for the demonstration phase. Three valve bodies were produced in the Laborelec L-PBF equipment: two were printed with no seeding flaws, heat-treated and machined for further functional testing. The third valve body (Figure 5) was manufactured with the following intentionally induced defects:
  • 4 rectangular SF in connection area
  • 5 SF at 2 mm from surface (3 planar SF and 2 volumetric) P2A, P3A, P4A, V3A, V4A
  • 7 flaws in mid plane P2B, P3B, P4B, V3B, V4B, PSC3B, PSR3A
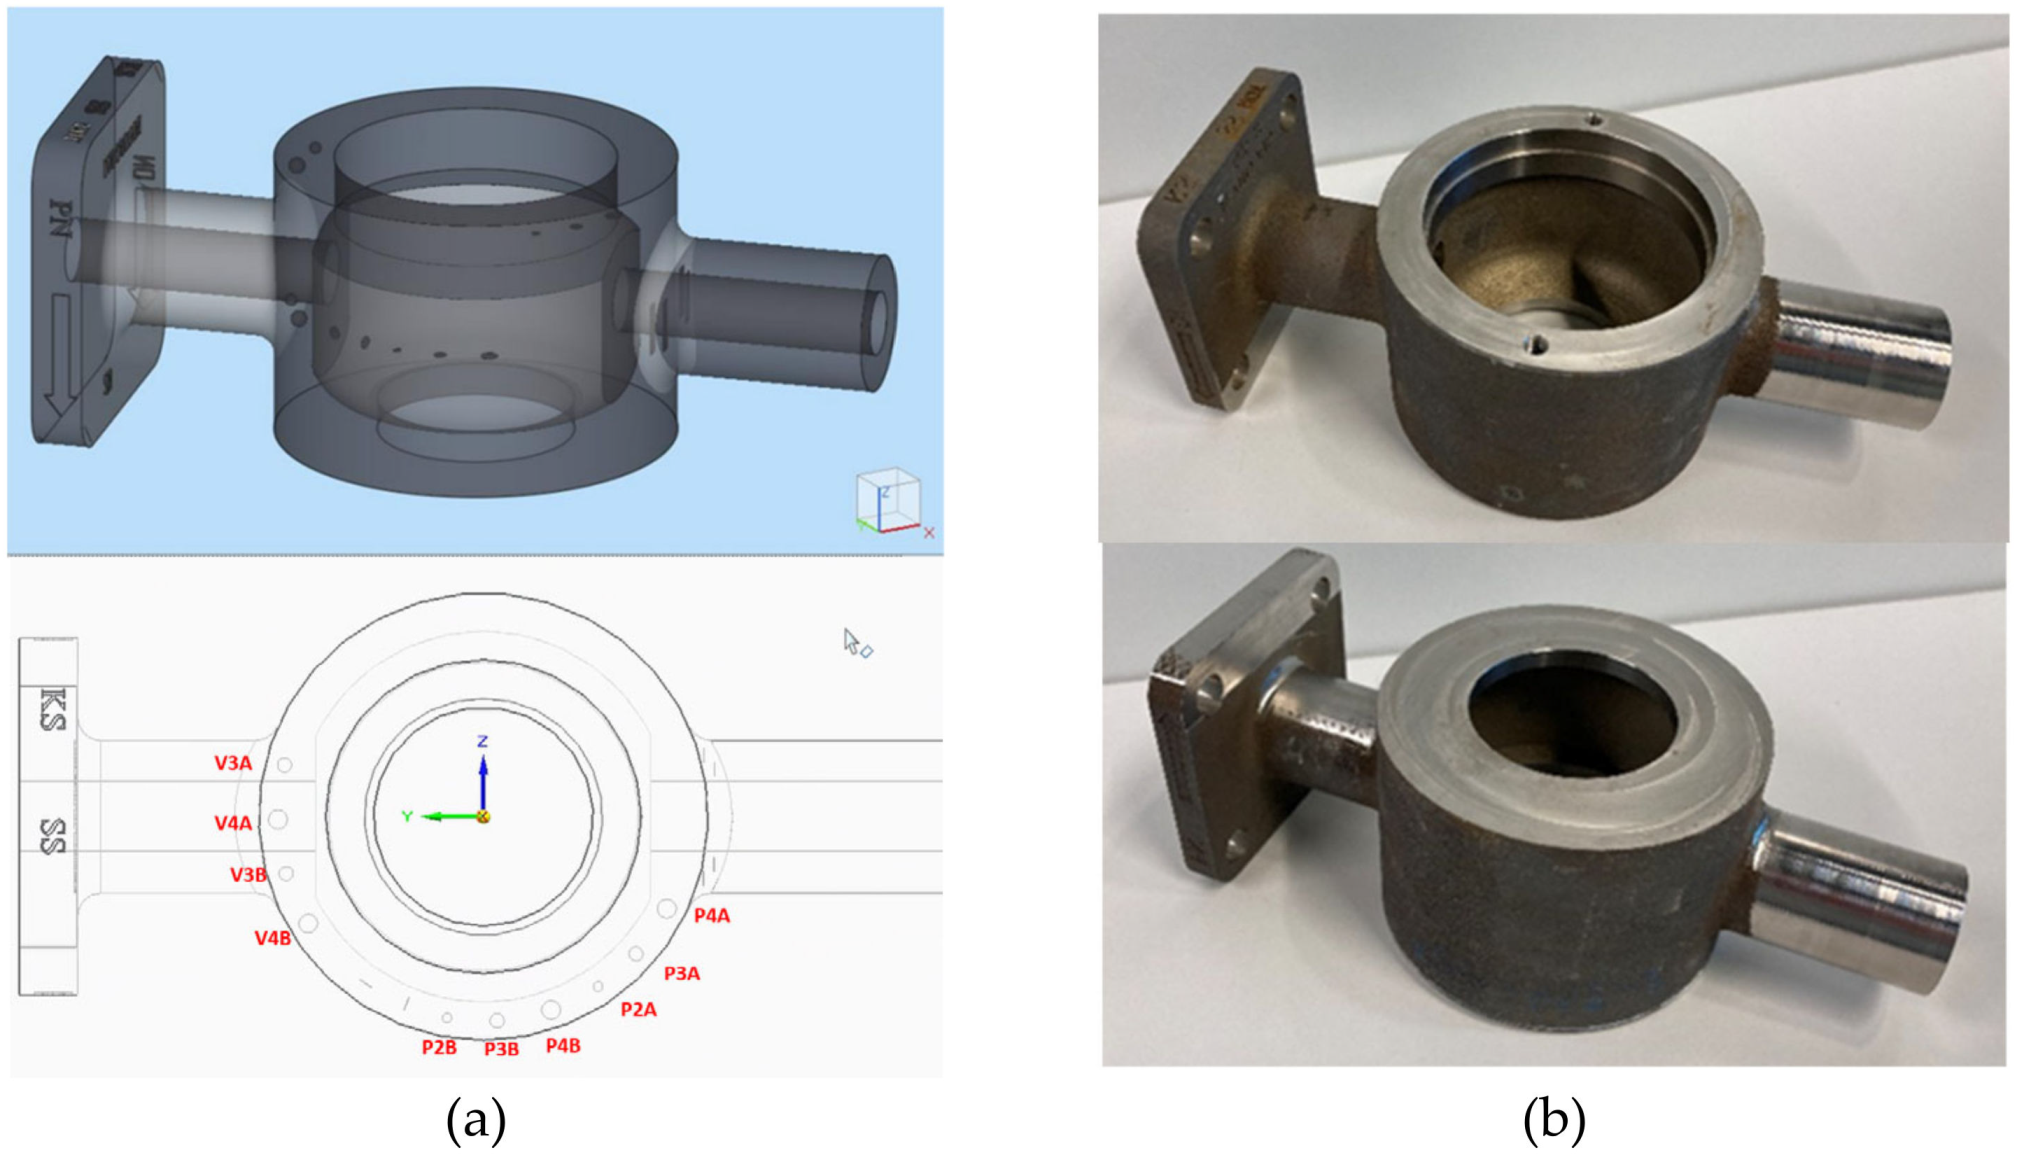
Figure 5. Valve body. (a) CAD model with seeding flaws. (b) final valve body top and bottom side view.
Ndt 02 00014 g005
The rectangular SF, PSC3B and PSR3B were not inspectable with the approach used in this work but were manufactured to be available for future developments. Only the top and bottom surfaces of the valve body were machined since this would be the only parts in contact with other metallic parts once the valve would be assembled for operation. These two surfaces were also used for the NDT inspection on the valve.

3. UT Equipment and Methods

3.1. UT Probes, Systems, Scanners and Softwares

The calibration blocks and the valves described in Section 2.1.3 and Section 2.1.4 were inspected with different NDT probes and approaches. Overall, 4 different types of probes were used for the NDT test campaign:
  • Annular Array (AA) Probe @10 MHz with 16 elements, an interelement spacing of 0.1 mm and a total active diameter of 20mm
  • Matrix Array (MA) Probe @2.25 MHz with 11 × 11 elements, a pitch in both primary and secondary axis of 1.40 mm and an interelement spacing of 0.20 mm on both axes
  • Linear Array (LA) Probe @6 MHz with 32 elements, an interelement spacing of 0.1 mm and a total active length of 17.5 mm
  • Single element (monocrystal) probes: 1 probe @5 MHz and 1 probe @10 MHz
Different UT systems were used for UT acquisition and analysis, depending on whether the inspection was performed in contact or immersion. For the contact UT inspection, the Gekko-64 from Eddyfi was used in combination with the Capture software version 1.3.4. The contact measurements were performed using a time-encoded line scan with a scanning speed set at +/−10 mm/s. For the UT tests performed in immersion, the Panther system from Eddyfi was used. In this case, Acquire 1.3.4 software was employed. For immersion UT we used a motorized 3-axial inspection tank. Depending on the specimen to be scanned different X and Y distances were defined, and no movements were set along the Z-axis (fixed water column height during inspection). The scanning speed was set in accordance with what suggested by the Acquire acquisition software. The detailed settings regarding area per specimen type are listed in Table 4.

3.2. UT Inspection Techniques

In addition to the conventional pulsed-echo method used with the single element probes, two main UT inspection techniques were used:
  • Phased Array (linear and matrix probe): Multi Point Focusing (MPF)
  • Full Matrix Capture (FMC) followed by Total Focusing Method (TFM)
The ultrasonic MPF method is an advanced technique involving the use of phased array (PA) ultrasonic transducers and sophisticated algorithms to achieve precise and dynamic focusing of the ultrasonic beam at multiple points along the inspection path. The fundamental principle underlying the MPF technique involves fine-tuning both the timing and intensity of signals emitted by individual transducers within an array. This adjustment aims to manipulate ultrasonic waves to either converge or diverge at specific points within the material under examination. Through dynamic alterations to focal points, MPF typically enhances resolution and sensitivity across the inspection area, potentially enhancing the detection and characterization of small flaws.
The FMC approach employs a phased array ultrasonic transducer comprising multiple elements capable of emitting and receiving ultrasonic signals independently. It employs a systematic data acquisition strategy wherein each transducer element is activated sequentially, with the corresponding received signals recorded. This methodology generates a comprehensive data matrix, capturing the interactions between the ultrasonic waves and the inspected material from various angles and positions. TFM is a signal processing technique that leverages the complete data matrix acquired through the FMC. By analyzing this recorded data, the TFM algorithm dynamically computes the optimal focal points for every pixel in the resultant image. The fusion of FMC and TFM offers numerous advantages. The FMC method, by capturing the entire data matrix, provides a robust dataset facilitating enhanced inspection coverage and superior signal quality.

3.2.1. UT Measurement Approach for Assessing the Effects of Printing Direction on Sound Velocity

The variation in sound velocity based on the printing direction was studied to demonstrate variations of sound velocity depending on the printing direction of the samples. A first study was conducted by using the single element UT probes. The probes were used to test the reference blocks from different sides. Since the height (=thickness) of the reference blocks was known, the sound velocity could be calculated as followed:
v = h × n t n t 1 ,
where v is the velocity, h the sample height, n the number of UT wave round trips, t1 and tn are the measured time of the first and nth backwall echo, respectively.

3.2.2. UT Measurement Approach for Assessing Attenuation Values

Attenuation measurements were performed on the reference blocks to verify the presence of any dependency of the sound attenuation from the scan direction. The measurements were performed in conformity with the ASTM E664. The amplitude between certain repetitions of backwall echoes was measured based on the measured amplitude and travelled sound path. Based on these parameters the decay of the backwall echoes can be reported in dB/m by applying the following formula:
A t t e n u a t i o n = 20 log A m A n n m h ,
where Am is the amplitude of first back wall echo, An the amplitude of nth back wall echo, m and n the sound path of the selected back wall echoes and h the height (thickness) of the specimen under test.

3.2.3. UT Measurement Approach for Assessing the Effect of Anisotropy on Sound Velocity vs. Probe Angle

In isotropic materials, the sound velocities of both longitudinal and shear waves are fixed and independent from the probe angle (propagation angle). This is generally not the case for anisotropic materials such as those produced with AM. In this case, the propagation speed of the different waves may vary with the probe angle, depending on the degree of anisotropy introduced by the printing process. Sound velocity measurements were performed to verify this effect. A variation in angles was executed by applying different PA UT laws in the LA probe. The probe was placed perpendicular on the calibration specimen with no flaws. By increasing the distance between the transmitter (T) and the receiving (R) transducer elements along the probe different angles were generated. Based on the technical information (element size and pitch) the distances between the elements of the linear probe were obtained. Since the Fermat principle is applicable the angle and thus corresponding sound path could be determined using Pythagoras equation.
θ d T , d R = t a n 1 d R d T 2 h ,
where θ indicates the azimuth of sound propagation against vertical reference, dT and dR are respectively the distance of the receiving and transmitting elements and h the sample height. For each value of θ, the corresponding sound velocity was calculated as follows:
θ d T , d R = 2 h n cos θ t n t 1   ,
where h is the height of sample, n the number of round trips and t1 and tn the time measured of the first and nth backwall echo, respectively.

3.3. UT Inspection of Calibration Blocks and Valve Bodies

Once the measurements described in Section 3.2 were finished, an inspection campaign on the calibration blocks and on the valve bodies started. The calibration blocks in this case served to assess the UT performance of the different techniques. The results of this assessment were used to determine the best suitable inspection technique for the valve bodies. As shown in Table 5 and Table 6, a total of 40 inspections were performed on the calibration blocks, of which 24 in immersion configuration and 16 in contact. In the immersion configuration, the AA, LA, and MA probe were used with a water column height of 60 mm (fixed z-axis positioning). For each of this probe, both the MPF and FMC-TFM method was applied on both FBH and SF type of flaws. The last row in Table 5 and Table 6 refers on how the calibration block was printed with respect to the building direction (in accordance with Figure 4).
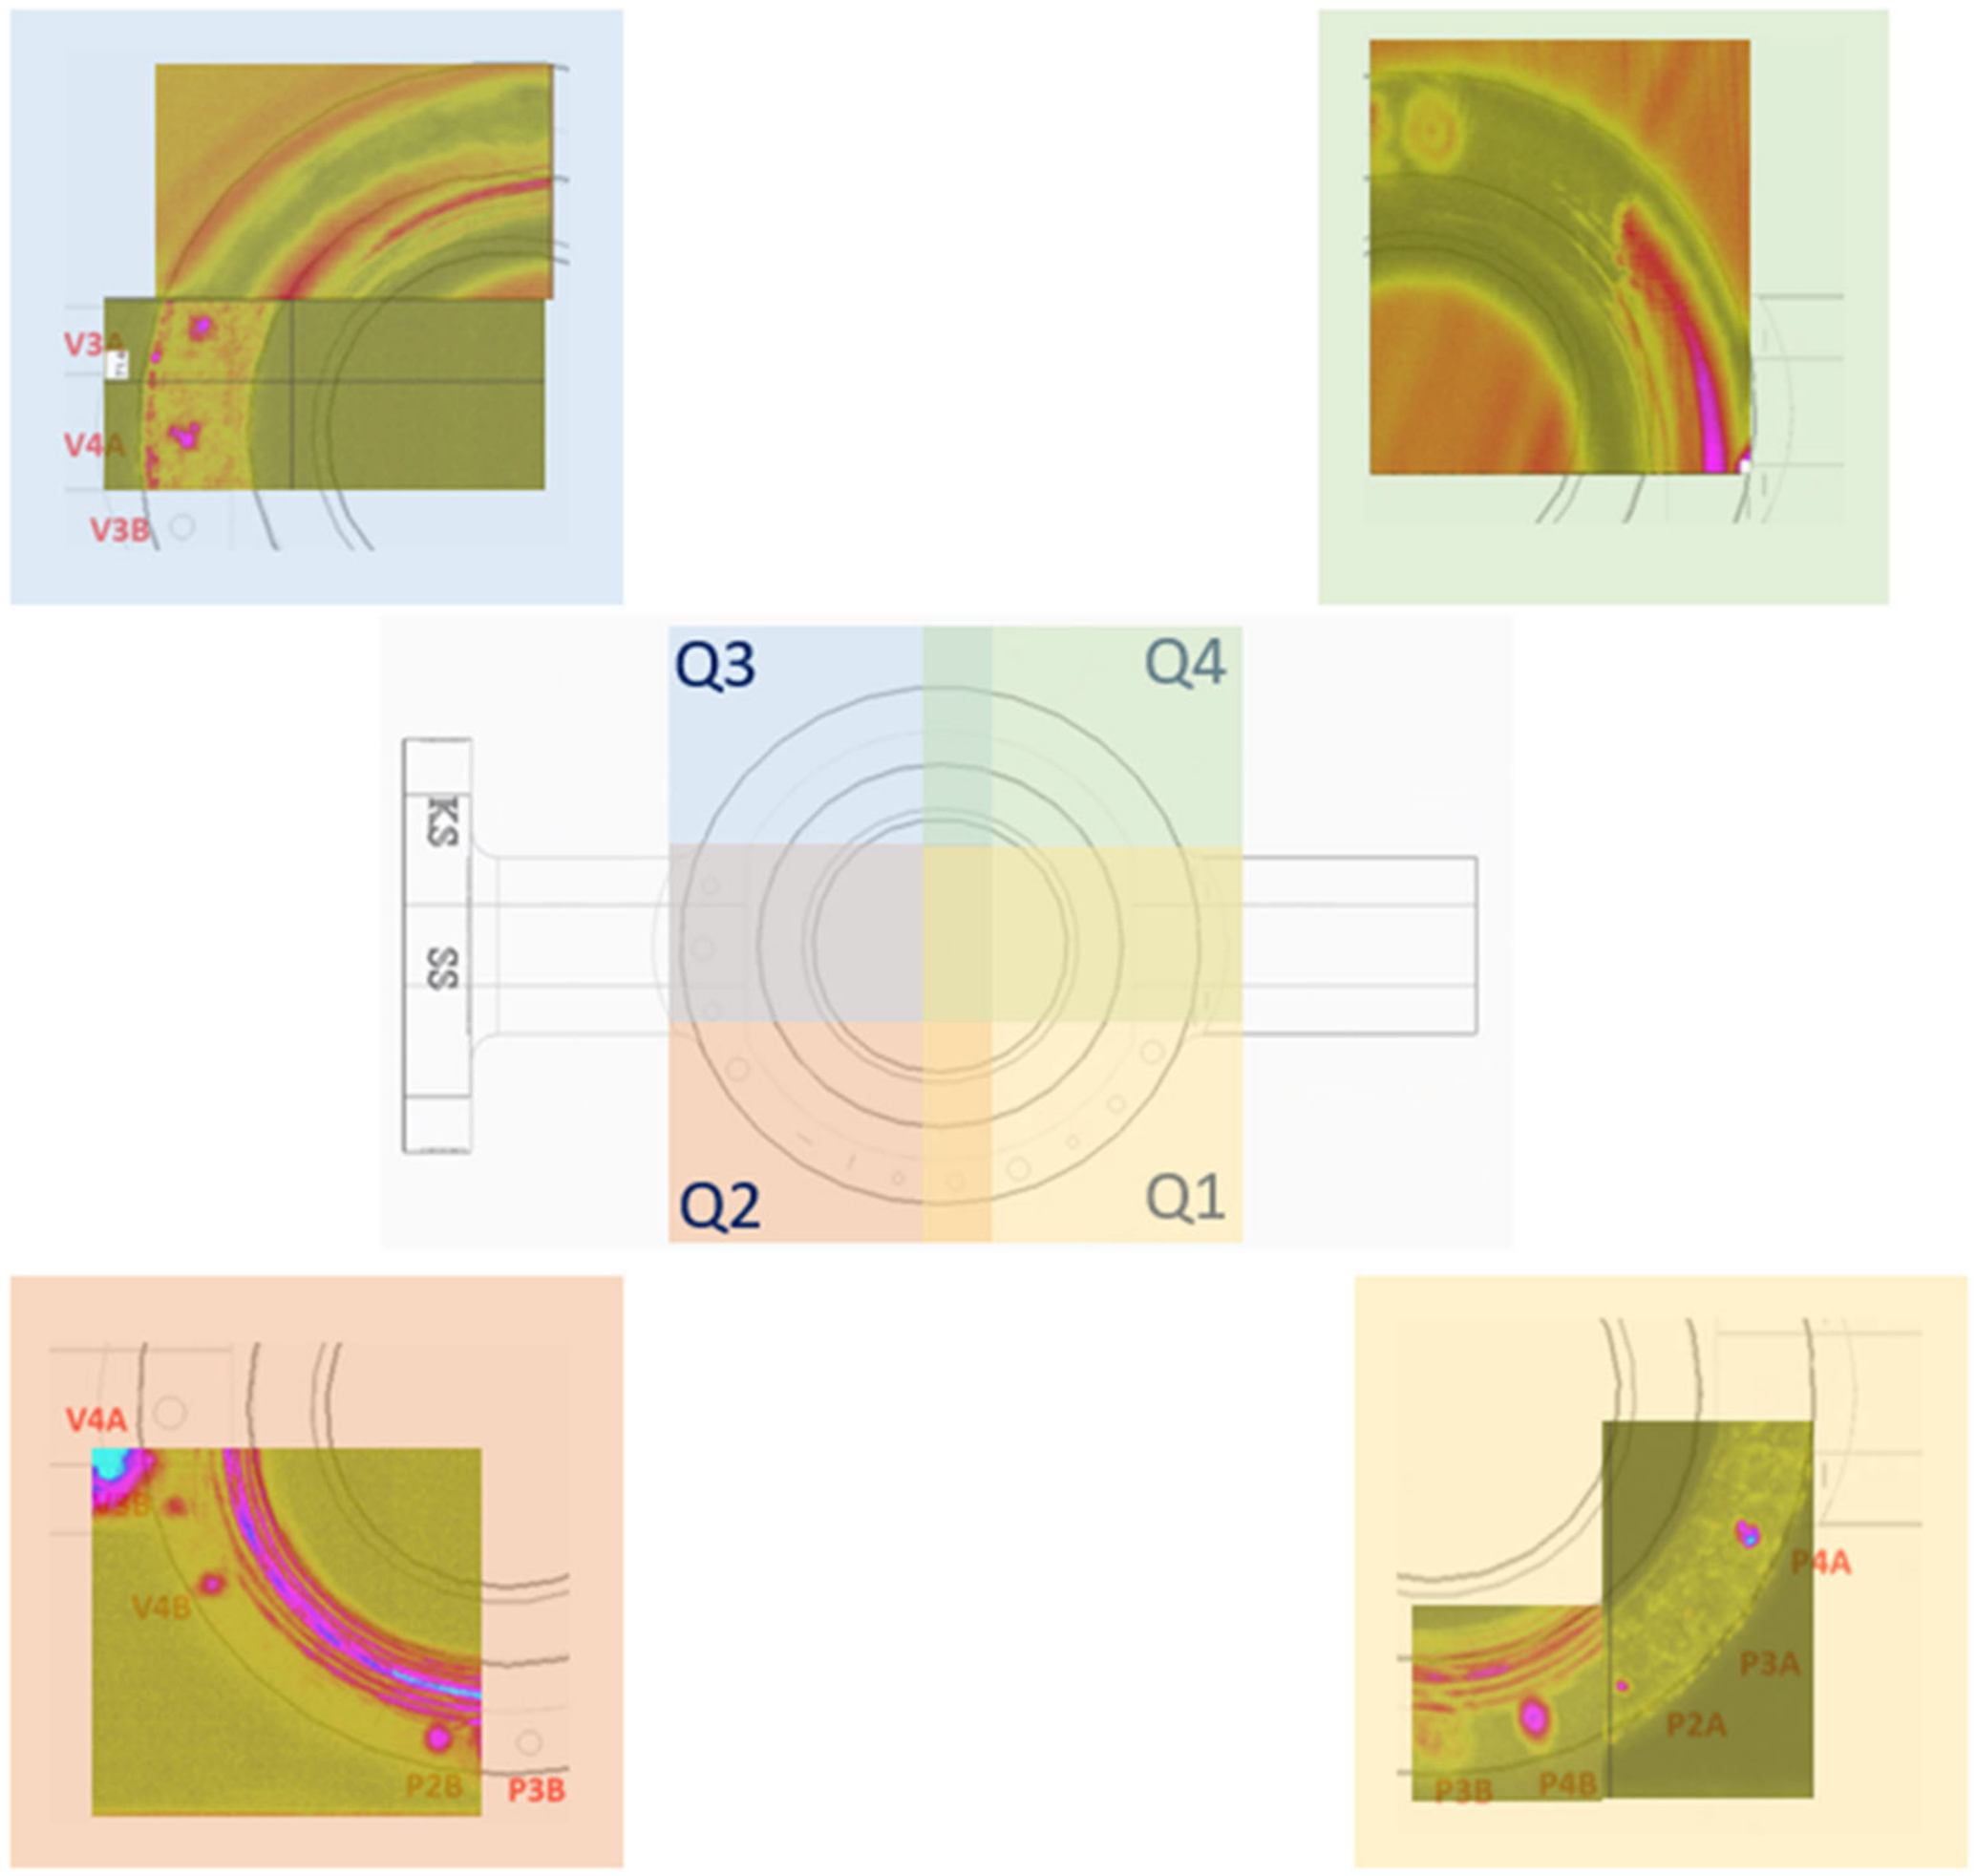
In order to limit the file size of the acquired data the scan areas of the valve were divided in 4 quarters, Q1, Q2, Q3 and Q4 as indicated by the color code in. A small overlap between the quarters was taken into account. Before performing the inspection, it was determined that the UT would be applied on both sides, this to guarantee sufficient sound penetration along the entire depth of the valve body. During the inspection, the valve was turned 180° (see Figure 6), which ultimately generates 8 files per valve per technique.

4. NDT Acceptance Criteria

At the time this work has being conducted, no released NDT standards covering acceptance criteria for inspection of AM parts existed. Nevertheless, we performed a preliminary review of the existing standards that might be applied for the purpose. Table 7 reports the standards and codes screened during this work.
The output of this screening was that for both castings and forgings the NDT notation level is a FBH with 3 mm in diameter Φ. Based on these criteria and considering a safety margin of 2, the reference size (diameter) for both internal planar SF and for FBH was Φ = 3 mm. In case of SF, a thickness of 200 µm was obtained as a reference. The flaws created in the calibration blocks and in the valve body used in this work were based on the reference defects size obtained during this screening exercise. The proposed acceptance criteria are reported in Table 8.

5. Analysis, Results and Discussion

5.1. The Analysis of the Acquired Data

The data obtained from the inspection of the calibration blocks was analyzed by looking first at the C-scan. To allow comparisons, the C-scan presentation was standardized. First, to avoid saturation of the C-scan by the front and backwall, a gate was set on a fixed distance after the maximum front wall signal and before the maximum backwall signal. In case of the multi-element probes, the Cumulated C-scan image was used to merge all the signals from the different shots in one image. The maximum amplitude within this C-scan, initiated by a certain flaw, was set to 80% amplitude based on the A-scan plot. Due to elevated noise levels in certain scans, additional analysis methods were used to detect the defects in specific areas. The aim was to scan every sample as efficient as possible, due to the large amount of data obtained. The following assessment methods were applied (according to the order as listed below):
  • Reduce gate size to reduce the noise. If a certain flaw was detected by means of this method, the specific position in the analysis matrix was marked with “*A”, which stands for Adapted gate.
  • B-scan analysis—section view of specimen. This view was used to visualize a specific section of the part. Since the location of the flaws was known the correct section could be selected easily. Within this B-scan section the UT Analysis module allowed us to scroll through each multi-element shot, this in order to screen for the involved shot which generated the highest defect signal response. If a certain flaw was detected by means of this method, the specific position in the analysis matrix is marked with “*B”, which stands for B-scan analysis.
The Signal to Noise (SNR) metric was also used for the analysis of the collected data. The noise measurements were performed at a specific position within the calibration block, by help of the P or F3B flaw which was used as reference point. The measurement selection for noise determination was applied in the B-scan (Y-plane) view where it was set to the center of the concerned specimen. Since the low frequency probe suffered from a large dead zone, the noise measurement was performed in an adapted gate, which obviously excludes the high amplitude of the front wall.
This flaw sizing could only be performed on the data acquired by immersion scanning. The defects were sized by performing the following steps:
  • Within the cumulated C-scan the maximum echo was linked to the corresponding shot number.
  • Based on this shot number, a specific C-scan was selected (non-cumulated C-scan). By applying this method, the influence of the probe shape was excluded.
  • By help of the contouring tool included in the CIVA software, the −6 dB contours were reported in X- and Y-direction (see Figure 7).
The exported values from CIVA were used to calculate the defect area involved.
For what concerns the valve body, the data analysis was performed in an analogous way as the calibration blocks. However undesirable interference echoes were noticed, most likely initiated by the geometry of the valve. To avoid masking of the defects in the C-scan images two major analysis gates were used, a gate before and a second gate behind the interference echo. This interference echo appeared at approximately 29 mm depth.

5.2. Results on the Reference Blocks

Several measurements divided over the surface of the sample were performed in order to average the measured values. The obtained values were compared against the printing direction of the sample as well as between the different applied frequencies.
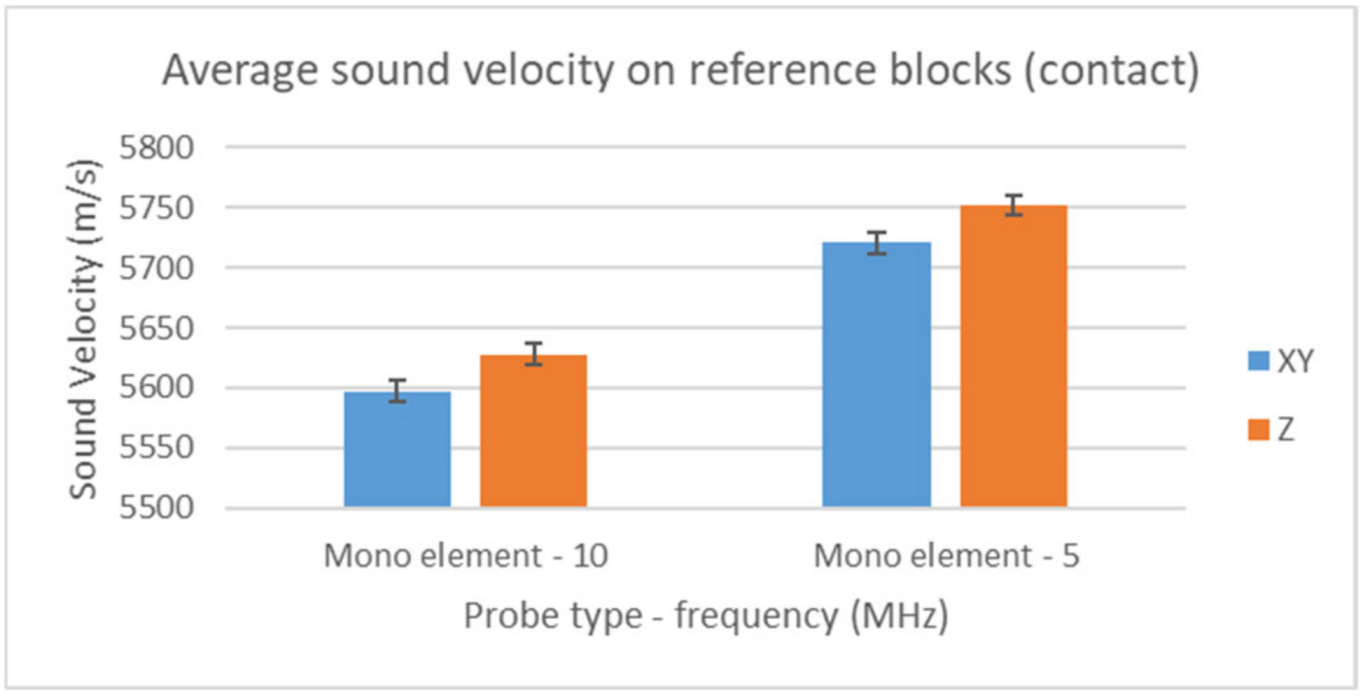
The contact scanning was executed at 0° angle, so only longitudinal waves were generated. Several measurements (9) were equally spread across the sample surface in order to average the obtained sound velocities. The results regarding measured sound velocity and their standard deviation are depicted in Figure 8. The samples inspected along the printing direction (Z-direction) own a higher sound velocity. The deviation in between the samples is less pronounced which is most likely due to the human factor. During the manual measurements, the positions with best readable echoes during measurement campaign were reported. It is worth to notice that the fact that the sound velocity varies with frequency is in line with the intrinsic anisotropic and dispersive nature of the AM material. In fact, in isotropic (non-dispersive) media, the solution of the Christoffel’s equation provides the existence of only two frequency independent sound waves (longitudinal and shear). In case of anisotropic media, solving the Christoffel’s equations leads to 6th (or higher) order of polynomial equations and involves transcendental equations relating the frequency and phase velocity. In other words, for AM materials, the anisotropic and dispersion nature of the lattice make the phase, group, and energy velocity to be different (in module and orientation) one from the others, with the phase velocity expressing a dependency with the frequency.
Figure 9 show the results regarding measured sound velocity and the standard deviation obtained on the reference blocks in immersion.
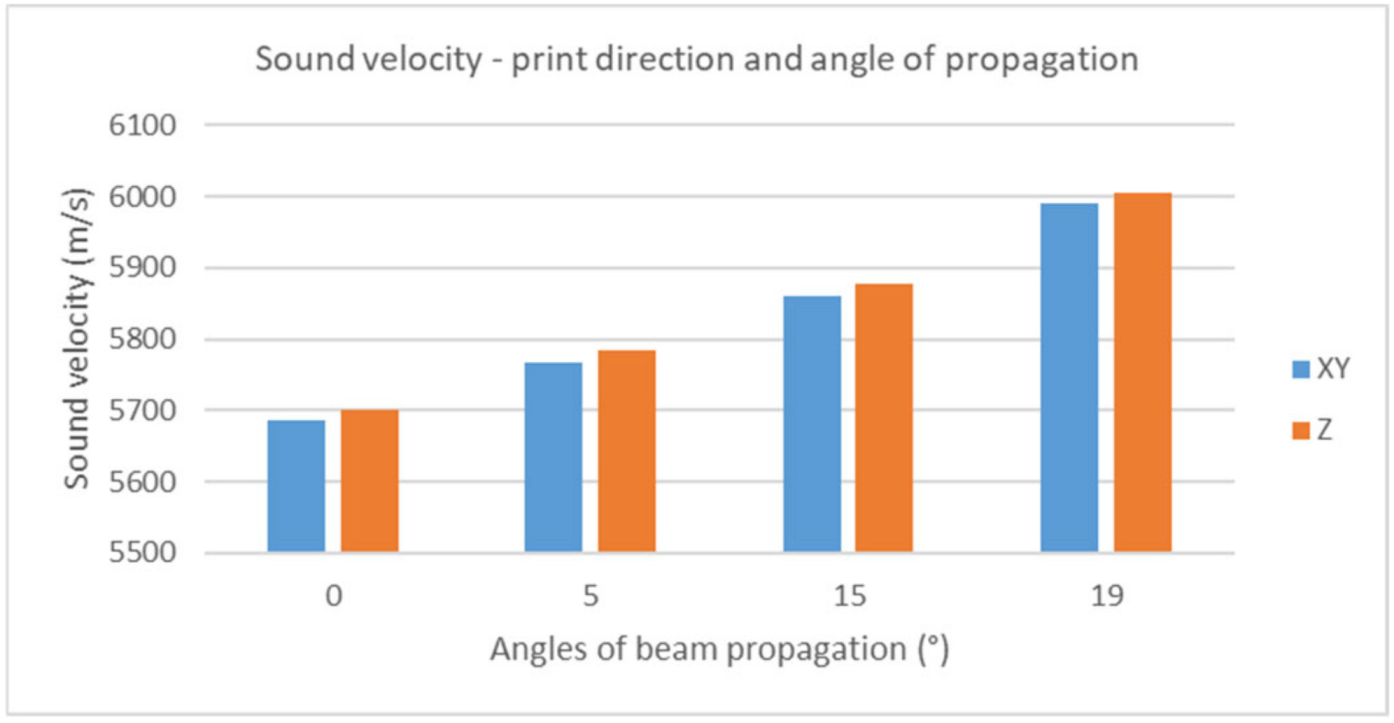
Figure 10 shows the effect of anisotropy on the propagation of the sound velocity (of longitudinal waves) for different propagation angles. A clear trend is observed, the longitudinal sound velocity increases when the angle of beam propagation increases (in agreement with [5]).
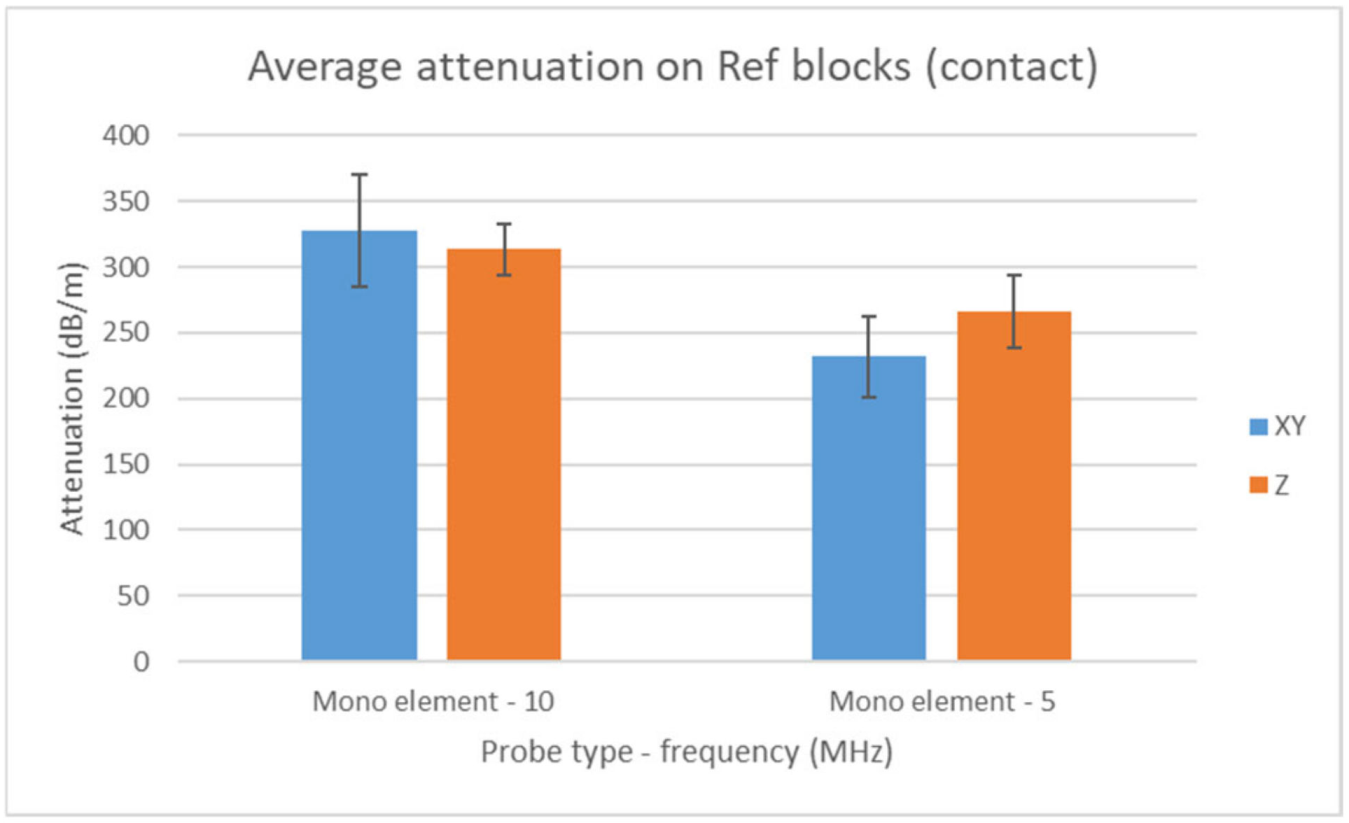
For what concerns the attenuation, several measurements (5 for the in-contact configuration and 9 for the immersion one) were equally spread across the sample surface of the reference blocks in order to average the obtained sound velocities. Figure 11 and Figure 12 report the obtained attenuation results for the contact and immersion test configuration, respectively. The attenuation of the contact measurements is revealing that a higher applied frequency is more prone to attenuation. The additive manufactured stainless steel samples own a higher average attenuation than conventional fabricated (forged) stainless steel (260 dB/m for 10 Mhz and 187 dB/m for 5 MHz, proven in earlier studies performed at ENGIE Laborelec). The higher attenuation seen in Z direction for the 5 MHz measurements was not as expected. In fact, less attenuation would be expected when scanning along Z direction since, according to literature, the grains are (or should be) elongated in Z. This means that when scanning in XY, the ultrasonic beam has to cross multiple elongated grains with a consequent higher scattering and attenuation. This reasoning is confirmed by the 10 MHz results while the 5 MHz results seem to go in the opposite direction. Nevertheless, considering the human error, the data obtained by the manual contact measurements is intrinsically less qualitative compared to the data obtained via the scanning system used for the immersion tests. Looking at Figure 12, it seems that when inspecting the additively manufactured reference blocks along their build direction, the attenuation is. Furthermore, it is also noted that a lower inspection frequency results in less attenuation. An interesting advantage of TFM is also visualized: TFM appears to be less prone to attenuation, which is favorable for inspection of these relatively high attenuating steel samples.

5.3. Results on the Calibration Blocks

This section is dedicated to the result obtained from the inspection of the calibration blocks both in contact and in immersion. For sake of conciseness, only some representative results are reported. The main conclusions are also reported.
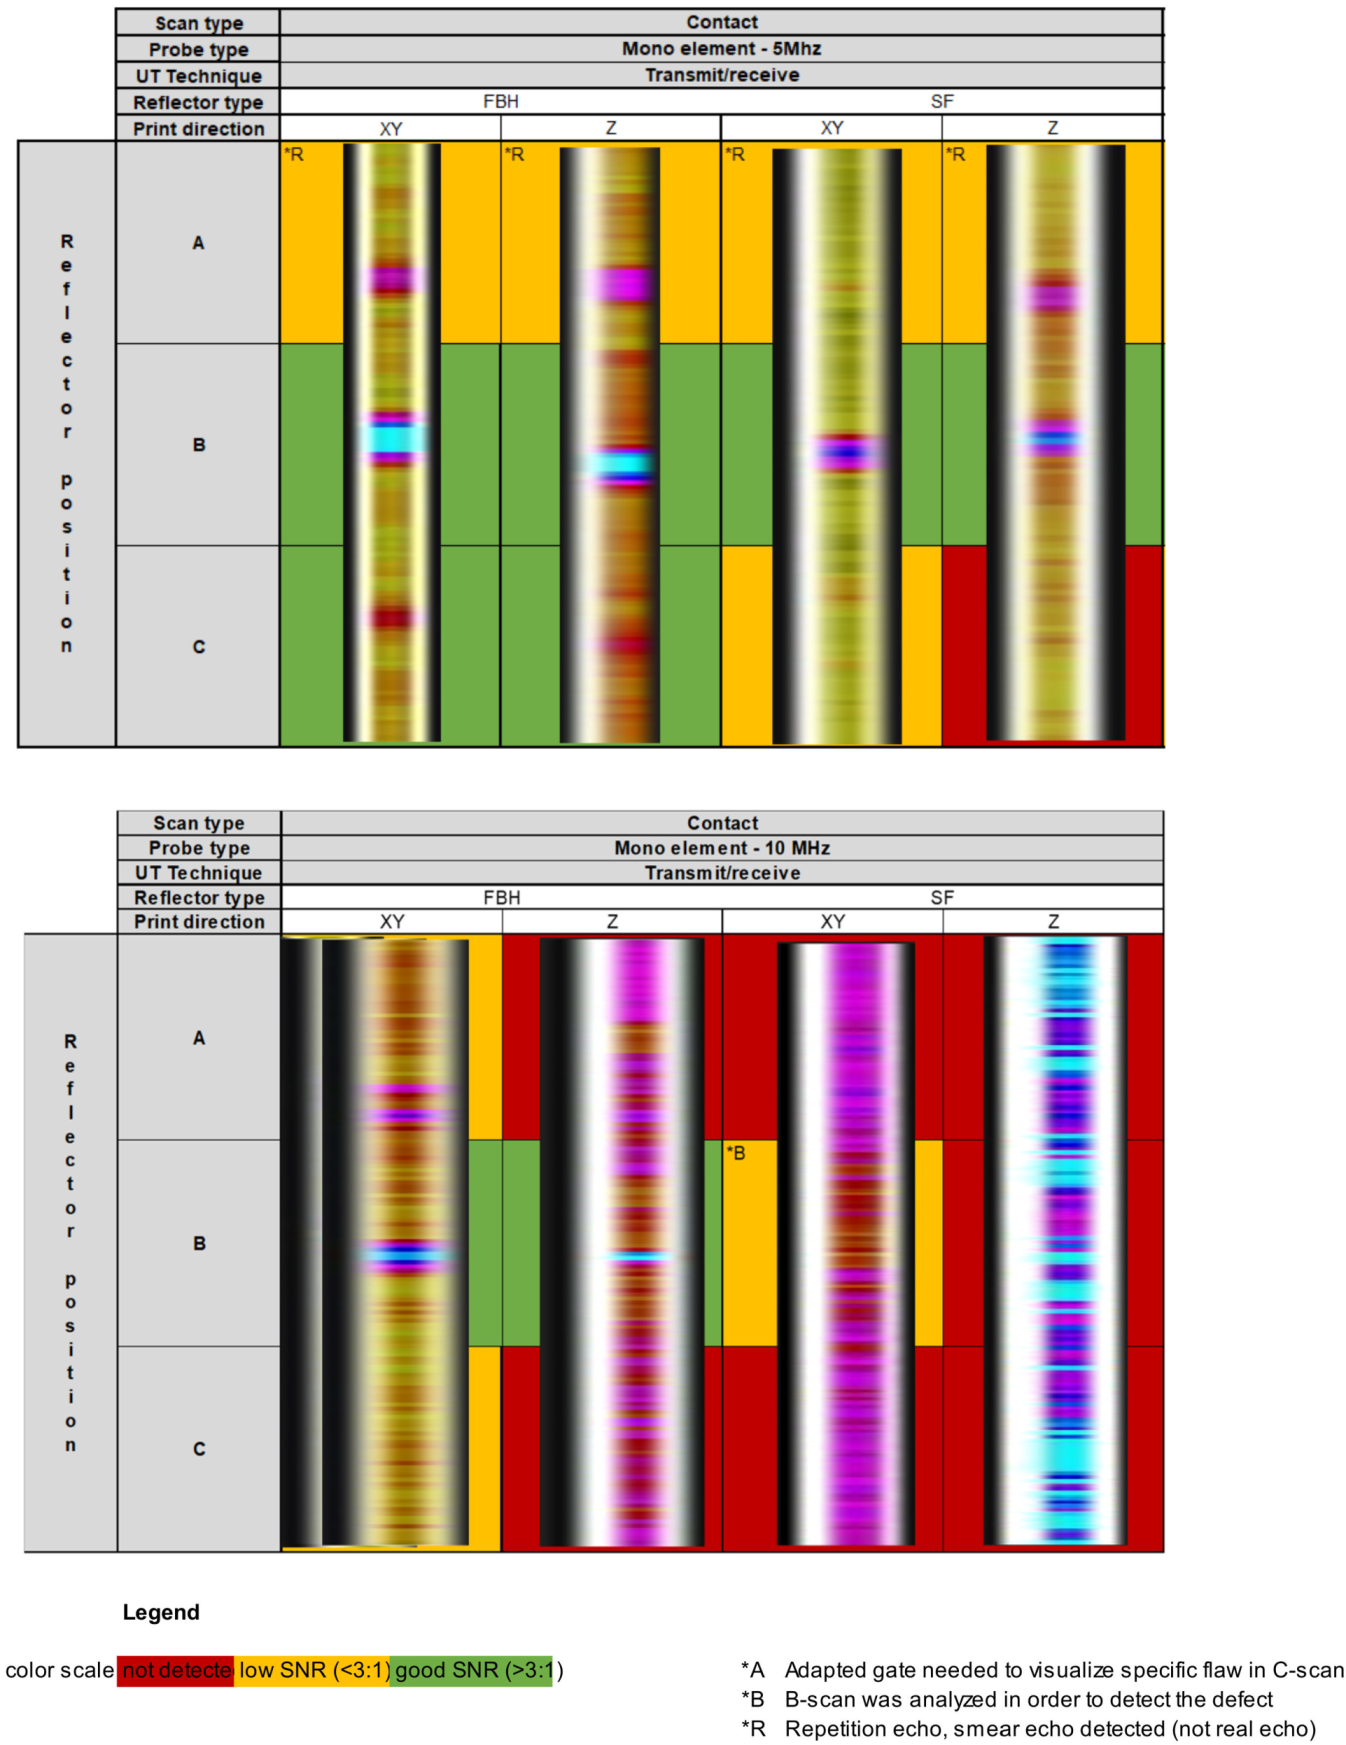
Figure 13 reports the results of the defect detection performed using the single element probes at 5 MHz and 10 MHz in contact. The results are presented by including the CIVA analysis output inside a table made of different cells. The colour assigned to each cell of the table depends on either the defect could be detected or not. Green indicates that the flaw could be detected with an SNR higher than 3; orange indicates less visible defects giving SNR below 3 but still acceptable; red is used for non-detectable defects. For instance, the defects position at the B level in the calibration blocks could all be detected using the 5 MHz probe. Contrarily, the SF position at C level in the CAL_SF_Z block could not be detected. The letter “R“ appearing in some cells stands for Repetition echo and indicates deal with the front wall causes a “dead” or “blind” zone which is greater than the distance to the sub surface flaw (2 mm). From the analysis of all the test done, it appears clear that the single element probe at 5 MHz outperformed the 10 MHz one, most likely due to the effect of increasing attenuation/noise at higher frequency.
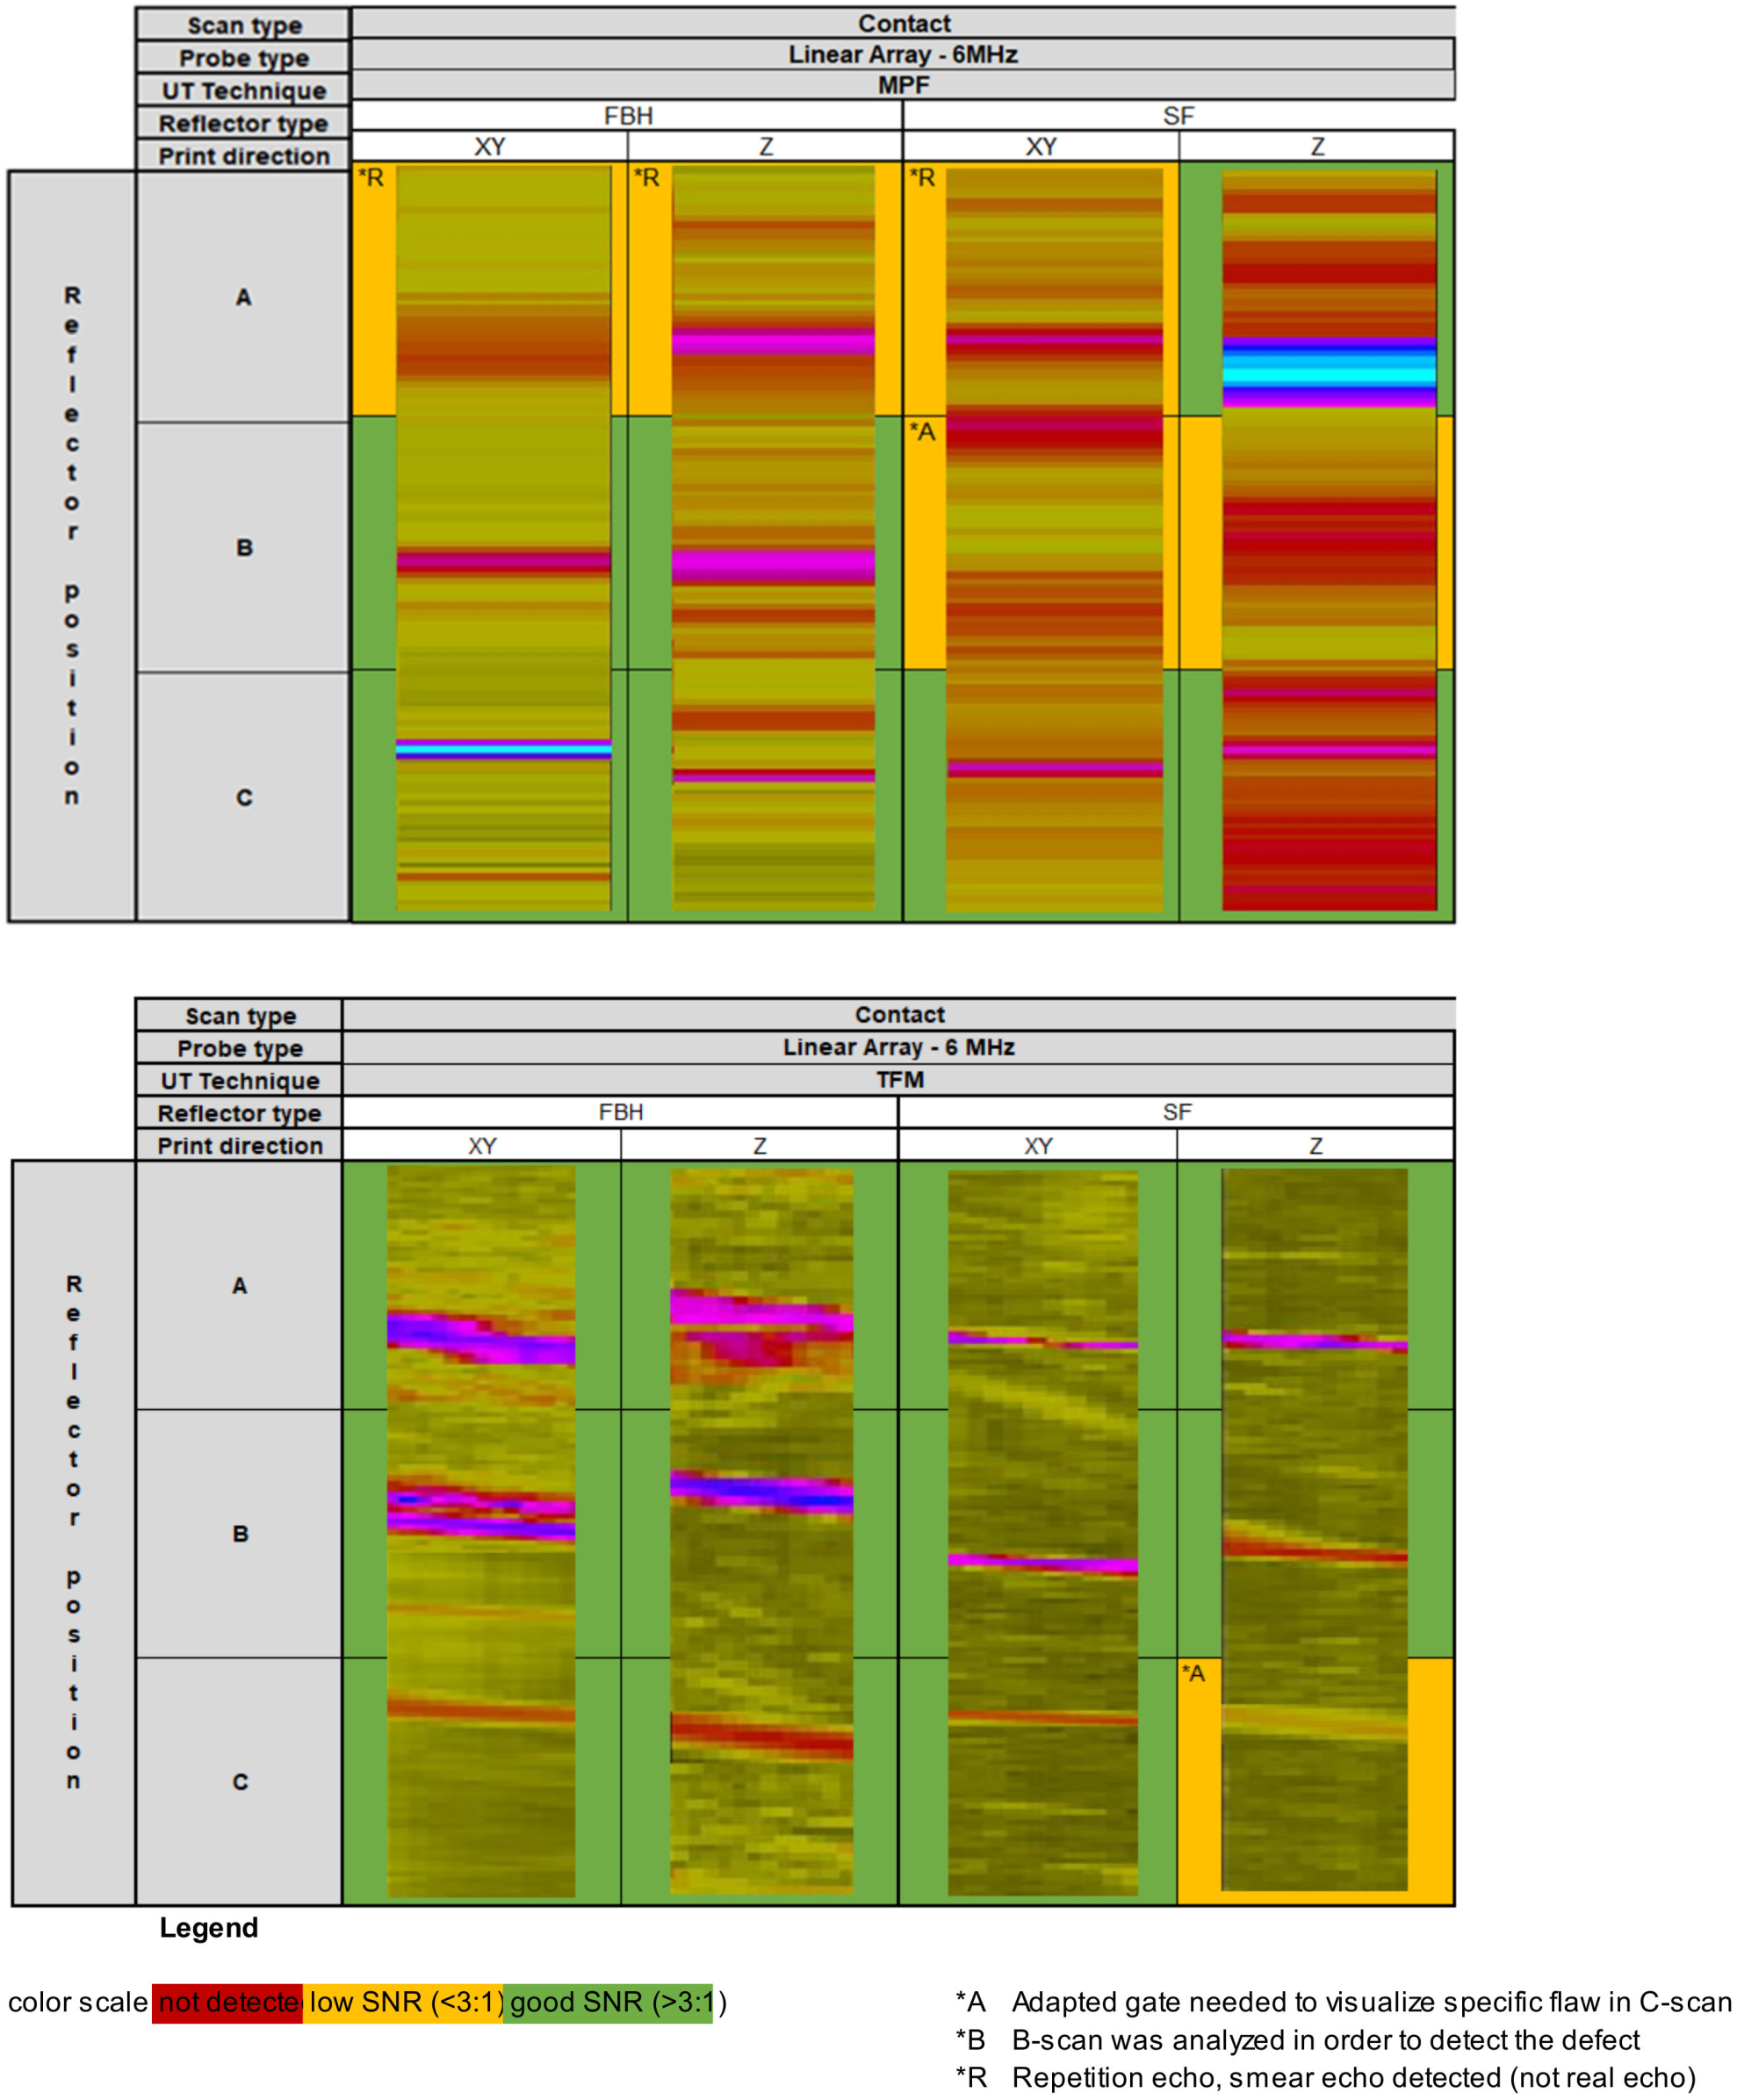
Figure 14 reports the results of the defect detection performed using in contact configuration the LA probe in combination with the MPF and TFM. The same colour code is applied.
The defects of the TFM contact scan are better distinguishable than the mono element transmit/receive scan. The flaw response and detectability of the far away surface is considerably lower due to the high attenuation present in this additive manufactured samples.
Figure 15 collects the immersion results obtained on the calibration block using both the MA and AA probe and the MPF and TFM technique. Since the immersion scanning was performed by the 3-Axis scanner, more data could be obtained. The C-scan images were all represented in the same standardized way. A considerable amount of UT data was acquired since a small scanning step size was applied (0.2 mm). Based on this data a trustworthy signal to noise (SNR) measurement could be performed in the CIVA UT analysis software. The SNR results were performed within an adapted gate.
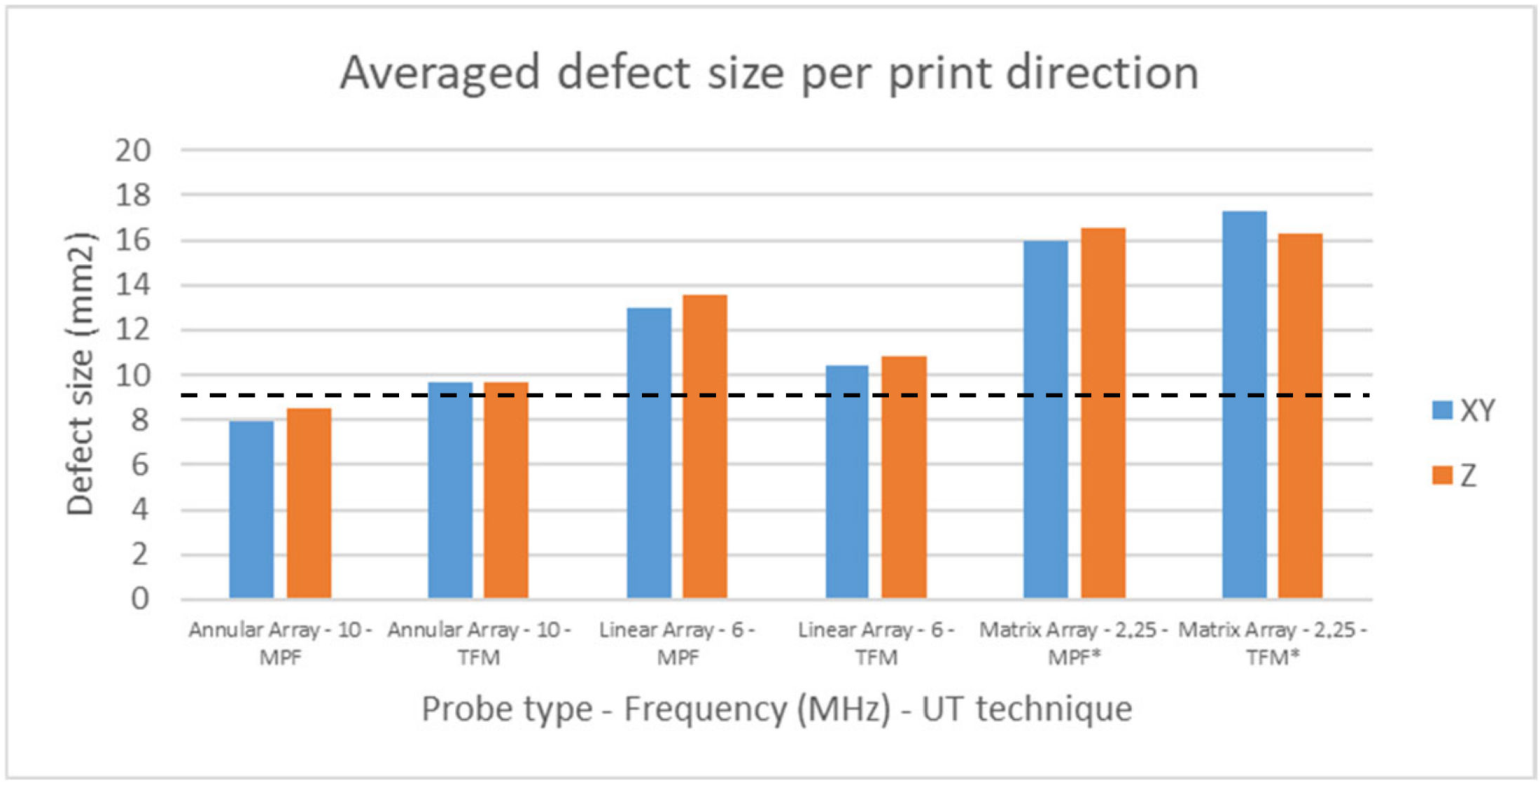
The results of the average measured defect size of all mechanical introduced flaws are reported in Figure 16. Since only one X-value and Y-value were obtained for the area calculation, the areas were represented as a square. By applying this calculation method, the size of each FBH and/or SF in the calibration blocks should be 9 mm2. It is worth to notice that the averaged detectable size was calculated only with the defects actually detected by each technique. It is evident that the use of an AA probe in combination with the TFM method had better accuracy (closer to the nominal 9 mm2) than any other combination when working at 10 MHz. When the frequency increased, the sizing accuracy decreased in all cases. An oversizing occurs in case of 2.25 MHz. This is explained by the nature of the UT beam but also by the fact that in this case the F3A and P3A flaws (shallow flaws) were sized on the repetition echoes since masked by the UT dead zone.

5.4. Results on the Valve Body

The valve bodies were inspected with different approaches. The valve bodies with no defect were with AA probe combined with TFM technique. This technique appeared to be the best performing when referring to the results obtained on the calibration blocks. The valve body with SFs was inspected with both MA and AA probes in combination with MPF and TFM. Figure 17 shows the C-Scan results relative to one of the healthy valves obtained per quarter.
Figure 18 refers to the valve with the SF defects. It is worth to notice that the CAD shown in the center of both figures is the same, although in the valve included in Figure 17 the internal defects were not actually introduced. Apart from some geometrical echoes, no defects were reported in the valve body of Figure 17. On the C-scans in Q1 and Q4 the cut-out is visible, the volume beneath could not be inspected anymore. However, this volume was inspected from side 2, where the sensitivity for planar seeding flaws is proven till 31.5 mm depth. When inspecting the valve body with SF using the AA 10 Mhz probe, all the planar and volumetric seeding flaws were detected. It is important to notice that the depicted C-scans are selected to be shot specific in order to visualize the defects as good as possible. A focus is made on different levels depending on the region, for the “Near surface flaws” (A) a different C-scan image is presented as for the “Bulk flaws” (B).
Defects P2A and P3A appeared much less pronounced, most likely this was caused by the printing process. Due to the local cut-out in the surface at side one, defect P3B was hidden from side one. However, by inspecting the valve from side 2 this defect could be detected.
The results of the measured areas (see Figure 18 and Table 9) revealed that subsurface defects (P2A, P3A, P4A, V3A and V4A) were always undersized although the TFM performed better than MPF on volumetric defects (V3A and V4A). P2A and P3B were oversized, especially by using MPF. The volumetric defects were generally sized more accurately, especially by using TFM.

6. Conclusions

This paper presents the advanced ultrasonic (UT) inspection campaign performed on metallic AM parts intended for nuclear applications and fitting in the framework of the European project Horizon 2020 NUCOBAM. UT measurements were done on reference blocks, on calibration specimens and on three valve bodies, including one valve body with intentionally induced defects. Several UT inspection techniques and methods (Phased Array—PA, Multi Point Focusing—MPF, Total Focusing Method—TFM, etc.) were exploited, both in contact and in immersion configuration. Manual inspection along with mechanized scanning was also performed.
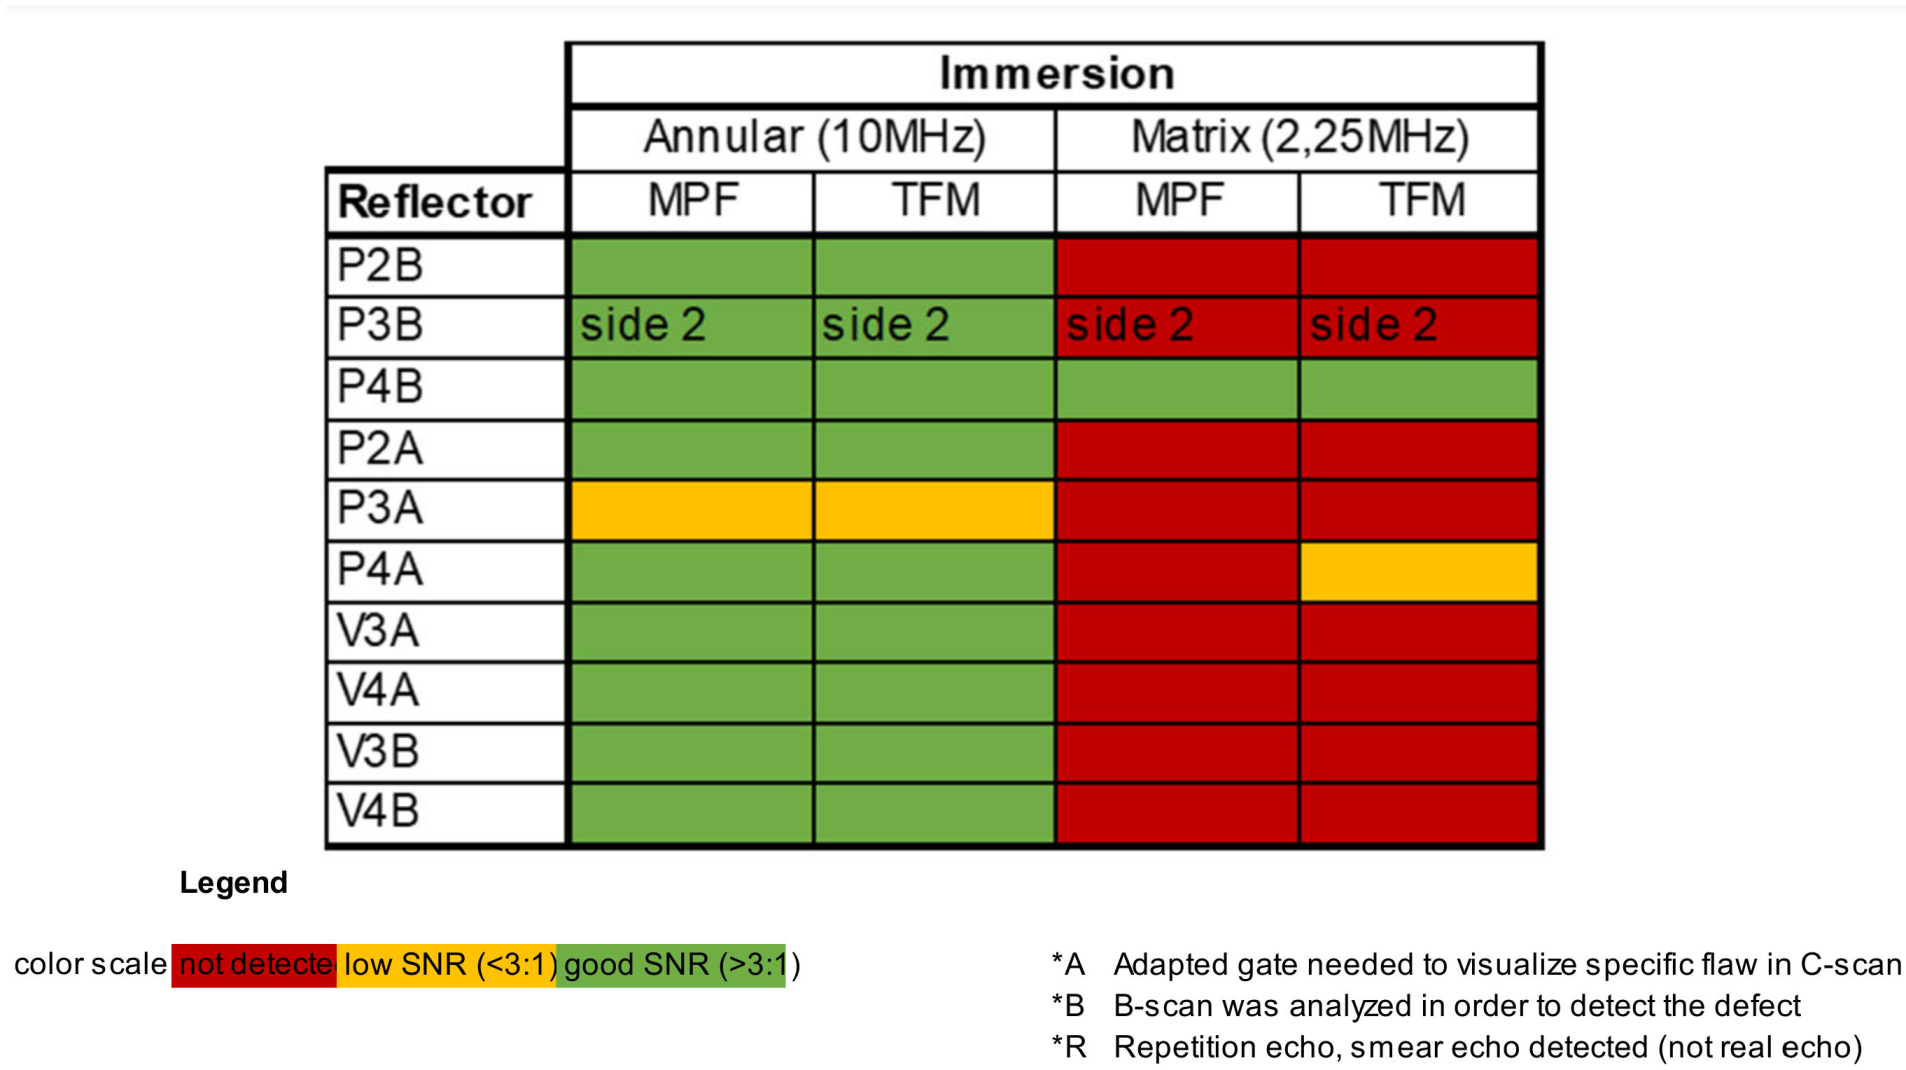
The tests on the reference blocks were used to measure the sound velocity in function of the printing direction. The calibration blocks were tested to get more insight on the detection capabilities of each of the UT techniques used for this work. Furthermore, in these calibration blocks both mechanically introduced planar flaws as planar seeding flaws were present, as a result the responses of those flaw types could be compared. The flaw sizes and the acceptance criteria were selected by Laborelec based on a review of different requirements and recommendations in international standards and norms. Figure 19 includes the analysis results of all the tests performed on the calibration blocks, containing flat bottom holes (FBHs), and seeding flaws (SFs) with a 3 mm-diameter.
The overview clearly shows the advantages of using Total Focusing Method (TFM) compared to other techniques. Using TFM allowed to increase detectability, obtain higher SNRs and improve the sizing.
Based on the results obtained on the calibration blocks (corroborated also by preliminary CIVA simulations performed by Laborelec for the selection of the type of probe to exploit), the three valve bodies were tested using only TFM and MultiPoint Focusing (MPF). In this case, the annular and matrix phased array (PA) probes were used. Two of the tested valves (no. 1 and 3) were produced with no internal defects while valve body2 was manufactured with defects. These defects were introduced by altering (in a controllable and repeatable way) the printing parameters during the manufacturing operations. The following flaws were generated: 4 rectangular Seeding Flaws (SF) in connection area; 5 SFs at 2 mm from surface and diameters of 2, 3 or 4 mm (3 planar SF and 2 volumetric P2A, P3A, P4A, V3A, V4A); 7 flaws in mid plane and diameters of 2, 3 or 4 mm (P2B, P3B, P4B, V3B, V4B, PSC3B, PSR3A). Two flaw positions in depth (A = 2 mm and B = 31 mm) were used.
Figure 20 includes an overview of the analysis results of all the tests performed on the valve body2. Only the accessible defects were inspected (this excludes PSC3B and PSR3A as well as the 4 rectangular ones). The results showed that an annular array provides better performance in terms of detectability compared to MA probe. The combination of AA probe and TFM seems to be the best. The working frequency of 10 MHz is slightly higher of what is found in literature but is recommended for better defects sizing considering the target size to be reported. The negative effects of the attenuation on this inspection frequency ( the higher the frequency the stronger the attenuation) are partially compensated by the shape of the probe as well as by the characteristics of the TFM technique.
Based on the obtained above presented results and discussion, the authors propose the following itemized summary to be used as reference for future work on the UT inspection of AM metallic parts:
  • The reproducibility of printing internal seeding defects (planar and/or volumetric) should be verified via test-blocks subjected to destructive tests and/or X-ray.
  • Internal seeding flaws with biggest dimension of 2–3 mm should be included (at different depths and orientations) in calibration blocks having geometrical characteristics similar to those of the final part to be inspected.
  • Reference blocks should be used to evaluate the effect of the printing direction on attenuation, SNR and change of the UT propagation velocity (for longitudinal and shear waves) with the UT probe angle.
  • Phased Array probes working in the region of 10 MHz (±2 MHz) should be preferred and ideally designed in CIVA for the specific case.
  • Techniques like FMC + TFM should be preferred since they appear to outperform other methods and to overcome many of the limitations induced by the AM.
  • Adaptive TFM and/or Phase Coherence Imaging (PCI) should be taken into consideration for shallow defects similar to porosities.

Author Contributions

A.L. designed the inspection campaign, performed the inspection, analysed the results and wrote the manuscript. W.V.E. performed the inspection, analysed the data, helped in writing, reviewing and editing. S.N. followed the manufactured of all parts and components and helped in reviewing and editing of the manuscript. All authors have read and agreed to the published version of the manuscript

Funding

This research was funded by EU H2020-Euratom program via NUCOBAM Grant agreement ID: 945313.

Conflicts of Interest

The authors declare no conflicts of interest.

References

  1. Hensley, C.; Sisco, K.; Beauchamp, S.; Godfrey, A.; Rezayat, H.; McFalls, T.; Galicki, D.; List, F.; Carver, K.; Stover, C.; et al. Qualification pathways for additively manufactured components for nuclear applications. J. Nucl. Mater. 2021, 548, 152846. [Google Scholar] [CrossRef]
  2. Kang, S.H.; Suh, J.; Lim, S.Y.; Jung, S.; Jang, Y.W.; Jun, I.S. Additive manufacture of 3 inch nuclear safety class 1 valve by laser directed energy deposition. J. Nucl. Mater. 2021, 547, 152812. [Google Scholar] [CrossRef]
  3. Ashton, L. Embracing the Promise of Additive Manufacturing for Advanced Nuclear Reactors; International Atomic Energy Agency (IAEA): Vienna, Austria, 2023; Volume 64-3. [Google Scholar]
  4. Peng, Z.; Xu, W.; Liu, Y.; Zhao, K.; Hu, A.P. Anisotropy Evaluation and Defect Detection on Laser Power Bed Fusion 316L Stainless Steel. Micromachines 2023, 14, 1206. [Google Scholar] [CrossRef] [PubMed]
  5. Wang, X.; Li, W.; Li, Y.; Zhou, Z.; Zhang, J.; Zhu, F.; Miao, Z. Phased array ultrasonic testing of micro-flaws in additive manufactured titanium block. Mater. Res. Express 2020, 7, 016572. [Google Scholar] [CrossRef]
  6. Ramírez, I.S.; García Márquez, F.P.; Papaelias, M. Review on additive manufacturing and non-destructive testing. J. Manuf. Syst. 2023, 66, 260–286. [Google Scholar] [CrossRef]
  7. Rao, J.; Sain, A.; Yang, J.; Ratassepp, M.; Fan, Z. Ultrasonic imaging of irregularly shaped notches based on elastic reverse time migration. NDT E Int. 2019, 107, 102135. [Google Scholar] [CrossRef]
  8. Miao, W.; Liu, N.; Huang, J.; Lu, M. Adaptive Ultrasonic Full Matrix Capture Process for the Global Imaging of Complex Components with Curved Surfaces. Sensors 2024, 24, 225. [Google Scholar] [CrossRef] [PubMed]
  9. ISO/ASTM TR 52906:2022; Additive Manufacturing—Non-Destructive Testing—Intentionally Seeding Flaws in Metallic Parts. ASTM International: West Conshohocken, PA, USA, 2022.
  10. NF EN 10228-4; Non-Destructive Testing of Steel Forgings—Part 4: Ultrasonic Testing of Austenitic and Austenitic-Ferritic Stainless Steel Forgings. CEN: Brussels, Belgium, 2016.
  11. AFCEN. RCC-M. Design and Construction Rules for Mechanical Components of PWR Nuclear Islands. Available online: https://www.afcen.com/en/rcc-m/194-rcc-m.html (accessed on 28 April 2024).
  12. AMSSTD2154E; Inspection, Ultrasonic, Wrought Metals, Process. SAE International: Warrendale, PA, USA, 2021.
  13. NF EN 12680-1; Founding. Ultrasonic Examination Steel Castings for General Purposes. British Standard Institution (BSi): London, UK, 2003.
  14. ASME B16.34; Valves Flanged, Threaded and Welding End. ASME: New York, NY, USA, 2021.
  15. ASME B31.1; Power Piping. ASME: New York, NY, USA, 2022.
Figure 1. pTstblck test block.
Ndt 02 00014 g001
Figure 2. vTstblck test block.
Ndt 02 00014 g002
Figure 3. Reference Blocks.
Ndt 02 00014 g003
Figure 4. Calibration blocks. (a) Isometric view with arrow indicating the machined side exposed to UT; (b) top view with schematic representation explaining the naming logic CAL Z SF; (c) lateral view with 3D printed names; (d) schematic representation explaining the naming logic CAL XY SF.
Ndt 02 00014 g004
Figure 6. (a) Scan areas of the Valve body. (b) inspection sides for the valve body with S1Q4 indicated the inspection done on side 1 in the fourth quadrant Q4.
Ndt 02 00014 g006
Figure 7. Example of defect sizing by −6 dB drop—F3B flaw in Cal XY specimen by LA—TFM.
Ndt 02 00014 g007
Figure 8. Averaged sound velocity results and their deviation by contact scanning.
Ndt 02 00014 g008
Figure 9. Average sound velocity results with their deviation by immersion scanning.
Ndt 02 00014 g009
Figure 10. Longitudinal sound velocities depending on print direction and sound propagation angle.
Ndt 02 00014 g010
Figure 11. Results attenuation distinguishment per inspection direction, frequency (contact).
Ndt 02 00014 g011
Figure 12. Attenuation results on reference blocks.
Ndt 02 00014 g012
Figure 13. C-scan results—contact scanning 5 MHz (top) and 10 MHz (bottom) mono element probe. The red, orange, green colour scale to the table cell and not to the ultrasonic colour bar.
Ndt 02 00014 g013
Figure 14. C-scan results—contact scanning 6 MHz Linear Array with MPF (top) and TFM (bottom).
Ndt 02 00014 g014
Figure 15. C-scan results—immersion scanning 2.25 MHz MA (left) and 10 MHz (right) AA with MPF (top) and TFM (bottom).
Ndt 02 00014 g015
Figure 16. Average defect areas measured across the depth of the calibration blocks.
Ndt 02 00014 g016
Figure 17. C-scan results of the valve no.1 with no defects—UT with AA and TFM by immersion.
Ndt 02 00014 g017
Figure 18. C-scan results of the valve with SF defects—UT with AA and TFM by immersion.
Ndt 02 00014 g018
Figure 19. Summary of the analysis results on the calibration blocks.
Ndt 02 00014 g019
Figure 20. Summary of the analysis results on the valve body with internal defects.
Ndt 02 00014 g020
Table 1. Designation of flaw type, geometry and position in calibration blocks and valve bodies.
NDT Flaw Designation
X
(letter/s indicating the type of flaw)
X = F: Flat Bottom Hole
X = P: Planar SF
X = V: Volumetric SF
X = PSR Planar Skewed Radial SF
X = PSC Planar Skewed Circumferential SF
#
(number indicating the diameter Φ in mm)
Y
(letter indicating the depth position)
Y = A: subsurface at 2 mm
Y = B: bulk material mid plane at 17 mm
Y = C: deep far surface at 31 mm
Ex 1. Flat Bottom Hall type of defect with 2 mm in diameter and positioned 2 mm from the inspection surface
F2A
Ex 2. Planar seeding flaw with 3 mm in diameter and positioned in the bulk (mid plane) of the test specimen
P3B
Ex 3. Volumetric seeding flaw with 4 mm in diameter and positioned far away from the inspection surface
V4C
Table 2. pTstblck test block with embedded SFs.
SF IDSF TypeArea (Z-Plane) (mm2)Distance from Top Plane (mm)Thickness LOF (µm)
p1Planar circular7.15100
p2Planar circular3.15200
p3Planar circular7.115.75200
p4Planar circular3.115.75200
p5Planar circular7.131.5100
p6Planar circular3.131.5100
c1Conversion rectangular0.45200
c2Conversion rectangular0.215.75100
Table 3. vTstblck test block with embedded SFs.
SF IDSF TypeArea (Z-Plane) (mm2)Distance from Top Plane (mm)Thickness LOF (µm)
v1Void 7.15n.a
v2Void 3.15n.a
v3Void 7.115.75n.a
v4Void 3.115.75n.a
v5Void 7.131.5n.a
v6Void 3.131.5n.a
p7Planar circular0.623200
p2Planar circular0.411200
Table 4. Scanner settings per specimen to be scanned.
SpecimenX (mm)Y (mm)Z (mm)Step (mm)
Calibration block303000.2
Reference block1412600.2
1 quarter of the valve body806000.2
Table 5. Number and type of immersion UT tests on calibration blocks. A total of 24 inspections were performed, 8 for each type of probe. For a given type of probe, half (i.e., 4) of the inspections were performed using MPF and half via FMC-TFM. The third row indicated the type of flaw included in the calibration block under inspection while the last row refers to the relative orientation between the calibration block and the building direction.
Immersion (60 mm of Water Height)
Annular Array (AA)Linear Array (LA)Matrix Array (MA)
MPFTFMMPFTFMMPFTFM
FBHSFFBHSFFBHSFFBHSFFBHSFFBHSF
XYZXYZXYZXYZXYZXYZXYZXYZXYZXYZXYZXYZ
Table 6. Number and type of contact UT tests on calibration blocks. A total 16 inspections were performed, 8 for each using the single element probes and 8 using the LA probe. For the single element probe, 4 inspections were conducted at 5 MHz and 4 at 10 MHz. MPF and FMC-TFM were used with the LA probe. The third row indicated the type of flaw included in the calibration block under inspection while the last row refers to the relative orientation between the calibration block and the building direction.
Contact
single elementLinear Array (LA)
5 Mhz 10 MhzMPFTFM
FBHSFFBHSFFBHSFFBHSF
XYZXYZXYZXYZXYZXYZXYZXYZ
Table 7. Standards and codes screened for proposing acceptance criteria.
Forgings Casting Welds ASME
NF EN ISO 10228-4, class 2 [10]

RCC-M M3301 [11]

AMS-STD-2154E class B [12]
NF EN 12680-1 class 2 [13] no complete standards for examination of austenitic weldsASME B16.34: Valves—Flanged, Threaded, and welding End [14]

ASME B31.1: Power piping [15]
Table 8. UT Acceptance criteria.
UT Response AmplitudeActionType of DefectResult
> or = Ref dBCharacterize + reportVolumetric or LinearNon acceptable
20–50% of Ref dBCharacterize + report
Linear (=crack/LOF)Non acceptable
> or = to 3 mmVolumetricNon acceptable
Table 9. Error on the measured defect areas compared to nominal values. Comparison between MPF and TFM technique—10 MHz AA probe. Max error in red and min error in green.
DefectMeasured
(mm2)
Nominal (mm2)Abs Error
(mm2)
MPFTFM MPFTFM
P2A1.20.842.83.2
P2B13.6112.0649.618.06
P3A1.61.297.47.8
P3B21.4511.76912.452.76
P4A6.165.72169.8410.28
P4B14.7214.36161.281.64
V3A1.965.297.043.8
V3B11.712.892.73.8
V4A2.812.161613.23.84
V4B14.3612161.644
Disclaimer/Publisher’s Note: The statements, opinions and data contained in all publications are solely those of the individual author(s) and contributor(s) and not of MDPI and/or the editor(s). MDPI and/or the editor(s) disclaim responsibility for any injury to people or property resulting from any ideas, methods, instructions or products referred to in the content.