Abstract
Against the backdrop of the accelerated integration of culture and tourism in China, red cultural tourism, as an important component of China’s cultural tourism system, urgently requires a systematic assessment of its development status and synergistic impact mechanisms. This study takes the Long March tourism resources in Yunnan as the research object and constructs a comprehensive evaluation system integrating social influence and ecological carrying capacity. By applying GIS spatial analysis, as well as K-means and XGBoost machine learning models, the development level of red cultural tourism in Yunnan is quantitatively assessed. Furthermore, the interpretable SHAP model is employed to identify the contribution of each evaluation indicator and to analyze the relationships among development levels under three different indicator models. The results reveal that (1) the development level of red cultural tourism in Yunnan generally exhibits a spatial pattern of being lower in the northwest and higher in the southeast; (2) transportation accessibility (TA), average annual precipitation (AAP), and average annual temperature (AAT) are the dominant indicators influencing the development level; (3) there are significant disparities in development levels among cities, indicating that future development needs to comprehensively consider both the social influence and ecological carrying capacity of red cultural tourism resources and adhere to a “social–ecological” synergistic development mechanism. This study not only uncovers the synergistic impacts of social and ecological dimensions on the development of red cultural tourism in Yunnan but also provides theoretical and data support for the optimization and sustainable development of Yunnan’s red cultural tourism resources.
1. Introduction
In recent years, with continuous policy improvements and promotion, China’s cultural and tourism industry has developed rapidly. It has become an important driver of regional economic growth and cultural dissemination [1]. In 2025, the State Council of China introduced several new cultural and tourism policies. These measures encourage institutions with study tourism resources to provide high-quality content, expand supply, and establish new bases and related courses. At the same time, the government called for cultivating strong educational tourism brands and enterprises, while also promoting inbound study tourism. In addition, China supports local museums, art galleries, and libraries in curating high-level exhibitions. Cultural heritage venues, scenic areas, and historic districts are encouraged to create immersive experience spaces and introduce new products and tourism scenarios. The deep integration of culture and tourism not only promotes economic diversification but also provides new pathways for cultural heritage protection and transmission [2,3]. Against this backdrop, diverse forms of cultural tourism have emerged. Among them, red cultural tourism, with its unique cultural connotations and social value, has become a growing focus in both academia and industry [4,5,6]. However, while developing rapidly, red cultural tourism faces critical challenges. The central issue is how to achieve synergies among economic benefits, cultural inheritance, and ecological protection. This makes it a key topic requiring further exploration in the study of regional sustainable development.
Red cultural tourism in China refers to tourism activities centered on revolutionary sites, memorials, and cultural heritage related to the history of the Chinese Communist Party. Among them, Long March tourism is a significant branch. It highlights the heritage, memorial sites, and cultural landscapes associated with the Long March (1934–1936), which was a major historical event in modern Chinese history. These sites not only serve as important carriers of historical memory but also provide a foundation for ideological education and patriotic tourism. The landmark red cultural scenic spots in each city that have been developed as Long March tourism resources in Yunnan are shown in Figure 1.
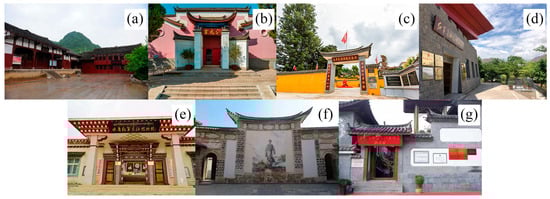
Figure 1.
Red Long March landmark scenic spots in each city: (a) represents the Former Site of the Zaxi Conference in Zhaotong; (b) represents the Sanyuan Palace in Qujing; (c) represents the Kedu Long March Memorial Hall in Kunming; (d) represents the Yuanmou Long March Memorial Hall in Chuxiong; (e) represents the Long March Museum in Diqing; (f) represents the Long March Crossing Dali Memorial Hall; (g) represents the Long March Crossing Lijiang Memorial Hall.
As an important component of China’s cultural tourism system, red cultural tourism carries special historical memories and the function of spiritual inheritance [7,8,9]. It also plays a vital role in ideological and political education for youth [10]. In recent years, studies in philosophy and the social sciences have advanced this field. Scholars have mainly examined cultural identity, collective memory, and tourist experiences, exploring both development levels and social impacts [11,12,13]. Existing research can be divided into several themes. From a governance perspective, Wang Hongyu et al. used case studies to demonstrate the influence of layered governance structures on the sustainable development of red cultural heritage sites [14]. From a socio-spatial perspective, Lin Chunfeng analyzed Yan’an and demonstrated the close relationship between tourism promotion and social space [15]. From a regional heritage perspective, Yunnan has explored the social value of red cultural heritage through initiatives such as the “Five Stories” campaign and the construction of the Long March National Cultural Park [16]. These studies have enriched academic knowledge of red cultural tourism. However, clear limitations remain. First, most studies rely on qualitative analysis, lacking quantitative research on spatial distribution, tourist behavior, and ecological carrying capacity. Second, few systematically discuss the synergies between social and ecological factors, which restricts a comprehensive assessment of development potential. Third, Yunnan, as a tourism hub in China and a key point in the Long March, is rarely discussed. These gaps are significant because red cultural tourism is not only a cultural practice but also a part of regional sustainable development. Addressing them would help optimize long-term strategies for the protection of regional red cultural heritage and tourism development.
In recent years, quantitative methods such as GIS and data mining have been increasingly applied to red cultural tourism [17,18,19]. GIS techniques, including buffer analysis, kernel density analysis, and exploratory spatial analysis, provide important tools for examining the spatial structure of tourism resources [20,21,22]. At the same time, scholars have investigated political, economic, and experiential dimensions. From a political perspective, Q methodology has identified four key factors shaping memorable red tourism experiences, emphasizing the dual roles of cultural authenticity and political objectives [23]. From an economic perspective, a longitudinal study showed that red tourism promoted rural consumption and regional GDP growth, helping to narrow the urban–rural gap [24]. From the perspective of tourist experience, the SOR framework confirmed that red tourism enhances well-being through a chain mediation of positive emotions and national identity [25]. Studies in Jiangxi and Mount Jinggang used big data and structural equation modeling to show that destination image and cultural atmosphere shape tourist satisfaction and red memory [26,27]. Research on the Xiangjiang Battle Memorial Park demonstrated that environmental perception indirectly triggered spiritual uplift through emotional transformation [28]. Nevertheless, most of these studies are based on small-scale case surveys. They involve limited samples and lack regional representativeness. More importantly, few adopt an integrated framework that evaluates social, economic, and ecological benefits simultaneously [29,30]. Without systematic understanding of “social–ecological” interactions, strategies tend to overemphasize economic or cultural benefits while neglecting ecological capacity and social equity. This restricts theoretical progress on the sustainable development of red cultural tourism and reduces its relevance for regional development. More critically, it risks generating short-term growth while undermining long-term resilience and sustainability.
In summary, to address these research gaps, this study integrates social influence and ecological carrying capacity to conduct a quantitative evaluation of red cultural tourism in Yunnan, focusing on Long March cultural resources. By examining “social–ecological” synergies, it aims to reveal how integrated governance of social and ecological factors can enhance the long-term resilience of tourism destinations. We apply K-means and XGBoost models to integrate both social and ecological indicators. Spatial interpolation is used to map continuous development patterns, and SHAP values are applied to evaluate the contribution of each indicator. The aim is to study the following issues:
- (1)
- To conduct a comprehensive quantitative evaluation of the current status of red cultural tourism development in Yunnan, China, using GIS and interpretable machine learning methods.
- (2)
- To analyze the spatial distribution pattern of the current development status of red cultural tourism, providing scientific data and theoretical support for the sustainable integration and coordinated development of red cultural tourism resources in Yunnan, China.
- (3)
- To examine the mechanisms of synergy between social and ecological indicators.
2. Study Area and Data
2.1. Overview of the Study Area
Yunnan, located in the southwestern border of China, is an important region for red cultural tourism and one of the key provinces traversed during the Long March (Figure 2). The Red Army passed through seven cities and prefectures, including Kunming, Qujing, Zhaotong, and others. After the Zaxi Conference in Weixin County, the Red Army reached a crucial historical turning point and successfully crossed the Jinsha River at Jiaoping Ferry Crossing. Geographically, Yunnan lies in the western part of the Yunnan-Guizhou Plateau. Its terrain is complex and diverse, with higher elevations in the northwest and lower elevations in the southeast, creating sharp elevation differences and a distinct three-dimensional climate. These natural conditions shaped the Red Army’s difficult survival environment during the Long March and also determine the spatial distribution of red cultural tourism resources today. Remote mountain areas preserve sites such as Meili Snow Mountain, while basins and river valleys contain more accessible memorials such as the Kedu Long March Memorial Hall and heritage clusters such as the Zaxi Conference Site. This spatial heterogeneity directly affects the accessibility, development potential, and attractiveness of red cultural heritage sites. As a crucial hub during the Long March and a region rich in red cultural heritage, Yunnan preserves 129 related sites. These sites are not only witnesses to history but also valuable assets for contemporary red tourism, continuing to attract visitors from both China and other countries. With its distinctive geographical environment and established tourism infrastructure, Yunnan provides a typical and significant case for evaluating the sustainable development of red cultural tourism.
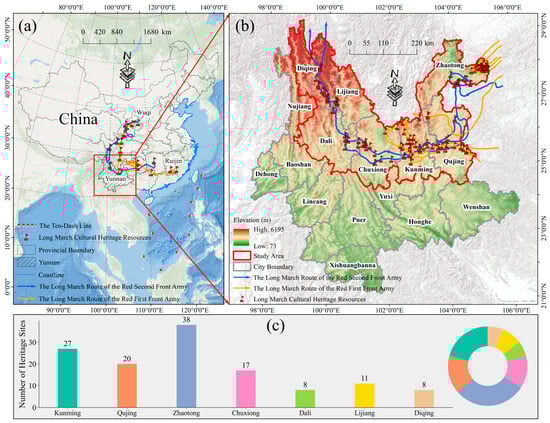
Figure 2.
Overview of the study area: (a) represents the location of Yunnan Province within China and the entire Long March route; (b) represents the spatial distribution of Long March heritage resources and the Long March route within Yunnan Province; (c) represents the distribution quantity and proportion of Long March heritage resources in each city of Yunnan Province.
2.2. Data and Preprocessing
We categorize the influencing indicators into social influence indicators and ecological carrying capacity indicators. The multi-source heterogeneous data utilized are as follows (Table 1). Before modeling, we cleaned the POI, search term frequency (STF), and tourist ratings (TR) datasets. Duplicate records collected by web crawling and irrelevant scenic spots were removed. For the transportation network (TN), we performed batch segmentation and carried out topological checks and corrections. Next, based on the processed road network data, we used ArcGIS network analysis to obtain the transportation accessibility (TA) indicator. From the processed POI data, we used ArcGIS kernel density analysis to calculate the kernel density (KD) indicator. For raster-based indicators, we resampled the data to a uniform spatial resolution to ensure spatial consistency. We then unified the coordinate systems of all layers in ArcGIS and extracted the indicator data to each Long March tourism resource point. Finally, we applied a series of basic dimensionless processing steps, including data standardization and data translation. Data standardization was used to unify the dimensions of evaluation indicators. Data translation, achieved by adding a value of one (1) to all standardized values, was used to eliminate the influence of zero values on the evaluation. These steps were used to construct the evaluation indicator dataset, which serves as input for subsequent modeling and comprehensive score calculations.

Table 1.
Data source.
3. Methodology
We adopt a multi-dimensional evaluation framework to systematically analyze the current development status of Long March tourism resources (Figure 3). Firstly, based on the ArcGIS platform, we integrate basic geographical data such as tourism resource POI, transportation networks, social influence indicators, and ecological carrying capacity indicators to construct the evaluation indicator dataset. Secondly, using the K-means and XGBoost models, we output the evaluation scores for each Long March tourism resource, comprehensively analyzing the spatial differentiation characteristics of these resources under social and ecological influences. Finally, we quantify the contribution of each indicator to the overall score using the SHAP model, revealing the synergistic mechanism of the “social–ecological” indicators.
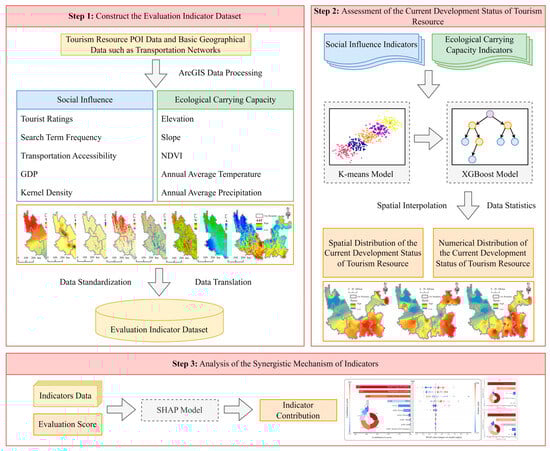
Figure 3.
Research methodology framework.
3.1. Spatial Pattern Analysis
3.1.1. Kernel Density
We use the ArcGIS kernel density analysis tool, taking Long March tourism resources as central points, to calculate the probability of their occurrence within a specified radius, which is represented by the kernel density (KD) value (Equation (1)). This value is used to construct the kernel density (KD) indicator within the social influence indicator [33].
In this equation, represents the kernel density estimate of the Long March tourism resources at point ; denotes the number of Long March tourism resources; represents the bandwidth; is the spatial weight function, which can be regarded as the weight of the Long March tourism resource ; and represents the distance between two points within the specified bandwidth.
3.1.2. Transportation Accessibility
Transportation accessibility (TA) refers to calculating the average travel time along the shortest path from all starting points to a specific Long March tourism resource (Equation (2)). This indicator visually reflects the ease or difficulty of accessing Long March tourism resources from a particular area [34]. It is used to construct the transportation accessibility (TA) indicator within the social influence indicator.
In this equation, represents the transportation accessibility from the -th starting point in the region to a Long March tourism resource. A smaller value of indicates better accessibility to the Long March tourism resource from that point. denotes the travel time from starting point to Long March tourism resource along the shortest path in the transportation network. represents the total number of Long March tourism resources.
In addition, we use the ArcGIS network analysis tool to calculate transportation accessibility (TA), constructing the accessibility analysis network using national roads, provincial roads, county roads, rural roads, and urban roads in the study area [35]. Based on the road network hierarchy and referring to China’s “Highway Engineering Technical Standards” (JTG B01—2014) as well as other scholars’ research, corresponding speed values are assigned to different road levels (Table 2).
Table 2.
Road speed assignment table for different road levels.
Finally, we examine the spatial distribution patterns of each indicator across the study area. The processed indicator values are then sampled at each Long March tourism resource point. These values are compiled into a tabular dataset, which provides the basis for subsequent clustering, evaluation, and mechanism analysis.
3.2. Evaluation of the Current Development Status
3.2.1. K-Means Model
The K-means model is a partition-based unsupervised learning algorithm that divides numerical data into clusters, maximizing the similarity within clusters and maximizing the differences between clusters (Equations (3)–(5)). It also offers high scalability and efficiency when handling relatively large datasets [36]. Chen Meiwen et al. applied the K-means method to classify various online user review data, which was then used to calculate the importance of tourism nodes [37]. Compared with other clustering methods, the K-means model is simple and fast. In our case, the indicator dataset consists of sampled numerical data, which is not structurally complex but relatively large in size. Therefore, we use the K-means model to perform unsupervised ranking of each evaluation indicator for the subsequent comprehensive assessment of the current development status.
First, the K-means model randomly selects data points as the initial centroids for the input data. We choose five initial centroid values for clustering [37]. In the equation, represents the Euclidean distance from each feature value to all centroids, where is the feature value, is the centroid of the -th cluster, represents the -th cluster, and is the compactness metric of the cluster. A smaller value indicates better clustering performance. By minimizing the within-cluster sum of squared errors (SSE), the centroids are iteratively updated until no further changes occur, resulting in the best centroids, which define the cluster divisions. We use the ranked outputs of K-means model as ordinal features, together with the original standardized and translated indicators, as the training inputs for the subsequent XGBoost model.
3.2.2. XGBoost Model
XGBoost, also known as Extreme Gradient Boosting, is an advanced ensemble learning algorithm. It offers strong predictive performance, greater reliability, and robustness against multicollinearity. In addition, when combined with SHAP, it provides interpretability. Compared with black-box models such as Random Forests (RF), XGBoost is more suitable for evaluating the contribution of indicators in this study [38]. Therefore, we calculate the weight of each evaluation indicator using the built-in feature importance assessment mechanism of the XGBoost model [39]. By applying the feature values of Long March tourism resources and their corresponding weights, we perform the final weighted calculation to obtain the development status evaluation scores for each Long March tourism resource (Equations (6) and (7)).
In this equation, represents the evaluation score of the development status, denotes the -th feature value of the current Long March tourism resource, represents the weight of the feature computed by the XGBoost model based on information gain, denotes the number of decision trees in the model, which is set to 100 in this study, and takes the value of one (1) when the -th feature is used as a splitting node, otherwise it is zero. The output score of each Long March tourism resource point is recorded as a point attribute and subsequently used as input for spatial interpolation.
3.2.3. Inverse Distance Weighting Spatial Interpolation
To observe the spatial distribution of the development status of Long March tourism resources, we use the Inverse Distance Weighting (IDW) method. Based on the known development status evaluation scores of Long March tourism resource points output by the XGBoost model, we perform spatial interpolation for the unknown areas within the study region [40,41]. The core idea is to assume that the value at a known point is influenced by surrounding known points, with the influence decreasing as the distance increases (Equation (8)).
This method assumes that the weight of a known point on an unknown point is inversely proportional to the power of the distance. Thus, the value of the unknown point can be calculated using a weighted average. In the equation, and represent the evaluation score and weight of the -th known point, respectively, and denotes the number of known points involved in the calculation.
3.3. Discussion of the Synergistic Mechanism
We use the SHAP model to calculate the contribution of each indicator under the comprehensive indicator model, social influence indicator model, and ecological carrying capacity indicator model. The aim is to quantitatively explore the synergistic mechanism of social and ecological factors in the development of Long March tourism resources [42,43]. SHAP analysis is conducted on the trained XGBoost model using the same input feature matrix. In this process, the features are treated as participants, and the output values of the XGBoost model are regarded as the total gain. Finally, the score of each Long March tourism resource point is allocated into the contribution of each feature, expressed as SHAP values (Equation (9)).
In this equation, represents the set of all features, denotes a subset that does not include feature , and represents the model output value of subset . The weight term ensures that the marginal contribution of all possible subsets is fairly weighted.
4. Results
4.1. Spatial Pattern
Overall, the social influence indicators are mainly concentrated in Kunming, Qujing, and parts of Zhaotong and Diqing–Lijiang (Figure 4a). In contrast, the ecological carrying capacity indicators display distinct hotspots in Diqing–Lijiang and the northeastern part of Zhaotong (Figure 4b). Next, we focus on the potential mechanisms through which these spatial patterns influence the sustainable development of Long March tourism resources.
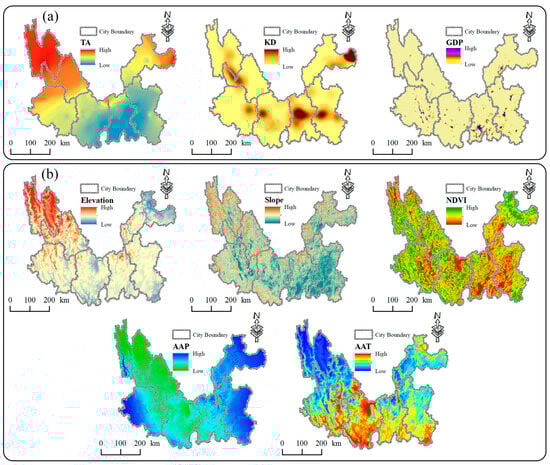
Figure 4.
Spatial distribution of each evaluation indicators: (a) represents the spatial distribution of the social influence indicator; (b) represents the spatial distribution of the ecological carrying capacity indicator.
The kernel density (KD) reaches higher values in several clustered areas, including central Qujing, Kunming, and the boundary between northeastern Zhaotong and Diqing-Lijiang. Transportation accessibility (TA) is better around Kunming and Qujing. However, it is relatively poor in remote clustered areas such as northeastern Zhaotong, showing a “core-centered” distribution pattern that spreads outward from Kunming. Overall, the Kunming–Qujing cluster has the highest transportation accessibility (TA), followed by the Chuxiong–Dali cluster. In contrast, the Zhaotong and Diqing–Lijiang clusters show concentrated distributions of Long March tourism resources. Yet, there are “fault zones” with no resource distribution between these clusters and the Kunming–Qujing and Chuxiong–Dali clusters. As a result, the overall accessibility of these two core areas is weak. This creates a pattern of “high resource density but poor accessibility.” Such a pattern suggests that spatial concentration of resources alone is insufficient. Without adequate transportation networks, both tourist arrivals and heritage site development are likely to be constrained.
Elevation and slope indicate that the terrain in the northwestern part of the study area is complex and relatively high. Although the northeastern part has lower elevation, the slope distribution still shows considerable terrain complexity, which restricts development and construction. In contrast, the Kunming–Qujing core cluster has moderate elevation and relatively gentle terrain, resulting in lower development difficulty. This is also closely related to its well-developed road network and good transportation accessibility (TA). NDVI, annual average precipitation (AAP), and annual average temperature (AAT) show significant spatial variation. These differences affect both the ecological suitability and the seasonality of tourism site development. Such natural constraints partly explain why some areas with high ecological value remain underdeveloped in social terms. Development is influenced not only by tourist demand, transportation, and economic conditions but also by the constraints imposed by local natural environments. This highlights the need to integrate social and ecological conditions when planning for the sustainable development of red cultural tourism.
In summary, these spatial patterns partly reflect the combined influence of the historical status of Long March tourism resources, local infrastructure endowment, promotion intensity, and surrounding natural environments. For example, the high concentration of sites in Zhaotong is linked to the historically significant Zaxi Conference held there, as well as to local heritage integration initiatives [16]. The advantages of Kunming are associated with its role as a transportation hub and its high level of tourist attention. In the northwestern region, the harsh natural environment also reinforces the symbolic value of the Long March’s resilience and its unconventional strategic choices.
4.2. Development Status
The development status evaluation scores under different indicator models obtained through the K-means and XGBoost models, as well as the spatial distribution results derived from inverse distance weighting interpolation, are shown in Figure 5. Under the social influence indicator model, the southeastern areas generally score higher than the northwestern areas, with Zhaotong, Kunming, and Qujing ranking at the top. Under the ecological carrying capacity indicator model, Qujing, Zhaotong, and Dali achieve higher scores. The comprehensive indicator model shows multiple high-value cores and clear gaps between urban and rural areas, as well as among different cities. We summarize three representative patterns: (1) strong social influence with moderate ecological capacity, as in Kunming; (2) strong performance in both social and ecological dimensions, as in parts of Zhaotong; and (3) weak social influence with moderate ecological capacity, as in Dali. These patterns underscore the importance of adopting differentiated development strategies tailored to local “social–ecological” conditions.
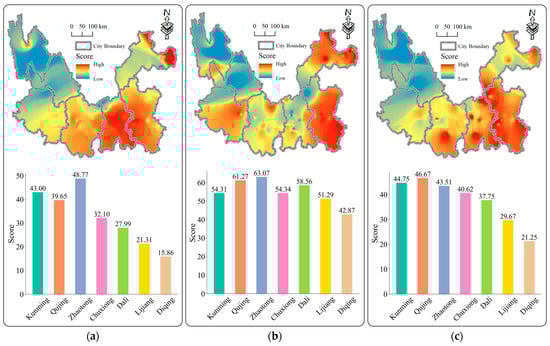
Figure 5.
The spatial distribution of the development status and the average evaluation scores of each city under different indicator models: (a) represents the social influence indicator model; (b) represents the ecological carrying capacity indicator model; (c) represents the comprehensive evaluation indicator model.
Different indicator models not only reveal spatial differences but also reflect the driving mechanisms behind the development of red cultural tourism in Yunnan. Areas with strong social influence often benefit from historical conditions, relatively well-developed infrastructure, and greater public visibility. In contrast, areas with strong ecological carrying capacity but weaker social conditions remain constrained by limited transportation and insufficient promotion. Placed within the broader sustainability discourse, these findings highlight that balanced “social–ecological” strategies are vital for strengthening the long-term resilience of red cultural tourism. For regional planning and tourism management, this provides clear policy implications. In ecologically rich but socially weak areas, efforts should prioritize infrastructure construction, transportation network development, and the enhancement of public awareness and promotion. In socially strong but ecologically fragile areas, strategies should instead focus on conservation and ecological improvement to ensure sustainable development.
4.3. Indicator Contribution
The output results of the SHAP model indicate significant differences in the contributions of various indicators under different indicator models (Figure 6). In the comprehensive indicator model, annual average precipitation (AAP), transportation accessibility (TA), and annual average temperature (AAT) are the dominant indicators. This highlights the core role of climate conditions and transportation in the overall development of Long March tourism resources in Yunnan. It also reflects the interaction between social and ecological forces. Although the contributions of NDVI and tourist ratings (TR) are relatively low, they still indicate that vegetation richness and visitor perceptions hold certain significance for development.
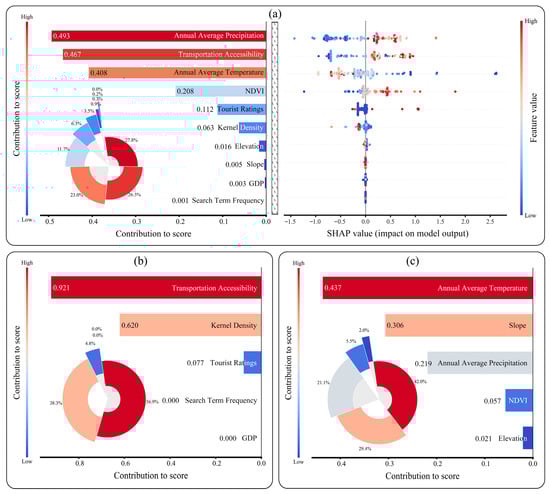
Figure 6.
The indicator contribution under different indicator models: (a) represents the comprehensive evaluation indicator model; (b) represents the social influence indicator model; (c) represents the ecological carrying capacity indicator model.
In the social influence model, transportation accessibility (TA) and kernel density (KD) are the dominant indicators, reflecting the importance of resource distribution and transportation conditions for the visibility and accessibility of tourism resources at the social level. In the ecological carrying capacity model, annual average temperature (AAT), slope, and annual average precipitation (AAP) emerge as dominant indicators, showing the decisive influence of climate and topography on ecological suitability.
In summary, the driving forces behind the sustainable development of Long March tourism resources cannot be understood in isolation based solely on social and ecological concepts. They need to be examined in detail by considering the contributions of various indicators under different models. These findings reveal the core logic of sustainable development for red cultural tourism in Yunnan: a dynamic and complementary relationship between social factors and ecological conditions under different models. The construction of transportation networks, accessibility, and resource agglomeration can drive tourism development, but their effectiveness is constrained by ecological carrying capacity, such as topography. Conversely, the advantages of ecological conditions require effective social support to be transformed into sustainable value. Therefore, promoting red tourism development should focus on building cross-sectoral coordination mechanisms and achieving an organic integration of social momentum and ecological carrying capacity in a context-specific manner, thereby enhancing the adaptability and resilience of the overall system.
5. Discussion
5.1. Social–Ecological Synergistic Mechanism
We calculated the mean value of each indicator across different cities to facilitate case-based discussions on the “social–ecological” synergistic mechanism of red cultural tourism in Yunnan (Figure 7). The results show significant differences in the development levels of Long March tourism resources, reflecting how varying social conditions and ecological environments shape the development of red cultural tourism in the region.
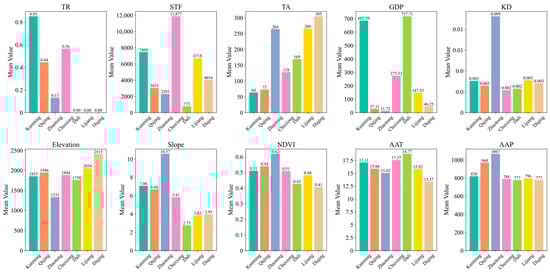
Figure 7.
Statistics of the mean values of each evaluation indicator by city.
Next, we discuss specific examples by selecting well-known Long March tourism resources from Kunming, Qujing, Zhaotong, and Dali (Table 3). Kunming, owing to its reputation as a “National Tourist City,” demonstrates a significant advantage in social influence (SI), with visitor ratings surpassing those of other cities. Its well-developed transportation network ensures a leading position in transportation accessibility (TA), while its relatively high GDP provides a solid economic foundation that supports the growth of the red cultural tourism industry. However, the relatively dispersed distribution of resources has a negative impact on Kunming’s scores under both the social influence (SI) and comprehensive (C) indicator models. Case-specific evidence suggests that when strong social support conditions are integrated with a relatively balanced ecological carrying capacity (ECC) through a “social–ecological” synergistic mechanism, the overall development of red cultural tourism can be substantially strengthened.
Table 3.
Indicator values and evaluation scores of samples under different indicator models.
Qujing performs well in tourist ratings (TR) and transportation conditions, demonstrating strong potential in social influence (SI). However, its relatively low GDP level constrains further tourism development, resulting in a comprehensive (C) score lower than both its social influence (SI) and ecological carrying capacity (ECC) scores. This indicates that, although Qujing shows certain advantages in social conditions, the lack of economic support and ecological optimization limits sustainable progress. Strengthening socio-economic support policies and enhancing ecological carrying capacity (ECC) would help establish a positive “social–ecological” synergistic interaction.
The Long March tourism resources in Zhaotong are generally less well-known, with poor transportation accessibility (TA) and complex terrain characterized by steep slopes. However, the clustered distribution of resources has formed historically interconnected scenic areas, providing a systematic platform for ideological education and the dissemination of red culture. In the case of Zhaotong, the differences among the social influence (SI), ecological carrying capacity (ECC), and comprehensive (C) scores are small, reflecting a relatively balanced “social–ecological” synergistic development. This case demonstrates the feasibility of combining resource clustering with ecological protection and offers practical experience for building regional synergistic mechanisms.
The Long March tourism resources in Dali benefit from favorable economic conditions and relatively flat terrain, which are conducive to infrastructure development. However, the city shows low search frequency and limited visibility, along with insufficient vegetation coverage. Case data indicate that Dali has advantageous socio-economic conditions and exhibits relatively balanced score distributions across different evaluation models. Nevertheless, its low popularity and inadequate ecological greening support have hindered the full realization of its potential in red cultural tourism development. Enhancing vegetation coverage and strengthening cultural tourism branding are essential for achieving “social–ecological” synergistic development in the region.
Synthesizing the above cases, we find that the development of red cultural tourism in different cities of Yunnan reflects distinct modes of “social–ecological” interaction. Kunming demonstrates a positive complementarity between economy and ecology, Zhaotong highlights the balance between resource clustering and ecological protection, Qujing reveals the disjunction of society and ecology under economic constraints, while Dali illustrates the limitation of social advantages caused by insufficient greening. These differences indicate that the sustainable development of red cultural tourism in Yunnan relies on a dynamic balance within the “social–ecological” synergistic mechanism. By achieving mutual adjustment between social support and ecological carrying capacity (ECC), red tourism can shift from single dependence to comprehensive (C) driving forces, thereby providing both theoretical foundations and practical experience for constructing a more resilient regional development model.
5.2. Region-Specific Sustainable Development
The evaluation results of the development status indicate that the development levels of Long March tourism resources vary significantly among different cities, showing evident disparities (Table 4). Due to the generally consistent topographical and climatic conditions across Yunnan Province, the variance of evaluation scores among cities under the ecological carrying capacity indicator model is relatively low. In contrast, given the differences in social and economic development across cities, the variance of evaluation scores among cities under the social influence indicator model is relatively high. Under the comprehensive evaluation model, the variance of evaluation scores among cities is relatively balanced but still reflects disparities in the development levels of red cultural tourism among cities, with social influence serving as the primary influencing factor. This disparity in evaluation results not only reveals the spatial imbalance in the development of red cultural tourism in Yunnan, but also provides a theoretical and practical basis for further exploring localized sustainable development strategies.
Table 4.
Variance of evaluation scores among cities under different indicator models.
This study reveals the spatial imbalance in the development of red cultural tourism in Yunnan and the differentiated contributions of “social–ecological” indicators. These findings address a core theoretical issue in cultural heritage tourism management: the systemic disconnection between cultural value transmission, socio-economic development, and ecological constraints. They form a critical dialogue with existing research and highlight the need to explore sustainable development pathways for red cultural tourism in Yunnan from both theoretical and practical perspectives.
First, compared with mainstream research on red cultural tourism, most studies focus on its political education function, economic impact, or visitor experience, while generally lacking systematic quantitative analysis of the spatial distribution of resources and their intrinsic connections with human society and the natural ecological environment [10,24,25]. This study, using GIS and machine learning methods, confirms that ignoring ecological carrying capacity, including terrain complexity and climatic conditions, and relying solely on socio-economic support and visitor experience cannot achieve sustainable development of red cultural tourism in Yunnan [44,45]. For example, Zhaotong faces a typical disconnection: abundant resources and favorable ecological conditions but poor traffic accessibility, which urgently requires terrain-adaptive vertical planning of transportation networks integrated with ecological considerations [46]. This study also responds to the call by scholars such as Terrence Tsz Hei Kong for a multidimensional evaluation framework for red tourism development, and further extends the discussion toward deeper issues of regional sustainable development [4].
Second, the framework of this study can be incorporated into the broader theoretical domain of Social–Ecological Systems (SES) [47,48]. The case of Yunnan vividly demonstrates the coupling and vulnerability of SES. Specifically, Kunming represents a “high social-medium ecological” model, while Diqing–Lijiang represents a “high ecological-low social” model. These illustrate two types of risks: the vulnerability of social systems due to over-reliance on artificial infrastructure, and the deficiency of ecological system services in being effectively transformed and fed back into the social system. Such uneven regional development essentially reflects a lack of internal feedback mechanisms within SES, which runs counter to the goal of systemic resilience sought by sustainable tourism. Therefore, we propose an evaluation framework integrating “social–ecological” factors to provide a scientific basis for balanced and sustainable regional development in Yunnan.
Finally, why is the issue of sustainable development based on “social–ecological” coordination particularly critical for red cultural tourism in Yunnan? We argue that its uniqueness amplifies its theoretical significance. As China’s ecological barrier in the southwest and a convergence zone of multiple ethnic cultures, Yunnan’s ecology and culture are particularly vulnerable and irreplaceable. For Yunnan, there exists a layer of interaction that requires coordination between tourism-based economic development and its complex geographical environment. Due to the particular nature of red culture, development differences here are not only a regional economic issue, but also a major test of whether China’s dual goals of cultural security as the carrier of the Long March spirit and ecological security can be achieved in harmony [49]. Any shortsighted development risks isolating red cultural heritage, damaging ecosystems, and intensifying regional development inequities, which directly contradicts the holistic and coordinated vision emphasized in the construction of the Long March National Cultural Park [16]. Therefore, addressing these issues in the development of red cultural tourism in Yunnan is an urgent necessity.
6. Conclusions
This study focuses on the Long March cultural tourism resources in Yunnan Province, China, employing GIS spatial analysis and interpretable machine learning models to comprehensively assess the current development status of local red cultural tourism from both social and ecological perspectives and to explore targeted mechanisms for the future “social–ecological” synergistic development. In summary, we systematically organized and analyzed the experimental data, yielding the following conclusions:
- (1)
- This study constructs a multidimensional framework for evaluating the sustainable development of red cultural tourism in Yunnan based on the concept of “social–ecological” synergy. It situates the development of red cultural tourism resources within the broader context of sustainable tourism and the Social–Ecological System (SES) theory, addressing the limitation of previous studies that overly focused on ideological education, tourism experience, or economic benefits while neglecting ecological constraints.
- (2)
- The development level of red cultural tourism in Yunnan exhibits significant regional imbalance, generally showing a spatial pattern of “high in the southeast, low in the northwest.” Kunming, Qujing, and Zhaotong present relatively high overall development levels, while northwestern regions including Diqing and Lijiang lag behind.
- (3)
- Annual average precipitation (AAP), transportation accessibility (TA), and annual average temperature (AAT) are the core indicators influencing the development of red cultural tourism resources. Among them, transportation conditions and resource clustering play a dominant role in social influence, while climatic and topographic factors hold key significance for ecological carrying capacity.
- (4)
- Regions such as northeastern Zhaotong show stability across different indicator models, reflecting a relatively balanced “social–ecological” synergistic system. In contrast, cities such as Dali and Qujing exhibit differences across indicator models, suggesting that their development is constrained by the lack of coordination between social and ecological factors.
The sustainable development of red cultural tourism resources in Yunnan cannot rely solely on tourist experience, ecological restoration, and infrastructure construction. The key lies in achieving a dynamic balance between regional social influence and ecological carrying capacity. Therefore, we propose:
- (1)
- Formulating differentiated regional development strategies. The northwest and northeast should focus on improving transportation infrastructure and digital promotion platforms to enhance transportation accessibility (TA) and visibility, while strictly protecting ecological authenticity [50]. The more developed southeast should further emphasize green infrastructure construction and low-impact environmental development to avoid ecological degradation caused by over-tourism.
- (2)
- Promoting multi-departmental coordinated governance. It is recommended to establish cross-departmental coordination mechanisms, integrating the management of red tourism resources into the overall planning of the Long March National Cultural Park, rural revitalization, and ecological civilization construction, thereby achieving multi-objective synergy of cultural heritage preservation, economic development, and ecological protection [16].
- (3)
- Establishing dynamic monitoring and adaptive management mechanisms. It is encouraged to adopt a combination of long-term positioning monitoring and real-time updates of socio-economic data, developing a series of WebGIS to evaluate the “social–ecological” synergy status of red tourism sites in real time and to adjust management strategies accordingly [51].
Based on multi-source heterogeneous indicator data and provincial city-scale analysis, constrained by the lack of long-term time series data such as visitor ratings, this study does not capture the dynamic process and more micro-level mechanisms of red cultural tourism development. Future research could incorporate diverse data sources such as visitor flow big data, long-term remote sensing ecological monitoring indicators, and community perception surveys to reveal the dynamic evolution mechanism of the “social–ecological” system of red cultural tourism at multiple scales [52]. Furthermore, the evaluation framework proposed in this study could be further applied to the sustainable development assessment of other types of cultural heritage tourism within the region, including ethnic heritage tourism and ancient route tourism, to test its universality and scalability.
Author Contributions
Z.Z.: Writing—review and editing, Writing—original draft, Methodology, Resources, Data curation, Funding acquisition. F.C.: Writing—review and editing, Methodology, Resources, Formal analysis, Funding acquisition. S.S.: Validation, Methodology, Software, Data curation. Y.G.: Validation, Conceptualization, Supervision. Z.L.: Data curation, Supervision. J.W.: Validation, Supervision. All authors have read and agreed to the published version of the manuscript.
Funding
This study was funded by the National Natural Science Foundation of China under grant number 42361065 for the project “Study on Forest Aboveground Biomass Estimation in Complex Mountainous Areas by Fusing Passive and Active Remote Sensing.” It was also funded by the Yunnan Normal University Undergraduate Scientific Research Training Foundation under grant number KX2024111 for the project “Development Status Evaluation and Development Trend Optimization Simulation of Long March Tourist Scenic Areas in Yunnan.”
Data Availability Statement
The original data and code presented in this study are openly available in the GitHub repository at https://github.com/Error-Chtholly/HJCZ-SIECCSM-RESEARCH (accessed on 6 October 2025).
Acknowledgments
The authors are grateful to the Office of the Party History Study and Education Leading Group of the Yunnan Provincial Committee of the Communist Party of China for compiling the Yunnan Province Party History Study and Education Experience Route Guide, which provided valuable data on the red cultural tourism resources. The authors also wish to express their gratitude to the anonymous reviewers for their valuable comments and suggestions, which helped improve the quality of this manuscript.
Conflicts of Interest
The authors declare no conflicts of interest.
References
- Wang, K.; Zhao, Y.; Tan, J.; Gan, C. A Study on the Social Well-Being Effect of the Integrated Development of China’s Cultural and Tourism Industries. J. Southwest Univ. (Soc. Sci. Ed.). 2024, 50, 214–226. [Google Scholar] [CrossRef]
- Chen, S. The Inheritance and Protection of Intangible Cultural Heritage Under the Background of Cultural and Tourism Integration—Take Shanghai “Shanghai Intangible Cultural Heritage” as an Example. Acad. J. Manag. Soc. Sci. 2024, 9, 1–6. [Google Scholar] [CrossRef]
- Wang, Z.; Sun, D. Research on the Protection and Inheritance of Lingbi Zhong Kui Painting in the Context of Cultural Tourism Integration. Front. Art Res. 2023, 5, 99–105. [Google Scholar] [CrossRef]
- Kong, H.T.T.; Zou, R.; Xiao, H. Twenty years of red tourism research: A systematic literature review using the theories-contexts-characteristics-methods framework. Tour. Manag. Perspect. 2025, 58, 101390. [Google Scholar] [CrossRef]
- Wu, J. Study on the Impact Mechanism of Red Tourism on Ideological and Political Education Among College Students. Int. J. Soc. Sci. Educ. Res. 2025, 8, 123–132. [Google Scholar] [CrossRef]
- Bai, Y.; Wang, M.; Xu, X.; Li, J.; Cheng, X. Analysis of Population Flow Changes in Red Tourism Counties of China Before and After the COVID-19 Pandemic Based on Mobile Signaling Data. Sustainability 2025, 17, 148. [Google Scholar] [CrossRef]
- Wu, J.; Chen, X.; Xu, X. Under the Background of Rural Revitalization, Jiaxing Red Cultural Tourism-Taking Sanxing Village as an Example. Lit. Art Dev. Innov. 2024, 1, 89–92. [Google Scholar] [CrossRef]
- He, H.; Li, X.; Peng, B.; Shen, Z. Research on the Interactive Interface Design of Zhaoqing Red Culture Tourism in the Context of Rural Revitalization. Sci. J. Humanit. Soc. Sci. 2024, 6, 233–242. [Google Scholar] [CrossRef]
- Cao, X. Study on the Strategy of Red Literature and Tourism Brand Communication Helping Study Tourism Economic Development in Liaoning Province under the Background of Internet. Appl. Math. Nonlinear Sci. 2024, 9, 1–18. [Google Scholar] [CrossRef]
- Wang, F.; Sanagustín-Fons, V.; Martínez-Quintana, V. Red Tourism and Youth Education: A Systematic Review of the Literature. Societies 2025, 15, 69. [Google Scholar] [CrossRef]
- Lv, F.; He, J.; He, F.; Wang, Y. Research on the Fusion Path of Cultural Tourism of Shenyang Red Cultural Resources. E3S Web Conf. 2020, 179, 02120. [Google Scholar] [CrossRef]
- He, Y.; Peng, Z.; Zeng, B.; Zheng, Q.; Wang, J. Study on the Construction of Collective Memory and Heritage Identity of Residents in Red Cultural Heritage Sites—Taking Tongdao Red Army Long March Transfer Memorial Hall as an Example. Tour. Sci. 2025, 1–15. [Google Scholar] [CrossRef]
- Wang, J.; Li, M.; Ma, X.; Wang, J. Research on the Design of Red Culture Tourism Sign Guiding System-Taking the Former Central Soviet District of Gannan as an Example. E3S Web Conf. 2020, 179, 02038. [Google Scholar] [CrossRef]
- Wang, H.; Zhang, B.; Qiu, H. How a hierarchical governance structure influences cultural heritage destination sustainability: A context of red tourism in China. J. Hosp. Tour. Manag. 2022, 50, 421–432. [Google Scholar] [CrossRef]
- Lin, C. Red Tourism: Rethinking Propaganda as a Social Space. Commun. Crit. Cult. Stud. 2015, 12, 328–346. [Google Scholar] [CrossRef]
- Xiang, J. Study on Yunnan Weixin Red Tourism development under the background of the Long March National Cultural Park. Yunnan Univ. Finance Econ. 2022. [Google Scholar] [CrossRef]
- Qin, Y.; Cao, L.; Li, W.; Darvishi Boloorani, A.; Li, Y.; Ke, X.; Soleimani, M.; Yu, Q.; Zhou, C. Suitability Assessment Method of Red Tourism Development Using Geospatial and Social Humanity Data: A Case Study of Ruijin City, East China. Sustainability 2023, 15, 8582. [Google Scholar] [CrossRef]
- Li, Z.; Rehman, A.; Zhao, B.; Peng, J. Analysis of the Relationship Between Tourist Motivation, Satisfaction and Loyalty for China Special Theme Tourism. Asian Res. J. Arts Soc. Sci. 2016, 1, 1–14. [Google Scholar] [CrossRef]
- Liao, Z.; Wang, L. Spatial differentiation and influencing factors of red tourism resources transformation efficiency in China based on RMP-IO analysis. Sci. Rep. 2024, 14, 10761. [Google Scholar] [CrossRef]
- Liang, S. Research on Route Planning of Red Tourist Attractions in Guangzhou Based on Ant Colony Algorithm. Autom. Mach. Learn. 2023, 4, 8–16. [Google Scholar] [CrossRef]
- Zhou, X.; Guo, Y.; Xie, X.; Liu, C.; Zhang, F. The influence of a destination’s red cultural atmospherics on tourists’ confidence in Chinese culture. Front. Psychol. 2022, 13, 992125. [Google Scholar] [CrossRef] [PubMed]
- Sejati, A.W.; Putri, S.N.A.K.; Tyas, W.P.; Buchori, I.; Handayani, W.; Basuki, Y.; Barbarossa, G.; Husna, I.N. Predicting urban carrying capacity to support sustainable tourism using GIS. J. Policy Res. Tour. Leis. Events 2025, 17, 632–655. [Google Scholar] [CrossRef]
- Wang, H.; Xue, P.; Dong, J.; Jo, W.M. Understanding Memorable Red Tourism Experiences Using the Q Method. J. Resour. Ecol. 2025, 16, 856–867. [Google Scholar] [CrossRef]
- Kim, J.H. The effect of red tourism on the balanced development of the regional economy in China. Korean J. Hosp. Tour. 2018, 27, 225–241. [Google Scholar] [CrossRef]
- Zhou, H.; Zhang, Q.; Lu, L.; Jiang, Y.; Wu, K. Research on the influence path of red tourism experience on tourists’ well-being: Based on the chain mediating role of tourists’ emotion and national identity. BMC Psychol. 2025, 13, 105. [Google Scholar] [CrossRef]
- Zhou, X.; Wong, J.W.C.; Wang, S. Memorable Tourism Experiences in Red Tourism: The Case of Jiangxi, China. Front. Psychol. 2022, 13, 899144. [Google Scholar] [CrossRef]
- Tang, W.; Zhang, L.; Yang, Y. Can red tourism construct red memories? Evidence from tourists at Mount Jinggang, China. J. Destin. Mark. Manag. 2021, 20, 100618. [Google Scholar] [CrossRef]
- Zhou, H.; Zhang, Q.; Jiang, Y.; Wang, F. Can red tourism lead to spiritual transformation? Evidence from tourists visiting the Red Army Long March Xiangjiang Battle Memorial Park. PLoS ONE 2023, 18, 0280920. [Google Scholar] [CrossRef]
- Qian, L.; Guo, J.; Ren, L.; Qiu, H.; Zheng, C. Consuming communist heritage in China: User-generated image of red tourism via photographs. Tour. Rev. 2025, 80, 1193–1208. [Google Scholar] [CrossRef]
- Zuo, Z. The Influence of Ritual Sense in Red Tourism on Tourists’ Civic Behavior: The Mediating Role of Awe Emotion. Acad. J. Manag. Soc. Sci. 2025, 10, 153–159. [Google Scholar] [CrossRef]
- Zhao, N.; Liu, Y.; Cao, G.; Samson, E.L.; Zhang, J. Forecasting China’s GDP at the pixel level using nighttime lights time series and population images. GISci. Remote Sens. 2017, 54, 407–425. [Google Scholar] [CrossRef]
- Yang, Z.; Hou, S.; Yang, L.; Ning, D.; Li, Y.; Ning, D.; Li, J.; Long, Q.; Zhou, Z.; Xin, F.; et al. Guide to the Yunnan Province Party History Study and Education Experience Route; Yunnan Publishing Media Co., Ltd.: Kunming, China, 2021; pp. 4–337. [Google Scholar]
- Laasasenaho, K.; Lensu, A.; Lauhanen, R.; Rintala, J. GIS-data related route optimization, hierarchical clustering, location optimization, and kernel density methods are useful for promoting distributed bioenergy plant planning in rural areas. Sustain. Energy Technol. Assess. 2019, 32, 47–57. [Google Scholar] [CrossRef]
- Liu, Y.; Gu, H.; Shi, Y. Spatial Accessibility Analysis of Medical Facilities Based on Public Transportation Networks. Int. J. Environ. Res. Public Health 2022, 19, 16224. [Google Scholar] [CrossRef] [PubMed]
- Hu, Y.; Jiang, K.; Chen, Z.; Chen, T.; Xue, Y.; Wang, W. Analysis of the spatial structure of tourism resources and traffic accessibility in mountainous counties: Taking Luanchuan County, Henan Province as an example. Res. Agric. Mod. 2023, 44, 869–880. [Google Scholar] [CrossRef]
- Bouabdallaoui, I.; Guerouate, F.; Sbihi, M. Combination of genetic algorithms and K-means for a hybrid topic modeling: Tourism use case. Evol. Intell. 2023, 17, 1801–1817. [Google Scholar] [CrossRef]
- Chen, M.; Gao, Y.; Cheng, J. Layout of Tourist Scenic Road Network Based on Network User Evaluation Data+. Geogr. Geo-Inf. Sci. 2024, 40, 18. [Google Scholar] [CrossRef]
- Song, T.; Yan, Q.; Fan, C.; Meng, J.; Wu, Y.; Zhang, J. Significant Wave Height Retrieval Using XGBoost from Polarimetric Gaofen-3 SAR and Feature Importance Analysis. Remote Sens. 2023, 15, 149. [Google Scholar] [CrossRef]
- Dang, M.; Yang, S. Design Method for Travel E-commerce Platform Based on HHO improved K-means Clustering Algorithm. EAI Endorsed Trans. Scalable Inf. Syst. 2024, 11, 5782. [Google Scholar] [CrossRef]
- Haider, M.H.; Abaas, J.I.; Saleem, E.; Basim, M.A. Developing Spatial Models of Groundwater Quality in the Southwestern Desert of Iraq Using GIS, Inverse Distance Weighting, and Kriging Interpolation Techniques. Math. Model. Eng. Probl. 2023, 10, 1169–1179. [Google Scholar] [CrossRef]
- Beshr, A.A.A.; Kaloop, M.R. Using modified inverse distance weight and principal component analysis for spatial interpolation of foundation settlement based on geodetic observations. Open Geosci. 2022, 14, 1310–1323. [Google Scholar] [CrossRef]
- Liu, K.; Liao, C. Examining the importance of neighborhood natural, and built environment factors in predicting older adults’ mental well-being: An XGBoost-SHAP approach. Environ. Res. 2024, 262, 119929. [Google Scholar] [CrossRef] [PubMed]
- Kuang, B.; Yang, H.; Jung, T. The Impact of Visual Elements in Street View on Street Quality: A Quantitative Study Based on Deep Learning, Elastic Net Regression, and SHapley Additive exPlanations (SHAP). Sustainability 2025, 17, 3454. [Google Scholar] [CrossRef]
- Huang, X.; Wang, J.; Wang, Z.; Wang, L.; Cheng, C. Experimental study on the influence of virtual tourism spatial situation on the tourists’ temperature comfort in the context of metaverse. Front. Psychol. 2023, 13, 1062876. [Google Scholar] [CrossRef] [PubMed]
- Nicolau, J.L.; Casado, D.A.B.; Navarro, R.S. Assessing the effects of interaction with attractions and types of visit on day trippers’ satisfaction. Curr. Issues Tour. 2024, 27, 1299–1315. [Google Scholar] [CrossRef]
- Yan, Y.; Che, L.; Wu, D.; Zhang, C.; Liu, D. Study on Vertical Planning and Design of Road Network and Site of High-speed Railway Hub Area Under Complex Topographic Condition. Urban Roads Bridges Flood Control 2021, 2, 6–8. [Google Scholar] [CrossRef]
- Qu, Y.; Zhao, W.; Zhan, L.; Zhan, L.; Cui, Y.; Li, Y. Unlocking rural resources for revitalization: Examining the process and impact of compensated use of rural residential land through a social-ecological system framework. Habitat Int. 2025, 166, 103581. [Google Scholar] [CrossRef]
- Xin, S.; Chen, N.; Li, Z. Enhancing ecosystem services and socio-ecological system coupling coordination through LULC optimization. Ecol. Indic. 2025, 179, 114160. [Google Scholar] [CrossRef]
- Dan, C. Discussion on the Integration of Beihai Red Resources into the Ideological and Political Teaching of Landscape Painting Course. Curr. Teach. Methodol. 2023, 6, 31–39. [Google Scholar] [CrossRef]
- Skandali, D. Metaverse Tourism: Opportunities, AI-Driven Marketing, and Ethical Challenges in Virtual Travel. Encyclopedia 2025, 5, 135. [Google Scholar] [CrossRef]
- Sang, K.; Piovan, S.; Fontana, G.L. A WebGIS for Visualizing Historical Activities Based on Photos: The Project of Yunnan–Vietnam Railway Web Map. Sustainability 2021, 13, 419. [Google Scholar] [CrossRef]
- Gricar, S.; Šugar, V.; Starc, J. Interrelationships Among Tourism, Economic, and Environmental Time Series—The Case of Slovenia. Sustainability 2023, 15, 14488. [Google Scholar] [CrossRef]


Disclaimer/Publisher’s Note: The statements, opinions and data contained in all publications are solely those of the individual author(s) and contributor(s) and not of MDPI and/or the editor(s). MDPI and/or the editor(s) disclaim responsibility for any injury to people or property resulting from any ideas, methods, instructions or products referred to in the content. |
© 2025 by the authors. Licensee MDPI, Basel, Switzerland. This article is an open access article distributed under the terms and conditions of the Creative Commons Attribution (CC BY) license (https://creativecommons.org/licenses/by/4.0/).