Proceeding Paper

A Sediment Supply Assessment in a Touristic Zone: A Case Study of West Cyprus †

1
Department of Science and Technology, University of Napoli Parthenope, 80143 Napoli, Italy
2
Department of Engineering, University of Napoli Parthenope, 80143 Napoli, Italy
3
Department of Marine Sciences, University of the Aegean, 80100 Mytilene, Greece
*
Author to whom correspondence should be addressed.
Presented at the 8th International Electronic Conference on Water Sciences, 14–16 October 2024; Available online: https://sciforum.net/event/ECWS-8.
Environ. Earth Sci. Proc. 2025, 32(1), 16; https://doi.org/10.3390/eesp2025032016
Published: 23 April 2025
(This article belongs to the Proceedings of The 8th International Electronic Conference on Water Sciences)

Abstract

:
Sediment transport plays a crucial role in shaping coastal and riverine environments, influencing both natural and human activities. This study assesses sediment supply from the entire basin of a touristic zone of Cyprus, where coastal erosion and sediment deposition impact infrastructure, tourism, and environmental sustainability. Human activities, such as dam construction, further disrupt the sediment balance. This study focuses on Coral Bay and Potima Gulf, a popular tourist destination along an ~11 km shoreline in western Cyprus, fed by four small rivers draining a total area of 66.5 km2. The sustainability of the Coral Bay–Potima system is threatened by the Mavrokolympos stream dam, which traps upstream sediments. Using the USLE method, mean sediment yield at the basin outlet is estimated at 888 t km−2 yr−1. These findings underscore the link between watershed processes and sustainable coastal management, emphasizing the need for integrated sediment transport assessments in touristic coastal zones.

1. Introduction

In the last century, the monitoring of coastal evolution has become increasingly significant, particularly in the Mediterranean, where coastal erosion is a pressing issue. The evolution of coastlines is described as a dynamic and fragile ecosystem, constantly reshaped by the continuous movement of sand, water, and air [1]. Coastal morphology is affected by changes due to interactions between both human activities and natural processes [2]. Infrastructure development, such as highways, urban expansion, and services built near the shoreline, significantly contribute to environmental imbalances, often accelerating erosion processes [3].
At the same time, coastal areas are not only environmental systems, but also dynamic socio-economic hubs that play a fundamental role in global financial services, contributing approximately 43% to overall human well-being [4]. These regions provide essential cultural and ecosystem services, including food provision, recreational activities, and environmental conservation [5,6]. Island beaches, in particular, are among the most significant tourist destinations, attracting visitors with their unique ecosystems, stunning landscapes, and rich cultural heritage. The tourism industry in these coastal zones follows the 3S model—Sea, Sun, and Sand—making them a crucial economic driver at both local and regional scales [4,6]. Coastal tourism significantly supports local economies, such as the Greek islands, Cyprus, and the Caribbean islands [4,6].
However, the sustainability of these economically valuable coastal zones is intricately linked to environmental dynamics, particularly the movement of water and sediment from inland watersheds. Coastal areas are strongly influenced by sediment fluxes, especially those driven by channelized stream flow [2]. In fact, stream flows account for an estimated 95% of the sediment delivered to the sea [7]. River systems play a critical role in sediment transport, acting as a vital link between terrestrial and marine environments and maintaining the overall sediment balance within the ecosystem [2,8]. Since the entire river basin contributes to sediment discharge, any changes within the basin directly affect coastal sediment dynamics [3,8]. These interactions can also destabilize artificial structures, such as levees, increasing risks for coastal communities and impacting their resilience [3].
Given these dynamics, understanding the interplay between river systems and coastal morphology is essential for managing coastal environments and mitigating the impacts of both natural and anthropogenic changes. In this context, this study aims to assess the sediment supply from the entire basin in a touristic zone of Cyprus, where coastal stability and sediment transport play a crucial role in sustaining both the natural environment and economic activities.

2. Materials and Methods
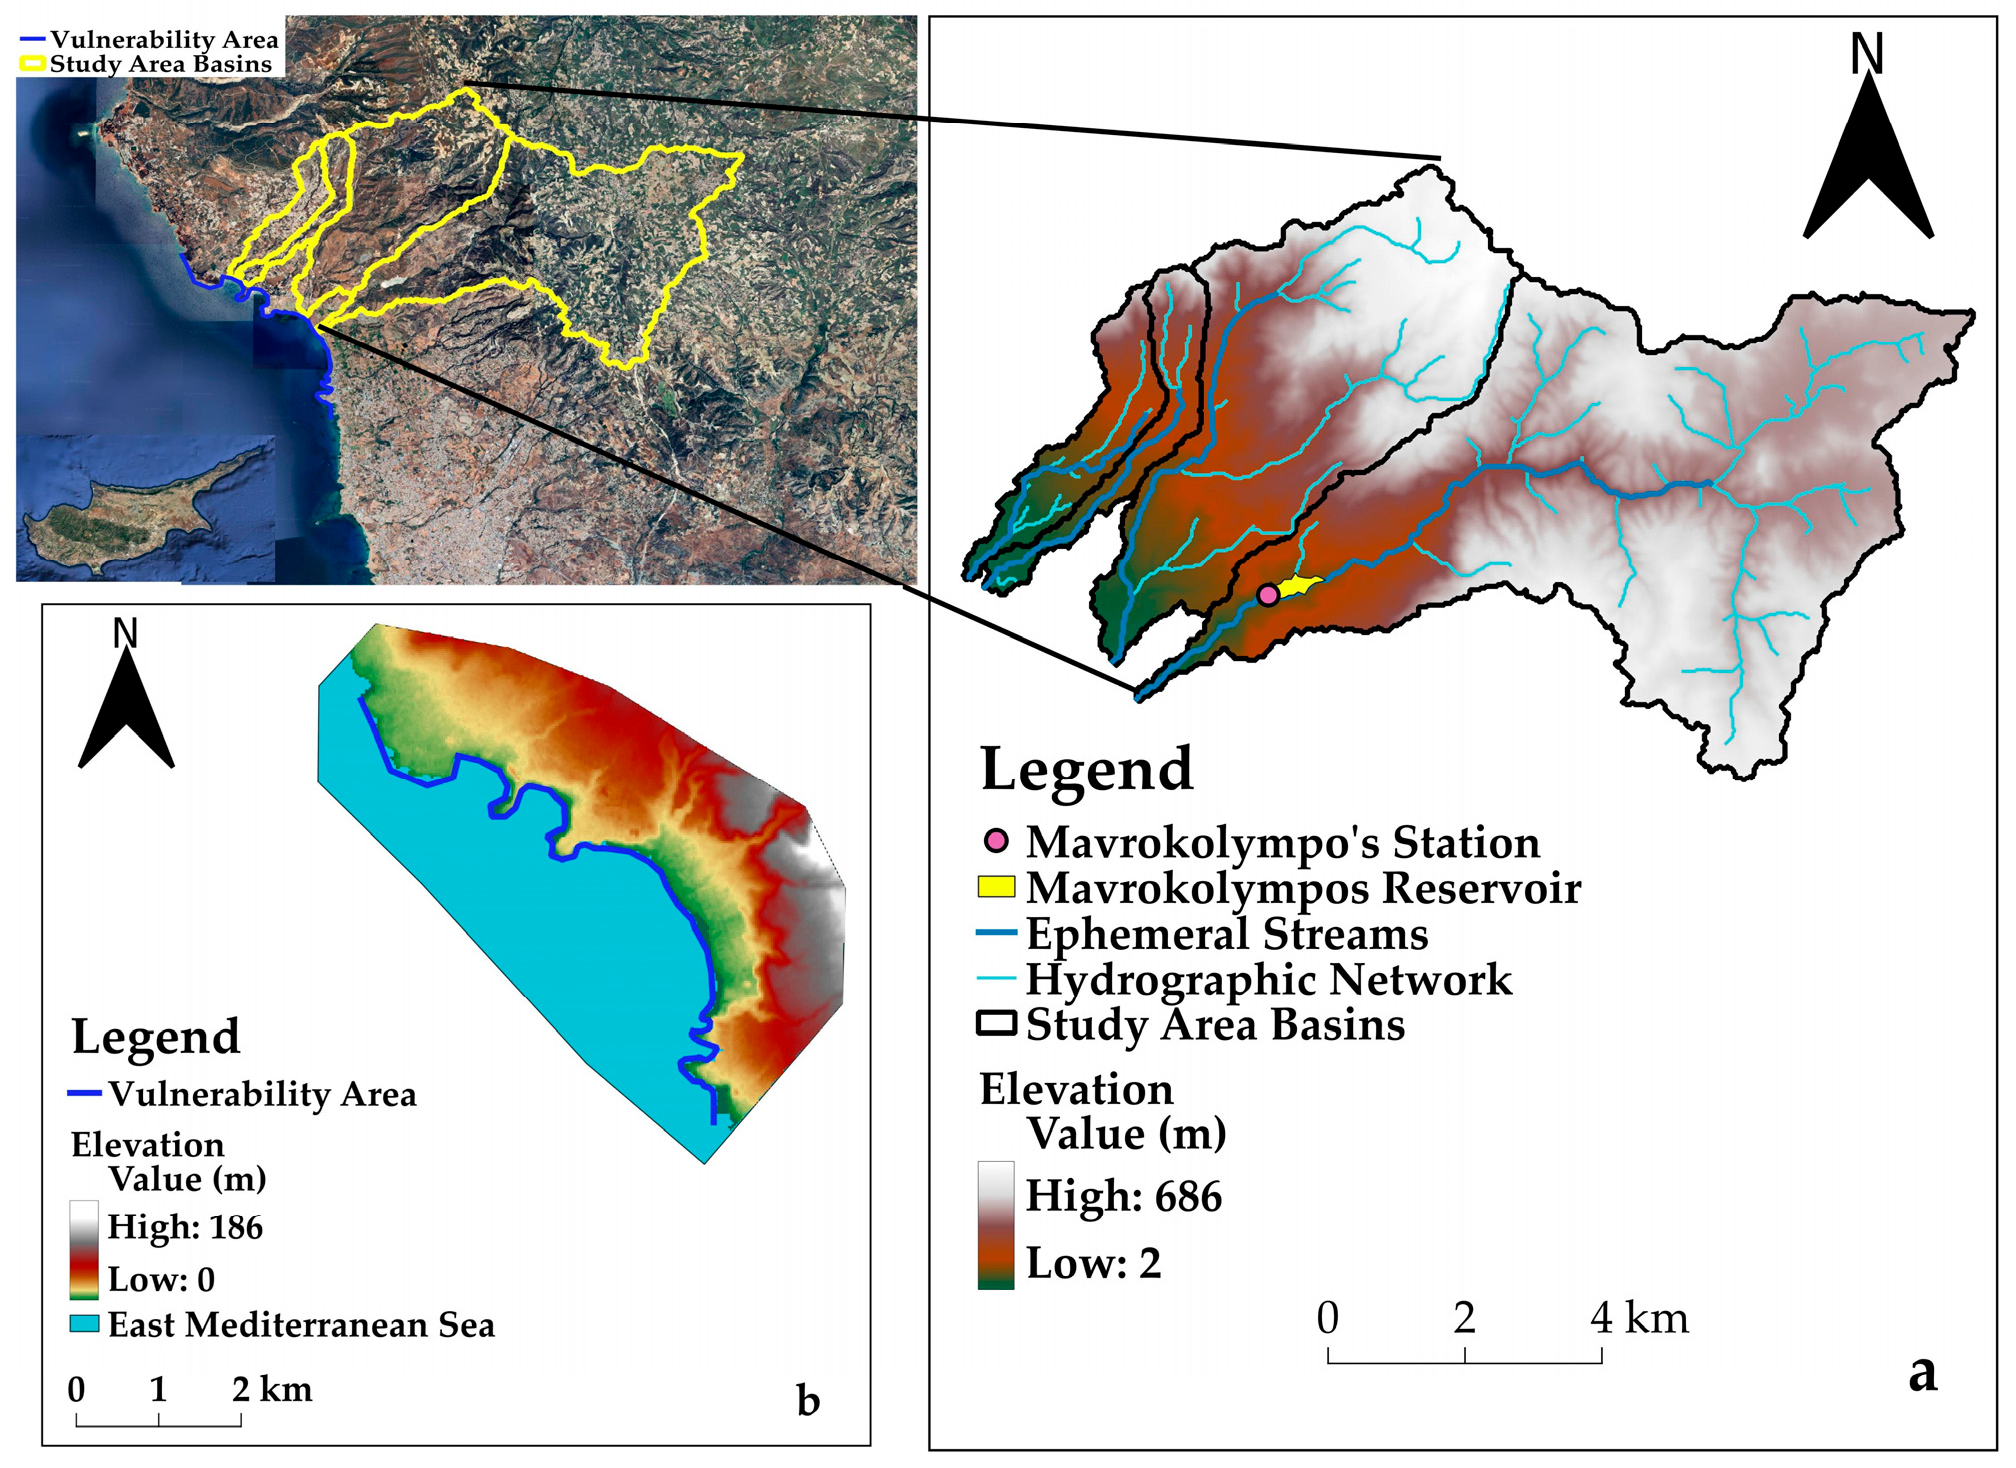
This study focuses on an area of interest encompassing four neighboring basins on Cyprus Island in the Eastern Mediterranean. This region is crucial for understanding the complex interactions between river basins and coastal zones, particularly in relation to soil erosion and sediment transport. For this case study, the sediment yield analysis is estimated using the Universal Soil Loss Equation (USLE) method and the sediment delivery ratio (SDR) approach [2,5].

2.1. Study Area

Cyprus is the third-largest island in the Mediterranean, covering an area of 9250 km2, with a population of approximately 1.25 million (as of 2022) and a coastline of about 740 km. In recent decades, coastal tourism has become one of the most significant economic activities on the island [8]. Tourism facilities and activities are heavily concentrated along the coast [9], exacerbating coastal erosion and highlighting the need for integrated coastal management.
The basin of the study area (Figure 1a) covers a drainage area of 66.5 km2, within a total river length of 20.8 km. The basin, with an average topographic elevation of about 401 m a.s.l. and an average slope of about 23%, plays a vital role in sediment transport, and is thus a focal point of this analysis. Although the Mavrokolympos reservoir is upstream on the river (Figure 1a), with a total storage capacity estimated equal to 2.18 Mm3 [10], the maximum capacity was recorded as equal to 1.093 Mm3 (50.1%) in 2021. The rivers flow into the Coral Bay and Potima Gulf. The Coral Bay–Potima coastline is located in southwest Cyprus (Figure 1b), spanning approximately 11 km, and is referred to as the “Vulnerability Area” (Figure 1b) to erosion [11], and it has been classified as having moderate to high vulnerability [11].

2.2. Available Data

The data utilized in this study pertain to hydrology (e.g., precipitation) and topography, incorporating relatively stable factors such as land use, soil, and geomorphology. Although collecting static data from various sources can pose challenges related to resolution and accuracy, addressing these issues is essential for ensuring reliable analysis. Topographic data were obtained from GEBCO (The General Bathymetric Chart of the Oceans, DEM 25 × 25 m). Land use information was sourced from the Copernicus Land Monitoring Service (CLC Version 2018), while soil texture data for the study area were provided by the Department of Agriculture (https://www.gov.cy/moa/ accessed on 11 October 2023), Land Use and Coverage Area frame Survey (LUCAS—https://esdac.jrc.ec.europa.eu/ accessed on 25 September 2024) topsoil database and Camara et al. [12]. Precipitation data, spanning July 1988 to October 2022, were supplied by the Department of Meteorology (https://www.gov.cy/moa/ accessed on 27 April 2022). Additionally, data on cover management and conservation practices were acquired from the Joint Research Centre–European Soil Data Centre (ESDAC—https://esdac.jrc.ec.europa.eu/ accessed on 25 September 2024).

2.3. Sediment Yield Trends and Influencing Factors

In the present study, the Universal Soil Loss Equation (USLE) method was applied to estimate the soil loss in the basin of the area under study in southwest Cyprus, while the Sediment Delivery Ratio (SDR) was used to calculate the sediment release at its outlet [13]. The model considers several factors affecting soil erosion, including rainfall patterns, soil type, topography, land use types, and management practices [14]. The USLE (Equation (1)) in its original form, which is used to calculate the annual average rate of soil loss, is expressed as follows:
E = R × K × L S × C × P
where E is the soil loss per unit of area (t ha−1 yr−1), R is the rainfall erosivity factor (MJ mm ha−1 h−1 yr−1), K is the soil erodibility factor (t h MJ−1 mm−1), LS is the topographic factor involving slope length (L) and steepness (S), C is the cover and management factor, and P is the support practice factor.

2.3.1. Rainfall Erosivity Factor R

The rainfall erosivity factor (R) quantifies the intensity and frequency of rainfall events that contribute to soil erosion. Given the inadequate availability of detailed rainfall data, it is usually estimated using mean monthly or mean annual rainfall data, applying alternative equations specifically designed for this purpose [15].
In this study, the R-factor was calculated using a linear equation that relates rainfall erosivity to annual precipitation in the study area, following the method proposed by Papageorgiou and Hadjimitsis [16] (Equation (2)). This equation was derived through a correlation analysis of the studied variables, utilizing detailed rainfall data from the Mavrokolympos reservoir rain gauge (Figure 1a). The analysis incorporated 33 years (1988–2022) of mean annual rainfall data and employed the following simple linear approach:
R = 38.5 + 0.35 P A N
where R is the rainfall erosivity factor (MJ mm ha−1 h−1 yr−1) and PAN is the mean annual rainfall (mm yr−1). Through this process, the R-factor was determined to be 179.8 MJ mm ha−1 h−1 yr−1, which was assumed to be uniform across the entire basin.

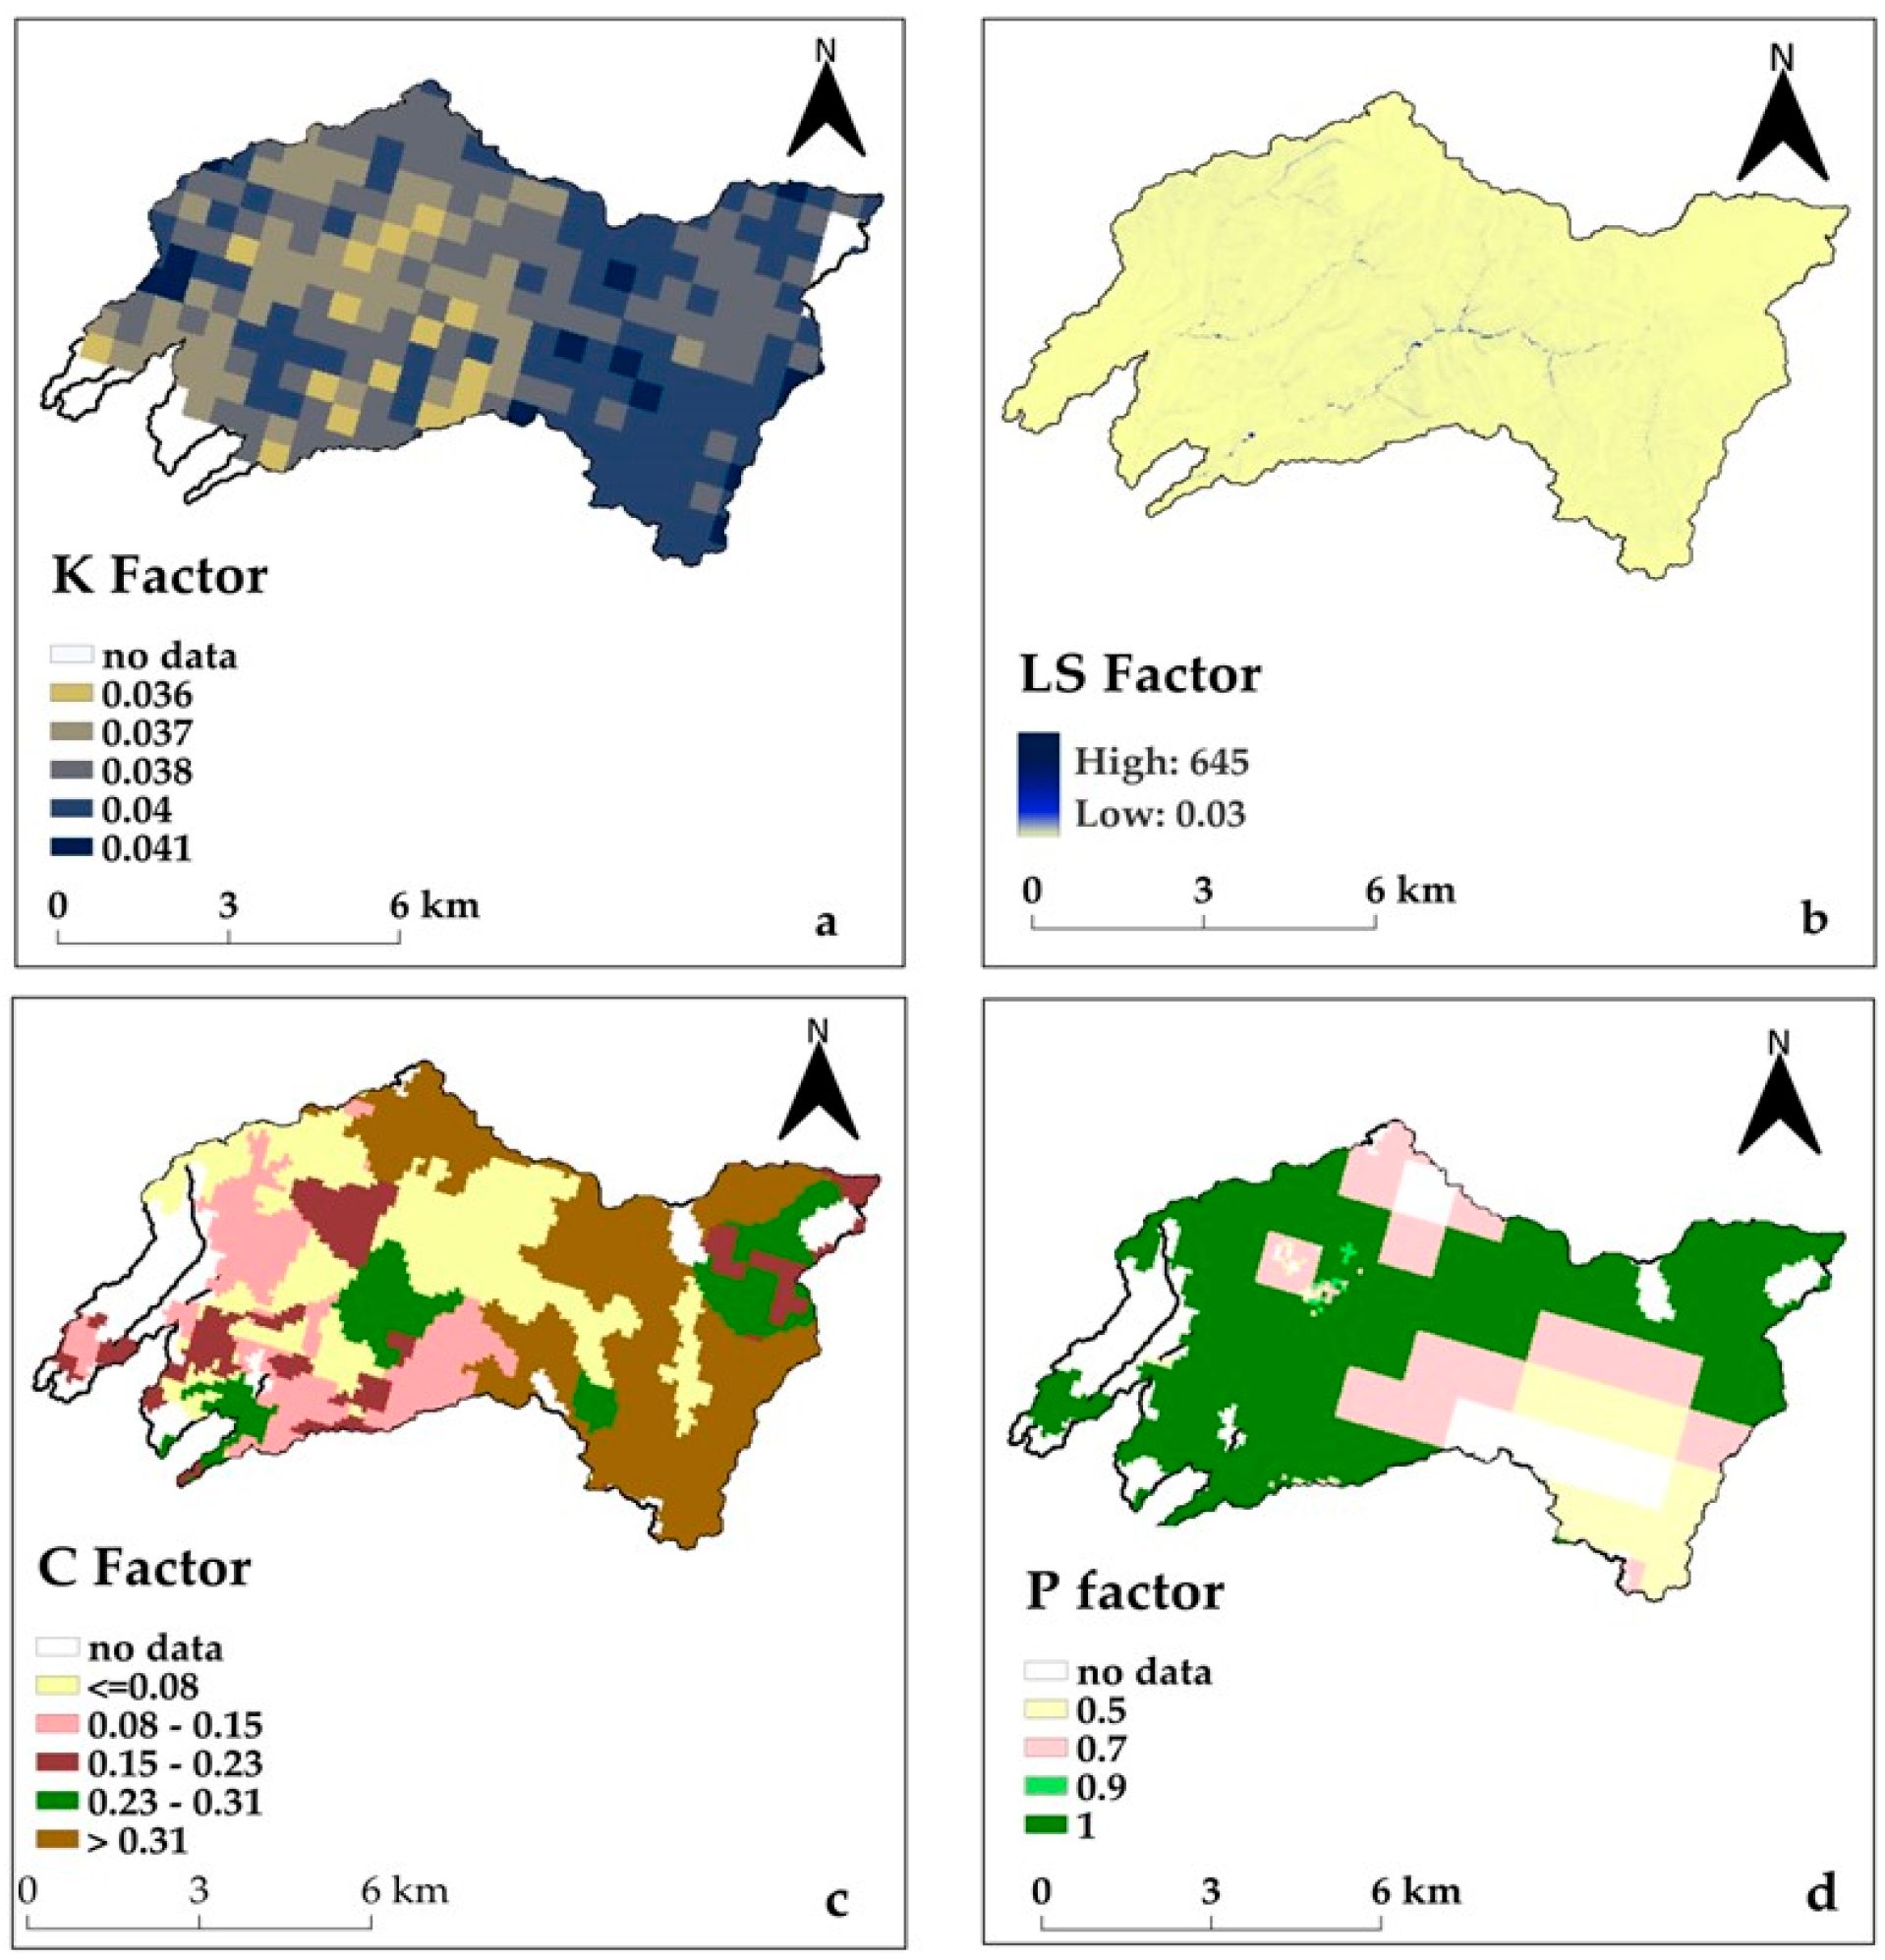
2.3.2. Soil Erodibility Factor K

The soil erodibility factor (K) is a sensitive parameter, significantly associated with soil structure and characteristics, representing the susceptibility of soil to erosion [13]. In the study area, due to a lack of data on soil texture and geological formations, K-factor is based on soil classification (Table 1) by Panagos et al. [17]. A comprehensive list of references [17,18,19,20] was compiled to enhance the analyses, incorporating data from the LUCAS soil database [17], which led to the findings presented in Table 1 and Figure 2a.

2.3.3. Topographic Factor LS

The topographic factor (LS), representing the combined effect of slope length (L) and slope steepness (S), corresponds to the ratio of the soil loss of a given slope length and steepness to the original USLE unit plot (L = 22.13 m and steepness 9%) [13,21]. In the present study, the LS-factor was calculated from the following features: (a) the use of a high-resolution DEM at 25 m, (b) the application of the Desmet and Govers [22] algorithm [23,24], and (c) the limitation of the LS estimate to a maximum slope angle of 50% (23 degrees). Thus, the method of Desmet and Govers [22] was used to estimate the LS factor for landscape scale and erosion, capturing a complex topography [24] in a GIS environment. The spatial distribution of the LS-factor is illustrated in Figure 2b.

2.3.4. Cover and Management Factor C

The cover and management factor (C) quantifies the counteractive impact of cropping and management practices on water-induced soil erosion, and is associated with the land use types existing in the area of interest [16,24]. In the present work, the distribution of land use type in the year 2018 was considered (Figure 2c) in conjunction with empirical values acquired from the ESDAC [16,24]. Table 2 displays the C-value for each land use type detected in the study area’s basin, while its spatial distribution is depicted in Figure 2b.

2.3.5. Conservation Practice Factor P

The support practice factor (P) describes the effects of practices such as contouring, strip cropping, concave slopes, terraces, grass hedges, silt fences, and surface drainage systems, and serves as an indicator of the overall effectiveness of the practices in mitigating soil erosion [20,24]. In the case of implementing none of those conservation techniques, the P-factor is assigned a value of 1.0. The estimation of the P-factor was based on the region’s existing land use types (Figure 2d), applying the same assumptions used by Michas et al. [15] and Panagos et al. [21] for a nearby basin concerning soil conservation practices. Table 2 summarizes the data used for the study area’s basin.

2.3.6. Sediment Delivery Ratio

The final soil loss map was generated by overlaying the corresponding parameters maps and using Equation (3). As far as the sediment yield is concerned, the SDR concept was used. SDR is a metric that represents the ratio between the estimated sediment yield at a particular stream point and the total amount of upland soil erosion that occurs upstream of that point. Several equations, mainly based on the topography and physiography of the area of interest, have been developed to calculate SDR [13,24]. In the present study, the De Vente and Poesen [25] formula (Equation (3)) was used
S D R = p × z × ( L P + L S ) L P + 10 × A
where SDR is the sediment delivery ratio, A is the catchment area (km2), p is basin perimeter (km), z is the difference in mean altitude from the minimum altitude of the basin (km), LP is the total length of the primary stream segments (highest order in the specific basin) (km), and LS is the total length of the secondary stream segments (km).

3. Results

The sediment yield of the case study area is assessed by estimating soil erosion within the basin and analyzing how much sediment is transported to the coastal zones. The assessment was performed using the USLE method to generate a detailed soil loss raster. Each pixel in the raster represents the mean annual soil loss value (t ha−1 yr−1), calculated using local parameters such as rainfall intensity, soil properties, slope length and steepness, land cover, and management practices. This assessment addresses the contribution of sediment yield from coastal watersheds to the coastal zone and the shoreline stability. The analysis identifies the areas within the basins that produce the highest sediment yield, providing key insights into the relationship between terrestrial sediment dynamics and coastal vulnerability.

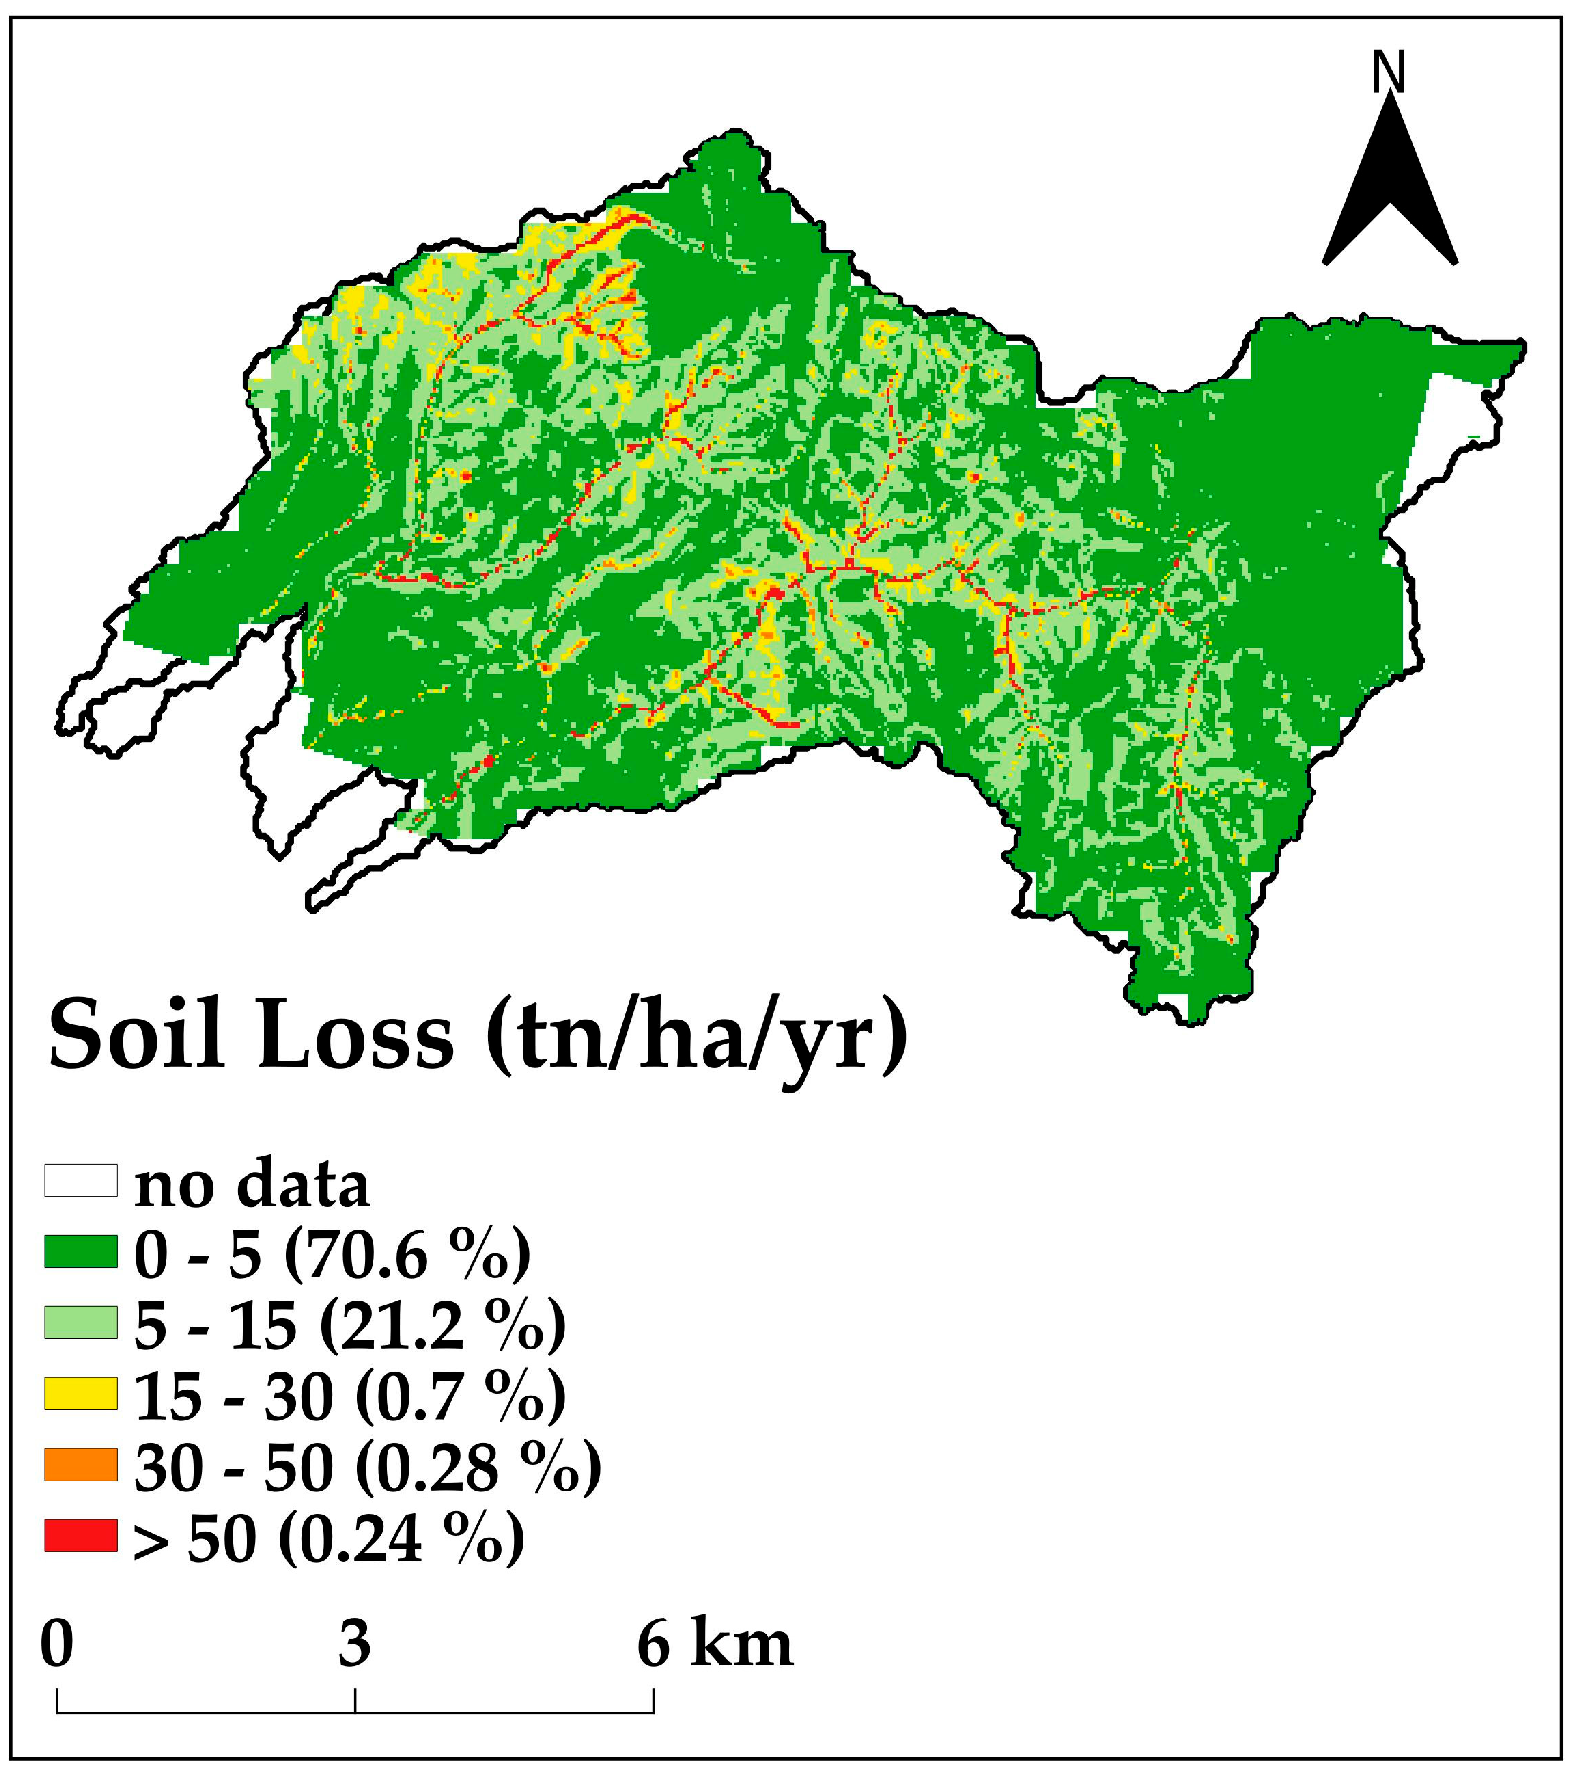
3.1. Soil Loss Assessment

In Figure 3, the mean annual soil loss rate for the basin under study is depicted considering five classes, each of which corresponds to a specific soil erosion level, defined as follows: (i) very low (0–5 t ha−1 yr−1), (ii) low (5–15 t ha−1 yr−1), (iii) moderate (15–30 t ha−1 yr−1), (iv) high (30–50 t ha−1 yr−1), and (v) very high (>50 t ha−1 yr−1). The classification of the study area is based on the literature [20,24]. The resulting map (Figure 3) reveals a prominent pattern, where areas along the drainage network, characterized by high LS values (Figure 2b), exhibit significantly elevated soil erosion levels. Those areas occupied by vineyards in the central east parts of the region, as well as predominantly flat areas in the south (Figure 2c), demonstrate notably low soil erosion values. Furthermore, based on the analysis of class area results, it is evident that a major part of the basin (70.6%) falls within the category of very low soil erosion classes, while high to very high soil erosion classes only encompass 0.5% of the region.

3.2. Sediment Yield Analysis

Table 3 presents the mean and total annual soil loss for the basin of the study area, as well as the mean and total annual sediment yield deposited at the basin’s outlet. Sediment yield is of particular importance because it is directly related to the quantity of sediment that is transported and accumulated at the beach. It is worth mentioning that the estimated value of mean sediment yield is 888 t km−2 y−1.

4. Discussion and Conclusion

The present study indicates that terrestrial sediments do not significantly support the adjacent coastline. The area of interest is characterized by low sediment deposition from the mainstream, while the sediment yield in the torrent mouth is estimated to be 888 t km−2 yr−1. Analyses using the USLE and SDR reveal that the mean slope of the study area is 23%. The R-factor measures rainfall erosivity, is based on a daily time step, and is calculated at 179.8 MJ mm ha−1 h−1 yr−1. Additionally, the classification of the K-factor, as provided by various databases, posed challenges regarding the accuracy and accessibility of data. Sediment yield is a critical parameter, as it directly influences the amount of material transported and deposited along the coast. For comparison, the estimated mean sediment yield is 358 t km−2 yr−1 for the Petra basin [5] and 352 t km−2 yr−1 for the Tsiknias basin [15], both located on Lesvos Island and similarly characterized by low sediment deposition.
Moreover, the dam’s construction works as a sediment retainer to accelerate coastal erosion [26,27]. Terrestrial sediments do not reach the river mouth due to human constructions, which retain them in the reservoir. Additionally, the oceanographic characteristics of the area cause rapid shoreline changes [11]. As a result, the shoreline in the area of interest is influenced by both natural processes and the reduced sediment transport from the river. However, the absence of comprehensive watershed and dam monitoring data presents significant challenges for accurately assessing sediment transport. In this context, quantitative research becomes essential for modeling the impacts of anthropogenic interventions on sediment dynamics and coastal morphology [2].
To support such assessments, it is useful to estimate the volume of sediment retained by the dam. Based on the regulated drainage basin area of 37.8 km2 and an annual sediment yield of 564 t km−2 yr−1, the total sediment input to the reservoir can be approximated at 21,319 t yr−1. This substantial volume of trapped sediment highlights the dam’s geomorphological significance, as it prevents a considerable amount of terrestrial material from reaching the river mouth and coastal zone. A more precise quantification of this retention helps clarify the degree to which the dam disrupts sediment continuity, reinforcing its role in the observed coastal sediment deficit and ongoing shoreline retreat.

Author Contributions

Conceptualization, L.C. and O.T.; methodology, S.P. and G.V.; software, S.P.; validation, L.C. and O.T.; formal analysis, S.P.; investigation, S.P.; resources, S.P. and G.V.; data curation, S.P.; writing—original draft preparation, S.P.; writing—review and editing G.V. and L.C.; visualization, L.C. and O.T.; supervision, L.C. and O.T.; project administration, O.T.; funding acquisition, O.T. All authors have read and agreed to the published version of the manuscript.

Funding

This research was supported by the research project BEACHTECH, co-funded by the European Union (ERDF) and national funds of Greece and Cyprus under the Cooperation Program “INTERREG V-A Greece-Cyprus 2014–2020”. The work of Varra G. is co-funded by the European Union program FSE-REACT-EU, PON Ricerca e Innovazione 2014–2020 DM1062/2021.

Data Availability Statement

The data used in this study are contained within the article. Additional data are available upon request from the corresponding author.

Acknowledgments

Part of the research was conducted by Papasarafianou Stamatia as a PhD candidate at the Science and Technology Department, University of Naples, Parthenope, Naples, Italy.

Conflicts of Interest

The authors declare no conflicts of interest.

References

  1. Posada, P.B.O.; Henao, P.W. Diagnóstico de La Erosión En La Zona Costera Del Caribe Colombiano; Serie Publicaciones Especiales No. 13; INVEMAR: Santa Marta, Colombia, 2008. [Google Scholar]
  2. Malara, G.; Zema, D.A.; Arena, F.; Bombino, G.; Zimbone, S.M. Coupling watershed-coast systems to study evolutionary trends: A review. Earth Sci. Rev. 2020, 201, 103040. [Google Scholar] [CrossRef]
  3. Anfuso, G.; Postacchini, M.; Di Luccio, D.; Benassai, G. Coastal Sensitivity/Vulnerability Characterization and Adaptation Strategies: A Review. J. Mar. Sci. Eng. 2021, 9, 72. [Google Scholar] [CrossRef]
  4. Monioudi, I.N.; Velegrakis, A.F.; Chatzipavlis, A.E.; Rigos, A.; Karambas, T.; Vousdoukas, M.I.; Hasiotis, T.; Koukourouvli, N.; Peduzzi, P.; Manoutsoglou, E.; et al. Assessment of island beach erosion due to sea level rise: The case of the Aegean archipelago (Eastern Mediterranean). Nat. Hazards Earth Syst. Sci. 2017, 17, 449–466. [Google Scholar] [CrossRef]
  5. Papasarafianou, S.; Siarkos, I.; Gkaifyllia, A.; Sahtouris, S.; Varra, G.; Chatzipavlis, A.; Hasiotis, T.; Tzoraki, O. A Holistic Approach for Coastal-Watershed Management on Tourist Islands: A Case Study from Petra Molyvos Coast, Lesvos Island (Greece). Geosciences 2024, 14, 326. [Google Scholar] [CrossRef]
  6. Monioudi, I.N.; Velegrakis, A.F.; Chatzistratis, D.; Vousdoukas, M.I.; Savva, C.; Wang, D.; Bove, G.; Mentaschi, L.; Paprotny, D.; Morales-Nápoles, O.; et al. Climate change-induced hazards on touristic island beaches: Cyprus, Eastern Mediterranean. Front. Mar. Sci. 2023, 10, 1188896. [Google Scholar] [CrossRef]
  7. Syvitski, J.P.M.; Peckham, S.D.; Hilberman, R.; Mulder, T. Predicting the terrestrial flux of sediment to the global ocean: A planetary perspective. Sediment. Geol. 2003, 162, 5–24. [Google Scholar] [CrossRef]
  8. Samaras, A.G.; Koutitas, C.G. Modelling the impact on coastal morphology of the water management in transboundary river basins: The case of River Nestos. Manag. Env. Qual. Inter. J. 2008, 19, 455–466. [Google Scholar] [CrossRef]
  9. Safakli, O.V.; Kutlay, K. Potential multiplier effect of tourism sector in northern Cyprus. Int. J. Acad. Res. Accounting Financ. Manag. Sci. 2016, 6, 44–51. [Google Scholar] [CrossRef]
  10. Water Development Department (WDD), Ministry of Agriculture, Rural Development and Environment. 2017. Available online: https://www.moa.gov.cy/moa/wdd/wdd.nsf/index_en/index_en?opendocument (accessed on 11 October 2023).
  11. Gkaifyllia, A.; Sahtouris, S.; Ðorđević, N.; Papasarafianou, S.; Monioudi, I.; Tzoraki, O.; Hasiotis, T. Coastal Zone Vulnerability Analysis in East Mediterranean Basin: Greece, Cyprus and Montenegro; CEST: Athens, Greece, 2023; pp. 2944–9820. [Google Scholar] [CrossRef]
  12. Camera, C.; Zomeni, Z.; Noller, J.S.; Zissimos, A.M.; Christoforou, I.C.; Bruggeman, A. A high-resolution map of soil types and physical properties for Cyprus: A digital soil mapping optimization. Geoderma 2017, 285, 35–49. [Google Scholar] [CrossRef]
  13. Helmi, A.M. Quantifying catchments sediment release in arid regions using GIS-based Universal soil loss equation (USLE). Ain Shams Eng. J. 2023, 14, 102038. [Google Scholar] [CrossRef]
  14. Todisco, F.; Vergni, L.; Ortenzi, S.; Di Matteo, L. Soil Loss Estimation Coupling a Modified USLE Model with a Runoff Correction Factor Based on Rainfall and Satellite Soil Moisture Data. Water 2022, 14, 2081. [Google Scholar] [CrossRef]
  15. Michas, S.; Nikolaou, K.; Koukouvinos, A.; Mamassis, N. Estimation of Sediment Yield with MUSLE and Monitoring. A Case Study for Tsiknias Dam at Lesvos Island in Greece; IWA Balkan Young Water Professionals: Thessaloniki, Greece, 2015; p. 8. [Google Scholar]
  16. Papageorgiou, N.; Hadjimitsis, D.G. Evaluation of Soil Loss by Water in Archaeological Landscapes by Using the (R)USLE Model and GIS. The Case Study of Paphos District, Cyprus. In Digital Heritage. Progress in Cultural Heritage: Documentation, Preservation, and Protection; Ioannides, M., Fink, E., Cantoni, L., Champion, E., Eds.; Springer International Publishing: Cham, Switzerland, 2020; pp. 64–77. [Google Scholar] [CrossRef]
  17. Panagos, P.; Meusburger, K.; Ballabio, C.; Borrelli, P.; Alewell, C. Soil erodibility in Europe: A high-resolution dataset based on LUCAS. Sci. Total Environ. 2014, 479–480, 189–200. [Google Scholar] [CrossRef] [PubMed]
  18. Panagos, P.; Meusburger, K.; Alewell, C.; Montanarella, L. Soil erodibility estimation using LUCAS point survey data of Europe. Environ. Model. Softw. 2012, 30, 143–145. [Google Scholar] [CrossRef]
  19. Van der Knijff, J.M.; Jones, R.J.A.; Montanarella, L. Soil Erosion Risk Assessment in Europe, JRC Scientific and Technical Report-EUR 19022 EN; European Soil Bureau, European Commission: Brussel, Belgium, 2000.
  20. Van der Knijff, J.M.; Jones, R.J.A.; Montanarella, L. Soil Erosion Risk Assessment in Italy, JRC Scientific and Technical Report-848 EUR 19044 EN; European Soil Bureau, European Commission: Brussel, Belgium, 2000.
  21. Panagos, P.; Borrelli, P.; Meusburger, C.; Alewell, C.; Lugato, E.; Montanarella, L. Estimating the soil erosion cover-management factor at European scale. Land Use Policy 2015, 48, 38–50. [Google Scholar] [CrossRef]
  22. Desmet, P.J.J.; Govers, G. Comment on Modelling Topographic Potential for Erosion and Deposition Using GIS. Int. J. Geogr. Inf. Sci. 1997, 11, 603–610. [Google Scholar] [CrossRef]
  23. Panagos, P.; Borrelli, P.; Meusburger, K. A New European Slope Length and Steepness Factor (LS-Factor) for Modeling Soil Erosion by Water. Geosciences 2015, 5, 117–126. [Google Scholar] [CrossRef]
  24. Karydas, C.G.; Panagos, P. Modelling monthly soil losses and sediment yields in Cyprus. Int. J. Digit. Earth 2016, 9, 766–787. [Google Scholar] [CrossRef]
  25. De Vente, J.; Poesen, J. Predicting Soil Erosion and Sediment Yield at the Basin Scale: Scale Issues and Semi Quantitative Models. Earth-Sci. Rev. 2005, 71, 95–125. [Google Scholar] [CrossRef]
  26. Bombino, G.; Barbaro, G.; D’Agostino, D.; Denisi, P.; Foti, G.; Labate, A.; Zimbone, S.M. Shoreline change and coastal erosion: The role of check dams. First indications from a case study in Calabria, southern Italy. Catena 2022, 217, 106494. [Google Scholar] [CrossRef]
  27. Velegrakis, A.F.; Vousdoukas, M.; Andreadis, E.P.; Adamakis, G.; Meligonitis, R. Impacts of dams on their downstream beaches: A case study from Eresos coastal basin, island of Lesvos, Greece. Mar. Geores. Geotechnol. 2008, 24, 350–371. [Google Scholar] [CrossRef]
Figure 1. A location map of Cyprus Island shows (a) the catchment area of interest, within the Mavrokolympos reservoir, and (b) the “Vulnerable Area” (Coral Bay–Potima coastline).
Eesp 32 00016 g001
Figure 2. Map depiction of USLE factors for the basin under study: (a) K-factor, (b) LS-factor, (c) C-factor, and (d) P-factor.
Eesp 32 00016 g002
Figure 3. Soil loss distribution for the study basin (the areal percentage of each soil erosion class is given in parentheses).
Eesp 32 00016 g003
Table 1. K factor values according to the geological formations within the soil types in the Mavrokolympos basin.
IDSoil TextureK-Factor
BcCalcaric Cambisols0.036
BvVertic Cambisols0.036
EoOchric Rendzinas0.038
IcCalcaric Lithosols0.041
IeEutric Lithosols0.036
RcCalcaric Regosols0.038
XvVertic Xerosols0.036
Table 2. C and P factor values for each land use type within the study area basin.
CORINE CodeLand Cover in Study AreaCP
112Discontinuous urban fabric0.101.00
131Mineral extraction sites0.151.00
142Sport and leisure facilities0.201.00
211Non-irrigated arable land0.100.70
221Vineyards0.350.50
222Fruit trees and berry plantations0.100.50
231Pastures0.120.90
241Annual crops associated with permanent crops0.230.90
242Complex cultivation patterns0.160.50
243Land principally occupied by agriculture0.130.70
323Sclerophyllous vegetation0.061.00
324Transitional woodland-shrub0.031.00
Table 3. Soil loss and sediment yield at the study area basin.
ParametersUnitsValues
Soil lossMean annual soil loss (per ha)t ha−1 yr−120.1
Mean annual soil loss (per km2)t km−2 yr−12010
Catchment areakm266.5
Total annual soil losst yr−1133,665
Sediment yieldReduction sediment yield factor (De Vente and Poesen [25])-0.44
Annual sediment yield (per km2)t km−2 yr−1888
Total annual sediment yieldt yr−159.1
Disclaimer/Publisher’s Note: The statements, opinions and data contained in all publications are solely those of the individual author(s) and contributor(s) and not of MDPI and/or the editor(s). MDPI and/or the editor(s) disclaim responsibility for any injury to people or property resulting from any ideas, methods, instructions or products referred to in the content.

