Article

The Effects of Temporary Portable Rumble Strips on Vehicle Speeds in Road Work Zones

1
Construction Safety Research Center, Department of Civil and Architectural Engineering, Lawrence Technological University, Southfield, MI 48075, USA
2
Road Commission for Oakland County, Lawrence Technological University, Southfield, MI 48075, USA
3
Civil Engineering Department, College of Engineering, Al Hussein Bin Talal University, Ma’an 71111, Jordan
4
Department of Civil and Architectural Engineering, Lawrence Technological University, Southfield, MI 48075, USA
5
Civil Engineering Technology & Construction Management, University of North Carolina at Charlotte, 9201 University City Blvd, Charlotte, NC 28223, USA
*
Author to whom correspondence should be addressed.
Safety 2024, 10(4), 105; https://doi.org/10.3390/safety10040105
Submission received: 22 July 2024 / Revised: 8 December 2024 / Accepted: 10 December 2024 / Published: 16 December 2024
(This article belongs to the Special Issue Safety Performance Assessment and Management in Construction)

Abstract

:
The safety of construction and maintenance work zones has been highlighted as a crucial aspect of construction management that requires special attention due to the increasing number of fatal and non-fatal injuries in recent years. Temporary traffic control (TTC) is required by the Occupational Safety and Health Administration (OSHA) to improve overall safety performance during road construction and maintenance projects. The fact that speeding and distracted drivers may overlook TTC warning signs and directions has been reported as one of the leading causes of work zone incidents. This study aimed to examine both the impact of temporary portable rumble strips (TPRSs) on traffic speeds and the response of different vehicle types in road work zones, including trucks and cars. Accordingly, field experiments were conducted in collaboration with the Road Commission for Oakland County (RCOC) in Michigan. The findings indicate that TPRSs have a statistically significant impact on the driving speed of light vehicle drivers but not on medium and heavy vehicles, such as trucks. This study contributes to the existing literature by quantifying the safety benefits of TPRS use, providing valuable data for policymakers and construction professionals. By demonstrating the effectiveness of TPRSs in reducing the speed of light vehicles, this research supports the implementation of these systems as a practical measure for enhancing safety within road construction work zones. Additionally, this study highlights the need for tailored approaches to address the limited impact on larger vehicles, underscoring the importance of developing complementary strategies to ensure comprehensive safety improvements across all vehicle types.

1. Introduction

For many years, the construction industry has struggled with high rates of accidents and fatalities [1]. An average of 123 workers per year died at road construction sites between 2003 and 2020, totaling 2222 fatalities (The National Institute for Occupational Safety and Health (NIOSH), 2019) [2]. Temporary road construction sites are characterized by cramped working areas, where workers are near heavy machinery and moving traffic. These circumstances make workers extremely susceptible to occupational risks, which can result in fatal and non-fatal injuries [3]. According to the Federal Highway Administration (FHWA), an accident involving a construction zone results in a death in the US every 15 h and an injury every 16 min [4]. The expansion of travel on the American road network and recent unfavorable weather conditions (climate change) have hastened pavement deterioration, necessitating ongoing road maintenance. Data from the Bureau of Transportation Statistics (BTS) shows that between 1982 and 2012 vehicle miles traveled (VMT) increased by 86%, and over 14% between 2012 and 2020, but the total number of lane miles available to meet the rising demand for transportation only went up by 7.4% [5]. According to a survey of highway construction companies, work zone crashes have increased over time, with 67% of US construction companies reporting at least one crash in 2019, compared to just 39% in 2016 [6]. Statistics on road worker fatalities and injuries highlight the importance of safety during road construction and maintenance.
Enhancing work zone safety is a critical objective for engineering and construction practitioners. Work zone safety is one of the major priorities for transportation authorities, which accounted for a significant amount of research during the past few years both in terms of identifying the features and contributing causes of work zone crashes and the solutions for minimizing fatalities and injuries [7]. The FHWA, state departments of transportation (DOTs), the transportation sector, and the public all have serious concerns about work zone safety. The safety of drivers, the safety of field workers, and traffic mobility are all significantly impacted by work zones [8]. Due to a surge in the number of highway projects and the quick global development of highway megaprojects, the complexity and diversity of work zone risks in highway construction have greatly increased [9]. Thapa and Mishra, 2021 [6], evaluated the effectiveness of the work zone intrusion alert system in enhancing worker safety. The speed of the intruding vehicle, the distance between the sensor and the worker, and the accuracy of a system in detecting intrusions and warning field workers are the main factors in work zone crashes [6]. Part of the reason for the disproportionately high death rate is task execution close to moving vehicles, in other words, the performance of work-related tasks in close proximity to traffic or moving vehicles. Additional factors that contribute to fatalities include regular changes in traffic patterns and other construction-related activities [10]. Several measures have been put in place to safeguard employees and drivers from the rising number of injuries associated with road construction and maintenance. The FHWA and the American Road and Transportation Builders Association (ARTBA) have launched initiatives such as the National Work Zone Awareness Week to lower the number of fatalities in work zones [11].
The FHWA adopted the first version of the Manual on Uniform Traffic Control Devices (MUTCD) in November 1935. The MUTCD is the federally mandated manual for all traffic control devices installed on public roads such as streets, highways, bike lanes, and private roads [12]. The Occupational Safety and Health Administration (OSHA) adopted the MUTCD by reference (IBR). This means that MUTCD guidelines and instructions are enforceable safety requirement [13]. In addition, several states have developed their MUTCDs, such as Michigan’s Michigan Manual on Uniform Traffic Control Devices (MMUTCD). In essence, the MUTCD offers suggestions on how to set up a temporary traffic control (TTC) in maintenance, construction, and utility work zones [14]. The main goal of TTC is to flow traffic through and around construction zones in a relatively safe and efficient manner while safeguarding equipment, field workers, other road users, and responders to traffic events [15]. TTC zones create unpredictable, continually shifting situations for drivers. TTC planning ensures that traffic flow for motor vehicles, cyclists, and pedestrians (including accessible passage), transit operations, and access (and accessibility) to property and utilities, even when the typical use of a roadway or a private road open to public travel is suspended.
Zhu et al. (2016) [16] assessed the safety effect of an alternative merge sign configuration in work zones. They found that the alternative sign configuration was not superior but performed equal to the MUTCD sign configuration. Devices with the ability to display drivers’ speeds have considerable potential for reducing speeds and improving compliance [17]. The same study suggested that in the absence of active enforcement, data from this project indicate that drivers are likely to drive as fast as they feel comfortable, regardless of the posted speed limit. Zhang and Gambatese (2017) [18] evaluated the impact of Portable Changeable Message Signs (PCMS) on drivers’ speed during mobile paving operations. They found that using a combination of PCMSs and radar speed displays is the most effective approach. To prevent drivers from passing the road closure, Edara et al. (2014) [19] evaluated the dynamic message signs (DMSs) on rural road closures. They found a significant increase in traffic flow on the detour route and a corresponding decrease on the affected route. Similarly, Nnaji et al. (2018) [20] assessed several work zone intrusion alert technologies. The findings suggested that the reviewed technologies have the potential to improve workers’ safety.
According to [21], the primary factors influencing work zone safety are driver speeding, inattention, failure to comply with traffic control measures, and inadequate work zone plans. Exceeding speed limits often contributes to severe crashes in construction work zones, as drivers have inadequate time to respond effectively [22]. Speed is widely recognized as a critical factor in traffic safety, supported by numerous studies [23,24,25]. Speed-related crashes account for more than one-third of all fatal accidents, making them a major contributor to fatalities in the United States. Al-Bayati et al. (2023) [13] found that roughly 45% of reviewed cases were caused by vehicle intrusion. The National Highway Traffic Safety Administration (NHTSA) defines speed-related crashes as those involving “the driver behavior of exceeding the posted speed limit or driving too fast for conditions” [26]. Multiple studies have consistently found a correlation between speeding and increased crash occurrences [27,28,29]. Police enforcement is considered the most effective speed-reducing measure in work zones [30,31]. However, they would not be available for extended periods. In addition, photo fining systems, which capture traffic violations via portable or fixed cameras, could significantly reduce the speeding of aggressive drivers [30].
Recently, the Michigan Department of Transportation (MDOT) has a special provision for TPRSs that recommends the use of the RoadQuake® 2F model (PSS Innovations for Safety, 2444 Baldwin Road, Cleveland, OH 44104, USA). TPRSs should be used on all roads under the jurisdiction of the MDOT with speed limits up to 65 mph (i.e., 104.6 km/h) to where traffic flaggers will be in place longer than four hours. This requirement is optional for local agencies and all other MDOT projects that do not utilize traffic flaggers. TPRSs are designed to alert drivers to changing traffic patterns and reduce rear end crashes in advance of work zones [32]. They also protect traffic regulators (i.e., flaggers) and workers by alerting distracted drivers prior to entering the work zone. In flagger operations, two rumble strip arrays (a rumble strip array consists of three rumble strips) should be placed on the mainline in each direction when vehicles approach the work zone. As shown in Figure 1, the first array should be positioned about 200 feet before the Road Work Ahead sign, while the second array should be placed approximately 200 feet before the Traffic Regulator sign. On the other hand, the three strips should be installed with spacing proportional to the road speed limit, ranging from 10 feet for speeds of 40 mph or less, to 20 feet for speeds between 60 mph (i.e., 64 km/h) and 65 mph (i.e., 104.6 km/h). This study aims to better understand and quantify the impact of one set of rumble strip array on traffic speed.

2. Research Objectives and Methodology

One of the main benefits of TPRSs is that they create an audible noise and vibration when drivers enter work zones, which alert drivers. As a result, TPRSs could help reduce traffic speeds and increase driver awareness. However, current studies lack a detailed analysis comparing the responses of different vehicle types (trucks versus cars) to rumble strips. Thus, the objective of this study is to assess the effectiveness of TPRSs in reducing traffic speeds in construction work zones. In addition, this study also compares the impact of TPRSs on different types of vehicles (trucks versus cars).
To achieve the study objectives, two field experiments were conducted on a lane closure on an undivided multi-lane road in collaboration with the Road Commission for Oakland County (RCOC) and PSS Innovations for Safety, the manufacturer of RoadQuake® 2F (i.e., TPRS). A lane closure operation on 12 Mile Road was selected in the City of Farmington Hills, Oakland County, Michigan, as shown in Figure 2. The project included 0.93 miles of cold milling to resurface the existing pavement. The project site was a five-lane road, which was under construction with lane closures while traffic was maintained through one passing lane in two directions. A minimum of one 11-foot-wide lane in each direction was always maintained open. The project crew faced challenges with speeding drivers passing the work zone while disobeying all the warning signs, traffic control devices, and posted speed limits within the zone. Thus, the work conditions placed workers next to moving traffic. As mentioned earlier, this study aims to better understand and quantify the impact of a single rumble strip array on traffic speed. To minimize the potential influence of the sun, the researchers applied only one array on the lane where traffic was moving westward.
The test time selected was during non-rush hours (10 a.m.–12 p.m.) to ensure a consistency of traffic flow without peak hour traffic influence (rush hour and interrupted traffic flow). The operating speed, as recommended by the American Association of State Highway and Transportation Officials (AASHTO), is defined as the speed at which drivers are observed operating their vehicles during free-flow conditions. This speed reflects the behavior of most drivers and is typically used for design and evaluation purposes to ensure the safety and efficiency of roadway systems.
As can be seen in Figure 2, the treatment used in this study differs from that in Figure 1, as there are no flaggers. There are no specific instructions provided for the scenario addressed in this study. On 28th September 2021, the following two test configurations were conducted:
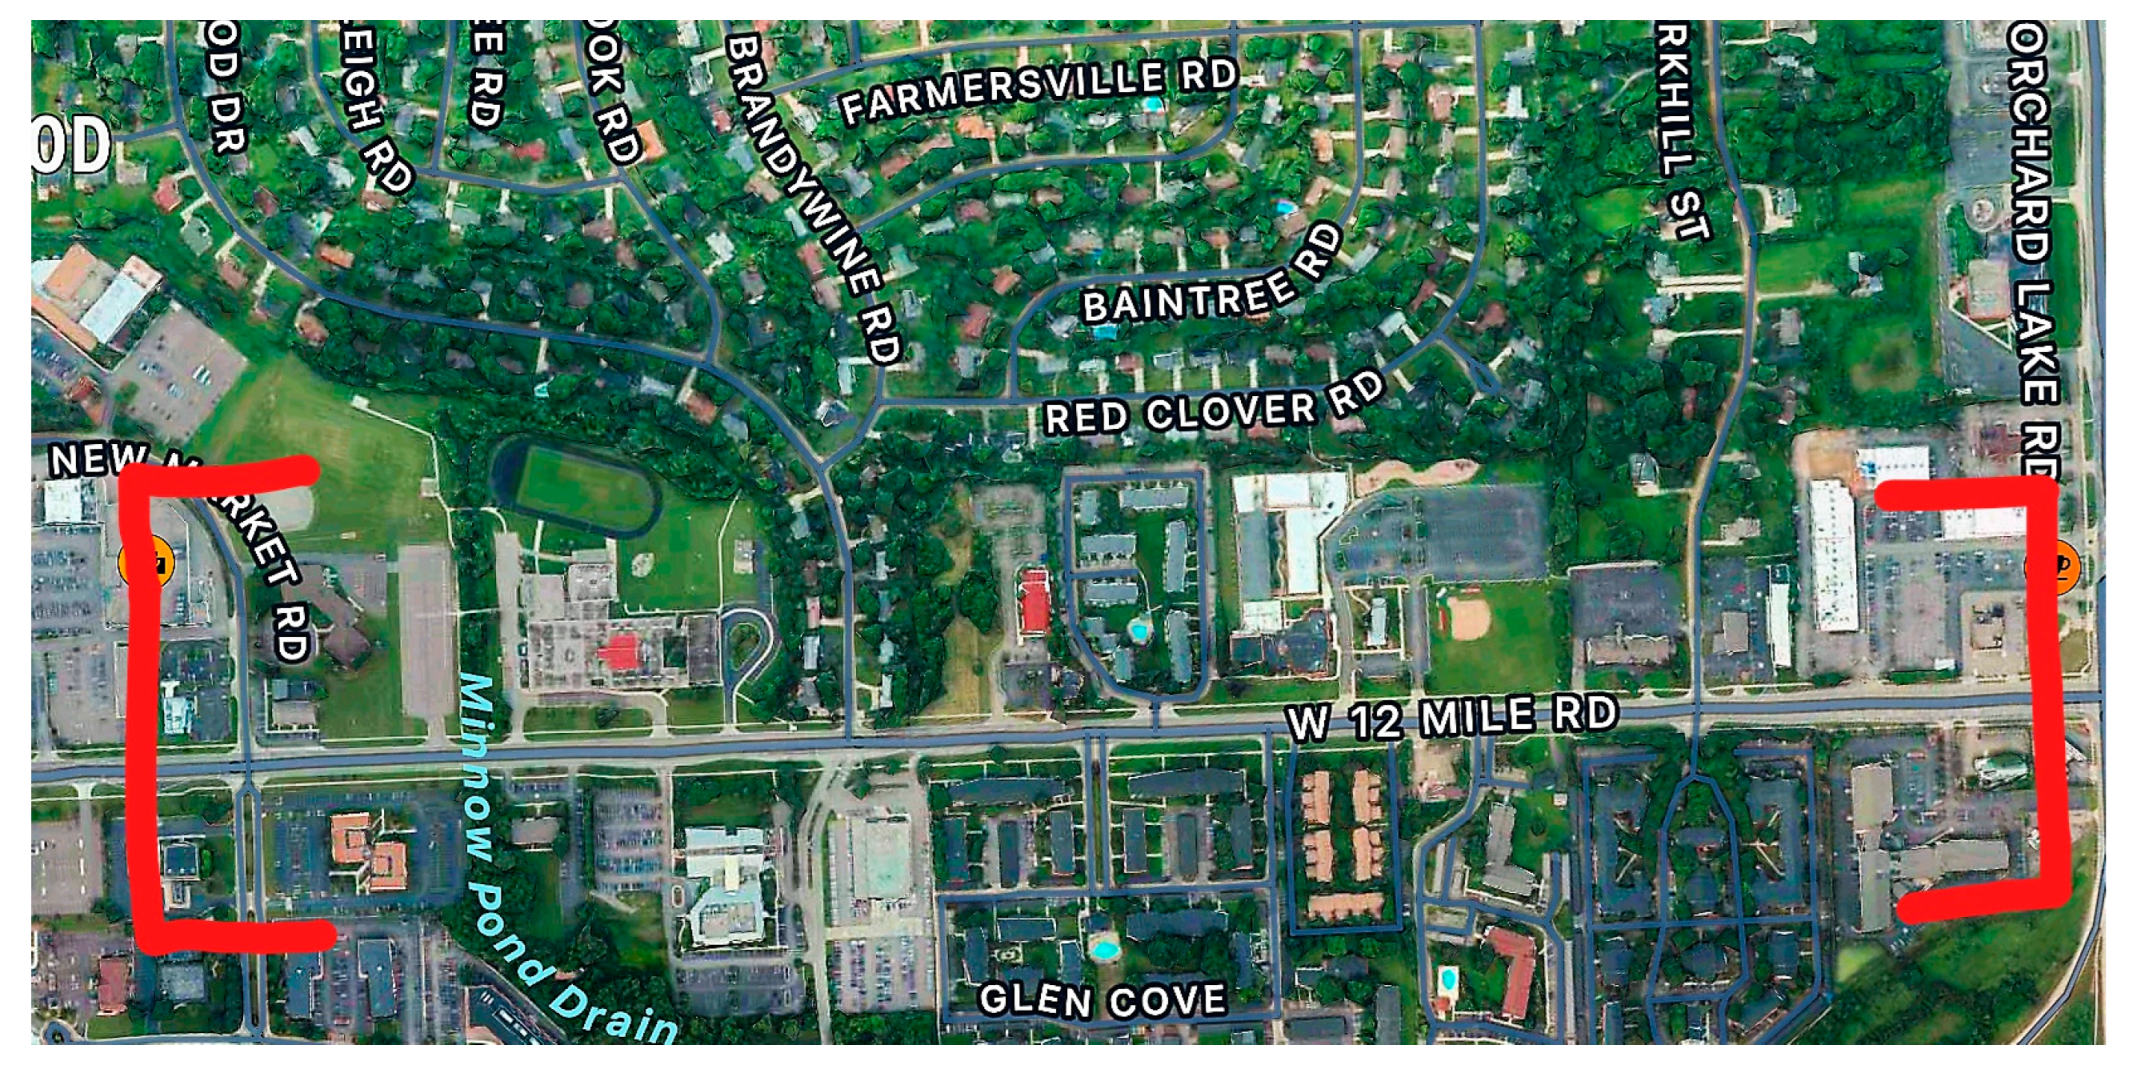
  • The field test started on W 12 Mile Road was started at 10:00 a.m. without TPRSs. In the beginning, two speed counters were installed at 1080 feet from the Orchard Lake Road intersection on both traveling lanes. The speeds of moving cars were collected for an hour, until 11:00 a.m. Figure 3 shows the test configuration.
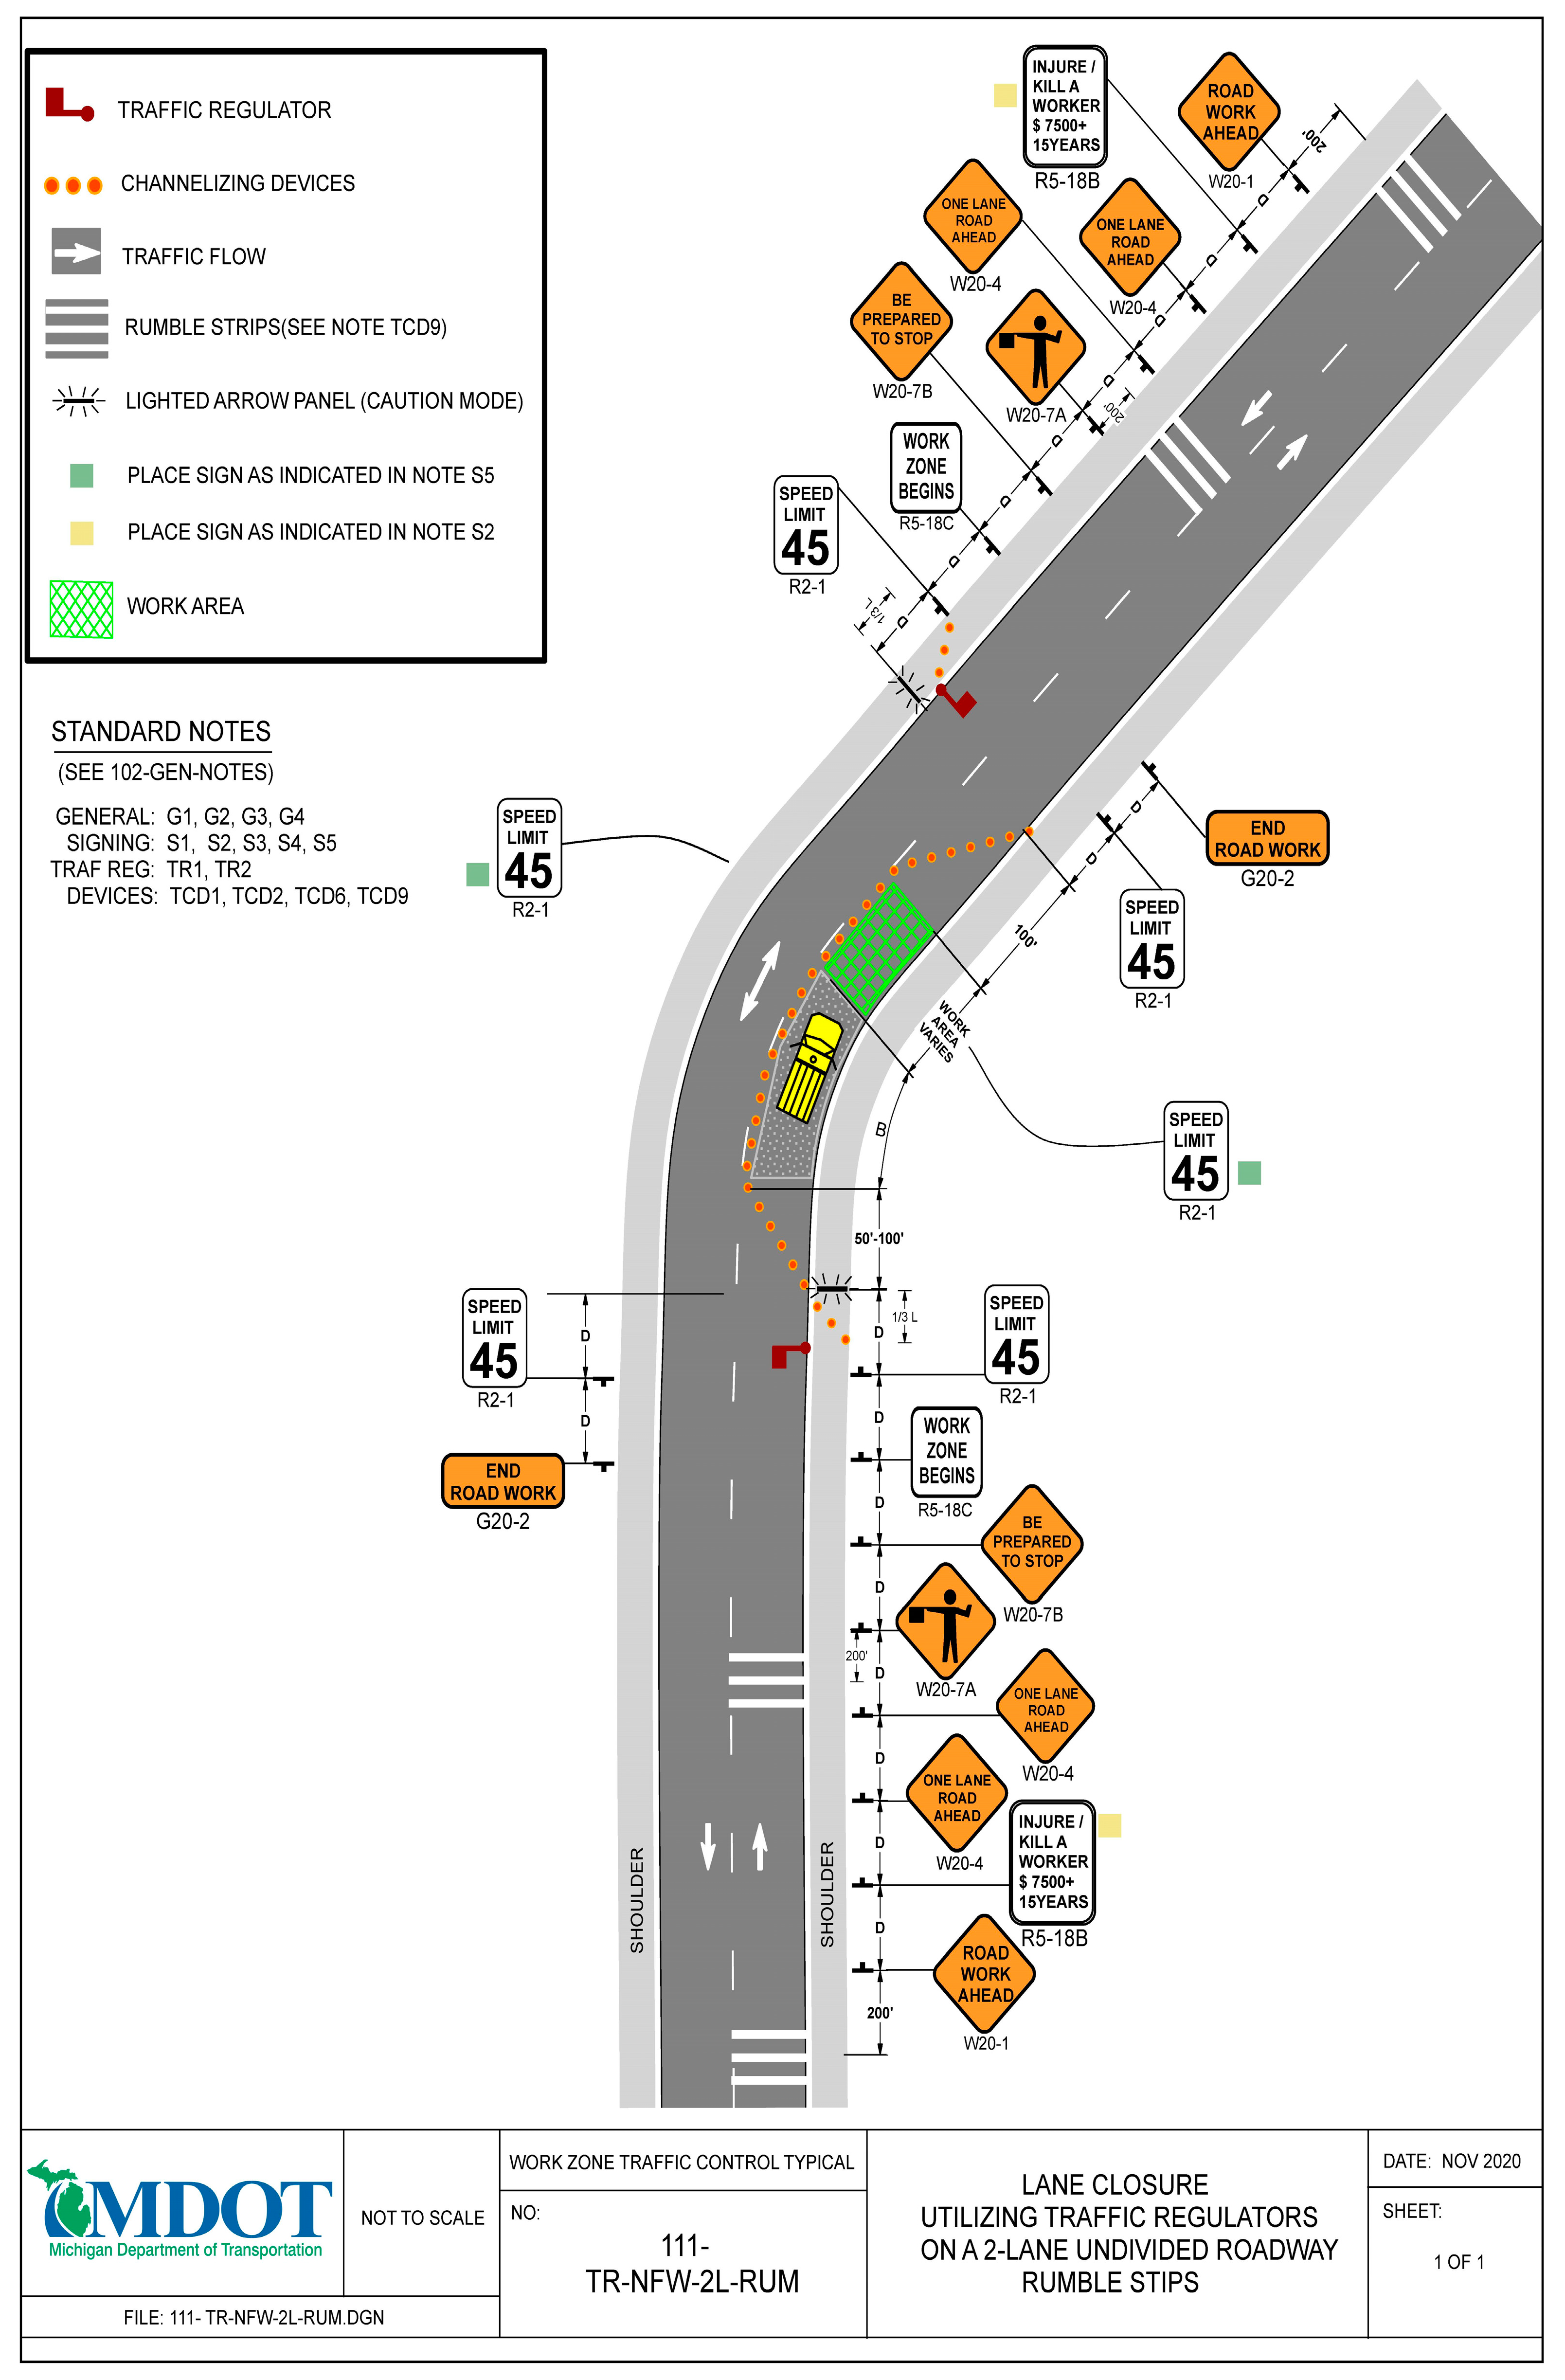
  • TPRSs were installed on W 12 Mile Road, west bound (WB), 360 feet from the speed counters and 720 feet from the Orchard Lake Road intersection at 11:00 a.m. for one hour. The TPRS configuration consisted of one array containing three TPRSs with a layout of 15 feet, center to center, between every TPRS. Figure 4 shows the test configuration.
Traffic speed was measured both before and after the installation of TPRS using fourth-generation tube traffic counters. This method is effective for measuring average traffic volume and speed [33], making it a suitable choice for the study methodology. Tube counters consist of rubber tubes laid across the roadway, which detect vehicle axles as they pass over. By recording the time between axle strikes, the system accurately calculates the speed of each vehicle. Data collection was conducted continuously over a defined period to capture variations in traffic flow and speed patterns before and after the introduction of the TPRS. Finally, they did not actively control or alter traffic speed [33].

3. Study Findings

Control data contain traffic speed data recorded during the first hour (10:00 a.m. to 11:00 a.m.), including 532 vehicles with an average speed of 29.56 mph. The 85th percentile speed ranges from 33 to 34 mph, with an average 85th percentile speed of 33.5 mph. Traffic speed data between 10:00 a.m. and 11:00 a.m. without TPRSs are shown in Figure 5.
TPRS data contain traffic speed data recorded during the second hour (11:00 a.m. to 12:00 p.m.), including a total of 572 speed measurements with an average speed of 27.94 mph. The 85th percentile speed ranges from 31 to 32 mph, with an average 85th percentile speed of 31.5 mph. Test data between 11:00 a.m. and 12:00 p.m. with TPRSs are demonstrated in Figure 6. Clearly, the average 85th percentile is lower by 2 miles during the second hour due to the use of TPRS.
Table 1 displays the vehicle speeds for the two groups, those without TPRSs and those with TPRSs, measured separately for cars (light vehicles) and trucks (medium and heavy vehicles). For vehicle speeds without TPRSs, the mean speeds were higher in all vehicle types (cars and trucks) compared to vehicle speed with TPRSs category. Moreover, for the 85th percentile speed, the speed differences between the two groups were also noticeable, varying from—0.8 mph (i.e., 1.2 km/h) to 1.9 mph (i.e., 3 km/h). A t-test was conducted to determine if there were significant differences in speed due to the use of TPRSs. This method has been employed by several researchers [34,35,36]. Variances for traffic speed were homogeneous across both data sets, as indicated by Levene’s test for equality of variances (p = 0.312). The results for the light vehicle category indicated that traffic speed with TPRSs was statistically significantly lower than without TPRSs, with a mean difference of 1.85 mph (i.e., 2.9 km/h) for cars (Std. Err. = 0.29), t = 6.46, p < 0.001. Similarly, for all vehicle categories, traffic speed with TPRSs was also statistically significantly lower than without TPRSs, with a mean difference of 1.72 mph, i.e., 2.7 km/h] (Std. Err. = 0.28), t = 6.17, p < 0.001. However, the difference for trucks was not statistically significant at the 95% confidence level, with only a 0.65 mph difference, i.e., 1 km/h] (t = 0.65).
Figure 7 presents the empirical cumulative percentage distribution of car counts, alongside speed data, both with and without TPRSs. The results indicate that vehicles without TPRSs are more likely to travel at higher speeds. TPRSs have a noticeable impact, reducing the speed of drivers by roughly 2 mph (i.e., 3.2 km/h) at the 85th percentile. The 85th percentile speed ranges from 31.5 mph (i.e., 50.6 km/h) to 33.5 mph (i.e., 53.9 km/h). This reduction is consistent with the findings of [37], who reported a 1.4–2 mph (i.e., 2.2–3.2 km/h) reduction, and [16], who observed a 1.3 mph (i.e., 2 km/h) reduction. Other studies, such as [38,39], reported larger reductions, likely due to differences in methodologies, study durations, and speed limits. Thus, while our study aligns with previous research in terms of overall reduction, none have specifically addressed the impact on different vehicle types. Although the sample size for trucks was limited, it provided insight that TPRSs might not significantly affect truck speeds.

4. Concluding Remarks

TPRSs could play a crucial role in enhancing road safety, particularly in construction and maintenance work zones. They help reduce traffic speed by producing a noticeable rumble and audible sound as vehicles pass over them. This helps drivers be more cautious and reduce their speed, which is crucial for protecting both workers and drivers. TPRSs also make work zones stand out more, especially in bad weather or low-visibility conditions. Overall, they are an effective and affordable way to improve safety around construction sites. However, there is a need to improve our understanding of the factors that contribute to the effectiveness of its use. This study offers several valuable insights into the application and effectiveness of TPRSs that are applicable on roads all over the globe.
This study clearly indicates that drivers of light vehicles reduced their speed after crossing the TPRSs. Furthermore, the rumble and audible response generated by the TPRSs likely heightened driver attention. This dual effect not only contributes to slower traffic but also enhances overall road safety by making drivers more aware of their surroundings. The increased attention may result in better reaction times and a greater ability to respond to the temporary change in driving conditions, thereby reducing the risk of accidents. Thus, the findings underscore the effectiveness of TPRSs in both moderating vehicle speed and promoting more vigilant driving behavior. Consequently, there is a crucial need to further investigate and quantify the potential influence of TPRSs on driver attention. The TPRSs also seem to help smooth driver movement through work zones and reduce sudden stops, thereby lowering the likelihood of rear-end incidents.
On the other hand, the minimal impact of the tested TPRSs on medium and heavy vehicles is a critical finding of this study. This observation suggests that while TPRSs are effective in influencing the behavior of light vehicle drivers, they may not be as effective for larger vehicles. This could be due to the different dynamics and weight distribution of medium and heavy vehicles, which may not respond to the rumble and audible cues generated by the TPRSs. Understanding this limitation is crucial for developing more comprehensive traffic management strategies that address the safety needs of all vehicle types in work zones. Future research should explore alternative or supplementary measures to enhance the effectiveness of TPRSs for medium and heavy vehicles.
TPRSs can be arranged in various configurations to suit the specific temporary traffic layouts of different projects. This flexibility allows for customized placement to address unique traffic flow patterns and safety requirements. For instance, TPRS strips can be strategically positioned to maximize their effectiveness in slowing down vehicles and enhancing driver awareness in complex or high-risk areas. Whether it is a straight road, a sharp curve, or an intersection within the work zone, the adaptable configuration of TPRS strips ensures that they can be tailored to provide optimal safety benefits for both drivers and construction workers. Additionally, further research is warranted to assess and determine the best possible configurations of TPRS strips, ensuring their maximum effectiveness across diverse traffic scenarios. Finally, the research team observed that installing TPRSs is both quick and straightforward, typically requiring just a two-person crew for installation and removal. Although the TPRS used in this test was manufactured in 2016, it remained in good condition. Therefore, the depreciation of TPRS appears to be within an acceptable range.
The primary limitation of this study is the use of a single array of TPRS, which restricts our understanding of the impact that multiple arrays may have on traffic speeds across different vehicle types. Most Departments of Transportation (DOTs) in the United States recommend using two arrays. An important question that remains unanswered is whether there would be a statistically significant difference in traffic speed reductions for various types of vehicles when comparing the use of one, two, or three arrays. Future research should examine whether there is a statistically significant difference in speed reduction and vehicle response when using one, two, or three TPRS arrays. This would help determine the optimal configuration for maximizing control over traffic speeds and understanding how different vehicle types are affected. The second limitation is the sample size of trucks (n = 59) compared to that of cars (n = 473). Future studies should aim for a more balanced sample size between the two vehicle types. A balanced sample size is important because it enhances the statistical power of the study, minimizes bias, and allows for more accurate and reliable comparisons between the groups. Finally, future studies should be conducted at various times of the day and under different weather conditions to gain a more comprehensive understanding of the impact of TPRS. By examining the effects during different periods and weather scenarios, researchers can better assess how factors such as visibility, road surface conditions, and driver behavior under varying environmental conditions influence the effectiveness of TPRS.

Author Contributions

Conceptualization, A.J.A.-B. and M.A.; methodology, A.J.A.-B.; Software, all authors; Validation, all authors; Formal Analysis, all authors; Investigation, A.J.A.-B. and M.A.; resources, A.J.A.-B. and M.A.; writing—original draft preparation, A.J.A.-B. and M.A.; writing—review and editing, all authors; Visualization, A.J.A.-B.; Supervision, A.J.A.-B.; Project administration, A.J.A.-B. All authors have read and agreed to the published version of the manuscript.

Funding

No funding was provided to support this study.

Institutional Review Board Statement

Institutional Review Board Statement: This study was conducted in accordance with the Declaration of Helsinki and approved by the Institutional Review Board of Lawrence Technological University, Southfield, MI (protocol code #01824, 24 July 2024).

Informed Consent Statement

Not applicable.

Data Availability Statement

Some or all data, models, or codes that support the findings of this study are available from the corresponding author upon reasonable request.

Conflicts of Interest

The authors declare no conflicts of interest.

References

  1. Al-Bayati, A.J.; Bilal, G.A.; Esmaeili, B.; Karakhan, A.; York, D. Evaluating OSHA’s fatality and catastrophe investigation summaries: Arc flash focus. Saf. Sci. 2021, 140, 105287. [Google Scholar] [CrossRef]
  2. The National Institute for Occupational Safety and Health (NIOSH). Highway Work Zone Safety. The National Institute for Occupational Safety and Health. 2019. Available online: https://www.cdc.gov/niosh/topics/highwayworkzones/ (accessed on 1 January 2020).
  3. Sakhakarmi, S.; Park, J. Improved intrusion accident management using haptic signals in roadway work zone. J. Saf. Res. 2022, 80, 320–329. [Google Scholar] [CrossRef]
  4. Federal Highway Administration, (FHWA). FHWA Work Zone Facts and Statistics. 2018. Available online: https://ops.fhwa.dot.gov/wz/resources/facts_stats.htm (accessed on 1 January 2020).
  5. Mishra, S.; Golias, M.M.; Thapa, D. Work Zone Alert Systems; Department of Transportation: Nashville, TN, USA, 2021. [Google Scholar]
  6. Thapa, D.; Mishra, S. Using worker’s naturalistic response to determine and analyze work zone crashes in the presence of work zone intrusion alert systems. Accid. Anal. Prev. 2021, 156, 106125. [Google Scholar] [CrossRef]
  7. Yang, H.; Ozbay, K.; Ozturk, O.; Xie, K. Work zone safety analysis and modeling: A state-of-the-art review. Traffic Inj. Prev. 2015, 16, 387–396. [Google Scholar] [CrossRef] [PubMed]
  8. Ullman, G.L.; Lomax, T.J.; Scriba, T. A Primer on Work Zone Safety and Mobility Performance Measurement; Federal Highway Administration, Office of Operations: Washington, DC, USA, 2011. [Google Scholar]
  9. Li, Y.; Hu, Y.; Xia, B.; Skitmore, M.; Li, H. Proactive behavior-based system for controlling safety risks in urban highway construction megaprojects. Autom. Constr. 2018, 95, 118–128. [Google Scholar] [CrossRef]
  10. BLS, B.o.L.S (Bureau of Labor Statistics). (Injuries, Illnesses, and Fatalities). 2019. Available online: https://www.bls.gov/iif/oshwc/cfoi/cftb0331.htm (accessed on 1 January 2020).
  11. Nnaji, C.; Gambatese, J.; Lee, H.W.; Zhang, F. Improving construction work zone safety using technology: A systematic review of applicable technologies. J. Traffic Transp. Eng. 2020, 7, 61–75. [Google Scholar] [CrossRef]
  12. McNally, A.; Kosnett, A.; Crachiola, C.; Rasmussen, B.; Frankil, M. US Fish and Wildlife Service Manual on Uniform Traffic Control Devices Digest; John A. Volpe National Transportation Systems Center: Cambridge, MA, USA, 2021. [Google Scholar]
  13. Al-Bayati, A.J.; Ali, M.; Nnaji, C. Managing Work Zone Safety during Road Maintenance and Construction Activities: Challenges and Opportunities. Pract. Period. Struct. Des. Constr. 2023, 28, 04022068. [Google Scholar] [CrossRef]
  14. Agencies, L. Temporary Traffic Control Handbook for Local Agencies. 2016. Available online: https://publications.iowa.gov/21890/ (accessed on 1 January 2020).
  15. Fan, W.; Choe, S.; Leite, F. Prevention of backover fatalities in highway work zones: A synthesis of current practices and recommendations. Int. J. Transp. Sci. Technol. 2014, 3, 311–337. [Google Scholar] [CrossRef]
  16. Zhu, Z.; Edara, P.; Sun, C. Case study of an alternative merging sign design for temporary traffic control in work zones. J. Transp. Eng. 2016, 142, 05015005. [Google Scholar] [CrossRef]
  17. Brewer, M.A.; Pesti, G.; Schneider IV, W. Improving compliance with work zone speed limits: Effectiveness of selected devices. Transp. Res. Rec. 2006, 1948, 67–76. [Google Scholar] [CrossRef]
  18. Zhang, F.; Gambatese, J.A. Highway construction work-zone safety: Effectiveness of traffic-control devices. Pract. Period. Struct. Des. Constr. 2017, 22, 04017010. [Google Scholar] [CrossRef]
  19. Edara, P.; Sun, C.; Keller, C.; Hou, Y. Evaluation of dynamic message signs on rural freeways: Case study of a full freeway closure. J. Transp. Eng. 2014, 140, 89–98. [Google Scholar] [CrossRef]
  20. Nnaji, C.; Gambatese, J.; Lee, H.W. Work zone intrusion: Technology to reduce injuries and fatalities. Prof. Saf. 2018, 63, 36–41. [Google Scholar]
  21. Rathnasiri, N.; De Silva, N.; Wijesundara, J. State of the art in work zone safety: A systematic review. Int. J. Transp. Sci. Technol. 2024, 13, 14–28. [Google Scholar] [CrossRef]
  22. Ghasemzadeh, A.; Ahmed, M.M. Exploring factors contributing to injury severity at work zones considering adverse weather conditions. IATSS Res. 2019, 43, 131–138. [Google Scholar] [CrossRef]
  23. Alhomaidat, F.; Kwigizile, V.; Oh, J.S.; Van Houten, R. How does an increased freeway speed limit influence the frequency of crashes on adjacent roads? Accid. Anal. Prev. 2020, 136, 105433. [Google Scholar] [CrossRef]
  24. Hanandeh, S.; Khliefat, I.; Hanandeh, R.; Alhomaidat, F. Modelling the free flow speed and 85th percentile speed using artificial neural network (ANN) and genetic algorithm. Int. Rev. Civ. Eng. 2022, 13, 296–308. [Google Scholar] [CrossRef]
  25. Alhomaidat, F.; Hasan, R.A.; Hanandeh, S.; Alhajyaseen, W. Using driving simulator to study the effect of crash fact signs on speeding behaviour along freeways. Int. J. Inj. Control Saf. Promot. 2023, 30, 15–25. [Google Scholar] [CrossRef] [PubMed]
  26. National Highway Traffic Safety Administration. Traffic Safety Facts 2015: Speeding; No. DOT HS 812 409; U.S. Department of Transportation, National Highway Traffic Safety Administration: Washington, DC, USA, 2017; pp. 2006–2014. [Google Scholar]
  27. Taylor, W. The Impact of Raising the Speed Limit on Freeways in Michigan; Michigan Department of Transportation: East Lansing, MI, USA, 2000. [Google Scholar]
  28. Gates, T.; Savolainen, P.; Kay, J.; Finkelman, J.; Davis, A. Evaluating Outcomes of Raising Speed Limits on High Speed Non-Freeways; Department of Transportation, Office of Research Administration: East Lansing, MI, USA, 2015. [Google Scholar]
  29. Kwigizile, V.; Oh, J.; Cho, R.H.; Kwayu, K.; Villalobos, G. Evaluating the Impacts of Speed Limit Changes on Identified Case Studies. 2017. Available online: https://mdotjboss.state.mi.us/TSSD/getTSDocument.htm?docGuid=cecc19d9-ea5e-4411-b65c-d2a9a1ad38a4&fileName=SPR-1648-Report.pdf (accessed on 1 January 2020).
  30. Genders, W.; Razavi, S.N. Impact of Connected Vehicle on Work Zone Network Safety through Dynamic Route Guidance. J. Comput. Civ. Eng. 2016, 30, 04015020–04015021. [Google Scholar] [CrossRef]
  31. Debnath, A.K.; Blackman, R.; Haworth, N. Common hazards and their mitigating measures in work zones: A qualitative study of worker perceptions. Saf. Sci. 2015, 75, 293–301. [Google Scholar] [CrossRef]
  32. Michigan Department of Transportation, MDOT. Work Zone Safety and Mobility Manual, WZSM, “Portable Temporary Transverse Rumble Strips—Non-Freeway” 6.01.18.C. 2021. Available online: https://www.michigan.gov/mdot/-/media/Project/Websites/MDOT/Business/Work-Zone-Mobility/Work-Zone-Safety-Mobility-Manual.pdf (accessed on 1 January 2020).
  33. Federal Highway Administration. Traffic Monitoring Guide. Federal Highway Administration Traffic Monitoring Guide. 2022. Available online: https://www.fhwa.dot.gov/policyinformation/tmguide/2022_TMG_Final_Report.pdf (accessed on 1 January 2020).
  34. Roberts, C.A.; Smaglik, E.J. Driver feedback on monetary penalty and its impact on work zone speed. Transp. Res. Rec. 2012, 2272, 27–34. [Google Scholar] [CrossRef]
  35. Alhomaidat, F.; Ardekani, S. A statistical comparison of traffic measurements from the moving versus stationary observer methods. J. Transp. Technol. 2015, 5, 204–213. [Google Scholar] [CrossRef]
  36. Alhomaidat, F.; Kwigizile, V.; Oh, J.S. Impacts of freeway speed limit on operation speed of adjacent arterial roads. IATSS Res. 2021, 45, 161–168. [Google Scholar] [CrossRef]
  37. Zech, W.C.; Mohan, S.; Dmochowski, J. Evaluation of rumble strips and police presence as speed control measures in highway work zones. Pract. Period. Struct. Des. Constr. 2005, 10, 267–275. [Google Scholar] [CrossRef]
  38. Yang, H.; Ozbay, K.; Bartin, B. Effectiveness of temporary rumble strips in alerting motorists in short-term surveying work zones. J. Transp. Eng. 2015, 141, 05015003. [Google Scholar] [CrossRef]
  39. Wang, M.-H.; Schrock, S.D.; Bornheimer, C.; Rescot, R. Effects of innovative portable plastic rumble strips at flagger-controlled temporary maintenance work zones. J. Transp. Eng. 2013, 139, 156–164. [Google Scholar] [CrossRef]
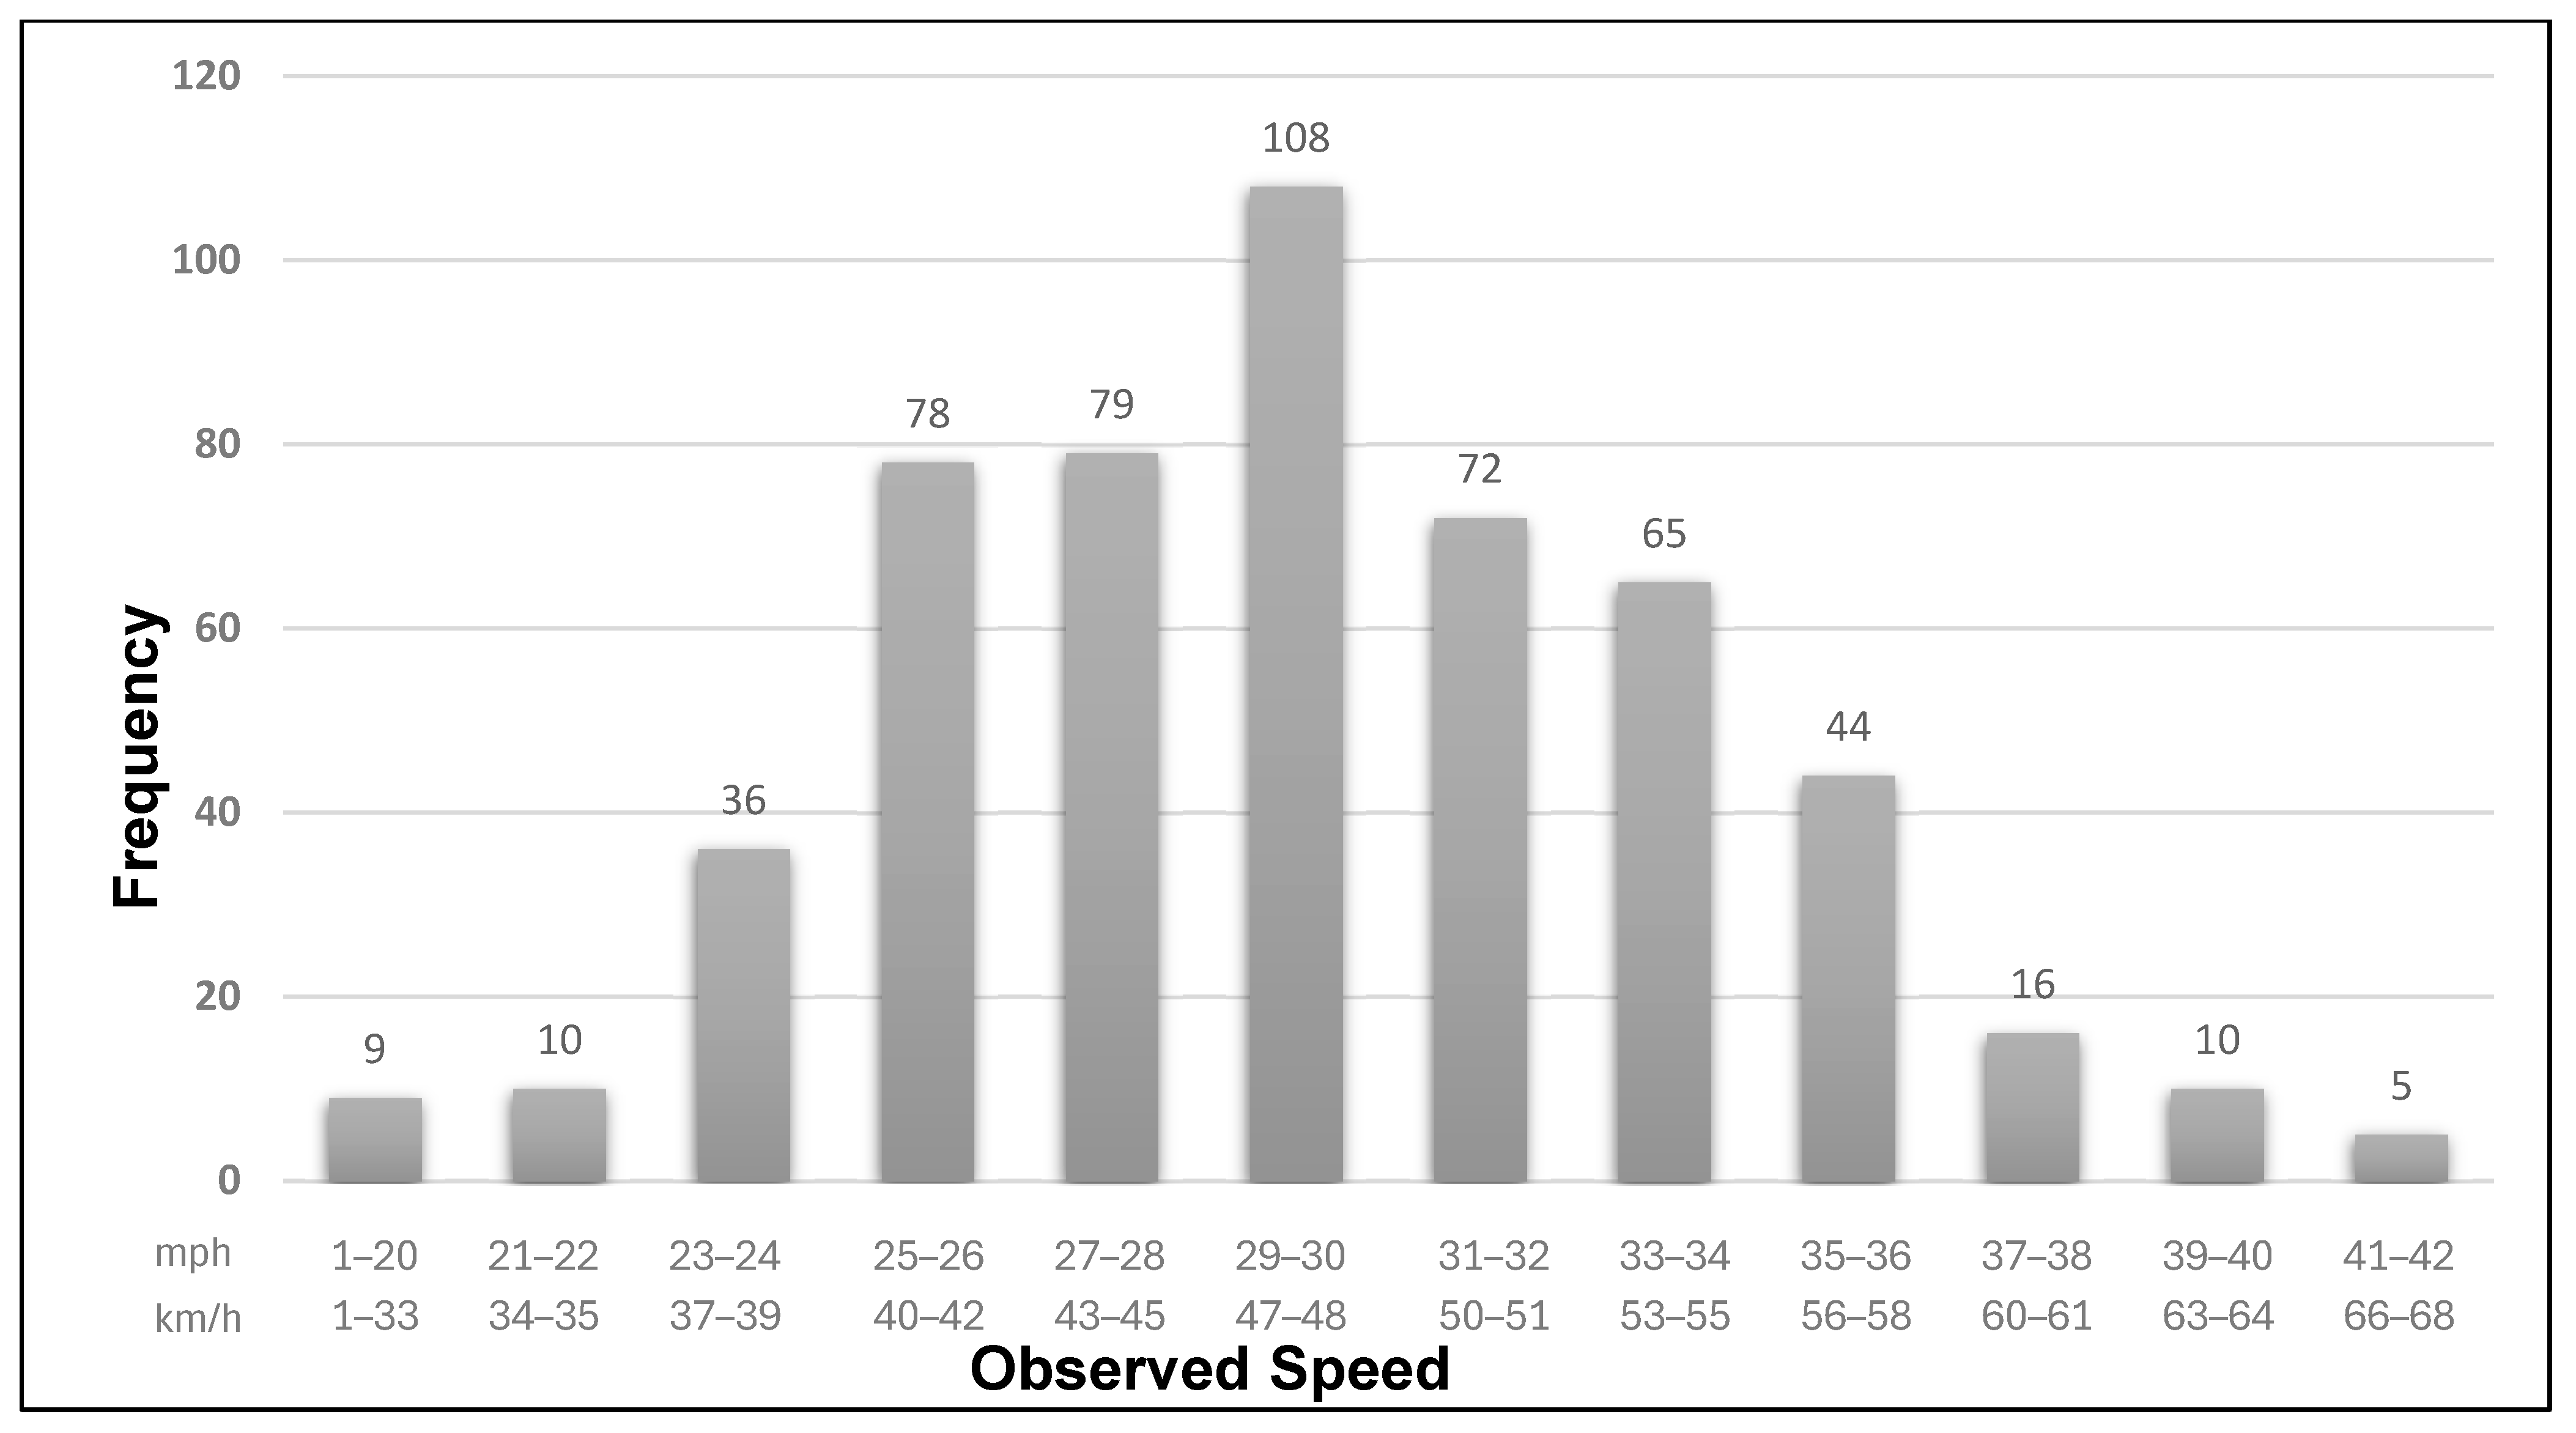
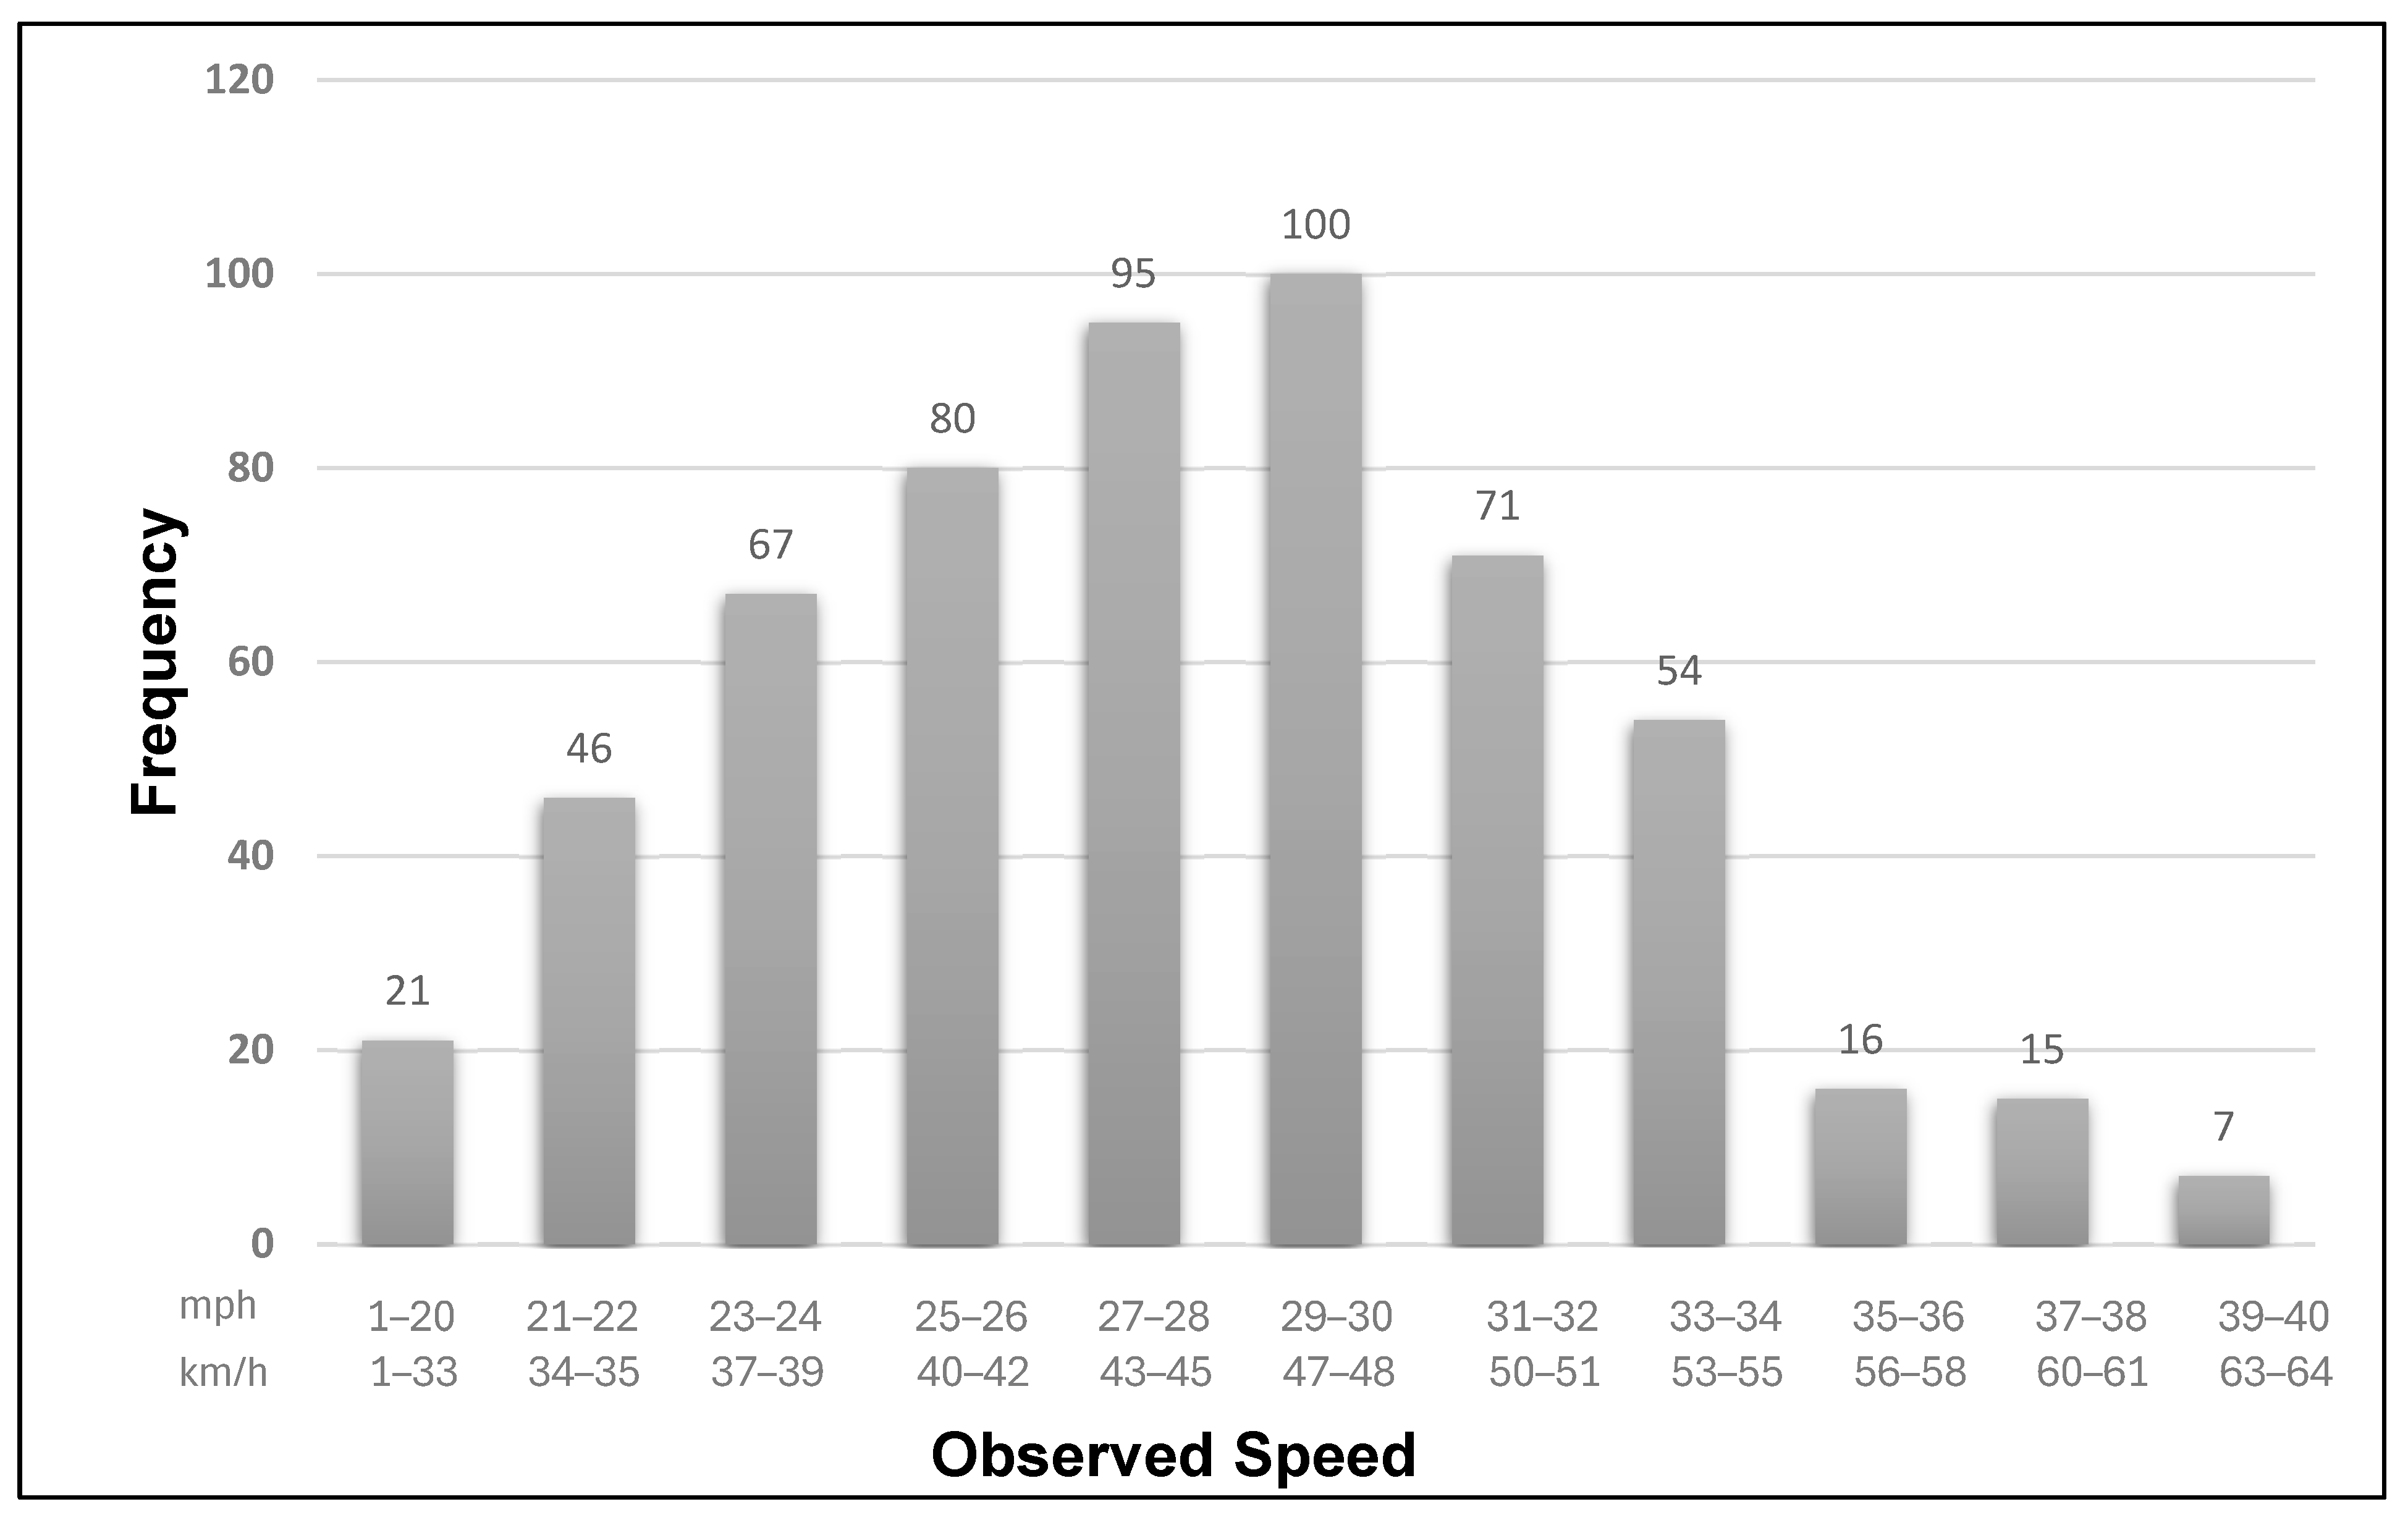
Figure 1. Typical MDOT temporary portable rumble strips (45 mph—72 km/h).
Safety 10 00105 g001
Figure 2. Project location on West Twelve Mile Rd–Apple Map @ 2024.
Safety 10 00105 g002
Figure 3. Test configuration at 10:00 a.m. without TPRS (35 mph—56 km/h).
Safety 10 00105 g003
Figure 4. Test configuration at 11:00 a.m. with TPRSs (35 mph—56 km/h).
Safety 10 00105 g004
Figure 5. Test data Between 10:00 a.m. and 11:00 a.m. without TPRSs.
Safety 10 00105 g005
Figure 6. Test data Between 11:00 a.m. and 12:00 a.m. with TPRSs.
Safety 10 00105 g006
Figure 7. Cumulative distribution of vehicle speeds with and without TPRSs.
Safety 10 00105 g007
Table 1. Speed data for cars and trucks with and without TPRSs in miles per hour.
GroupsAspectsMeanStandard Deviation85thSample
Light Vehicle (Cars)Without TPRDs (Std. Err.)29.81 (0.20)4.4434.9473
With TPRDs (Std. Err.)27.97 (0.20)4.4933505
Difference (Std. Err.)1.85 (0.29)−0.051.9N/A
t-statistic (p-value)6.46 (0.001) *
Medium and Heavy Vehicle (Trucks)Without TPRDs (Std. Err.)28.36 (0.55)4.223359
With TPRDs (Std. Err.)27.70 (0.81)6.6133.867
Difference (Std. Err.)0.65 (1.00)−2.39−0.8N/A
t-statistic (p-value)0.65 (0.515)
All VehiclesWithout TPRDs (Std. Err.)29.65 (0.20)4.4452532
With TPRDs (Std. Err.)27.94 (0.20)4.7850.81572
Difference (Std. Err.)1.72 (0.28)−0.341.19N/A
t-statistic (p-value)6.17 (0.001) *
* Statistically significantly different.
Disclaimer/Publisher’s Note: The statements, opinions and data contained in all publications are solely those of the individual author(s) and contributor(s) and not of MDPI and/or the editor(s). MDPI and/or the editor(s) disclaim responsibility for any injury to people or property resulting from any ideas, methods, instructions or products referred to in the content.

