Article

Effect of Droplet Contamination on Camera Lens Surfaces: Degradation of Image Quality and Object Detection Performance

by
Hyunwoo Kim
1,
Yoseph Yang
2,
Youngkwang Kim
1,
Dong-Won Jang
1,
Dongil Choi
1,
Kang Park
1,
Sangkug Chung
1,* and
Daegeun Kim
2,*
1
Department of Mechanical Engineering, Myongji University, Yongin 17058, Republic of Korea
2
Microsystems, Inc., Yongin 17058, Republic of Korea
*
Authors to whom correspondence should be addressed.
Appl. Sci. 2025, 15(5), 2690; https://doi.org/10.3390/app15052690
Submission received: 13 January 2025 / Revised: 18 February 2025 / Accepted: 25 February 2025 / Published: 3 March 2025
(This article belongs to the Section Computing and Artificial Intelligence)

Abstract

:
Recently, camera sensors have been widely used in a variety of applications, including advanced driver assistance systems (ADASs), surveillance systems, and unmanned aerial vehicles (UAVs). These sensors are often integrated with intelligent algorithms to automatically analyze information and perform specific functions. However, during rainy weather, droplets on the camera lens surface can obstruct the view, leading to degraded image quality and reduced algorithm performance. This paper quantitatively evaluates the effect of droplet contamination on image quality and object detection performance. Image quality degradation was analyzed using the modulation transfer function (MTF), with droplet volume and number as variables. Results show that the MTF50 decreased by up to 80% when the droplet volume reached 10 μL. To assess the effect on object detection, performance changes were evaluated across different detection algorithms. The findings reveal that droplet contamination can reduce the detection performance of small objects by up to 90%, as measured by the mean average precision (mAP) metric. Furthermore, degradation was more severe on hydrophilic surfaces compared to hydrophobic ones. This study demonstrates that droplet characteristics such as volume, number, and shape significantly influence both image quality and object detection performance. It provides critical insights into selecting appropriate camera lens materials by comparing hydrophilic and hydrophobic surfaces while also highlighting the susceptibility of intelligent algorithms to environmental factors and underscoring the importance of effective cleaning techniques.

1. Introduction

The camera sensor, the ‘eye’ of many systems, is becoming increasingly important as technology advances. Camera sensors capture the visible spectrum of light reflected by objects and convert it into digital images, providing information analogous to human vision. These sensors are available in a variety of configurations, including different lens sizes and pixel resolutions to meet the needs of diverse applications [1,2,3,4,5]. Recently, camera sensors and artificial intelligence (AI)-based image analysis algorithms have been integrated to perform automated functions in various applications such as AI surveillance in smart cities [6,7], advanced driver assistance systems (ADASs) [8,9], unmanned aerial vehicle (UAVs) [10,11], smart agriculture [12], and intelligence robotics [13]. For example, in autonomous driving systems like ADASs, AI-based algorithms analyze data collected from a vehicle’s front camera sensors to recognize road lanes, traffic signals, pedestrians, and vehicle movements in real-time. This enables important functions such as forward collision avoidance and lane-keeping assistance to work smoothly [14]. Similarly, in AI surveillance systems, the combination of deep learning algorithms and camera sensors enables real-time object detection, behavior recognition, crowd analysis, and more to quickly detect potential threats. This is crucial in complex environments where rapid response is required [15].
However, these cameras are often operated in outdoor environments, where their lens surfaces are easily contaminated by environmental elements such as raindrops, dust, mud, and insects [16,17,18]. If the lens surface is contaminated by these elements, the performance of the camera can be significantly reduced, which has a major impact on the reliability and stability of the entire system.
Figure 1 illustrates the distortion of images when a camera lens surface is contaminated by water droplets, one of the most common environmental contaminants. A clean camera sensor provides clear information about the people and objects, as shown in Figure 1a. In contrast, when the camera sensor is contaminated by water droplets, the image quality is noticeably degraded, as shown in Figure 1b.
Image quality degradation due to the contaminants can also affect the performance of AI-based image analysis algorithms. For example, contaminants on the lens surface of an autonomous camera can cause the ADAS to miss or falsely detect objects, leading to traffic accidents [19]. Similarly, contaminants on the lens surface of surveillance cameras can produce low-quality images and videos, making it harder to collect evidence and delaying incident responses.
For this reason, many studies have recently been conducted on robustness enhancement algorithms to maintain object detection performance under external noise [20,21]. In particular, remote sensing applications, where detecting small objects is essential, have leveraged various learning-based approaches such as strong-classification weak-localization [22], adversarial training [23], and pyramid representations [24] to improve robustness. However, these robustness enhancing methods do not fundamentally address performance degradation caused by physical contaminants on the camera lens surface.
To address the issue of physical contamination on the lens surface, various decontamination technologies are currently under investigation. For instance, studies have been conducted to remove water droplets from the lens surface using electrowetting [25,26], acoustic wave [27,28], thermal technology [29,30] and restoring distorted images using deep learning-based algorithms [31,32]. These technologies contribute to preventing system performance degradation by quickly decontaminating the sensor or restoring the image.
However, there is a lack of research that has systematically evaluated the effects of contaminants on camera sensors. To emphasize the dangers of contaminants as well as the necessity of cleaning technologies and restoration algorithms, it is essential to develop reliable performance evaluation methods that measure the effect of contaminants on the performance of camera sensor systems.
Son et al. [33] were the first to develop a method to evaluate object detection performance in a controlled virtual simulation environment by replicating dust contamination conditions. The study validated object detection performance with variables such as dust concentration, color, and object type. However, since both the contamination and the driving environments were simulated, the study does not fully capture the complexity and variability of real-world conditions. Lu et al. [34] evaluated image quality degradation on contaminated camera sensors and proposed self-cleaning capabilities through hydrophobic coatings with UV durability. The study demonstrated that image quality is degraded by droplets, but it did not examine how such degradation affects the performance of advanced camera systems. Pao et al. [35] investigated the object detection performance under artificially created driving conditions in the rain. However, the object detection performance was evaluated using only one stop sign, so additional evaluation with datasets containing various objects is needed. Fursa et al. [36] analyzed the impact of droplet contamination, which is frequently generated by weather, on the real-time object detection performance of an autonomous driving system. They demonstrated that droplet contamination degrades object recognition performance, negatively impacting autonomous driving. However, the droplet contamination was simulated and does not reflect the characteristics of real-world contamination.
This paper addresses the limitations of previous studies by applying real-world contaminants directly to camera sensors and systematically analyzing their impact on system performance. Specifically, we experimentally evaluate the impact of droplet contamination on camera lens surface in terms of image quality and the performance of object detection algorithms. We also propose a method to quantitatively evaluate the degradation of image quality and object detection performance caused by contamination. We compared system performance under contaminated and uncontaminated conditions by incorporating various factors such as lens surface type, contamination level, droplet volume, and object size in the image. The evaluation results not only demonstrate the performance degradation caused by droplet contamination on camera systems that use AI-based image analysis algorithms but also clearly identify the limitations of object detection algorithms, providing insights for potential improvements.

2. Image Quality Evaluation Results

2.1. Image Quality Evaluation Metric

We measured the modulation transfer function (MTF) to quantitatively evaluate the degradation of image quality when the camera lens surface is contaminated by single and multiple droplets. The MTF is a key metric for evaluating how well an imaging system reproduces details (spatial frequency) and represents the overall spatial resolution of an image, including sharpness, contrast, and resolution. Specifically, this study utilized the slanted-edge method to measure the MTF. This method, standardized under ISO 12233, is widely used for image quality assessment due to its straightforward setup and high accuracy [37].
MTF50 is a commonly used metric for evaluating image sharpness, representing the spatial frequency (typically expressed in line pairs per millimeter or pixels per cycle) at which the image reaches 50% of its original contrast. A higher MTF50 indicates better image quality. To compare the image quality of a camera sensor before and after contamination, the difference in MTF50 between the uncontaminated and contaminated states serves as an effective measure. Therefore, we utilized the MTF50loss metric, as proposed by Sonhwei Lu et al., to evaluate the impact of various contaminants on a camera lens surface [34]. MTF50loss is defined as the difference between MTF50clean (MTF50 when the lens is clean) and MTF50contamination (MTF50 when the lens is contaminated), as shown in Equation (1). The greater the MTF50loss, the more severe the image quality degradation.
MTF50loss = MTF50clean − MTF50contamination

2.2. MTF Measurement Setup and Method

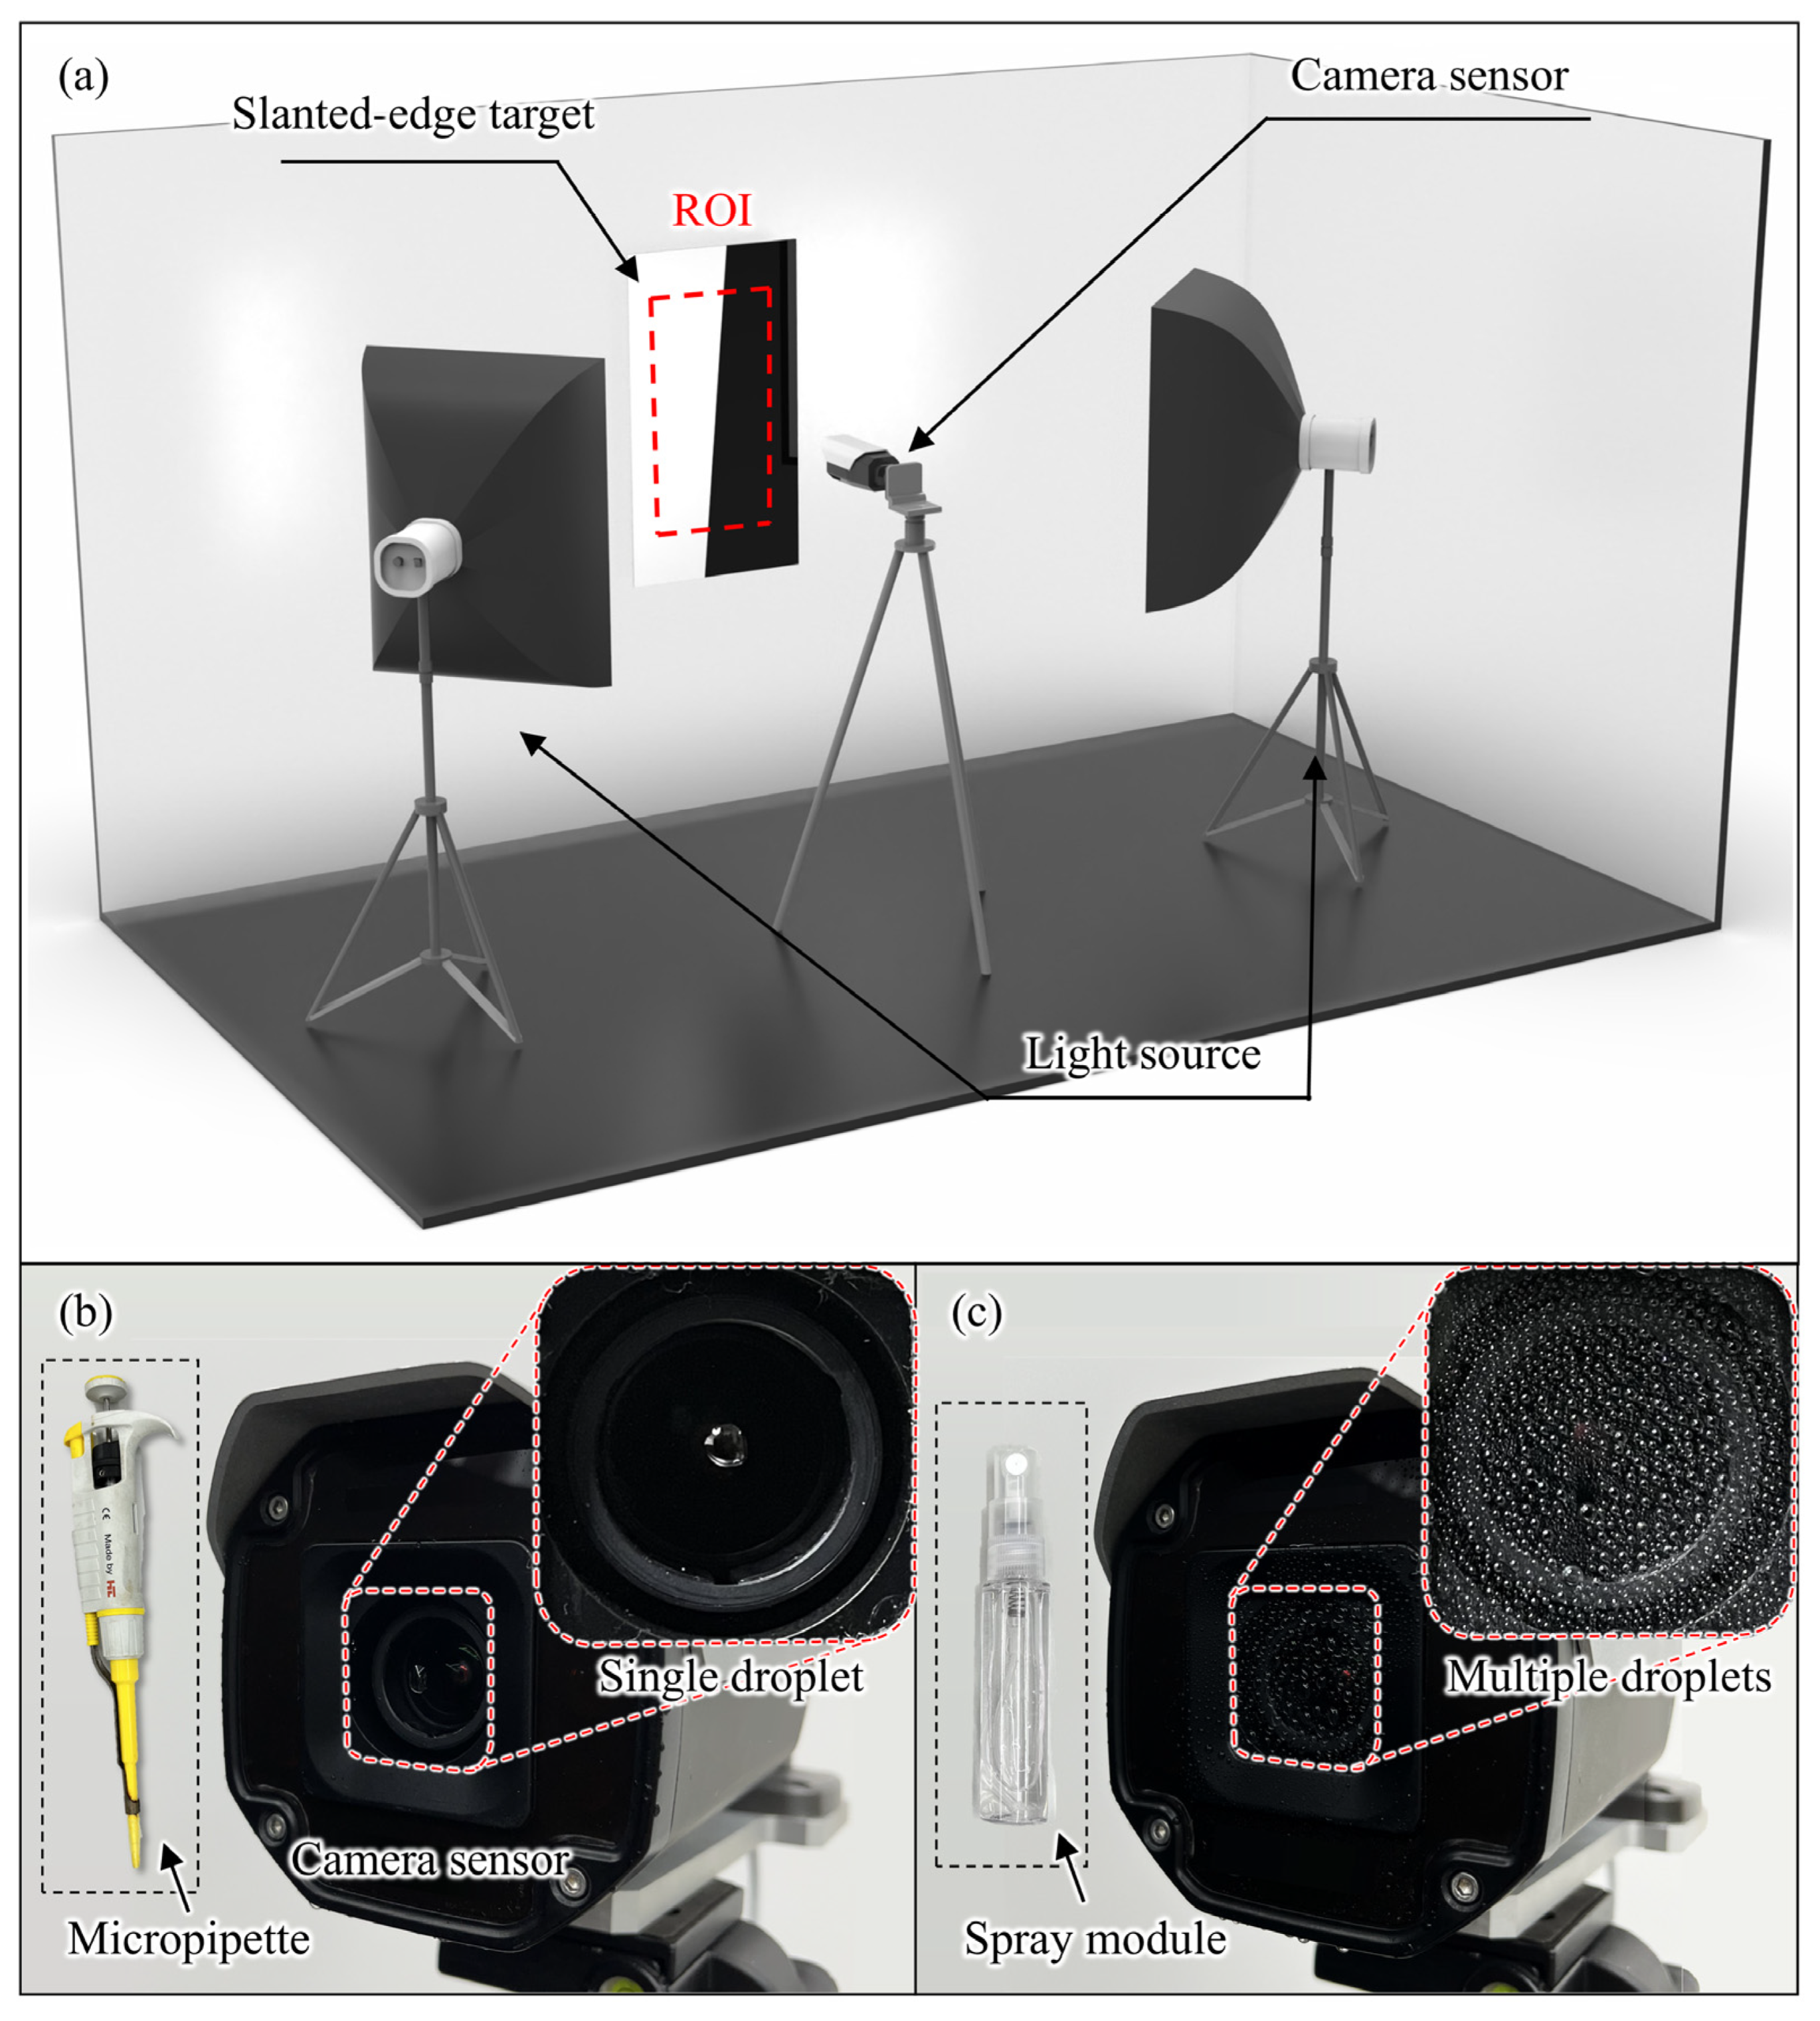
Figure 2a shows the experimental setup to evaluate image quality degradation. The slanted-edge target (50 cm in width and 100 cm in height) utilized for MTF measurements was placed 100 cm in front of the camera (AMA-02011M, ANTKR, Bucheon, Republic of Korea). The camera had a resolution of 1980 × 1080 pixels and operates at 60 frames per second (fps). The slanted-edge target was illuminated by two halogen lamps (FOMEX H1000, FOMEX, Seoul, Republic of Korea) at a 45-degree angle, with all other light blocked. The illuminance on the target was maintained at 1000 lux, and the light uniformity was over 85% across the target. This uniform lighting condition enabled precise MTF measurements with minimal noise. The camera sensor was covered by waterproof housing, and the lens was protected by a 0.7 mm thick, 90% transparent flat optical cover glass (Borofloat, FINE CHEMICAL INDUSTRY, Gimhae, Republic of Korea). To compare how surface properties of the lens affect the image quality, glass with a hydrophobic coating (Cytop CTL-809M, ACGchemicals, Exton, PA, USA) and uncoated hydrophilic bare glass were used as the lens cover glass.
For the experiments, a slanted-edge target was captured when the camera lens surface was clean and when it was contaminated by single and multiple droplets. Then, the Region of Interest (ROI) (550 pixels in width and 1000 pixels in height) at the center of the target in the image was analyzed using an image analysis program (Imatest Master, Imatest-24.1), which is widely used for MTF measurements.
To contaminate the lens cover glass with a single droplet, we placed a droplet in the center of the cover glass using a micropipette (HHT-D20, HTL Co., Warszawa, Poland), as shown in Figure 2b. Also, to contaminate the lens cover glass with multiple droplets, a spray module with a single spray volume of 0.05 mL was used 15 cm from the camera, as shown in Figure 2c.

2.3. Image Quality Degradation Effects of Single Droplet Contamination

Figure 3 shows a side view of a single droplet (3 μL in volume) on hydrophobic and hydrophilic lens cover glass surfaces, respectively. On the hydrophobic surface, the droplet maintains a hemispherical shape, whereas, on the hydrophilic surface, the droplet appears more flattened. These differences in shape are due to the varying surface energies of the two materials. The wettability of each surface was measured using the sessile drop method. The hydrophobic surface, with lower surface energy, showed a droplet contact angle of 112.5°, while the hydrophilic surface, with a relatively higher surface energy, exhibited a droplet contact angle of 66°. These differences in the contact angle and droplet shape suggest that the refraction of light through the droplets varies between surfaces, potentially affecting image quality.
Since most cameras capture their surroundings rather than the sky or ground, they are positioned vertically to the ground. Droplets on the cover glass that are vertical to the ground are affected by gravity, so droplets over a certain volume slide off the surface [29]. We observed that droplets larger than 10 μL on the hydrophilic surface and droplets larger than 5 μL on the hydrophobic surface slid off. Based on these observed results, droplets smaller than 10 μL (1, 3, 5, and 10 μL in volume) were selected for use as contaminants.
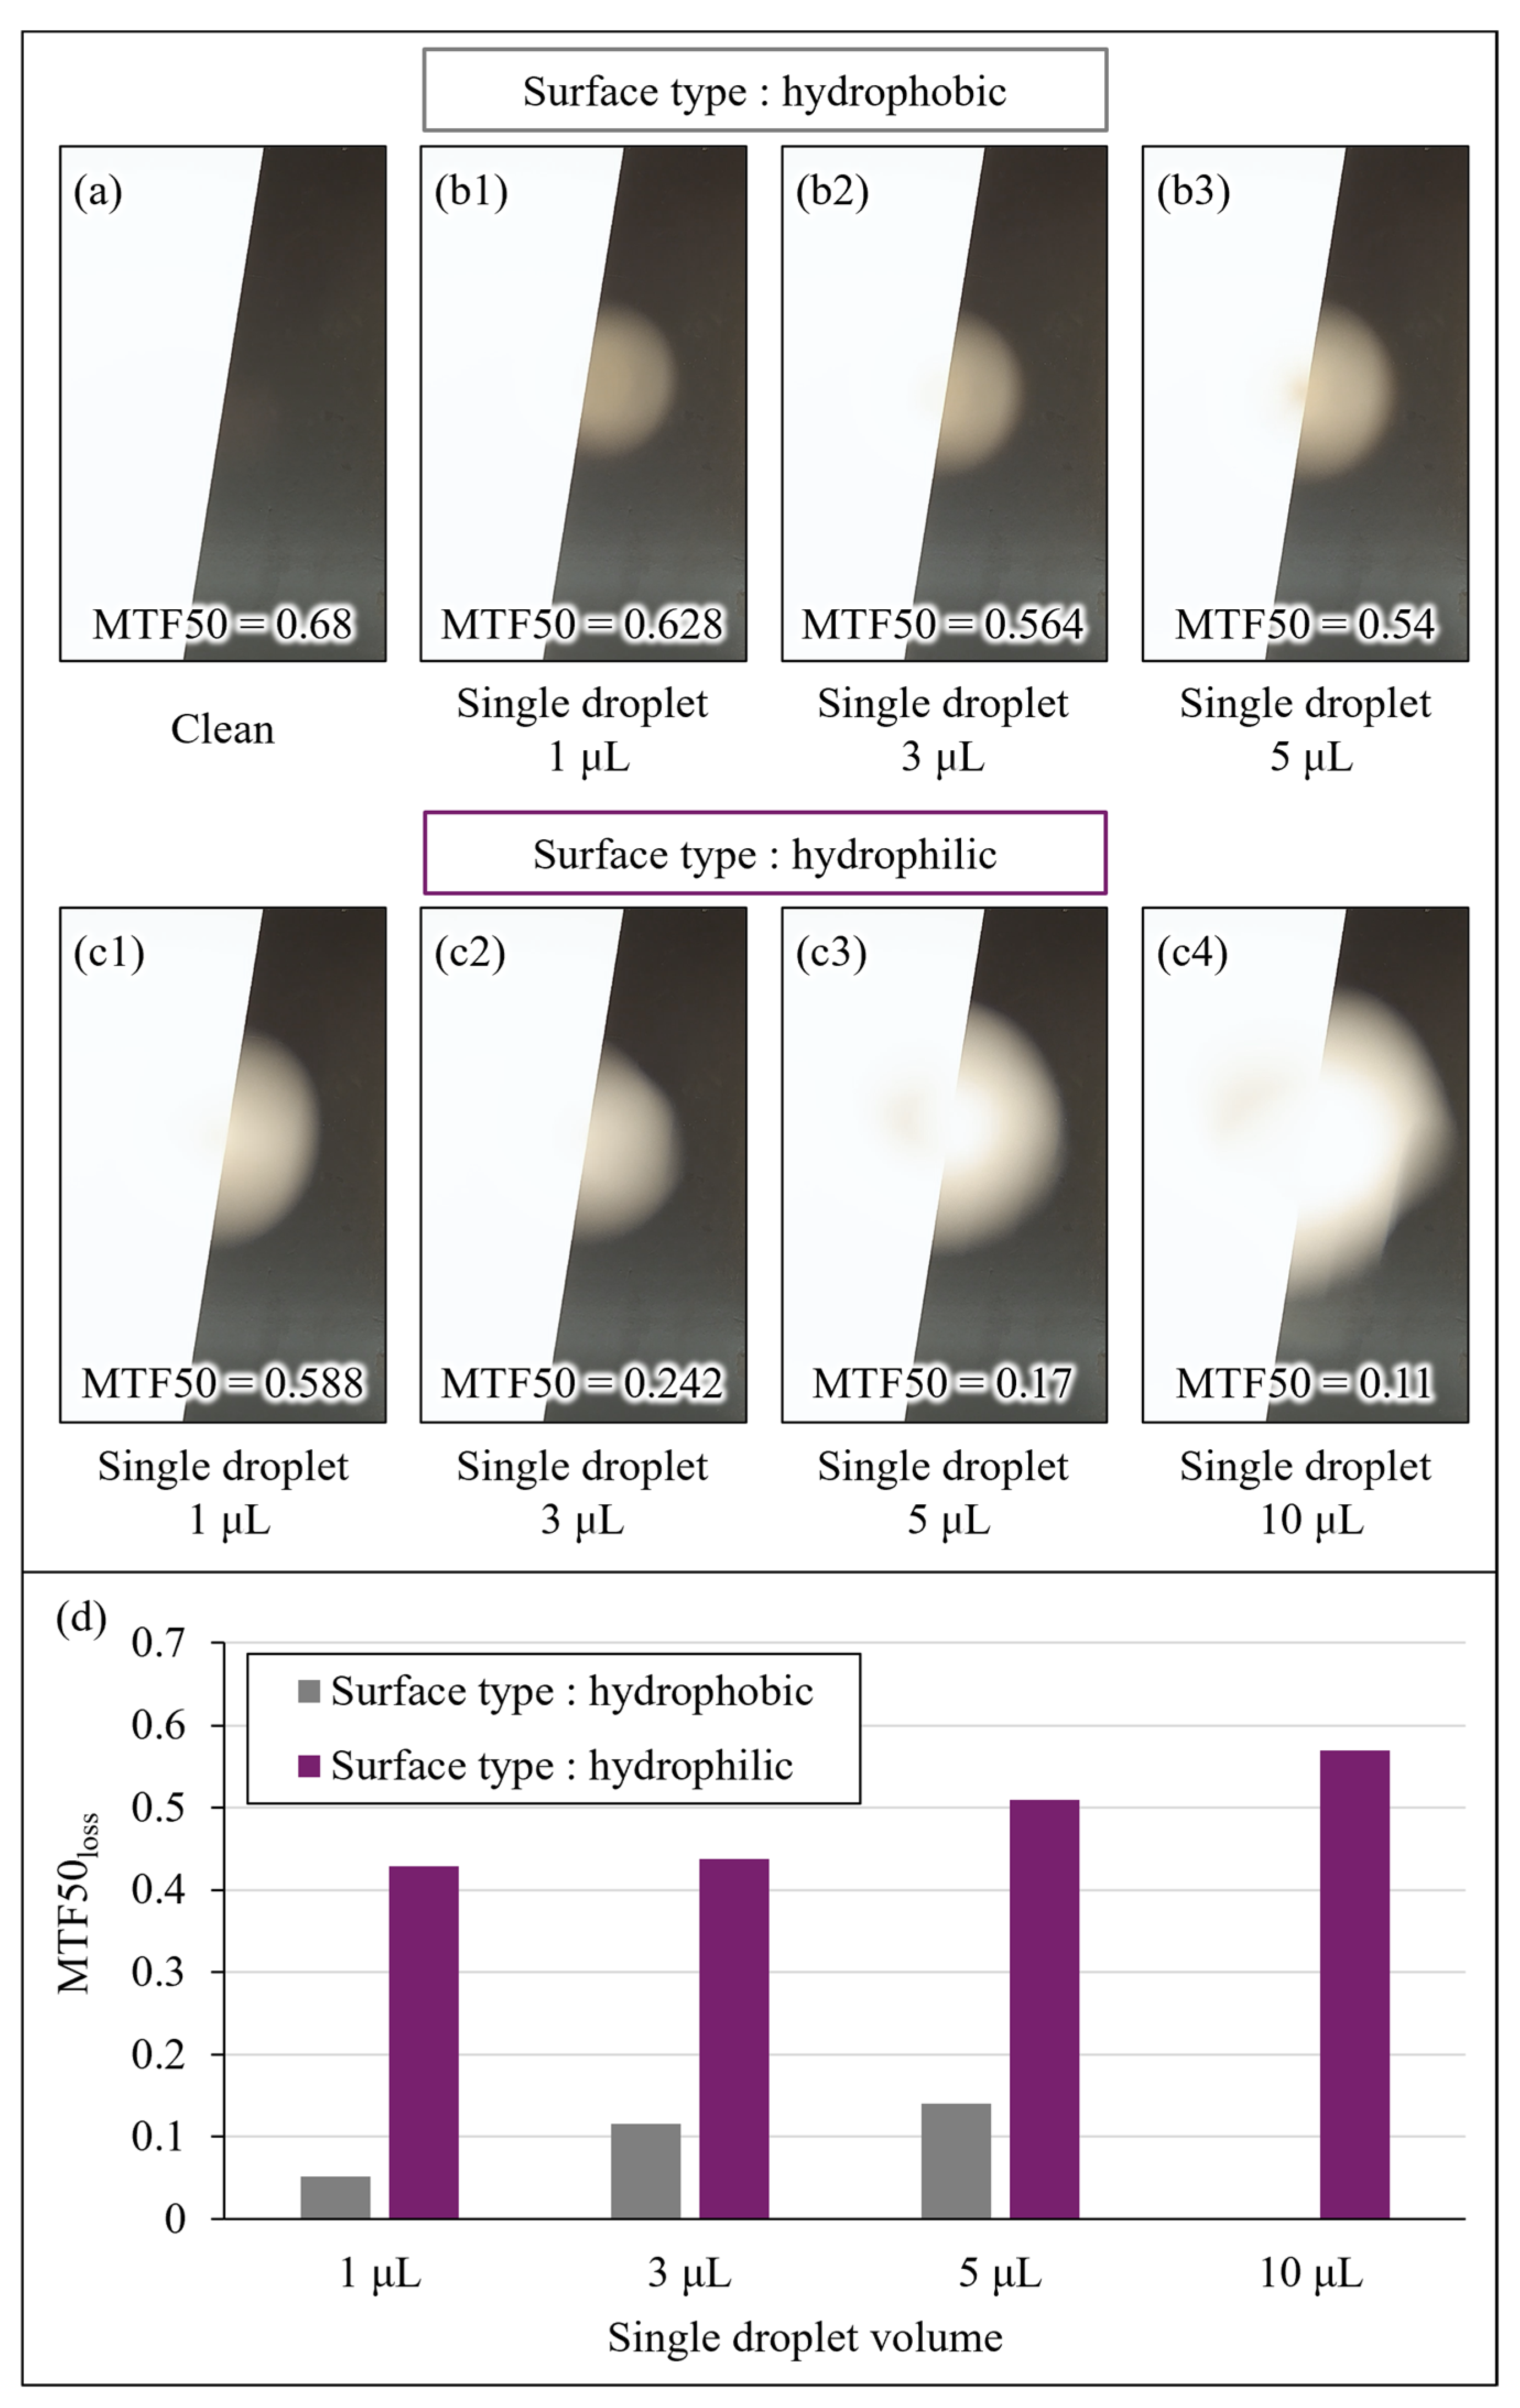
Figure 4a–c show images of a slanted-edge target when the hydrophobic and hydrophilic cover glass were contaminated with a single droplet. The droplet on the surface caused image distortion, acting like a blur filter [35]. This distortion occurred on both types of cover glass. Specifically, for the same droplet volume, the droplet affected a larger area on the hydrophilic surface than on the hydrophobic surface, as illustrated in Figure 4b,c. Additionally, the droplet altered the color of certain parts in the image to yellow due to halogen lights that were used. These image distortions and color variations result from the droplets scattering and refracting light similarly to a lens [38].
Figure 4d shows the measured MTF50loss when the cover glass was contaminated with a single droplet. The MTF50loss is the difference between the MTF50clean and the MTF50contamination, as mentioned in Section 2.1. MTF50loss occurred on both hydrophobic and hydrophilic surfaces. Especially, the MTF50loss was larger on the hydrophilic surface compared to the hydrophobic surface. This indicates that droplets spreading widely on the hydrophilic surface have a greater negative impact on image sharpness. Furthermore, we observed that the MTF50loss tended to increase as the droplet volume increased.

2.4. Image Quality Degradation Effects of Multiple Droplet Contamination

In Section 2.3, we observed that image quality degrades in proportion to the volume of a single droplet. The volume of multiple droplets depends on the spray amount, so it is necessary to define a contamination level for quantitative evaluation. In this section, we define contamination levels as slight, moderate, and severe based on spray volume. At each level, the contaminated area was measured. Then, we quantitatively measured and comparatively analyzed the degradation of image quality for each contamination level.
Figure 5a shows the experimental setup for measuring the contamination area. To precisely measure the area covered by droplets on the cover glass surface, the light source (FOK-100W, Fiber Optic Korea, Cheonan-City, Korea) and the light barrier were aligned as shown in Figure 5a. The droplet boundaries were clearly visible as black. The light barrier had a diameter of 30 mm and was positioned 100 mm away from the glass. The cover glass was maintained vertically to the ground, and droplets were sprayed using the spray module 15 cm in front of the glass. The glass surfaces were photographed with a complementary metal oxide semiconductor (CMOS) color camera (EO-1312C, Edmund Optics, Barrington, NJ, USA).
Figure 5b,c show droplets sprayed on hydrophobic and hydrophilic cover glass surfaces, respectively. Spray volumes of 0.1, 0.5, and 1.0 mL were set for different contamination levels, and multiple droplets were generated with a spray of 0.05 mL per shot. As the spray volume increased, droplets merged and formed larger droplets. When the same amount of liquid was sprayed, droplets were more easily attached and had a larger size on the hydrophilic surface compared to the hydrophobic surface. When the spray volume exceeded 1.25 mL, the merged droplets generally slid along the surface due to gravity, removing other droplets. The droplets on the hydrophobic surface maintained circular contact areas, as shown in Figure 5b1–b3, while droplets on the hydrophilic surface had irregular contact areas, as shown in Figure 5c1–c3.
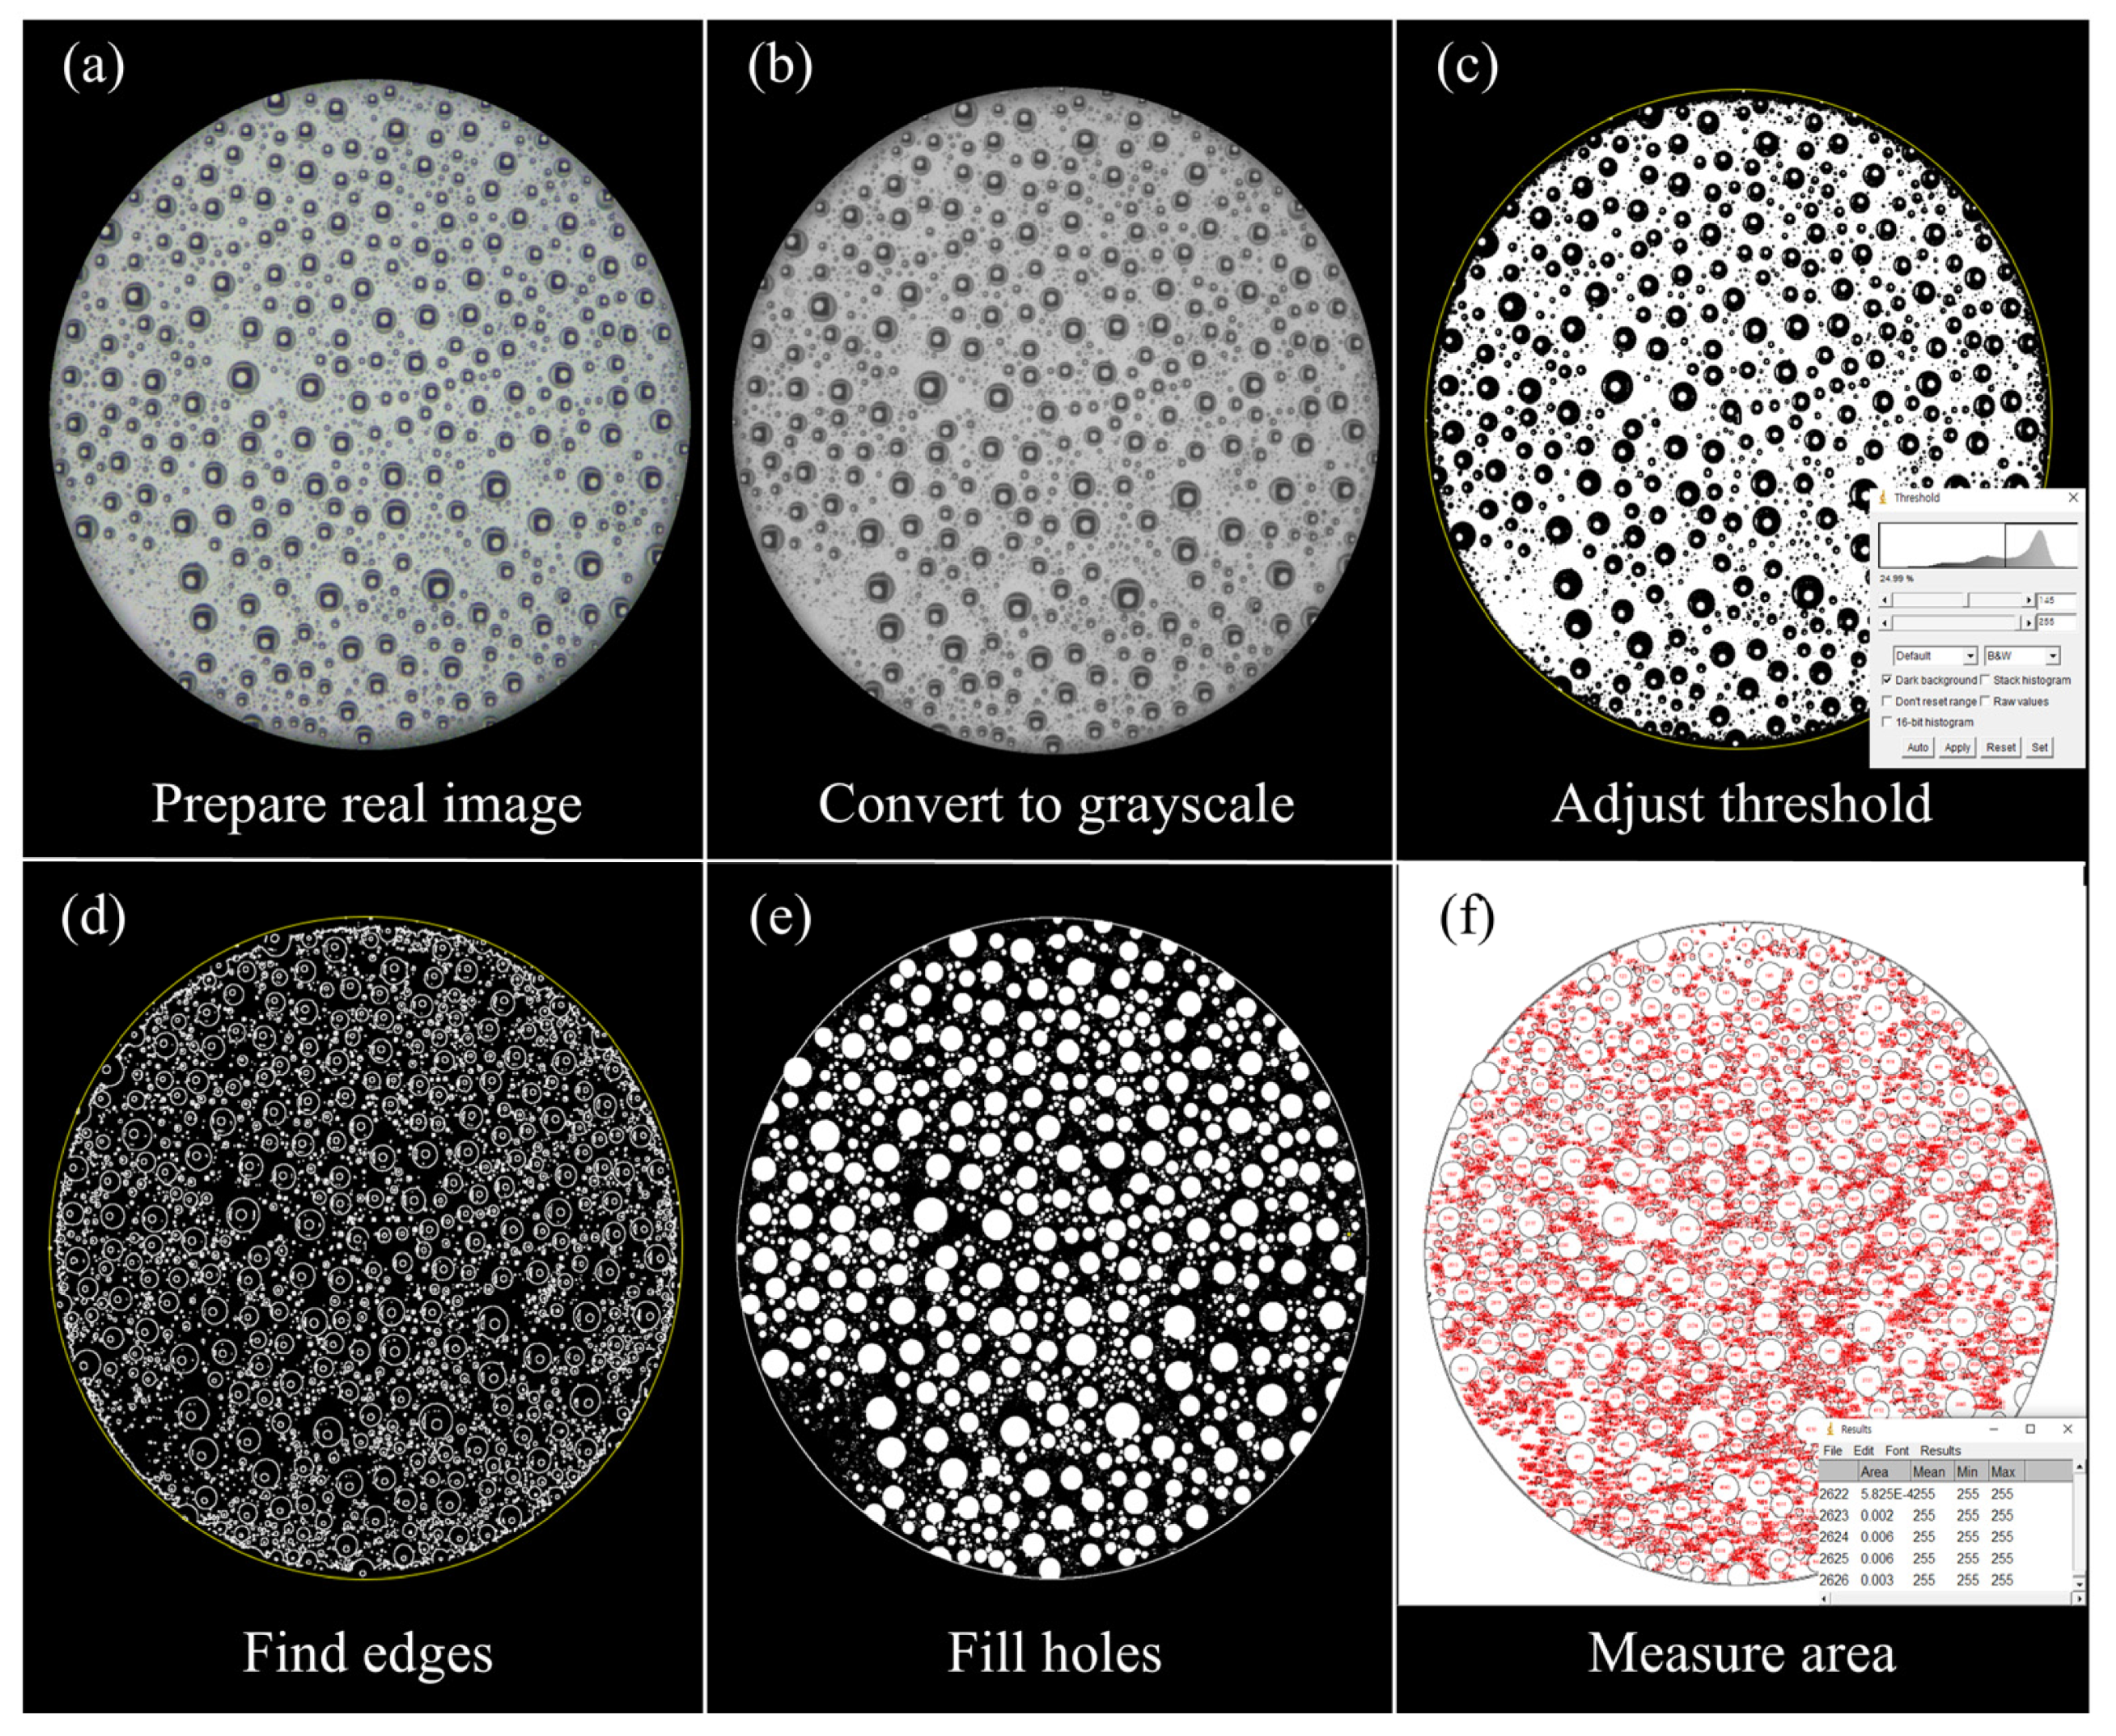
To quantitatively evaluate the image quality under multiple droplet contamination, contamination levels should be defined with an objective metric. We analyzed the contaminated area for each contamination level using the ImageJ 1.54 program (National Institutes of Health). A method for measuring the percentage of contamination area is shown in Figure 6. The definition of contamination area is provided in Equation (2). Atotal represents the ROI with a diameter of 30 mm on the glass, and Adroplet refers to the area occupied by droplets within the Atotal. A higher contamination area indicates that droplets are covering a larger area of the glass surface.
C o n t a m i n a t i o n   a r e a = A d r o p l e t A t o t a l × 100   ( % )
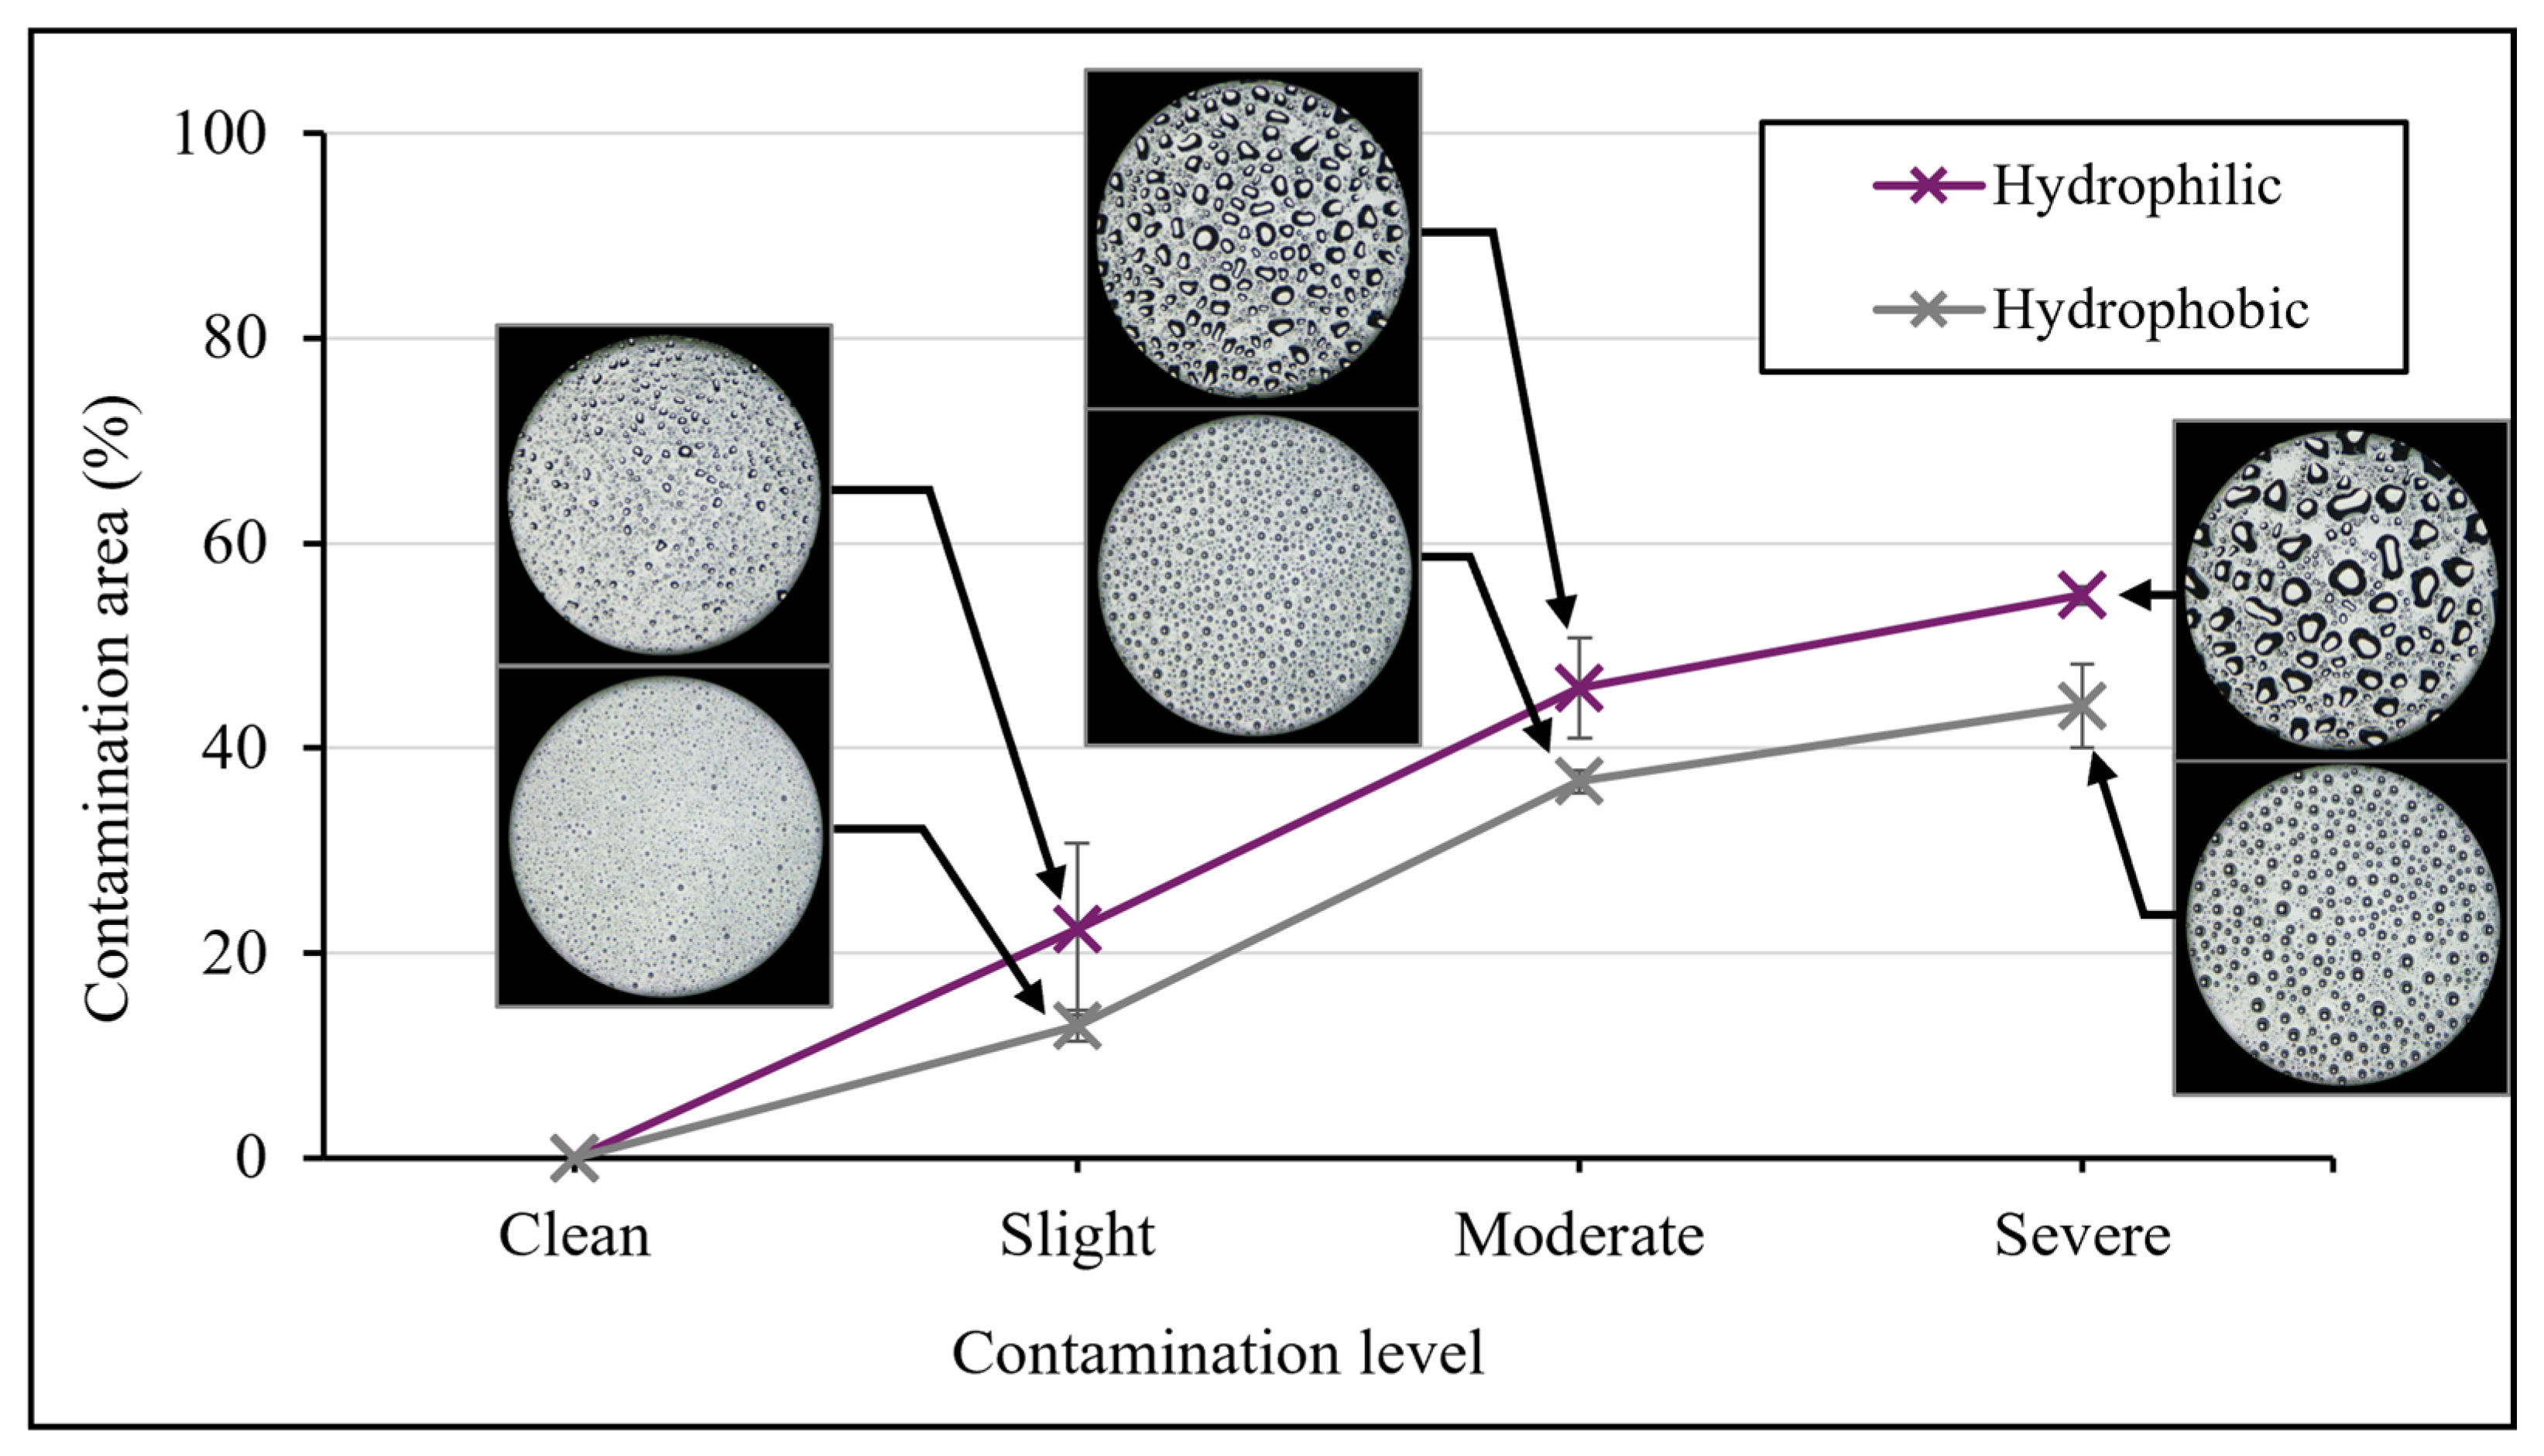
Figure 7 and Table 1 show the results of the contamination area measurement. The contamination area was calculated by taking five repeated measurements and averaging the results. As the contamination level becomes more serious from clean to severe, the contaminated area continuously expanded, reaching 44.12% at the hydrophobic surface and 54.90% at the hydrophilic surface. A larger area was contaminated on the hydrophilic surface compared to the hydrophobic surface at the same contamination level.
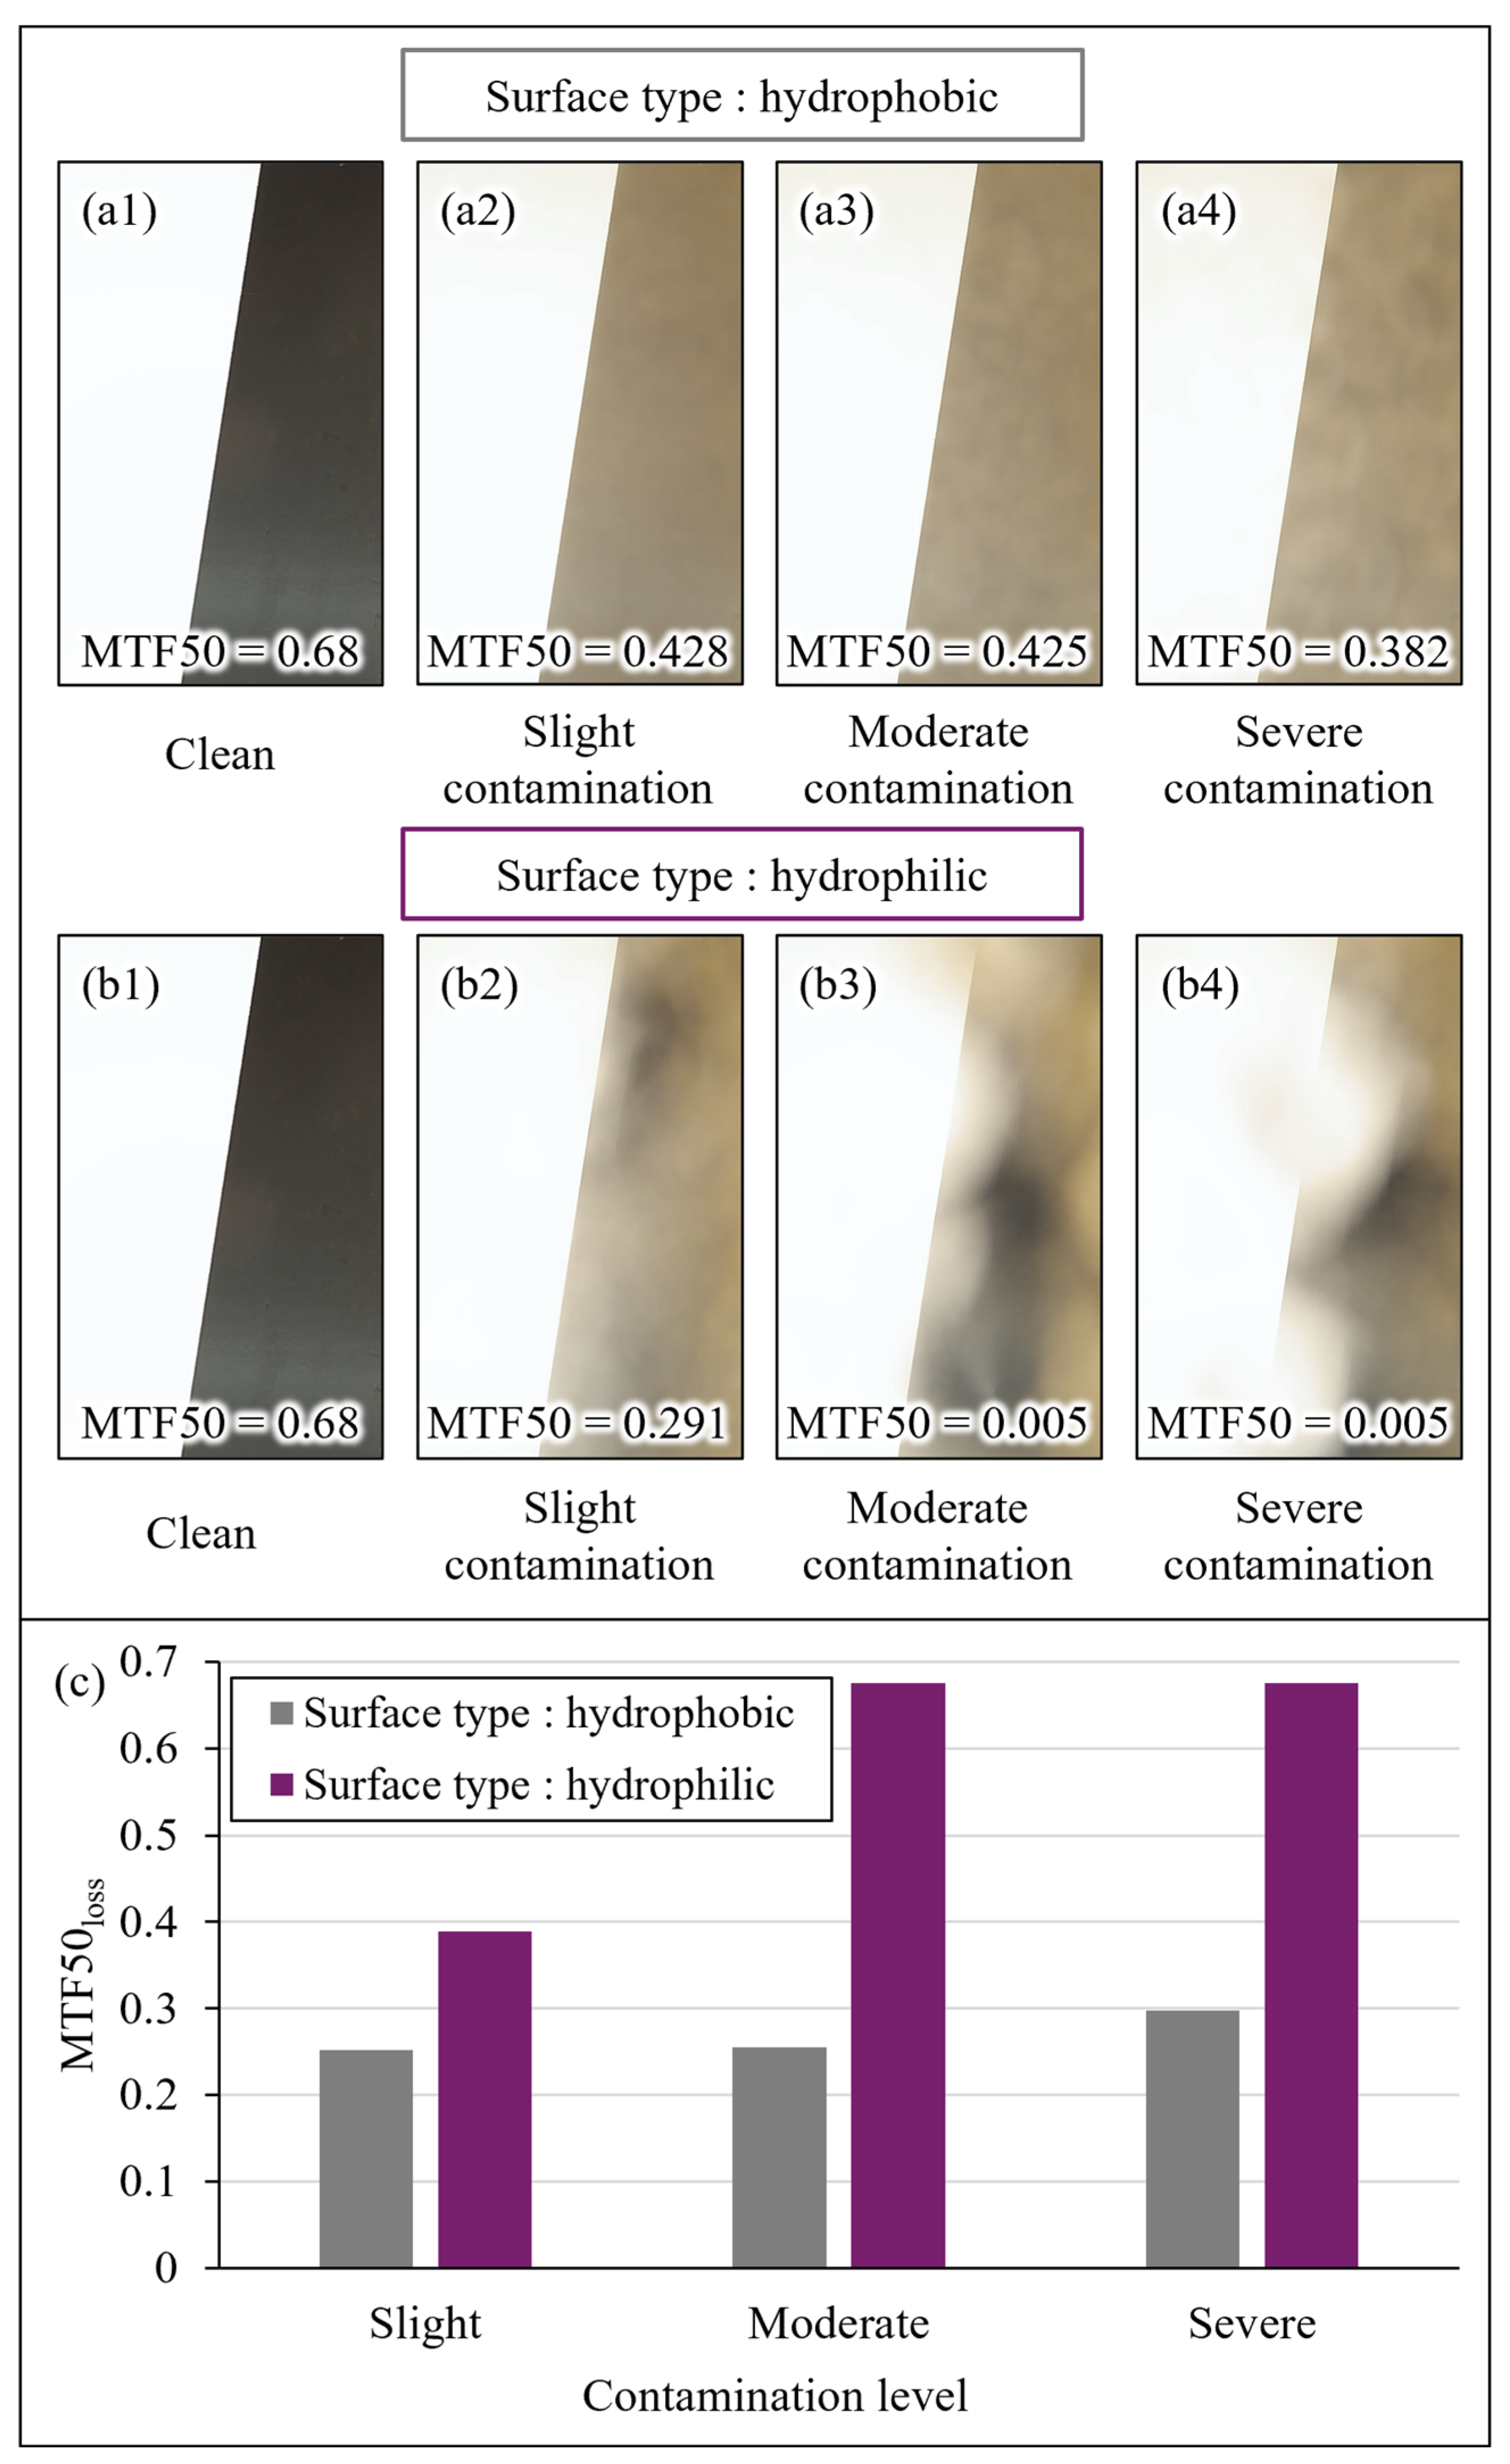
Figure 8a,b show images of the slanted-edge target captured when cover glasses were contaminated. The multiple droplets on the cover glass caused a complex refraction and scattering of light, which blurred and changed the color of the image. At high levels of contamination, particularly on hydrophilic cover glasses under severe contamination conditions, the boundaries of the black-and-white contrast pattern collapsed, making it unrecognizable, as shown in Figure 8(b4). Using these images, the results of calculated image degradation are shown in Figure 8c. The MTF50loss increased as the contamination level approached severe contamination. Especially, the MTF50 approached almost zero at moderate and severe contamination on the hydrophilic surface. These results show that large contamination areas cause significant image quality degradation. Furthermore, the degradation is greater on the hydrophilic surface than on the hydrophobic surface.

3. Object Detection Performance Evaluation Results

In Section 2, we observed that the image quality captured by the camera sensor is degraded due to droplet contamination. Since image quality degradation can negatively impact the performance of AI algorithms [39], in this section, we analyze the relationship between camera lens surface contamination and the performance of AI algorithms. We evaluate performance degradation using object detection algorithms, which are the widely used AI algorithms.

3.1. Object Detection Performance Evaluation Metrics

To analyze the effect of droplet contamination on object detection performance, we utilized mean average precision (mAP) as an evaluation metric. The mAP is a widely used performance metric in computer vision fields such as object detection and image segmentation [40]. By utilizing mAP, we can estimate the overall performance of algorithms in detecting and classifying the locations and types of objects. Specifically, the mAP is an essential evaluation metric in applications like autonomous driving, video surveillance systems, and medical image analysis, where accurate object detection is critical. The mAP is calculated as the area under the precision–recall curve for all object classes, allowing us to evaluate the model’s performance across various threshold settings [41,42]. Precision is a metric used to evaluate the ability of a model to correctly predict positive instances, while recall evaluates the ability of the model to correctly identify all True Positive cases in a dataset. The precision and recall are calculated using Equations (3) and (4), respectively, while AP and mAP are calculated using Equations (5) and (6), where k is the number of the class. The concepts of True Positive (TP), False Positive (FP), False Negative (FN), and True Negative (TN), which are used in the calculation of precision and recall, are detailed in Table 2.
P = T r u e   P o s i t i v e T r u e   P o s i t i v e + F a l s e   P o s i t i v e
R = T r u e   P o s i t i v e T r u e   P o s i t i v e + F a l s e   N e g a t i v e
A P = 0 1 P R d R
m A P = 1 k i = 1 k A P i
The intersection over union (IOU), utilized to evaluate object detection performance by comparing the ground truth bounding box to the predicted bounding box, was set at 0.5. To verify the degradation of object detection performance, we used mAPloss, as shown in Equation (7). A larger mAPloss indicates that the performance of the object detection algorithm is significantly degraded due to droplet contamination.
m A P l o s s = m A P c l e a n m A P c o n t a m i n a t i o n

3.2. Object Detection Performance Measurement Setup and Method

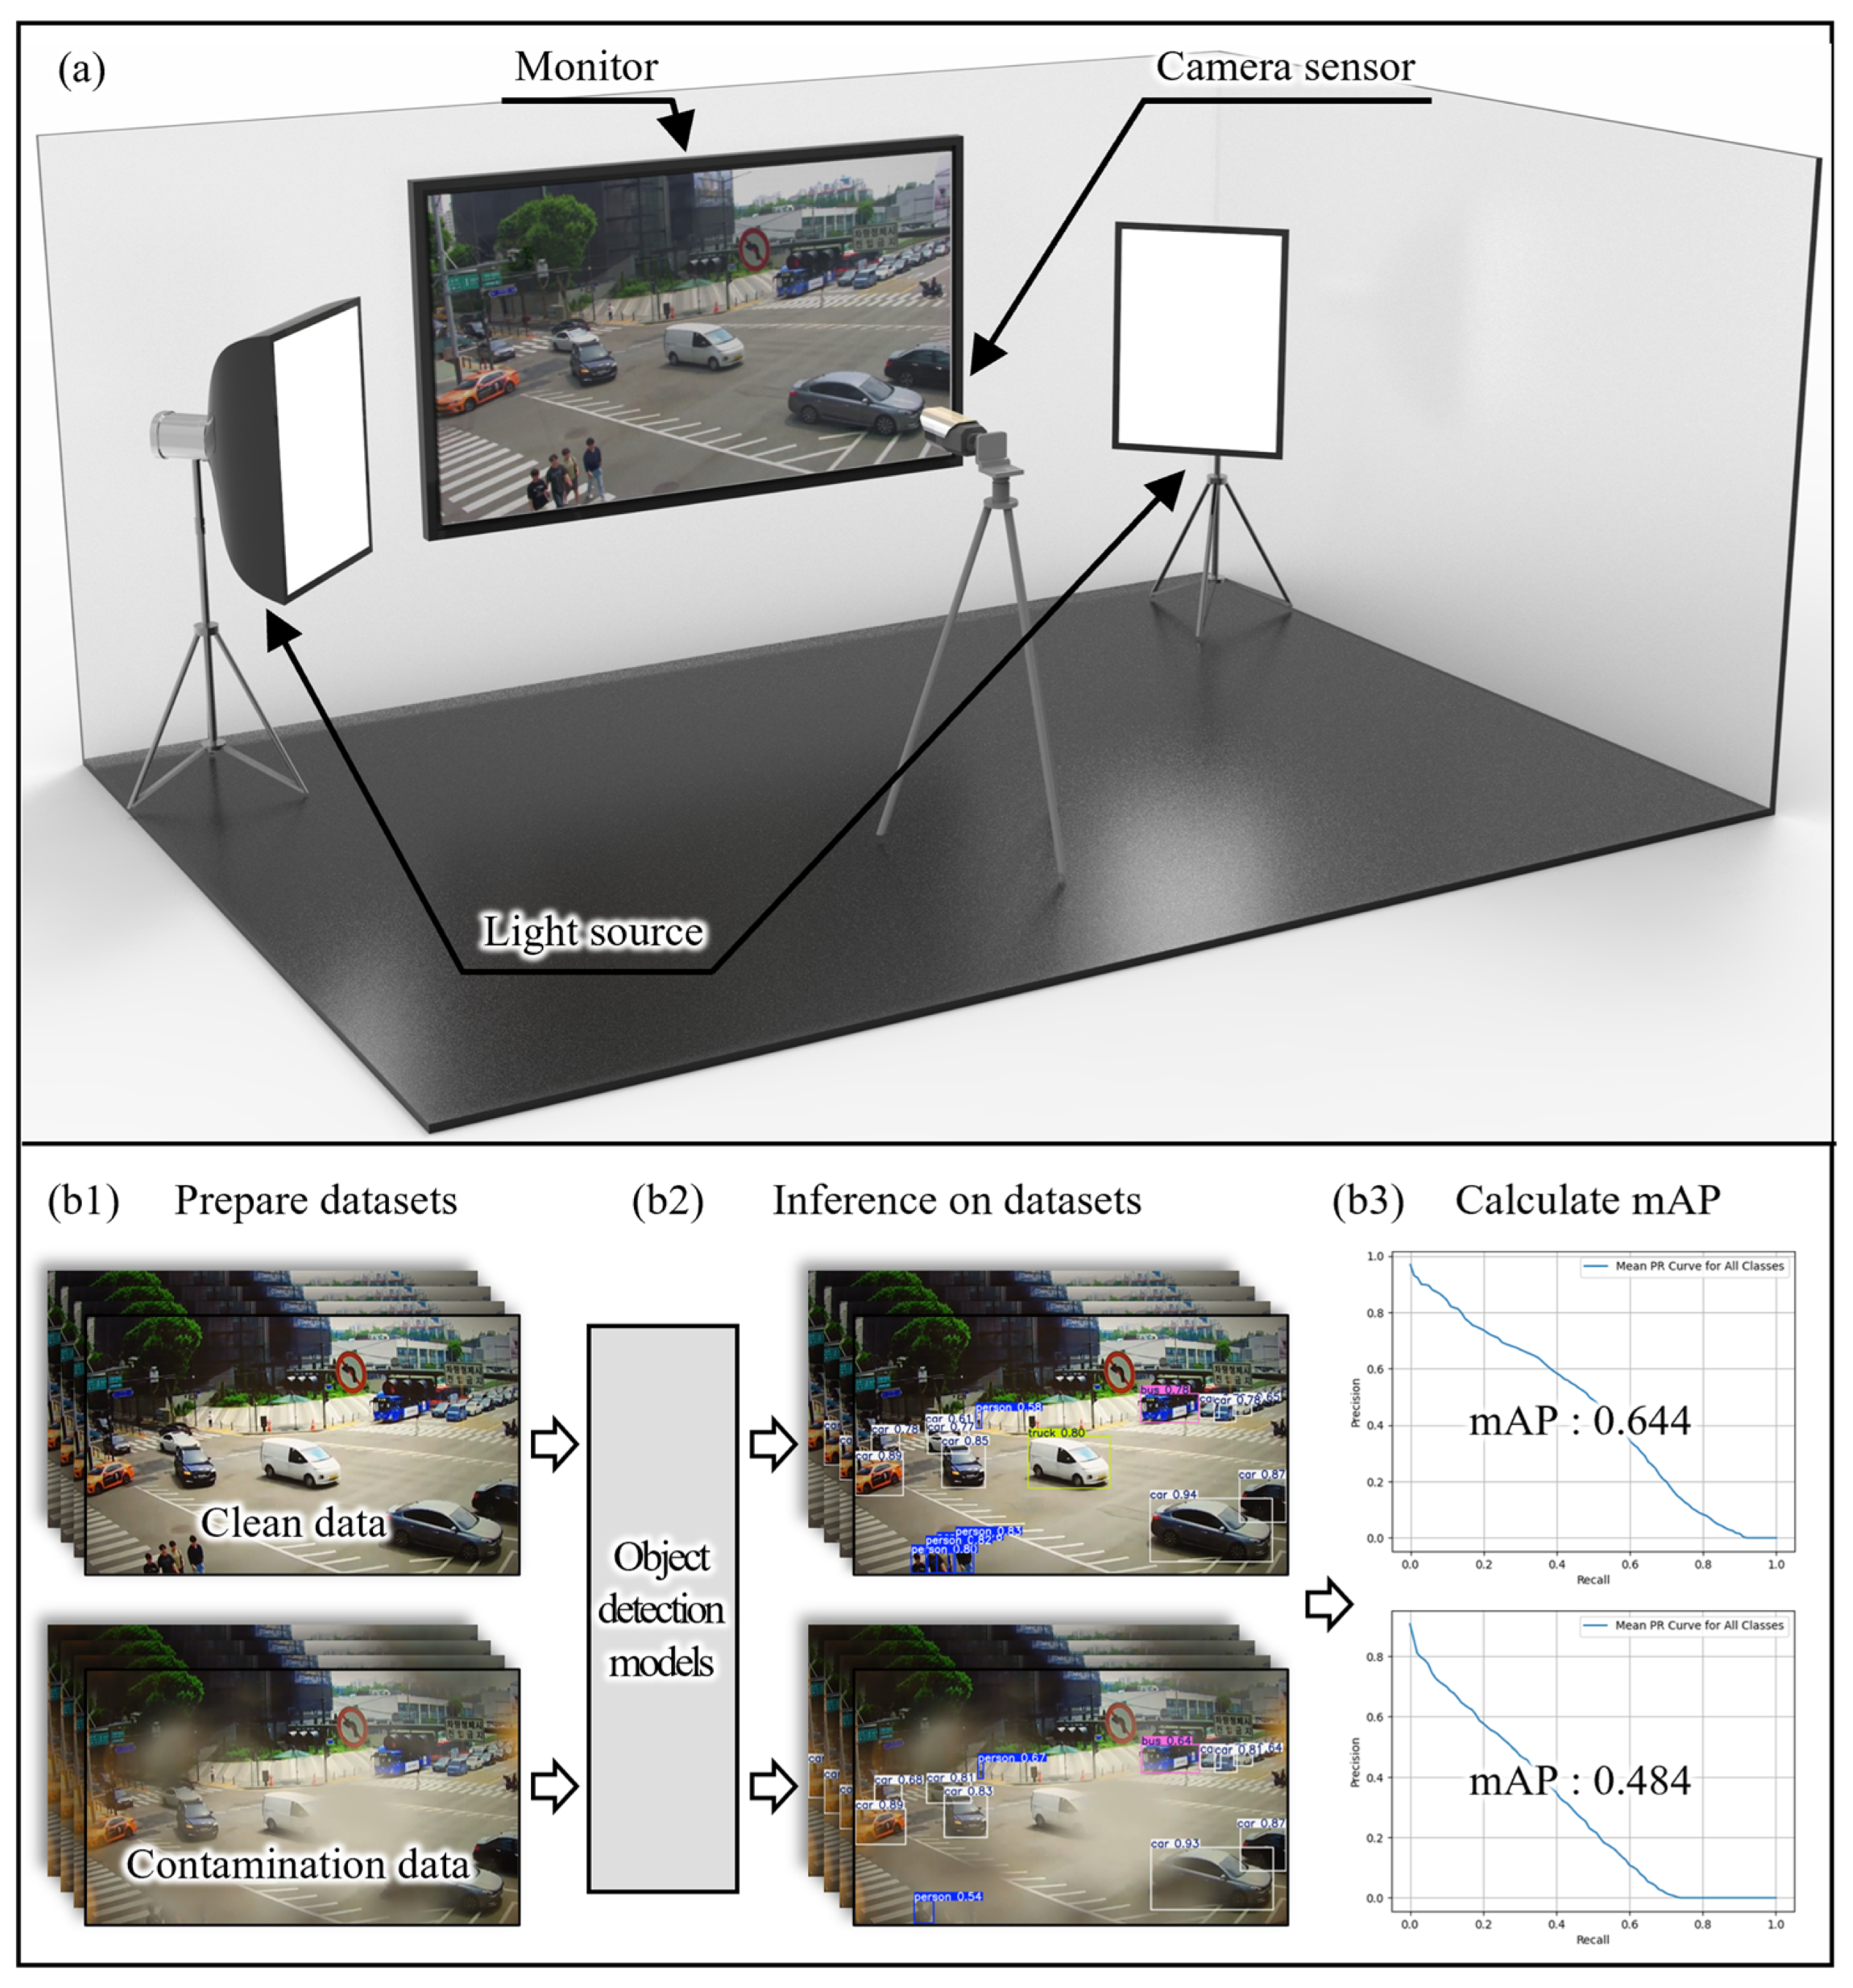
To evaluate the impact of camera sensor contamination on object detection performance using AI algorithms under various external conditions, a simulated environment was constructed as shown in Figure 9a. A UHD 3840 × 2160 resolution monitor (86UM8070PUA, LG Electronics, Seoul, Republic of Korea) was used to display images of diverse environments such as roads, people, and vehicles, representing different vision scenarios where camera systems are utilized. The camera was positioned 100 cm away from the monitor. To replicate backlighting conditions often encountered outdoors, such as car headlights and streetlights, two halogen lamps were placed on either side of the camera sensor. In outdoor environments, lighting conditions exhibit high complexity and variability due to differences in the types, locations, and intensities of light sources. In particular, dynamic light sources such as vehicle headlights and taillights undergo continuous changes in position and brightness, altering the direction and intensity of light on droplets on the lens surface. These variations can influence the optical properties of reflection, transmission, and refraction, potentially leading to fluctuations in object detection performance. In this study, we used two fixed light sources to ensure consistency of the experiments and minimize the impact of lighting variables. The captured images were stored on the PC (HPE ProLiant DL380 Gen11, Hewlett Packard Enterprise) and utilized to evaluate the performance of the object detection algorithm.
Figure 9b illustrates the object detection performance evaluation process. First, the prepared images were displayed on the monitor. The monitor was photographed by the camera sensor with the lens cover glass both clean and contaminated by droplets. The droplet contamination method used was the same as described in Section 3. Next, object type and location information were labeled on the images using DarkLabel 2.4 software, with the labeled files serving as the ground truth. Finally, performance was assessed by comparing the labeled files to the captured images.
To thoroughly evaluate object detection performance, it is important to use algorithms with different architectures. We evaluated the performance using YOLOv8 and RTMDet [43], which are CNN-based one-stage methods that simultaneously predict object locations and classifications. Additionally, we used DetectoRS [44], a two-stage method that performs classification after predicting object locations, and DINO [45], a transformer-based method that analyzes global image information. All object detection models, each based on different algorithms, were trained on the COCO dataset to ensure consistency in training data and reduce variability.

3.3. Object Detection Performance Degradation Effects of Single Droplet and Object Size

Generally, images contain objects of various sizes, depending on the size of the object and the distance between the object and the camera. When evaluating the performance of the object detection algorithms, it is important to analyze the relationship between the size of the object in the image and the size of the contaminant. In this section, we analyze the effect of object size and single droplet volume on the performance of object detection algorithms.
The images displayed on the monitor for evaluation were constructed by taking pictures of objects at different distances between the camera and the object from 5 m to 50 m in an outdoor environment. Each image included five individuals, and the object sizes, which varied depending on the distance, were categorized as XL, L, M, S, and XS. After applying droplets of various volumes to the cover glass, the evaluation dataset was generated by capturing images containing objects of different sizes. Table 3 presents the object sizes and the corresponding number of images in the evaluation dataset.
Figure 10 shows the evaluation datasets and performance evaluation results (mAP) when two types of cover glass were contaminated by a single droplet. The evaluation dataset contains the person class only, and the YOLOv8x model was utilized as the object detection model. The YOLO is one of the most well-known algorithms in object detection, especially the YOLOv8 algorithm released in 2023, which is known for its high accuracy. The single droplets on both types of surfaces hindered object identification, and the droplet over 3 µL on hydrophilic surfaces completely obscured objects.
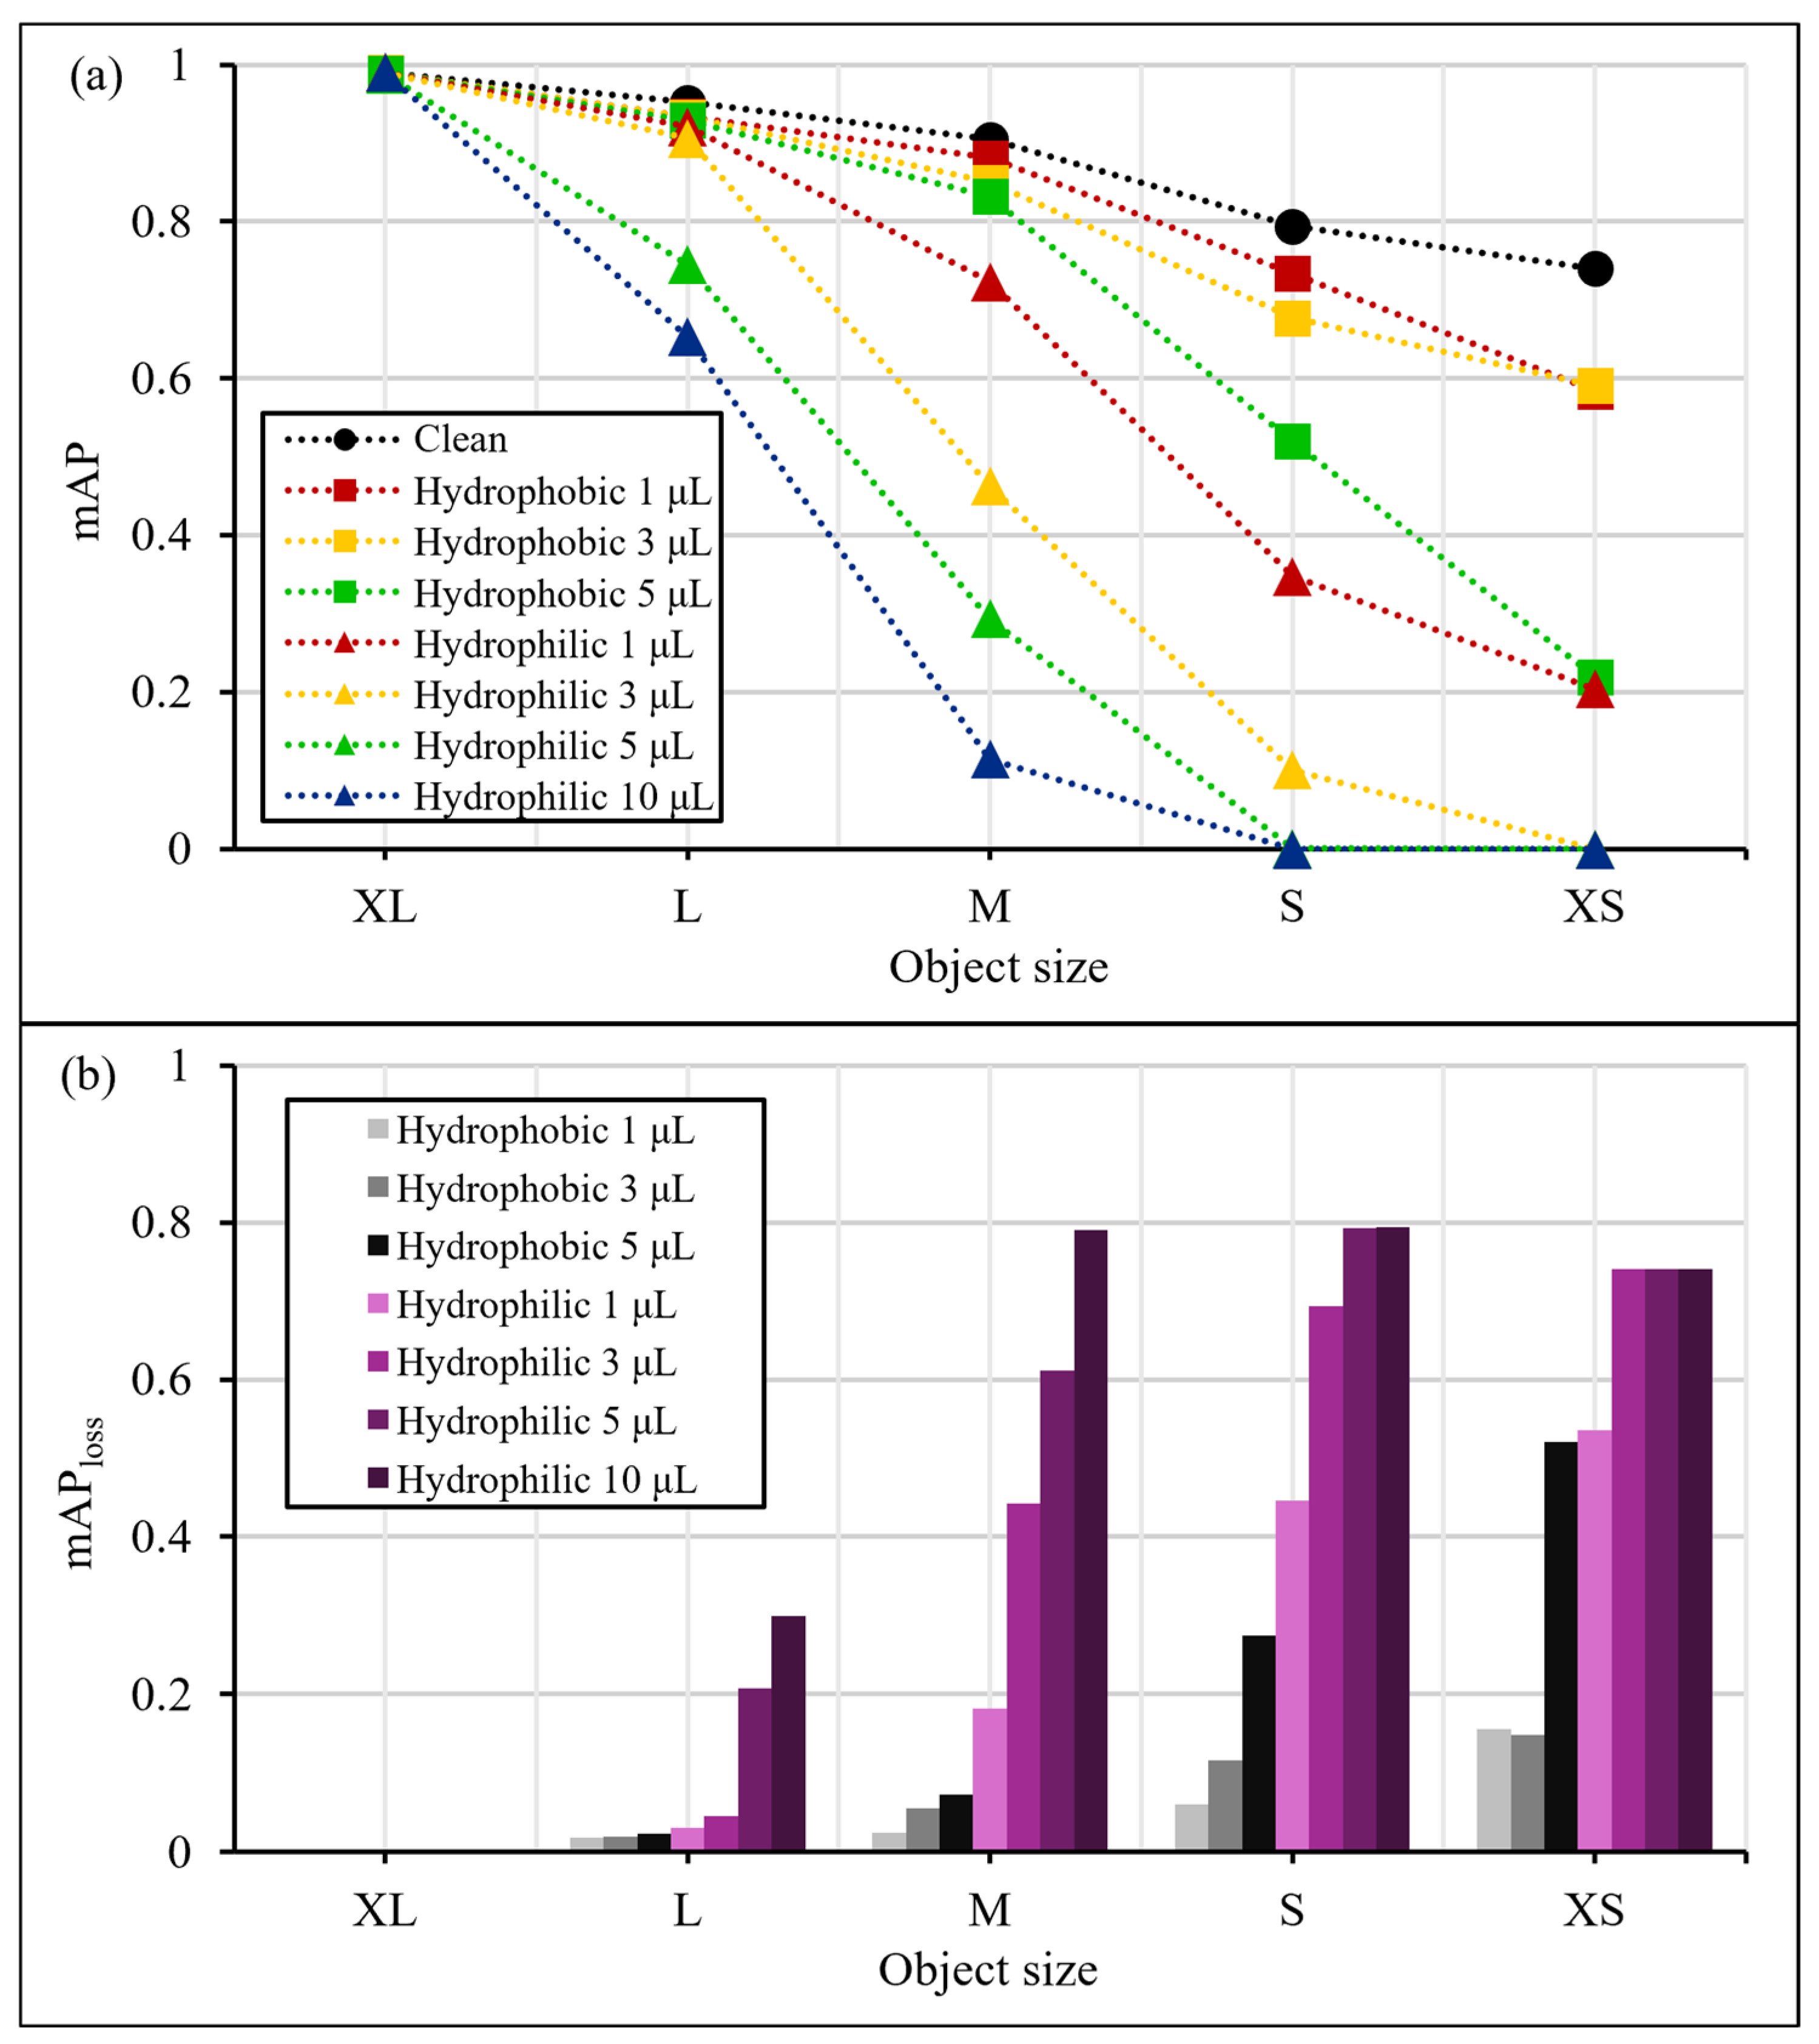
Figure 11a shows the mAP of the YOLOv8 for the person class. When the cover glass was clean, the mAP was 0.989 for XL-size objects and 0.74 for XS-size objects. However, when the glass surface was contaminated by a single droplet, the mAP decreased on both hydrophilic and hydrophobic surfaces. The mAPloss calculated based on Equation (7) is shown in Figure 11b. For the same object size, the mAP decreased significantly as the droplet volume increased. Notably, on hydrophilic surfaces, droplets larger than 3 μL reduced the mAP to 0. Furthermore, the degradation in mAP was more pronounced for smaller object sizes, such as S and XS, compared to larger sizes like XL or L. These findings highlight that smaller objects are more heavily impacted by droplet contamination, which can lead to critical errors in systems that rely on detecting small objects.

3.4. Object Detection Performance Degradation Effects of Multiple Droplet Contamination

In this section, we quantitatively evaluate the effects of multiple droplet contamination on object detection performance. To increase the reliability of the evaluation, we collected 600 images based on car driving data provided by the Korea Automotive Parts Research Institute’s Civilian Technology Research Center (now known as the Korea Automotive Technology Institute) and CCTV data provided by the Korean National Police Agency. The object detection performance was analyzed for seven object classes (person, car, truck, bus, bicycle, motorcycle, and traffic light) that appeared most frequently in the images.
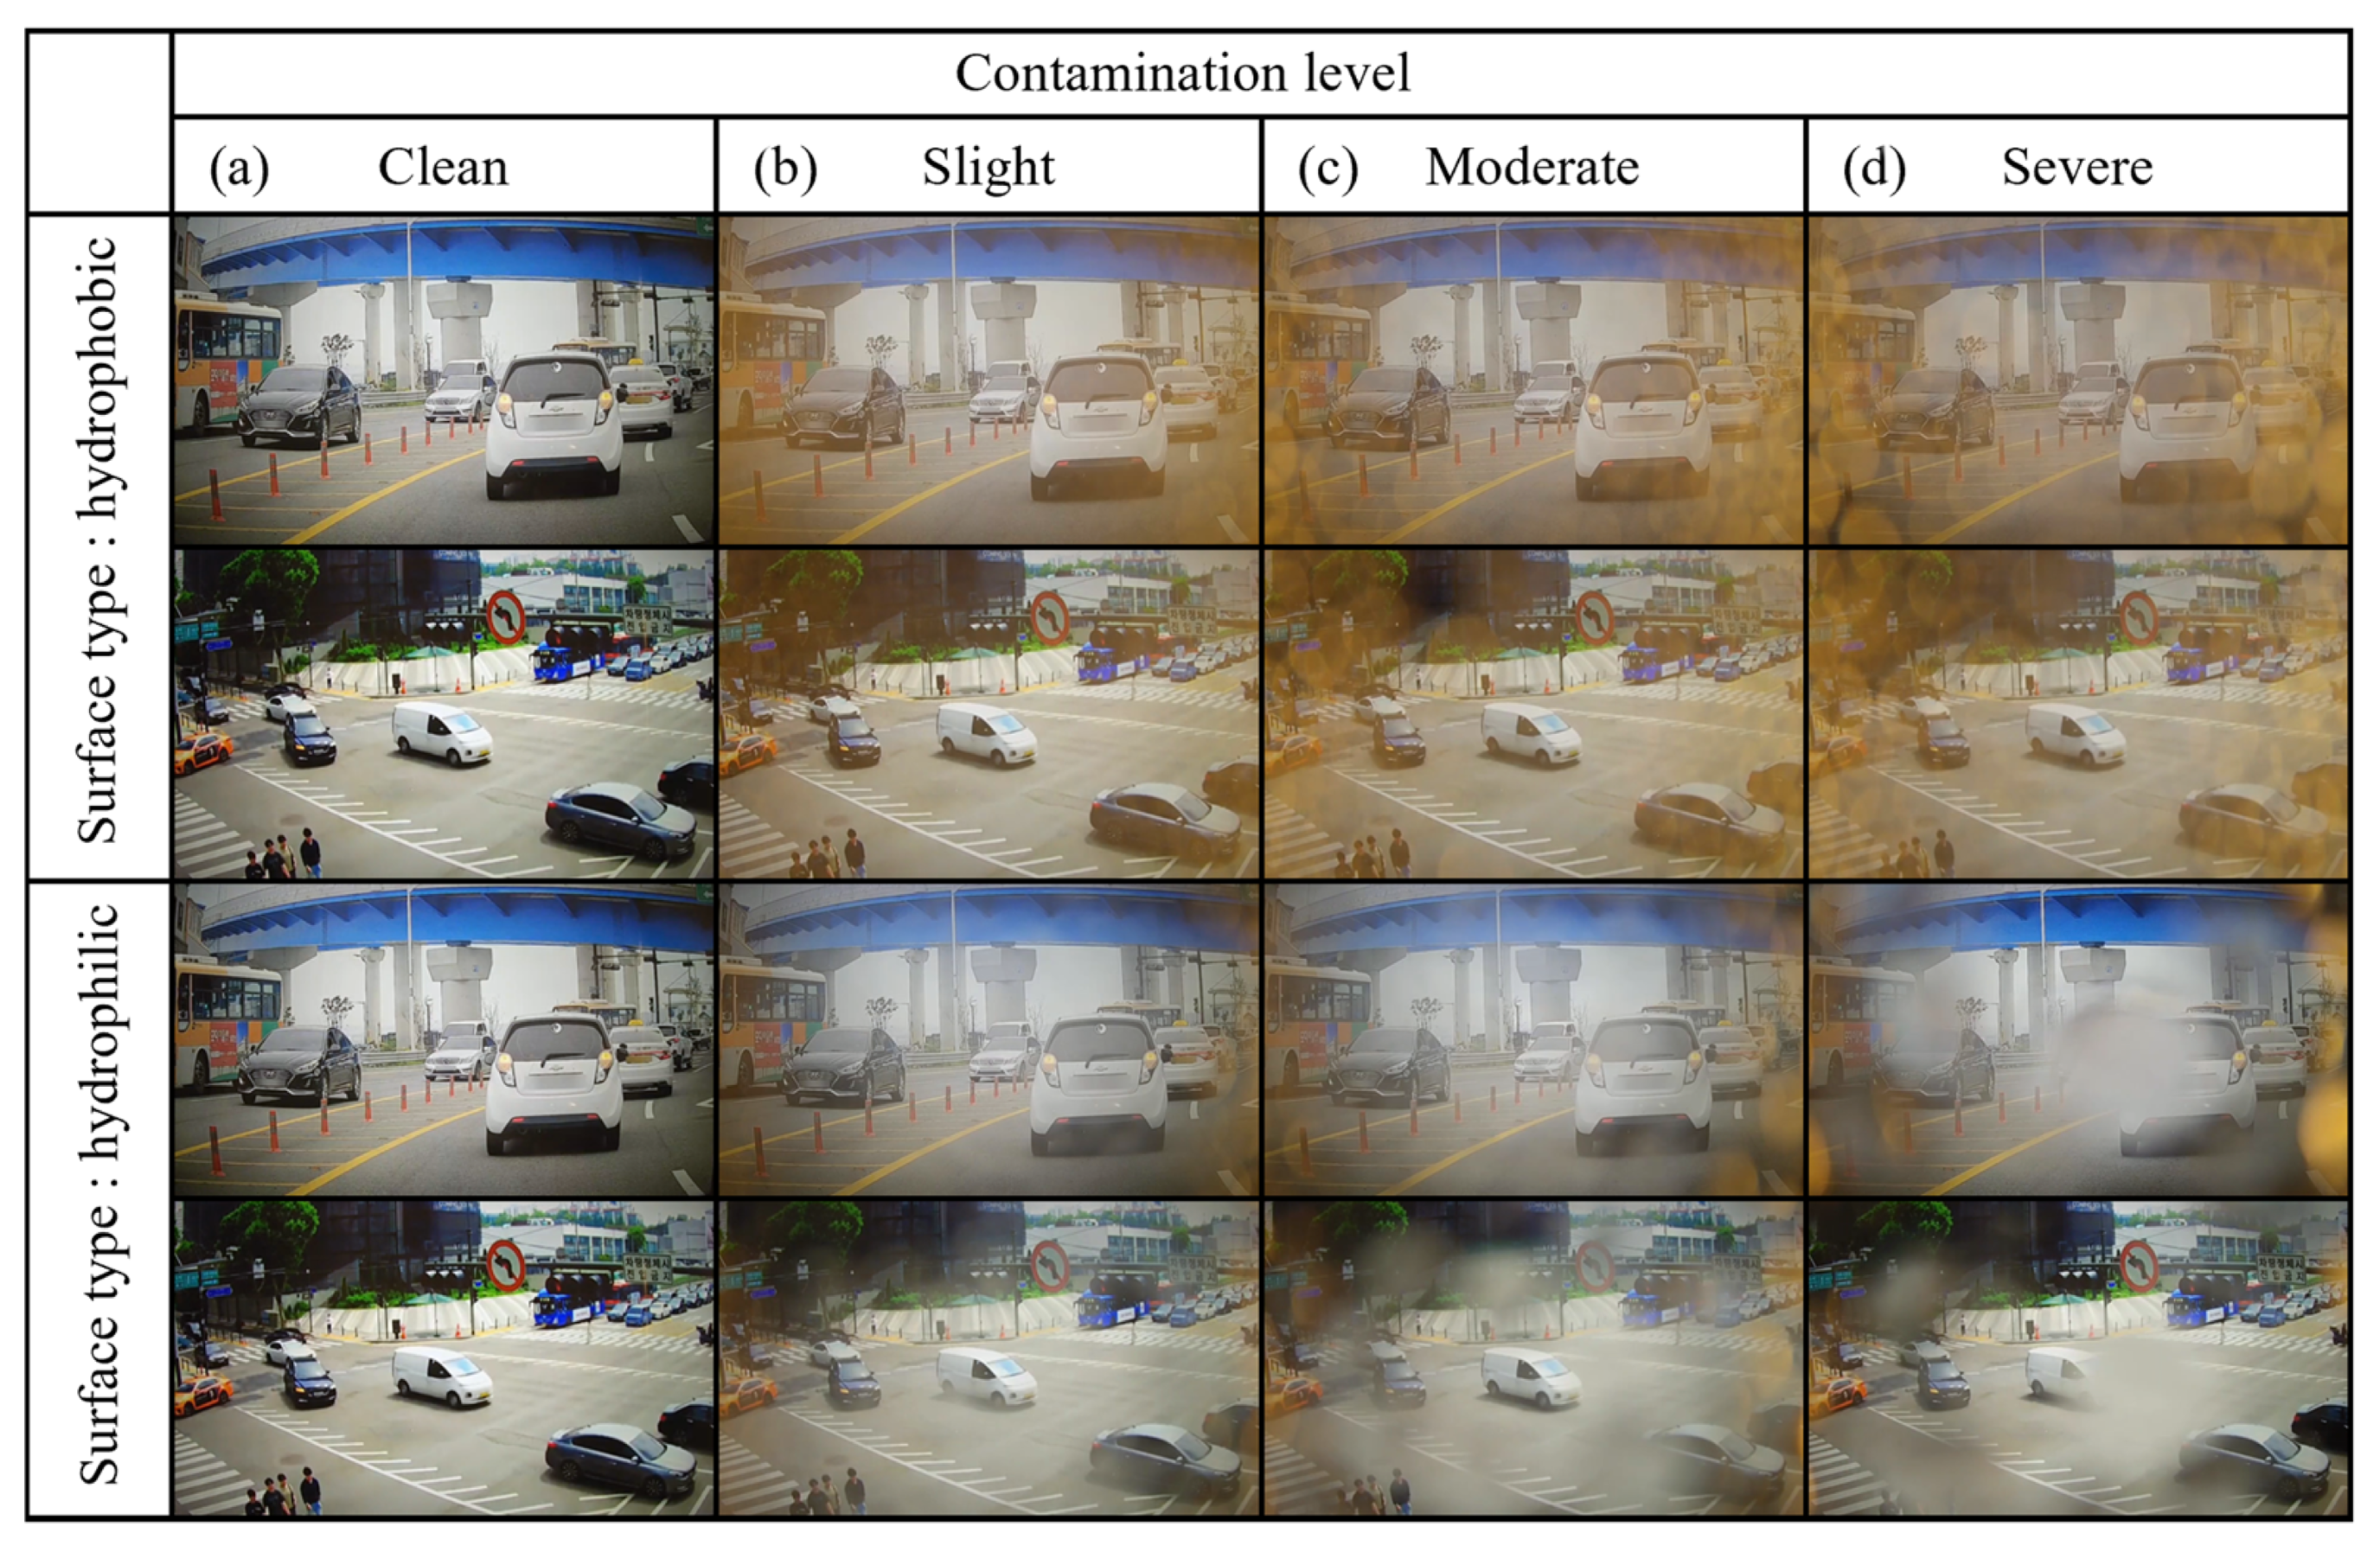
The multiple droplet contamination method and level are the same as in Section 2. Figure 12 shows images from the evaluation dataset captured when the camera sensor was contaminated by multiple droplets. On the hydrophobic surface, the droplets caused light refraction and scattering, altering the overall color of the image. In contrast, on the hydrophilic surface, the sprayed droplets resulted in localized blurring in parts of the image.
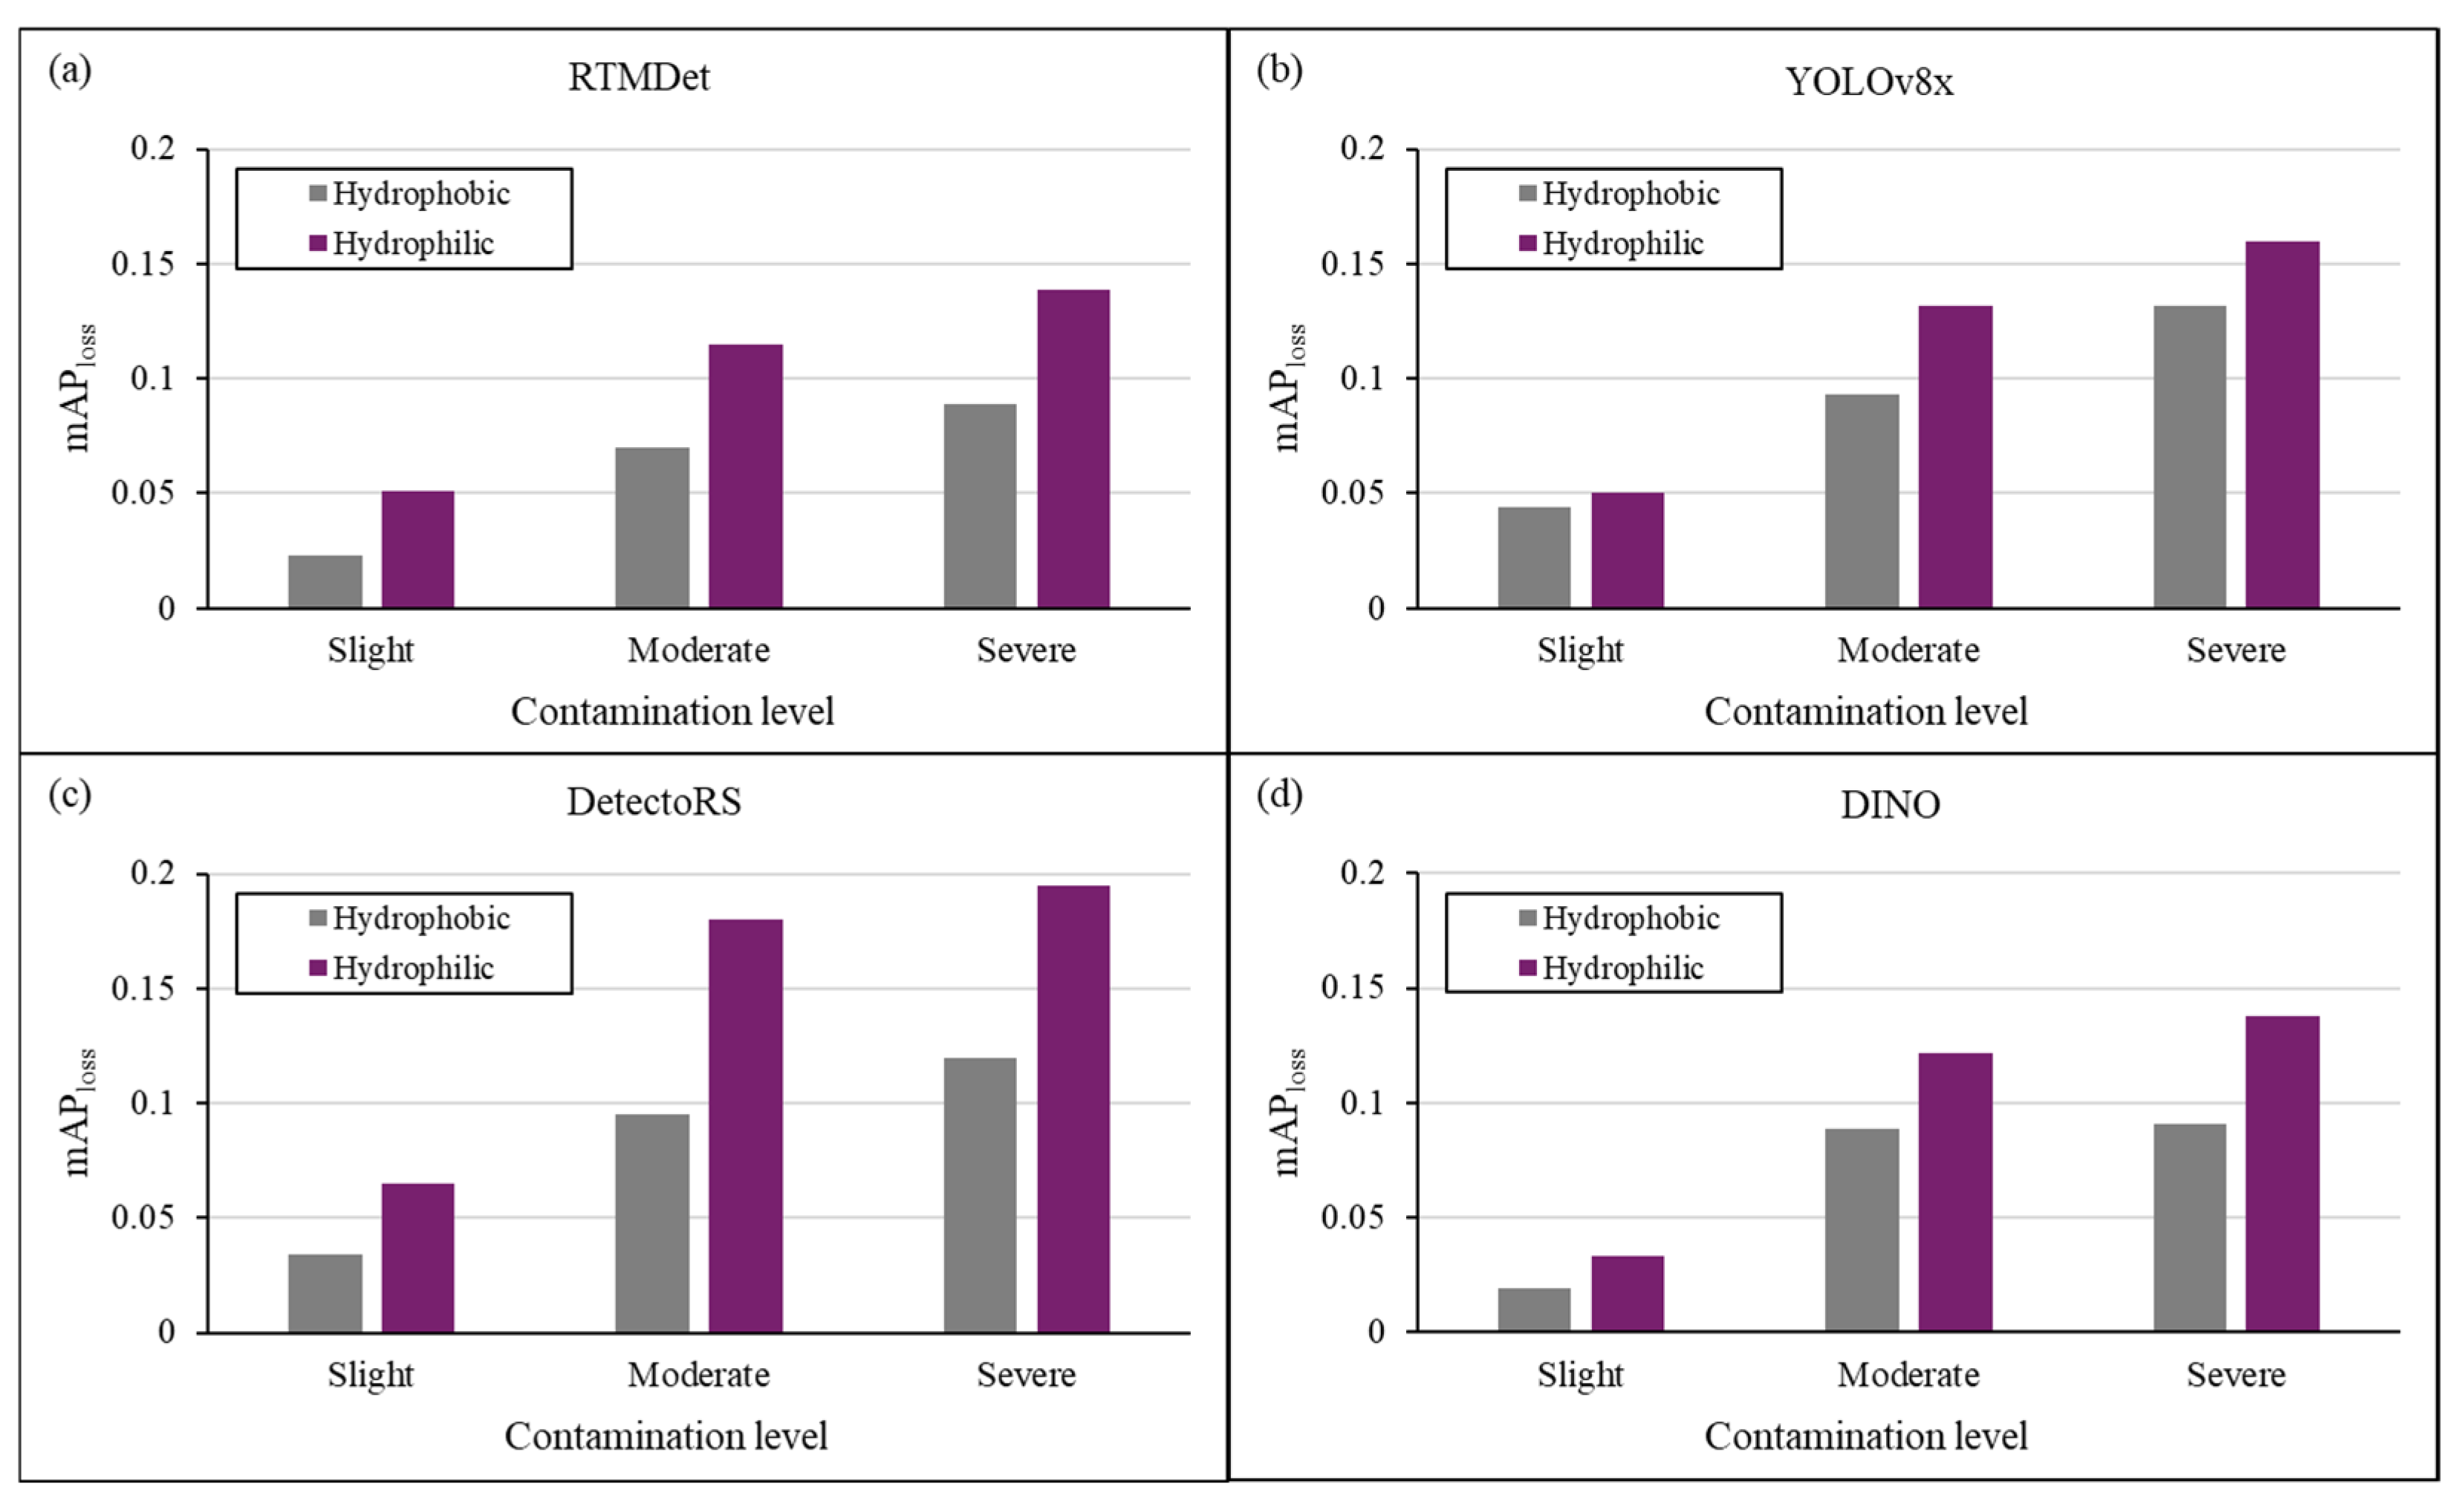
Figure 13 shows the evaluation results of object detection performance using the four algorithms (RTMDet, YOLOv8x, DetectoRS, and DINO). The performance degradation due to droplet contamination is represented by the mAPloss calculated by Equation (7). All algorithms showed a decrease in the mAP due to multiple droplet contamination, with the most significant degradation observed under severe contamination. Comparing surface properties, the mAP reduction was more pronounced on the hydrophilic surface than on the hydrophobic surface. These results demonstrate that droplet contamination degrades the performance of object detection algorithms, with the impact varying based on the wettability of the camera lens surface.

4. Discussion and Conclusions

This study analyzed the impact of droplet contamination on camera sensor surfaces in terms of both image quality and object detection performance. Image quality degradation caused by droplet contamination was measured using the MTF metric. The results showed that image quality, including sharpness and contrast, deteriorated as droplet volume increased. Specifically, as the droplet volume increased from 1 μL to 10 μL, the MTF50 tended to decrease by approximately 10% to 80%. On hydrophobic surfaces, MTF50loss was relatively small, reaching up to 20%. In contrast, on the hydrophilic surfaces, the MTF50loss was significantly higher, averaging over 60%.
Contaminants on camera lens surfaces degrade captured image quality, making it essential to maintain high image clarity in environments that heavily depend on visual data for decision making, such as intelligent surveillance and autonomous driving systems.
To evaluate the effect on object detection performance, we performed a performance degradation analysis using various object detection algorithms such as YOLOv8, DetectoRS, RTMDet, and DINO. The evaluation utilized the mAP metric to determine the impact of droplet contamination. As contamination increased, detection accuracy dropped significantly across these models. While XL-sized objects remained relatively unaffected, smaller objects (such as XS and S) experienced a dramatic decrease in the mAP, particularly when droplet volume exceeded 3 μL. For instance, the mAP for XS-sized objects dropped from 0.74 to 0.12 under significant contamination, which implies a severe reduction in detection reliability.
A comparative evaluation of hydrophobic and hydrophilic surfaces further illustrated the importance of surface properties in mitigating image quality degradation. On hydrophobic surfaces, the droplets tended to maintain a higher contact angle, which helped in preserving visual information by reducing the spread of droplets. On the hydrophilic surface, droplets spread more widely, and mAPloss reaches up to 90%, whereas, on the hydrophobic surface, mAPloss is less than 60%. However, it should also be noted that hydrophobic coatings are not a complete solution. Droplets on hydrophobic surfaces can still scatter light, altering image color properties and complicating automated visual processing.
In conclusion, this study experimentally evaluated and analyzed the impact of camera lens surface contamination on image quality and object detection performance using quantitative metrics such as the MTF and mAP. Unlike traditional simulation-based approaches, this research assessed the effects of contamination by applying real-world contaminants to a camera lens and analyzing the resulting image data, providing more reliable and practical results.
Furthermore, the evaluation results and methodologies proposed in this study lay a foundation for advancements in lens cleaning technologies for vision-based systems. By quantifying the extent to which contamination affects image quality and object detection performance, this research can help determine the optimal timing for activating sensor cleaning mechanisms and ensure the stable operation of camera systems.
However, this study focused primarily on droplet contamination and did not address other contaminants such as dust, insects, or mud. Unlike droplets, contaminants like dust and mud, which are opaque in nature, could cause a more severe obstruction when adhering to the camera sensor surface, potentially leading to a greater decline in object detection performance. Additionally, since our study found that performance degradation due to droplet contamination tended to be proportional to the contaminated area, a similar trend may be observed with opaque contaminants like dust and mud. Future research should evaluate performance degradation in real-world scenarios where multiple contaminants coexist. These findings will serve as a foundational study to improve sensor reliability in complex contamination situations and support the development of vision-based systems across various applications.

Author Contributions

Conceptualization, H.K., S.C. and D.K.; methodology, H.K., Y.Y., Y.K., K.P. and D.K.; software, H.K., Y.Y., D.-W.J. and D.C.; validation, H.K. and Y.Y.; formal analysis, H.K. and Y.K.; investigation, H.K.; resources, S.C.; data curation, H.K. and Y.Y.; writing—original draft preparation, H.K., Y.Y., Y.K. and D.K.; writing—review and editing, H.K., Y.Y., Y.K., D.-W.J., D.C., K.P., S.C. and D.K.; visualization, H.K.; supervision, D.-W.J., D.C., K.P., S.C. and D.K.; project administration, S.C. and D.K.; funding acquisition, S.C. All authors have read and agreed to the published version of the manuscript.

Funding

This research was supported by a grant (D2410003) from the Gyeonggi Technology Development Program funded by Gyeonggi Province.

Institutional Review Board Statement

Not applicable.

Informed Consent Statement

Not applicable.

Data Availability Statement

The original contributions presented in the study are included in the article, further inquiries can be directed to the corresponding author.

Conflicts of Interest

Authors Yoseph Yang and Daegeun Kim were employed by the company Microsystems. The remaining authors declare that the research was conducted in the absence of any commercial or financial relationships that could be construed as a potential conflict of interest.

Abbreviations

The following abbreviations are used in this manuscript:
ADASAdvanced driver assistance system
UAVsUnmanned aerial vehicle
MTFModulation transfer function
mAPmean average precision
AIArtificial intelligence
ROIRegion of Interest
CMOSComplementary metal oxide semiconductor
TPTrue Positive
FPFalse Positive
FNFalse Negative
TNTrue Negative
IOUIntersection over union
UHDUltra high definition
PCPersonal Computer
YOLOYou Only Look Once
CNNConvolution neural network
COCOsCommon Objects in Context
CCTVClosed-circuit television

References

  1. Fossum, E.R. Digital Camera System on a Chip. IEEE Micro 1998, 18, 8–15. [Google Scholar] [CrossRef]
  2. Mosqueron, R.; Dubois, J.; Paindavoine, M. High-Speed Smart Camera with High Resolution. Eurasip J. Embed. Syst. 2007, 2007, 024163. [Google Scholar] [CrossRef]
  3. Kandhalu, A.; Rowe, A.; Rajkimar, R. DSPcam: A camera sensor system for surveillance networks. In Proceedings of the Third ACM/IEEE International Conference on Distributed Smart Cameras (ICDSC), Como, Italy, 30 August–2 September 2009. [Google Scholar] [CrossRef]
  4. Salcudean, S.E.; Moradi, H.; Black, D.G.; Navab, N. Robot-Assisted Medical Imaging: A Review. Proc. IEEE 2022, 110, 951–967. [Google Scholar] [CrossRef]
  5. Menolotto, M.; Komaris, D.S.; Tedesco, S.; O’flynn, B.; Walsh, M. Motion Capture Technology in Industrial Applications: A Systematic Review. Sensors 2020, 20, 5687. [Google Scholar] [CrossRef]
  6. Du, R.; Santi, P.; Xiao, M.; Vasilakos, A.V.; Fischione, C. The Sensable City: A Survey on the Deployment and Management for Smart City Monitoring. IEEE Commun. Surv. Tutor. 2019, 21, 1533–1560. [Google Scholar] [CrossRef]
  7. Laufs, J.; Borrion, H.; Bradford, B. Security and the Smart City: A Systematic Review. Sustain. Cities Soc. 2020, 55, 102023. [Google Scholar] [CrossRef]
  8. Kukkala, V.K.; Tunnell, J.; Pasricha, S.; Bradley, T. Advanced Driver-Assistance Systems: A Path Toward Autonomous Vehicles. IEEE Consum. Electron. Mag. 2018, 7, 18–25. [Google Scholar] [CrossRef]
  9. Nidamanuri, J.; Nibhanupudi, C.; Assfalg, R.; Venkataraman, H. A Progressive Review: Emerging Technologies for ADAS Driven Solutions. IEEE Trans. Intell. Veh. 2022, 7, 326–341. [Google Scholar] [CrossRef]
  10. Ahmed, F.; Mohanta, J.C.; Keshari, A.; Yadav, P.S. Recent Advances in Unmanned Aerial Vehicles: A Review. Arab. J. Sci. Eng. 2022, 47, 7963–7984. [Google Scholar] [CrossRef]
  11. Yao, H.; Qin, R.; Chen, X. Unmanned Aerial Vehicle for Remote Sensing Applications—A Review. Remote Sens. 2019, 11, 1443. [Google Scholar] [CrossRef]
  12. Hassan, S.I.; Alam, M.M.; Illahi, U.; Al Ghamdi, M.A.; Almotiri, S.H.; Su’ud, M.M. A Systematic Review on Monitoring and Advanced Control Strategies in Smart Agriculture. IEEE Access 2021, 9, 32517–32548. [Google Scholar] [CrossRef]
  13. Finn, C.; Levine, S. Deep Visual Foresight for Planning Robot Motion. In Proceedings of the IEEE International Conference on Robotics and Automation (ICRA), Singapore, 29 May–3 June 2017. [Google Scholar] [CrossRef]
  14. Martí, E.; De Miguel, M.Á.; García, F.; Pérez, J. A Review of Sensor Technologies for Perception in Automated Driving. IEEE Intell. Transp. Syst. Mag. 2019, 11, 94–108. [Google Scholar] [CrossRef]
  15. Sreenu, G.; Saleem Durai, M.A. Intelligent Video Surveillance: A Review through Deep Learning Techniques for Crowd Analysis. J. Big Data 2019, 6, 48. [Google Scholar] [CrossRef]
  16. Ekermo, A.; Norell, V. Reducing the Need for Manual Cleaning Maintenance of Digital Surveillance Cameras–A Conceptual Study. Master’s Thesis, Lund University, Lund, Sweden, 2013. [Google Scholar]
  17. Uřičář, M.; Křížek, P.; Sistu, G.; Yogamani, S. SoilingNet: Soiling Detection on Automotive Surround–View Cameras. arXiv 2019. [Google Scholar] [CrossRef]
  18. Kim, Y.; Kim, W.; Yoon, J.; Chung, S.K.; Kim, D. Deep Learning-Based Multiple Droplet Contamination Detector for Vision Systems Using a You Only Look Once Algorithm. Information 2024, 15, 134. [Google Scholar] [CrossRef]
  19. Gaylard, A.P.; Kirwan, K.; Lockerby, D.A. Surface Contamination of Cars: A Review. Proc. Inst. Mech. Eng. D J. Automob. Eng. 2017, 231, 1160–1176. [Google Scholar] [CrossRef]
  20. Wang, W.; Lai, Q.; Fu, H.; Shen, J.; Ling, H.; Yang, R. Salient Object Detection in the Deep Learning Era: An In-Depth Survey. IEEE Trans. Pattern Anal. Mach. Intell. 2022, 44, 3239–3259. [Google Scholar] [CrossRef]
  21. Song, Z.; Liu, L.; Jia, F.; Luo, Y.; Jia, C.; Zhang, G.; Yang, L.; Wang, L. Robustness-Aware 3D Object Detection in Autonomous Driving: A Review and Outlook. IEEE Trans. Intell. Transp. Syst. 2024, 25, 15407–15436. [Google Scholar] [CrossRef]
  22. Zhang, C.; Liu, T.; Xiao, J.; Lam, K.-M.; Wang, Q. Boosting Object Detectors via Strong-Classification Weak-Localization Pretraining in Remote Sensing Imagery. IEEE Trans. Instrum. Meas. 2023, 72, 5026520. [Google Scholar] [CrossRef]
  23. Zhang, C.; Lam, K.-M.; Liu, T.; Chan, Y.-L.; Wang, Q. Structured Adversarial Self-Supervised Learning for Robust Object Detection in Remote Sensing Images. IEEE Trans. Geosci. Remote Sens. 2024, 62, 5613720. [Google Scholar] [CrossRef]
  24. Zhang, C.; Xiao, J.; Yang, C.; Zhou, J.; Lam, K.-M.; Wang, Q. Integrally Mixing Pyramid Representations for Anchor-Free Object Detection in Aerial Imagery. IEEE Geosci. Remote Sens. Lett. 2024, 21, 6009905. [Google Scholar] [CrossRef]
  25. Hong, J.; Lee, S.J.; Koo, B.C.; Suh, Y.K.; Kang, K.H. Size-Selective Sliding of Sessile Drops on a Slightly Inclined Plane Using Low–Frequency AC Electrowetting. Langmuir 2012, 28, 6307–6312. [Google Scholar] [CrossRef] [PubMed]
  26. Lee, K.Y.; Hong, J.; Chung, S.K. Smart Self–Cleaning Lens Cover for Miniature Cameras of Automobiles. Sens. Actuators B Chem. 2017, 239, 754–758. [Google Scholar] [CrossRef]
  27. Lee, S.; Lee, D.; Hyun, Y.; Lee, K.Y.; Lee, J.; Chung, S.K. Self-Cleaning Drop Free Glass Using Droplet Atomization/Oscillation by Acoustic Waves for Autonomous Driving and IoT Technology. Sens. Actuators A Phys. 2023, 361, 114565. [Google Scholar] [CrossRef]
  28. Alagoz, S.; Apak, Y. Removal of Spoiling Materials from Solar Panel Surfaces by Applying Surface Acoustic Waves. J. Clean. Prod. 2020, 253, 119992. [Google Scholar] [CrossRef]
  29. Kim, Y.; Lee, J.; Chung, S.K. Heat-Driven Self–Cleaning Glass Based on Fast Thermal Response for Automotive Sensors. Phys. Scr. 2023, 98, 085932. [Google Scholar] [CrossRef]
  30. Park, J.; Lee, S.; Kim, D.I.; Kim, Y.Y.; Kim, S.; Kim, H.J.; Kim, Y. Evaporation-Rate Control of Water Droplets on Flexible Transparent Heater for Sensor Application. Sensors 2019, 19, 4918. [Google Scholar] [CrossRef]
  31. You, S.; Tan, R.T.; Kawakami, R.; Mukaigawa, Y.; Ikeuchi, K. Adherent Raindrop Modeling, Detection and Removal in Video. IEEE Trans. Pattern Anal. Mach. Intell. 2016, 38, 1721–1733. [Google Scholar] [CrossRef]
  32. Qian, R.; Tan, R.T.; Yang, W.; Su, J.; Liu, J. Attentive Generative Adversarial Network for Raindrop Removal from A Single Image. In Proceedings of the 2018 IEEE/CVF Conference on Computer Vision and Pattern Recognition, Salt Lake City, UT, USA, 18–23 June 2018. [Google Scholar] [CrossRef]
  33. Son, S.; Lee, W.; Jung, H.; Lee, J.; Kim, C.; Lee, H.; Park, H.; Lee, H.; Jang, J.; Cho, S.; et al. Evaluation of Camera Recognition Performance under Blockage Using Virtual Test Drive Toolchain. Sensors 2023, 23, 8027. [Google Scholar] [CrossRef]
  34. Lu, S.; Zhao, Y.; Hellerman, E.A.P. UV-Durable Self-Cleaning Coatings for Autonomous Driving. Sci. Rep. 2024, 14, 8066. [Google Scholar] [CrossRef]
  35. Pao, W.Y.; Li, L.; Agelin–Chaab, M. Perceived Rain Dynamics on Hydrophilic/Hydrophobic Lens Surfaces and Their Influences on Vehicle Camera Performance. Trans. Can. Soc. Mech. Eng. 2024, 48, 543–553. [Google Scholar] [CrossRef]
  36. Fursa, I.; Fandi, E.; Mușat, V.; Culley, J.; Gil, E.; Teeti, I.; Bilous, L.; Sluis, I.V.; Rast, A.; Bradley, A. Worsening Perception: Real–Time Degradation of Autonomous Vehicle Perception Performance for Simulation of Adverse Weather Conditions. arXiv 2021. [Google Scholar] [CrossRef]
  37. Estribeau, M.; Magnan, P. Fast MTF Measurement of CMOS Imagers Using ISO 12233 Slanted–Edge Methodology. In Proceedings of the Optical Systems Design, Etienne, France, 19 February 2004. [Google Scholar] [CrossRef]
  38. Lee, W.M.; Upadhya, A.; Reece, P.J.; Phan, T.G. Fabricating Low Cost and High Performance Elastomer Lenses Using Hanging Droplets. Biomed. Opt. Express 2014, 5, 1626–1635. [Google Scholar] [CrossRef]
  39. Dodge, S.; Karam, L. Understanding how image quality affects deep neural networks. In Proceedings of the International Conference on Quality of Multimedia Experience (QoMEX), Lisbon, Portugal, 6–8 June 2016. [Google Scholar] [CrossRef]
  40. Padilla, R.; Passos, W.L.; Dias, T.L.B.; Netto, S.L.; Da Silva, E.A.B. A Comparative Analysis of Object Detection Metrics with a Companion Open–Source Toolkit. Electronics 2021, 10, 279. [Google Scholar] [CrossRef]
  41. Padilla, R.; Netto, S.L.; Da Silva, E.A.B. A survey on performance metrics for object-detection algorithms. In Proceedings of the International Conference on Systems, Signals and Image Processing (IWSSIP), Niteroi, Brazil, 1–3 July 2020. [Google Scholar] [CrossRef]
  42. Zhu, H.; Wei, H.; Li, B.; Yuan, X.; Kehtarnavaz, N. A Review of Video Object Detection: Datasets, Metrics and Methods. Appl. Sci. 2020, 10, 7834. [Google Scholar] [CrossRef]
  43. Lyu, C.; Zhang, W.; Huang, H.; Zhou, Y.; Wang, Y.; Liu, Y.; Zhang, S.; Chen, K. RTMDet: An Empirical Study of Designing Real–Time Object Detectors. arXiv 2022. [Google Scholar] [CrossRef]
  44. Qiao, S.; Chen, L.-C.; Yuille, A. DetectoRS: Detecting Objects with Recursive Feature Pyramid and Switchable Atrous Convolution. arXiv 2020. [Google Scholar] [CrossRef]
  45. Zhang, H.; Li, F.; Liu, S.; Zhang, L.; Su, H.; Zhu, J.; Ni, L.M.; Shum, H.-Y. DINO: DETR with Improved DeNoising Anchor Boxes for End–to–End Object Detection. arXiv 2022. [Google Scholar] [CrossRef]
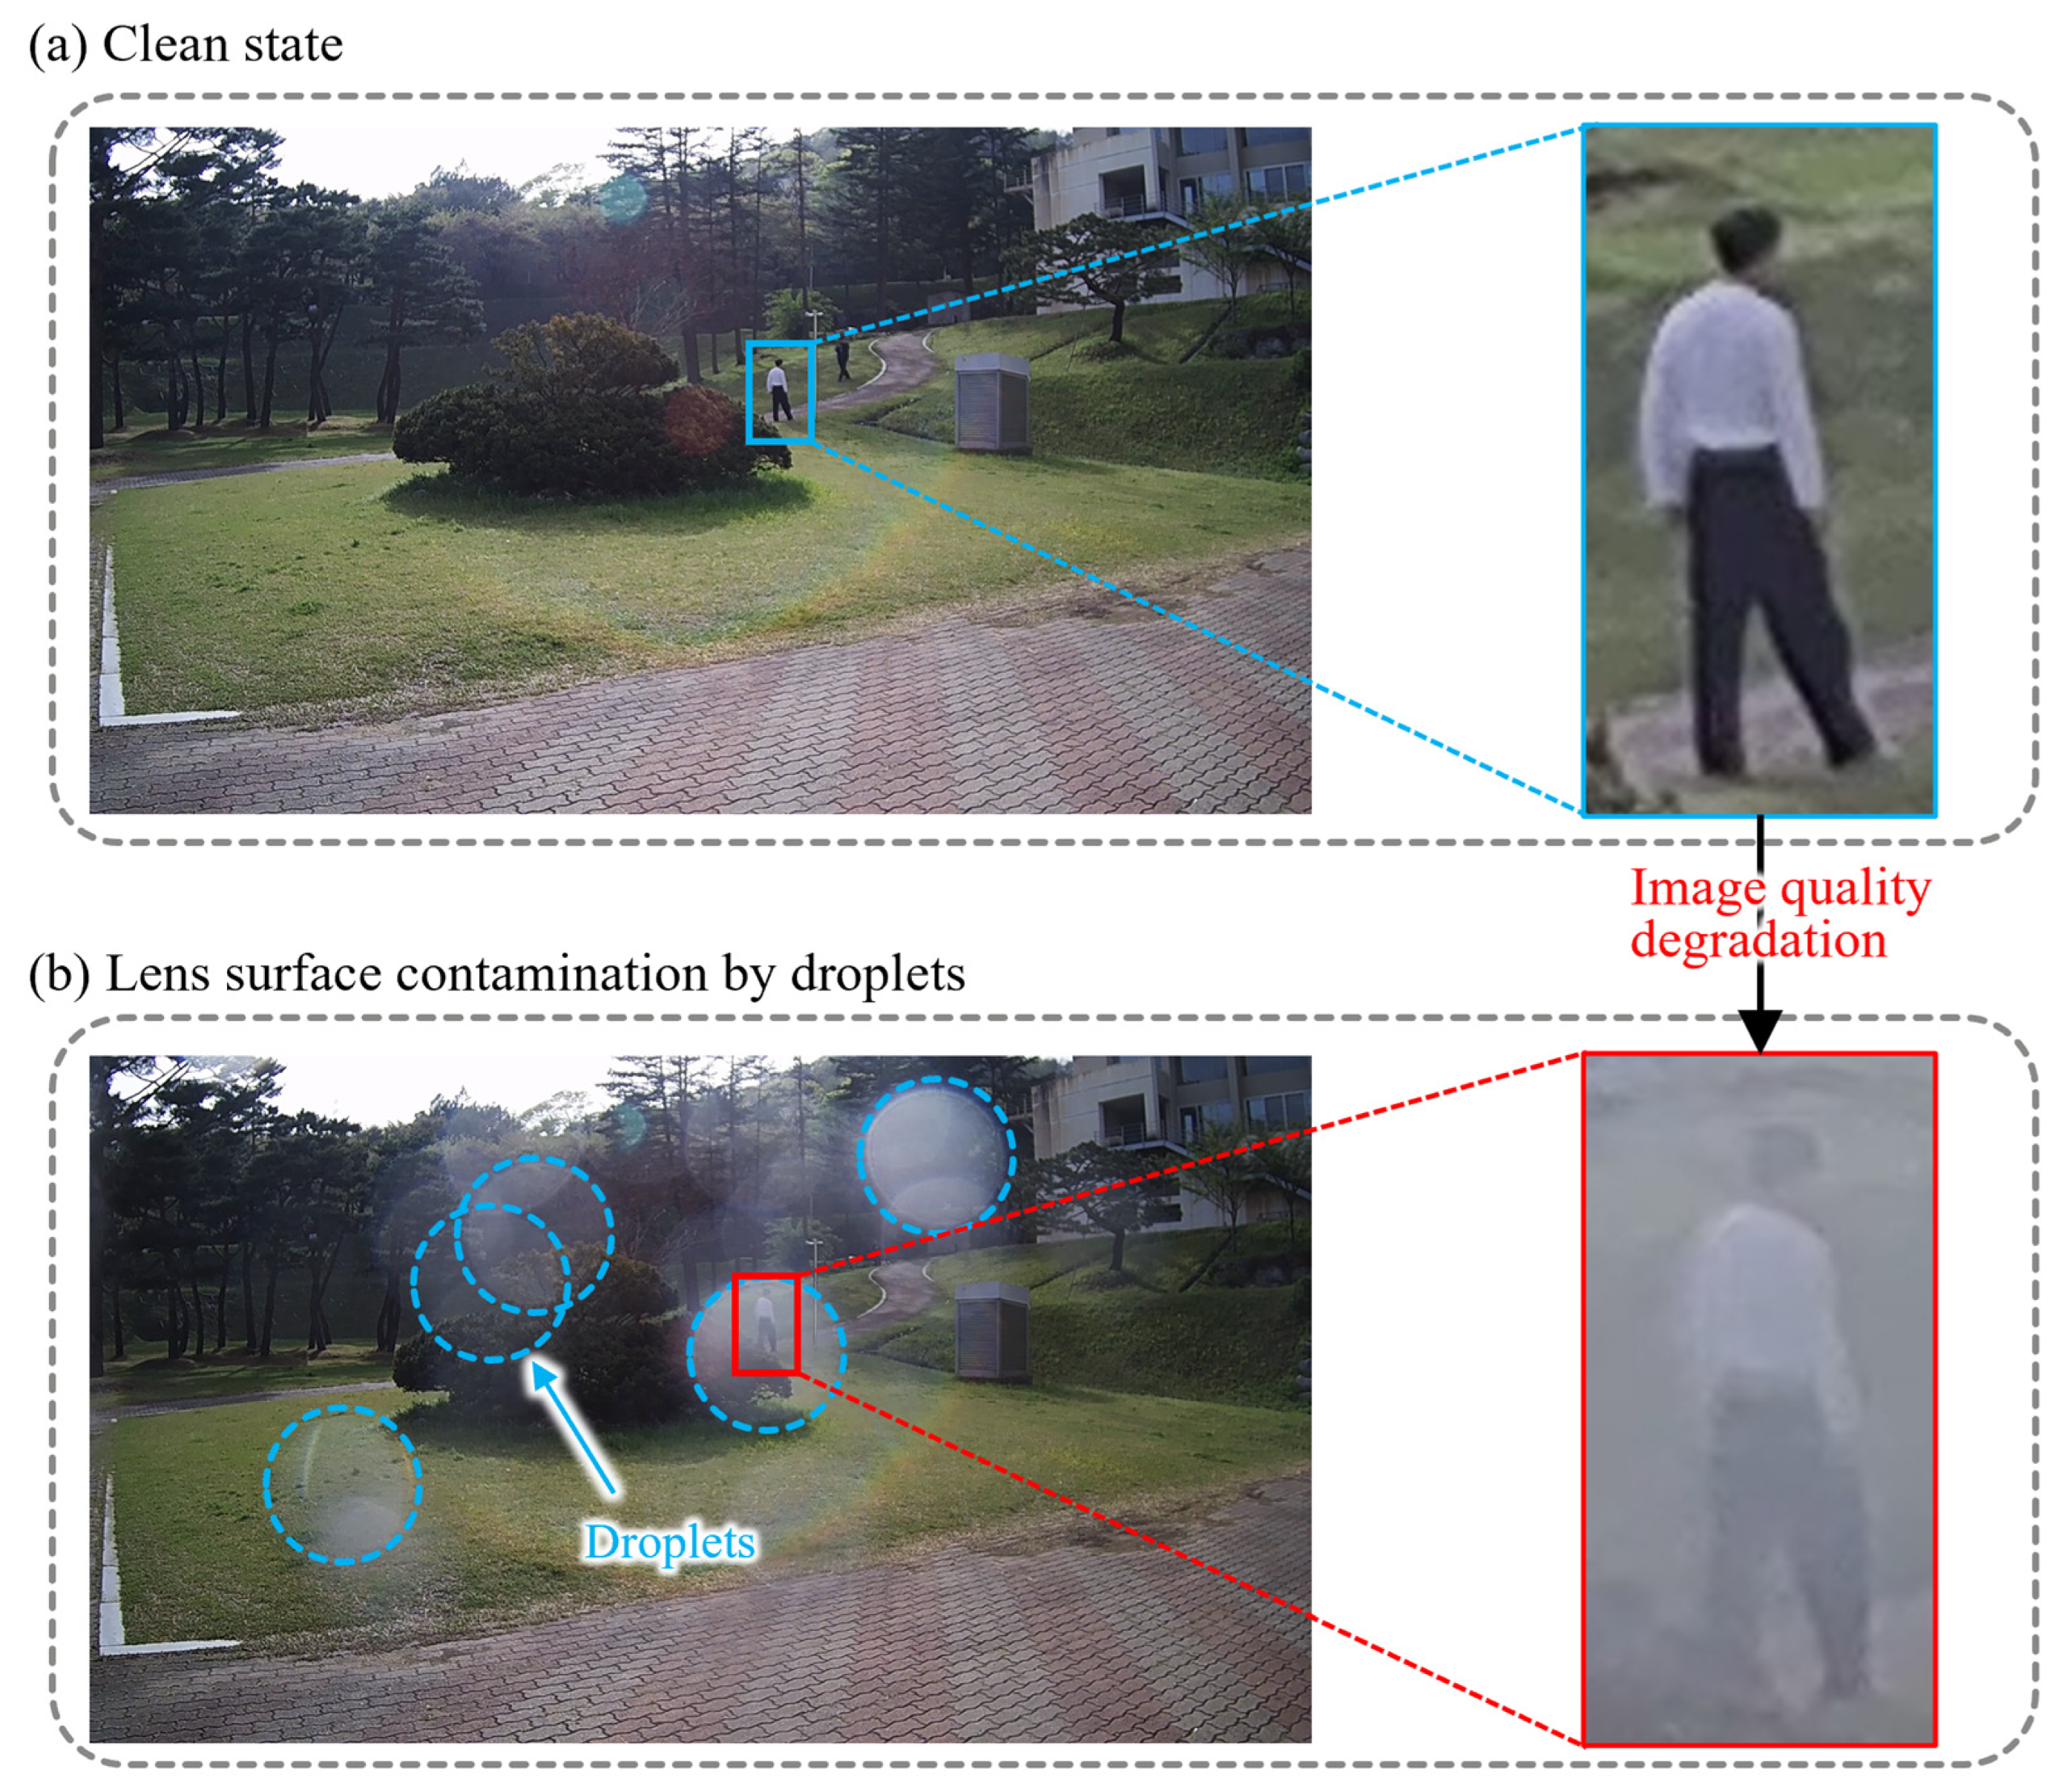
Figure 1. Image quality degradation by droplet contamination on the camera lens surface.
Applsci 15 02690 g001
Figure 2. Experimental setup for analyzing image degradation from droplet contamination using a slanted-edge target: (a) Configuration of the MTF measurement apparatus; two contamination methods for the camera cover glass: (b) single droplet contamination and (c) multiple droplet contamination.
Applsci 15 02690 g002
Figure 3. Side view of droplet on the cover glass parallel to the ground: (a) hydrophobic surface; and (b) hydrophilic surface.
Applsci 15 02690 g003
Figure 4. Image of a slanted-edge target with (a) clean cover glass; (b) hydrophobic cover glass; (c) hydrophilic cover glass, each contaminated by single droplet of varying volumes (1, 3, 5, and 10 μL); and (d) MTF50loss due to single droplet contamination.
Applsci 15 02690 g004
Figure 5. (a) Image capture setup for measuring droplet contamination area; images of cover glass surface for each contamination level with different spray volumes (0.1, 0.5, and 1.0 mL) on (b) hydrophobic and (c) hydrophilic surfaces.
Applsci 15 02690 g005
Figure 6. Contamination area measurement process: (a) Real image with droplets on the cover glass surface. (b) Convert color image to 8-bit grayscale; (c) Highlight the boundaries of droplets using the threshold function. (d) Find the edge of the droplets. (e) Fill the area within the edge of the droplets with white color. (f) Measure the droplet area over the total area of the glass.
Applsci 15 02690 g006
Figure 7. Contamination area measurement results on hydrophobic and hydrophilic cover glass under different contamination levels.
Applsci 15 02690 g007
Figure 8. Slanted-edge target images taken at each contamination level (slight, moderate, severe) with (a) hydrophobic cover glass and (b) hydrophilic cover glass; (c) MTF50loss caused by multiple droplet contamination. Note that the minimum MTF50 value observed was 0.005, indicating a significant decrease in image quality due to the contamination.
Applsci 15 02690 g008
Figure 9. (a) Image capture setup for acquiring the object detection performance evaluation dataset. (b) Object detection performance evaluation process: (b1) The preparation of droplet-contaminated and clean datasets. (b2) Inference of the collected dataset with object detection model. (b3) Calculation of the mAP based on the precision–recall curve.
Applsci 15 02690 g009
Figure 10. Images for assessing the effects of single droplet contamination, with droplet volumes (1, 3, 5, and 10 µL) and object sizes (XL, L, M, S, and XS) as variables on (a) hydrophobic and (b) hydrophilic cover glass.
Applsci 15 02690 g010
Figure 11. Object detection performance evaluation results with five different object sizes and droplet volume on hydrophobic and hydrophilic cover glass: (a) mAP for person class; and (b) mAPloss, representing the difference between the mAPclean and mAPcontamination.
Applsci 15 02690 g011
Figure 12. Images for evaluating object detection performance degradation on camera sensors resulting from multiple droplet contamination on hydrophobic and hydrophilic surfaces, with contamination levels as follows: (a) clean; (b) slight; (c) moderate; and (d) severe.
Applsci 15 02690 g012
Figure 13. The mAPloss caused by multiple droplet contamination for various object detection algorithms: (a) RTMDet; (b) YOLOv8x; (c) DetectoRS; and (d) DINO.
Applsci 15 02690 g013
Table 1. Percentage of droplet contamination area by cover glass surface type and contamination level.
Contamination Area (%)
Surface TypeSlight ContaminationModerate ContaminationSevere Contamination
Hydrophobic12.9236.7544.12
Hydrophilic22.2745.8854.90
Table 2. Definition of True Positive (TP), False Positive (FP), False Negative (FN) and True Negative (TN).
Ground Truth
PredictedPositiveNegative
PositiveTrue PositiveFalse Positive
NegativeFalse NegativeTrue Negative
Table 3. Size of object and number of images in the evaluation dataset for assessing single droplet contamination effects.
Object Size
XLLMSXS
Average object size [pixel2]40,00911,5082247.3773.86564.55
Number of images in the dataset200400800400200
Disclaimer/Publisher’s Note: The statements, opinions and data contained in all publications are solely those of the individual author(s) and contributor(s) and not of MDPI and/or the editor(s). MDPI and/or the editor(s) disclaim responsibility for any injury to people or property resulting from any ideas, methods, instructions or products referred to in the content.