Article

A Practical Approach for Predicting Avocado Ripeness Using a Portable Vis-NIR Device and Sensory-Based Indexing Under Various Storage Temperatures


1
Department of Biological Production, Akita Prefectural University, Akita 010-0195, Japan
2
OAK Co., Ltd., 991 Azawada, Kaminogo, Hidaka-Cho, Toyooka City 669-5324, Japan
*
Author to whom correspondence should be addressed.
AgriEngineering 2026, 8(4), 130; https://doi.org/10.3390/agriengineering8040130
Submission received: 27 January 2026 / Revised: 2 March 2026 / Accepted: 26 March 2026 / Published: 1 April 2026
(This article belongs to the Special Issue Latest Research on Post-Harvest Technology to Reduce Food Loss)

Abstract

Effective post-harvest management of avocados is essential for reducing supply chain losses. This requires an accessible, cost-effective method for accurately predicting ripeness under real-world conditions. This study developed a non-destructive framework for predicting avocado ripeness using portable visible–near-infrared (Vis-NIR) spectrometers and analyzed the storage temperature dependencies. A 10-point sensory-based ripeness index was correlated with second-derivative reflectance spectra using partial least squares (PLS) regression. To ensure model robustness, we employed repeated 10-fold cross-validation. The broadband PLS model achieved a residual predictive deviation (RPD) of 1.36, while a simplified model using six specific wavelengths (570, 977, 1120, 1161, 1398, and 1655 nm) demonstrated an RPD of 1.43, confirming its feasibility as a preliminary screening tool. Key wavelengths identified were associated with chlorophyll degradation and lipid accumulation. Furthermore, a significant logarithmic relationship (r = 0.9965) was observed between storage temperature (15–35 °C) and the daily ripening rate. Our results suggest that ripening progression is significantly suppressed at temperatures of approximately 12 °C or below. These findings provide quantitative guidelines for distributors to optimize logistics and shelf-life management using portable technology, contributing to the digitalization of consumer-aligned ripeness assessment.

1. Introduction

The global demand for avocados (Persea americana Mill.) is increasing because of its high nutritional value and diverse applications. According to the Food and Agriculture Organization of the United Nations, 10.5 million tons of avocados were produced worldwide in 2023 [1]. The global avocado market has experienced unprecedented growth, with fruit often referred to as ‘green gold’ due to its high economic value. In Japan, avocado imports have steadily increased, reflecting a shift in dietary preferences toward nutrient-dense, plant-based fats.
However, this growth is accompanied by significant postharvest challenges. Avocados are typically harvested at a mature-green stage and ripened during transit or at distribution centers. The lack of synchronized ripening often leads to a mix of overripe and underripe fruits on retail shelves, causing a direct economic loss to retailers and reduced consumer satisfaction. Avocados are climacteric fruits, characterized by a rapid ripening process triggered by ethylene production after harvest, making them highly susceptible to post-harvest deterioration [2,3,4]. Furthermore, determining the “optimal taste stage” for avocados is particularly difficult. Consequently, according to consumer and industry reports, the difficulty in precisely identifying the ideal ripening period contributes to the high waste rate. It is reported that up to one-third of avocados purchased for home consumption and 5–15% of avocados destined for retail stores and the food service industry are discarded, primarily due to under-ripeness or rapid ripening deterioration [5].
Avocado losses are often attributed to improper storage temperatures, physical damage during handling, and the lack of accurate real-time ripeness assessment tools. Proper ripeness management during distribution is crucial to ensure consumers receive optimal taste and nutritional value while reducing post-harvest losses. Minimizing these losses is not only an economic imperative for the multi-billion-dollar avocado industry but also a significant contribution toward achieving UN Sustainable Development Goal (SDG) 12, which aims to reduce food loss and waste throughout the production and supply chain. However, conventional ripeness evaluation methods, such as measuring the oil content or dry matter of avocados, are destructive and time consuming, making them unsuitable for repeated application in mass distribution settings [6]. Hence, rapid, non-destructive techniques for assessing avocado ripeness should be developed.
Furthermore, reducing post-harvest losses of avocados is a critical environmental challenge. Avocado production requires significant amounts of water [7]. When avocados are discarded due to post-harvest losses, the water, energy, and labor invested in their production and intercontinental transport are wasted. Therefore, developing rapid and non-destructive technologies to assess avocado ripeness is not only a commercial necessity but also a significant contribution to environmental sustainability and the circular economy.
Recently, non-destructive measurement technologies using visible (Vis) and near-infrared (NIR) light reflectance have been applied to determine the sugar content of citrus fruits and apples [8,9], estimate the lycopene and β-carotene content of watermelons [10], analyze fat and moisture distribution in salmon [11], and quantify the inorganic components, such as potassium and nitrogen, in vegetables [12,13,14]. Moreover, Vis–NIR reflectance-based technology has been applied to estimate the dry matter and oil content of avocados [6]. In determine avocado ripeness, non-destructive measurement technologies such as electrical impedance spectroscopy [15], ultrasonic measurement [16], near-infrared spectroscopy [6], and hyperspectral imaging analysis [4] have been reported. However, despite producing accurate results, the application of hyperspectral imaging analysis and near-infrared spectroscopy in distribution settings is limited due to high equipment and processing costs [4,15]. Moreover, the effect of storage temperature on the rate of change in ripeness is poorly elucidated as the existing non-destructive measurement methods can only evaluate ripeness at the time of measurement. Thus, there is an urgent need for affordable and portable measurement devices that can monitor changes in ripeness in response to storage temperature.
In a study of non-destructive measurement using Vis–NIR reflectance, the object to be measured was placed in an analyzing instrument, illuminated, and the reflected or transmitted light of the entire object was measured. These instruments are large and cannot be taken to the field for measurement. Additionally, these instruments are very expensive [12,14,17,18,19]. While high-performance spectrometers provide precise data, their high cost and lack of portability limit their practical application in stores that actually sell avocados. A more accessible measurement system is needed that utilizes low-cost, portable devices without compromising the accuracy required for routine quality control. In recent years, portable spectrometers have been developed to obtain visible and near-infrared spectra. In our previous studies, we have shown that the potassium content of root and leaf vegetables can be predicted nondestructively using a portable spectrometer [20,21]. In this study, we investigated a method for non-destructively measuring the ripeness of avocados using a portable Vis-NIR spectroscopic device.
Additionally, previous studies on the application of non-destructive measurement technologies in assessing fruit ripeness have focused on physicochemical indicators, such as fruit firmness, flesh oil content, dry matter, and moisture content [6,16,22]. As consumers appraise the taste of fruits based on their sensory perception, ripeness should be evaluated using non-destructive methods that employ both physicochemical and sensory indicators. Currently, studies focusing on the sensory evaluation of ripeness based on consumer preference for taste as an index and the construction of ripeness prediction models linked with storage temperature are insufficient.
Hence, the aim of this study was to develop a non-destructive method that predicts avocado ripeness based on Vis–NIR light reflectance at the fruit surface and to clarify the relationship between storage temperature and the rate of change in ripeness. Specifically, the objectives of this study were to (1) construct a ripeness estimation model that reflects consumer preferences instead of physicochemical indices and (2) determine the rate of change in ripeness at different storage temperatures. The findings of this study contribute to the development of a practical avocado ripeness management system that facilitates optimal shipping and sales timing by predicting changes in ripeness not only at the time of measurement but also during distribution. In this study, we focus specifically on ‘ripeness’ (post-harvest stage for consumption) rather than ‘maturity’ (pre-harvest developmental stage) to avoid any physiological confusion.

2. Materials and Methods

2.1. Plant Materials and Sample Preparation

The experiment utilized ‘Hass’ avocados, the most commercially significant cultivar due to its high oil content and favorable shipping characteristics. A total of 92 intact fruits were purchased from local commercial suppliers in Japan (import origins: Mexico). To ensure model reliability, samples were selected based on an initial visual screening to exclude fruits with pre-existing skin defects or signs of chilling injury. Prior to the experiment, all samples were equilibrated for 12 h in a room maintained at 20 ± 0.5 °C in a temperature-controlled laboratory environment to stabilize metabolic rates. The dataset was divided into two subsets: Experiment 1 (n = 67) for the construction of the ripeness prediction model, and Experiment 2 (n = 25) for analyzing the kinetics of ripeness progression under varying thermal conditions.

2.2. Experiment 1: Construction of a Ripeness Prediction Model

2.2.1. Measurement of Vis-NIR Reflectance

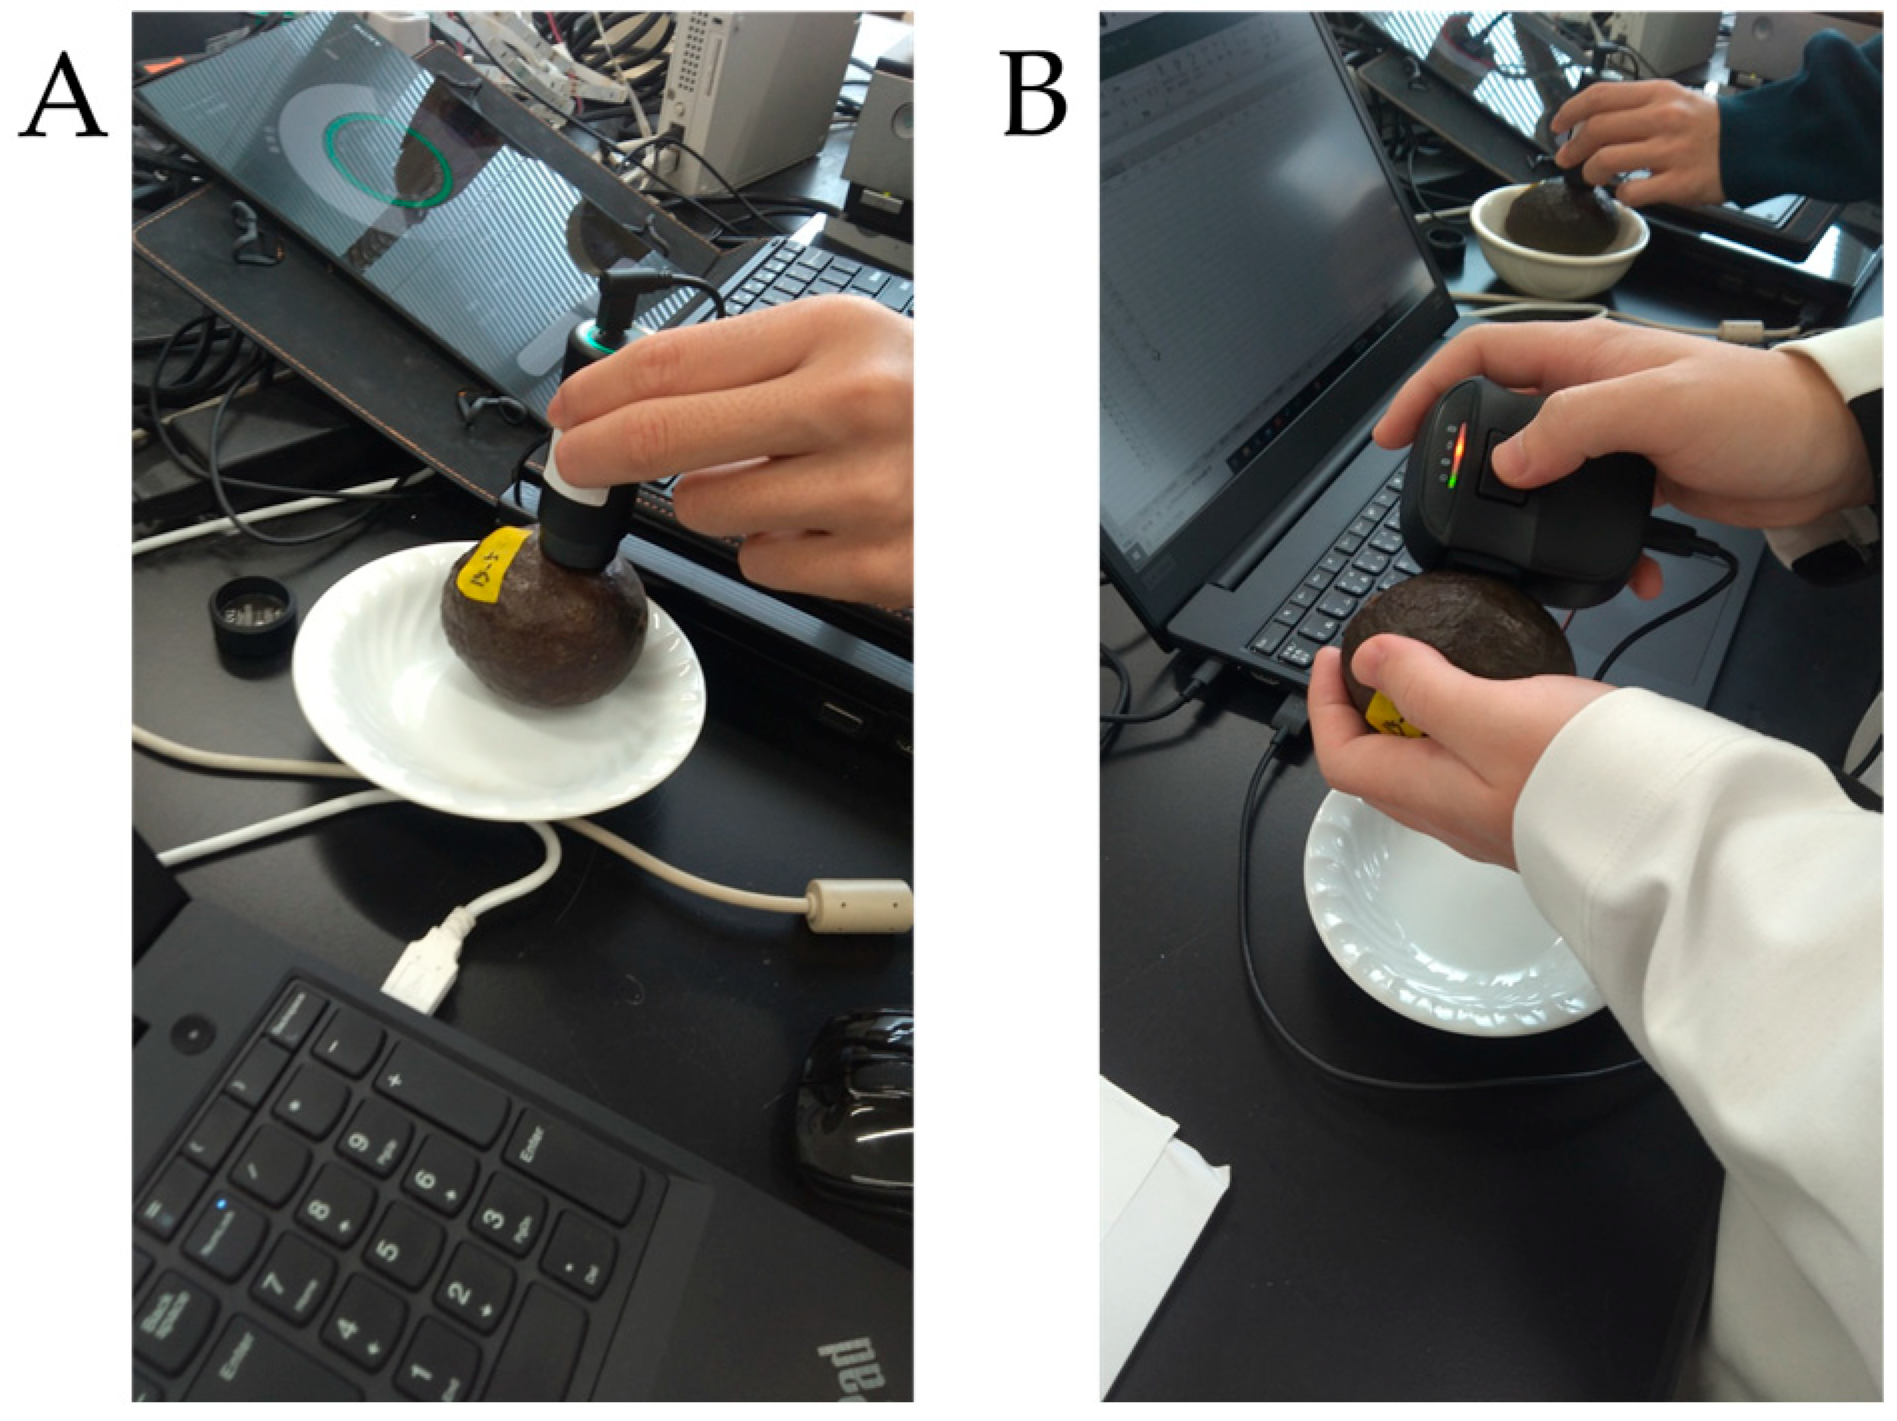
A compact spectrophotometer (Spectro1™; Variable, Chattanooga, TN, USA) was used to measure Vis reflectance (Figure 1A). The measurement wavelength range was 400–700 nm, with measurements taken at 10 nm intervals. Meanwhile, an ultra-compact near-infrared spectrometer module (NIR-S-G1; InnoSpectra, Hsinchu, Taiwan) was used to measure near-infrared reflectance (Figure 1B). The measurement wavelength range was 900–1700 nm, with measurements taken at 3.5 nm intervals. The spectral gap between 700 and 900 nm resulted from the inherent hardware limitations of the portable modules. Visible and near-infrared reflectance measurements were taken at three random locations on the avocado sample’s skin, and the average of these three locations was used as the reflectance value for that avocado. Both devices were equipped with built-in light sources, and measurements were conducted indoors at 20 °C.

2.2.2. Measurement of Fruit Firmness

After measuring Vis–NIR reflectance, the avocado samples were cut in half, lengthwise. The firmness of the edible portion at the midpoint between the seed and peel (with the peel left on) was measured using a fruit hardness tester (FHT-15; Guang Zhou Landtek Instruments, Guangzhou, China) equipped with a 3 mm-diameter plunger.

2.2.3. Sensory Test

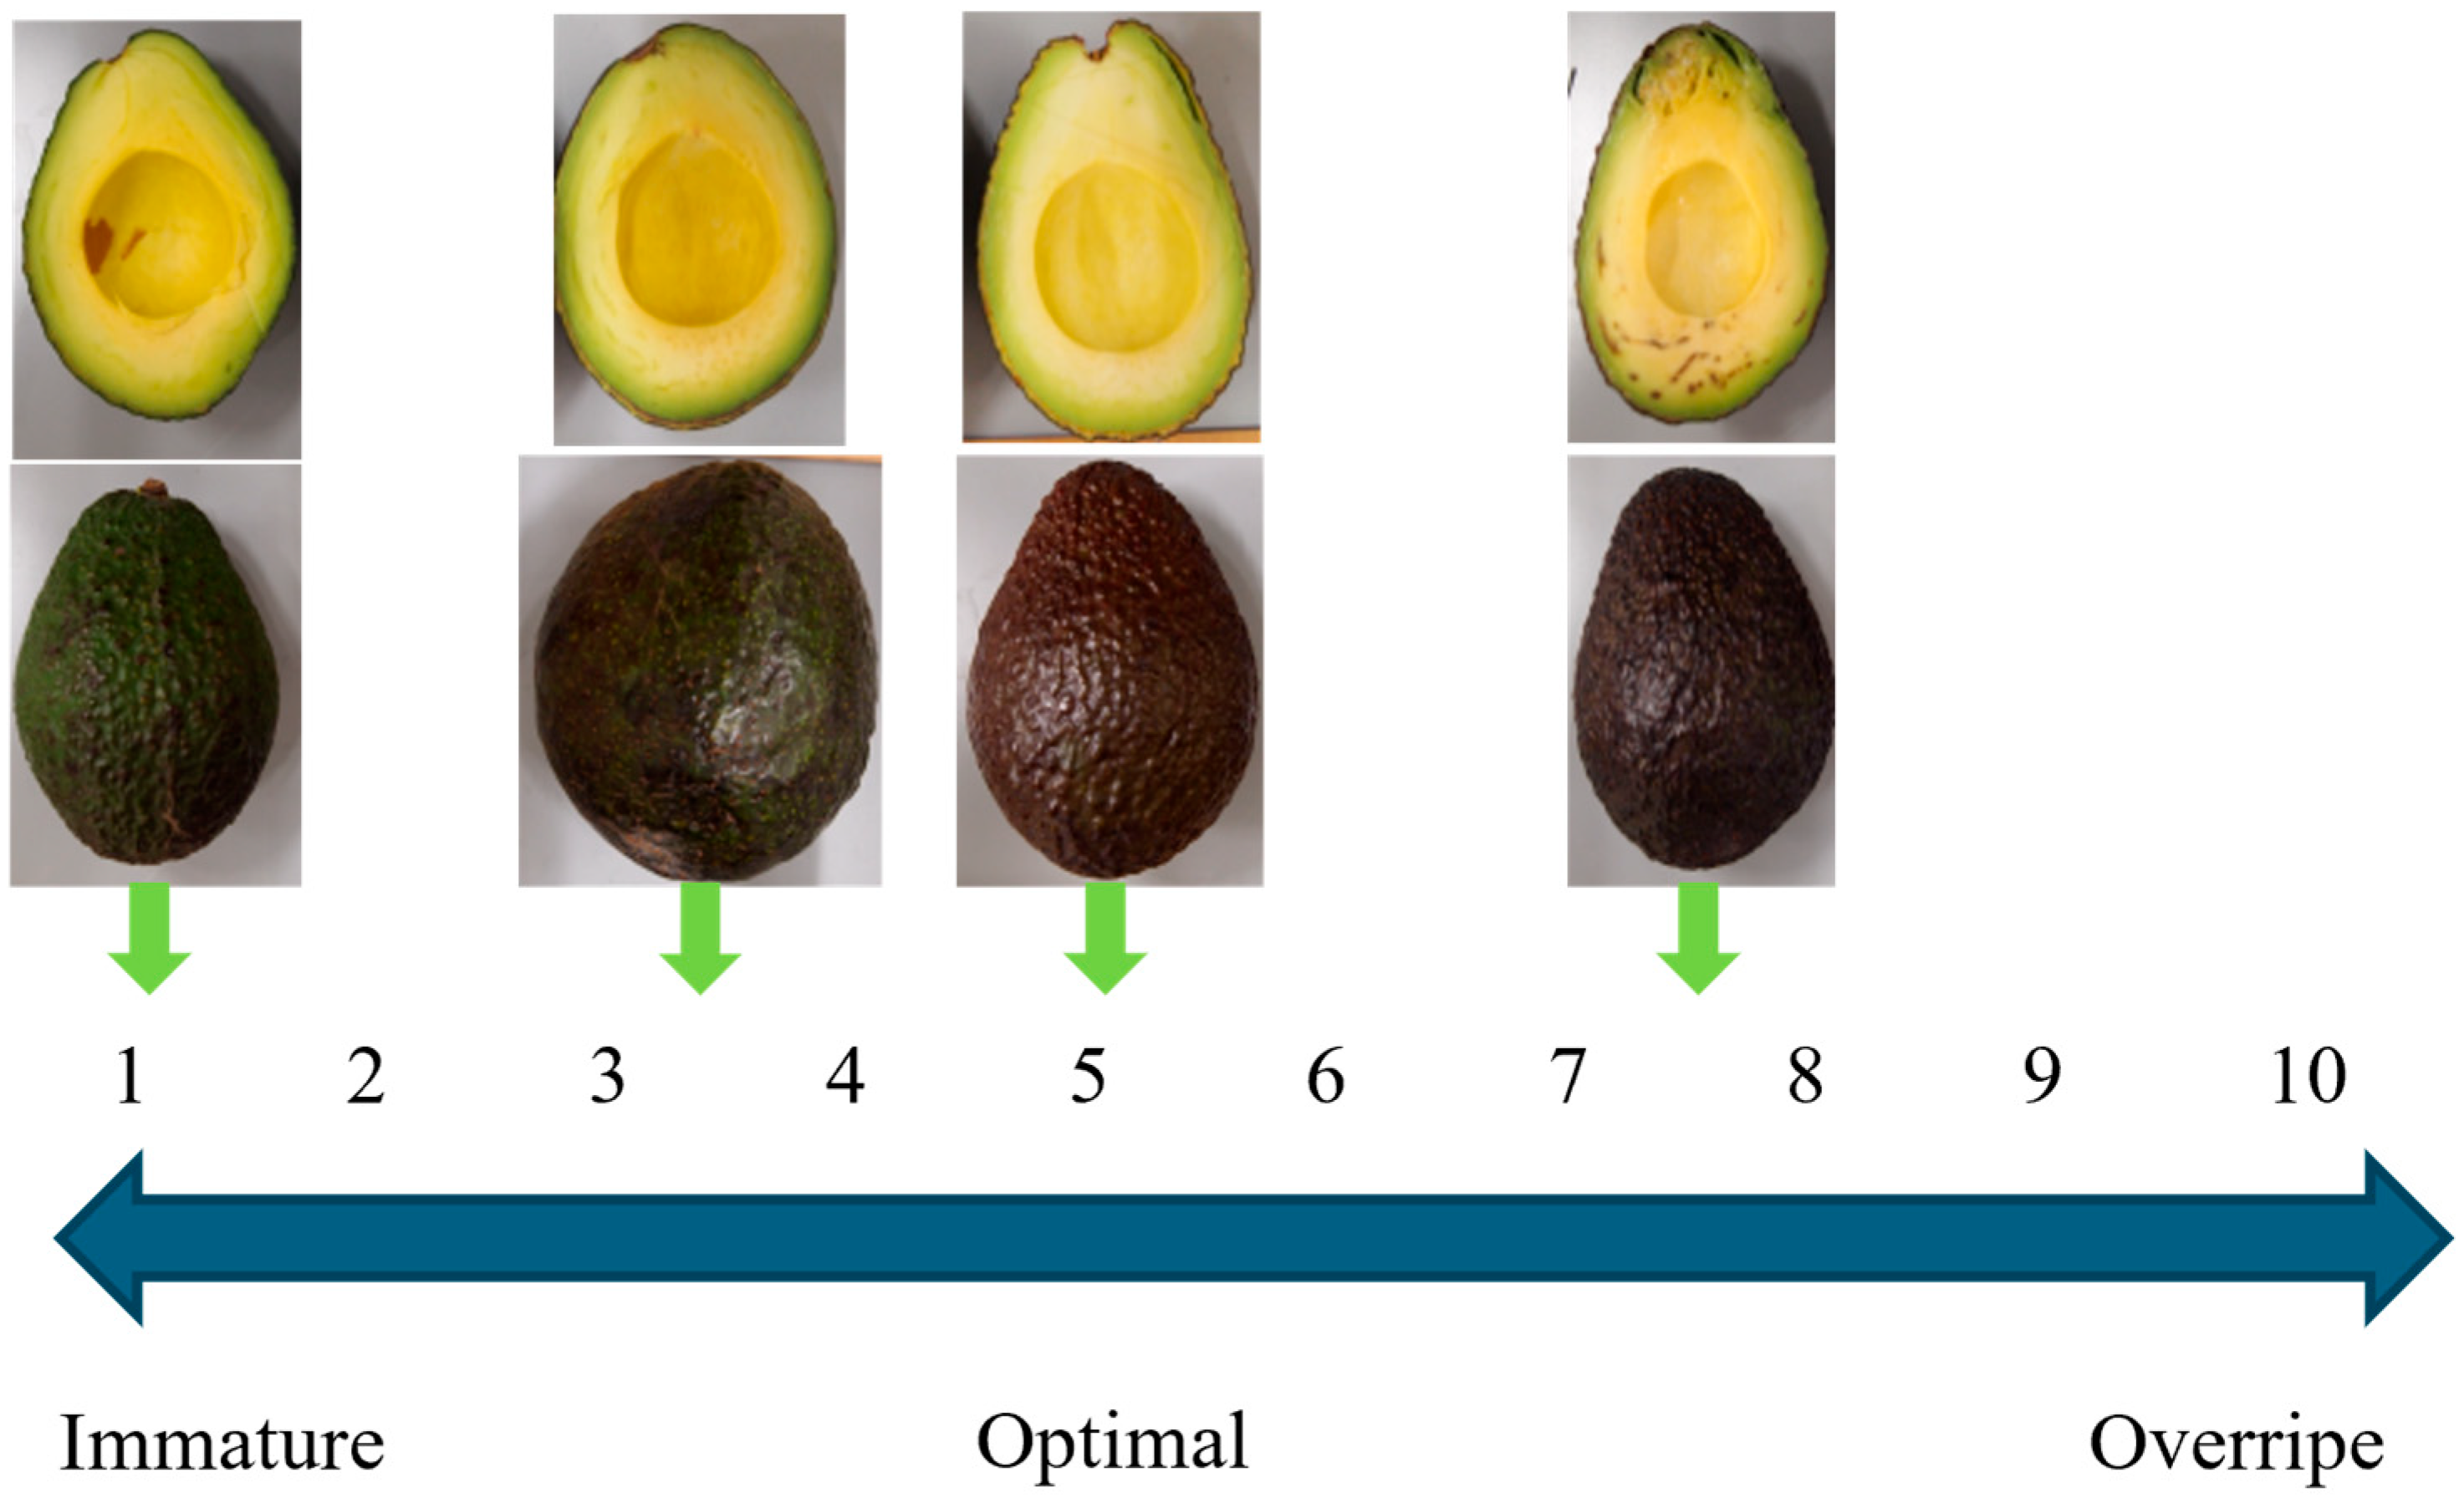
The sensory evaluation was conducted by a panel pool of 13 members associated with Akita Prefectural University, comprising 9 students in their 20s (8 males, 1 female), two faculty members in their 40s and 50s (1 male, 1 female), and two staff members in their 50s (1 male, 1 female). All participants were regular consumers of avocados. The evaluation of 67 avocado samples was carried out over 15 separate sessions, with 5 to 10 members from the pool participating in each session depending on their availability. Although the panel did not undergo formal professional training according to ISO 8586 [23], they were provided with a detailed 10-stage descriptive rubric for avocado ripeness: hard, unripe fruit was rated “1,” fruit with optimal eating taste was rated “5,” and overripe fruit was rated “10.” The average score per avocado sample was referred to as the ripeness index for each sample (Figure 2). Although the scale was defined from 1 to 10, the maximum observed score in this study was 9, as no samples reached the final ‘overripe’ stage. The reliability of the sensory scores was confirmed by calculating the inter-rater variance; for all samples, the scores provided by the participants in each session fell within ±1 of the mean score for each respective sample. This indicates a high level of consistency in the perception of ripeness across different age groups and genders, even with varying sub-groups of evaluators. It should be noted that this study aims to propose a prototype framework for correlating human sensory perception with physical indices using a portable device. While the panel size per session was relatively small, the primary focus was on establishing a fundamental relationship between spectral data and a simplified ripeness index suitable for rapid on-site screening.

2.2.4. Statistical Analysis

Partial Least Squares (PLS) regression analysis was performed with the ripeness index as the dependent variable and the second-derivative values of reflectance as the independent variables. To mitigate potential artifacts arising from the use of two different sensors, such as differing sensitivity levels or baseline offsets, Savitzky–Golay second-order derivative pre-processing was applied to each spectral range (Vis and NIR) independently before merging. The specific settings applied were a window size of 11 points and a second-order polynomial. Following pre-processing, the two datasets were combined via simple concatenation to form a unified feature matrix for PLS regression. All variables were auto-scaled (mean-centered and divided by the standard deviation) within the PLS algorithm to ensure that the differing spectral resolutions did not bias the model’s weight distribution. This process smooths background variations and enhances absorption peaks to extract essential physiological information [9]. PLS regression was utilized to reduce the high-dimensional spectral data into a small number of latent variables (LVs) that maximize the covariance between the predictor (spectra) and the response variable (ripeness index). To ensure model robustness and avoid the over-optimism often associated with small datasets, a repeated 10-fold cross-validation scheme (10-fold CV, repeated 5 times) was employed instead of leave-one-out cross-validation. This repeated k-fold approach provides a more rigorous estimation of the model’s generalization capability. The optimal number of LVs was determined by minimizing the Root Mean Square Error of Cross-Validation (RMSECV), with a maximum limit of 15 factors to prevent over-fitting. Model accuracy and performance were assessed based on the correlation coefficient of cross-validation (rcv), RMSECV, the Residual Prediction Deviation (RPD), and the Variable Importance in Projection (VIP). To explore the potential of future low-cost sensor concepts, we selected key wavelengths based on VIP scores and created simplified models; however, these were primarily intended for screening-level accuracy assessment.
RPD is a normalized metric used to evaluate model utility relative to the intrinsic variability (standard deviation) of the dataset. Following established criteria for Vis–NIR models [24], the performance was categorized as follows:
  • RPD > 3.5: Excellent; applicable for highly reliable quantitative predictions.
  • 2.5 < RPD < 3.5: Very good; suitable for quantitative prediction with moderate reliability.
  • 1.5 < RPD < 2.5: Good; suitable for qualitative screening or preliminary assessment.
  • RPD < 1.5: Acceptable; indicating low utility for precise quantification but potentially useful for broad classification.
Statistical analyses were performed using OriginPro 2024 (OriginLab Corporation, Northampton, MA, USA) and Python (version 3.10)-based specialized scripts to implement the repeated k-fold validation.

2.3. Experiment 2: Analysis of the Relationship Between Storage Temperature and Change in Ripeness

Twenty-five avocados at various stages were used to visually and subjectively assess the color of their skin. The samples were divided into five groups with five samples each. The groups were stored for 2 days at varying temperatures: 15 °C, 20 °C, 25 °C, 30 °C, and 35 °C in a multi thermo incubator (MTI-202, EYELA, Tokyo, Japan). The internal temperature was monitored using the incubator’s built-in digital sensor and verified with an external data logger, maintaining stability within ±0.5 °C throughout the storage period. The temperatures (15, 20, 25, 30, and 35 °C) were selected to represent the range from standard retail/storage conditions to extreme tropical ambient temperatures. Reflectance was measured for 3 days (on Days 0, 1, and 2) using the same method as described in Section 2.2.1. The relationship between storage temperature and the rate of ripening was analyzed by applying the PLS model constructed in Experiment 1 to the measured spectra. It should be emphasized that the ripening indices obtained in this experiment are model-predicted estimates reflecting spectral transitions associated with ripening, rather than directly measured sensory scores. These estimates were then used to evaluate the temperature-dependent ripening kinetics (apparent rate constants and activation energy).

3. Results

3.1. Relationship Between Fruit Firmness and the Ripeness Index

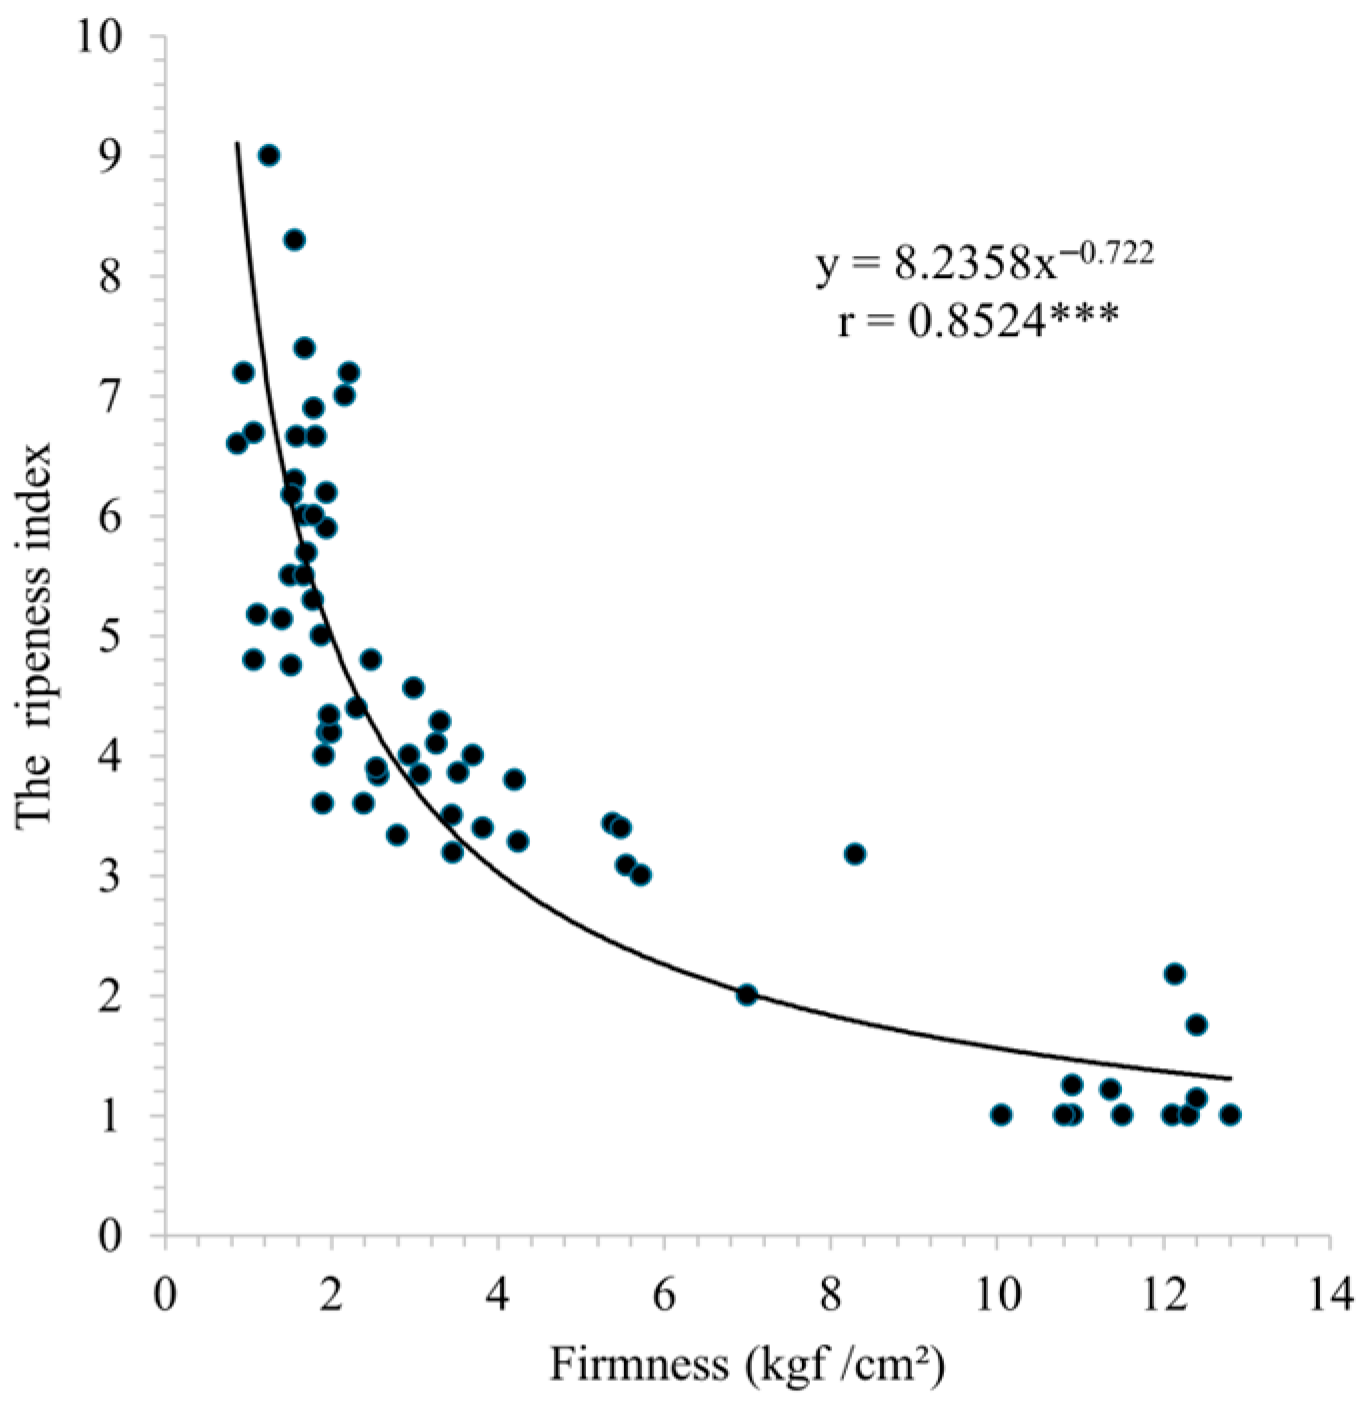
The ripeness index and fruit firmness ranges used to create the model spanned from low to high values. The minimum value for the ripeness index was 1, and the maximum value was 9. The minimum value for fruit firmness was 0.87 kgf cm−2, and the maximum value was 12.8 kgf cm−2.
The relationship between fruit firmness and the ripeness index was represented by a power approximation formula (y = 8.2358x−0.722, r = 0.8524). As shown in Figure 3, the ripeness index increased as fruit firmness decreased. However, the ripeness index indicated varying stages of ripeness—optimal ripeness (the ripeness index = 5), unripe (the ripeness index = 3), or overripe (the ripeness index = 7)—when fruit firmness was approximately 2 kgf/cm2. This result indicates that it is difficult to consistently determine ripeness based on fruit firmness alone.

3.2. Reflectance Spectra and Second-Derivative Analysis

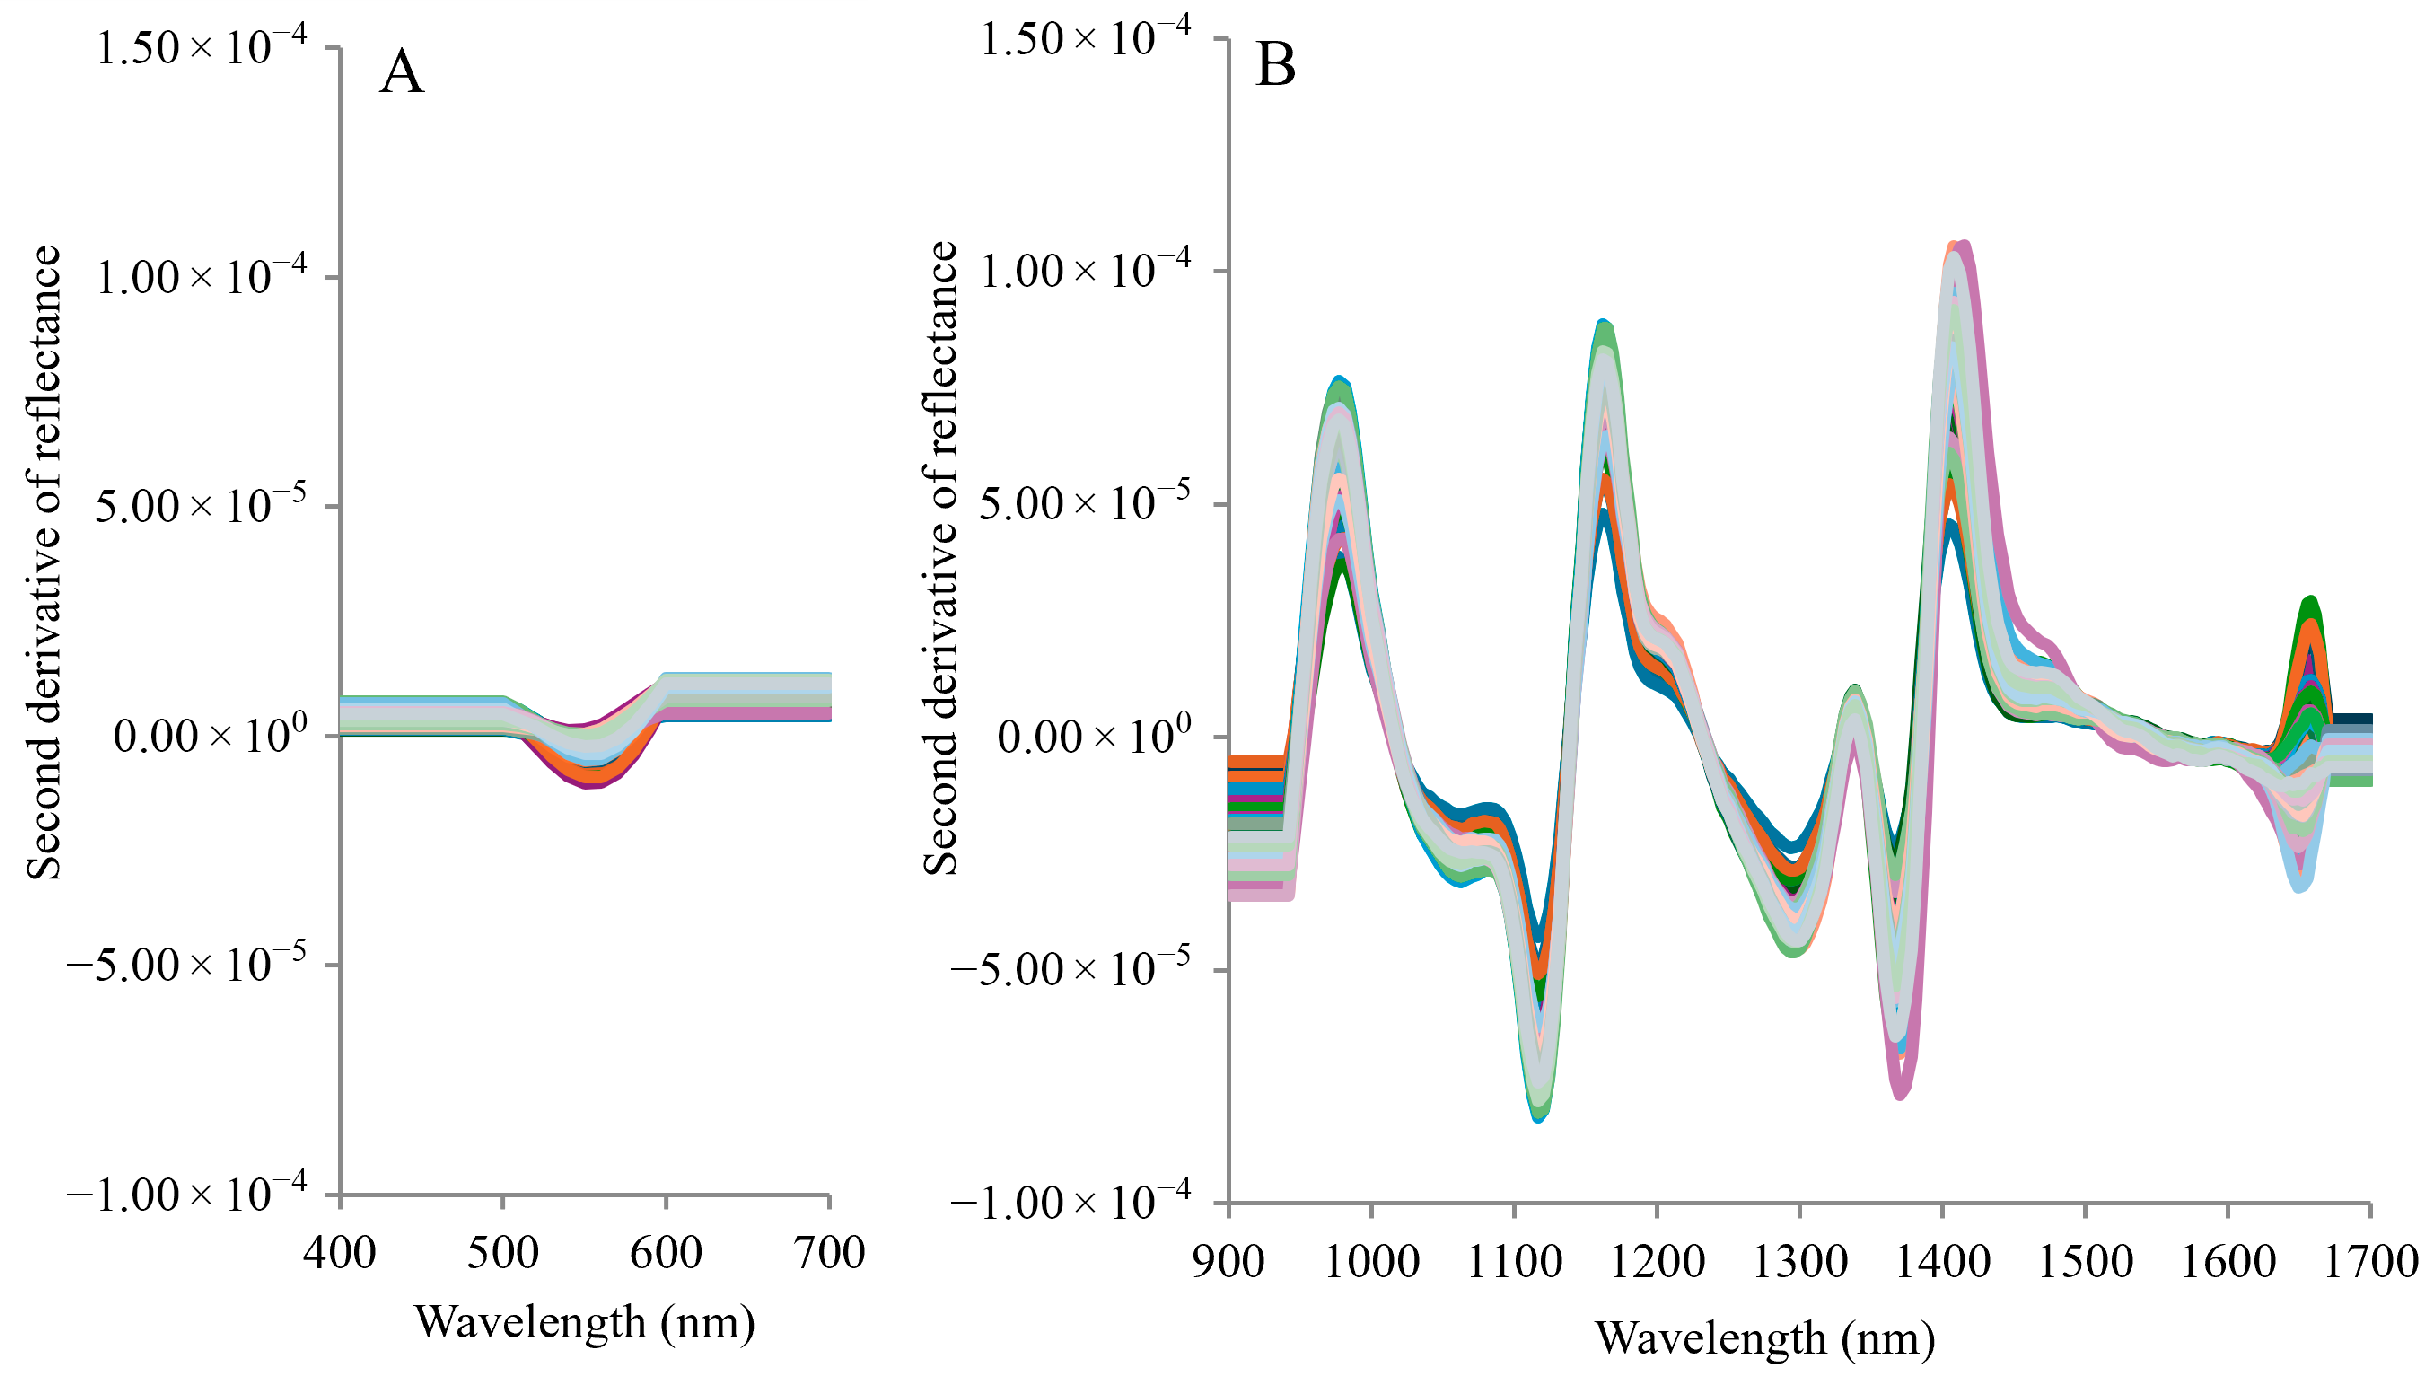
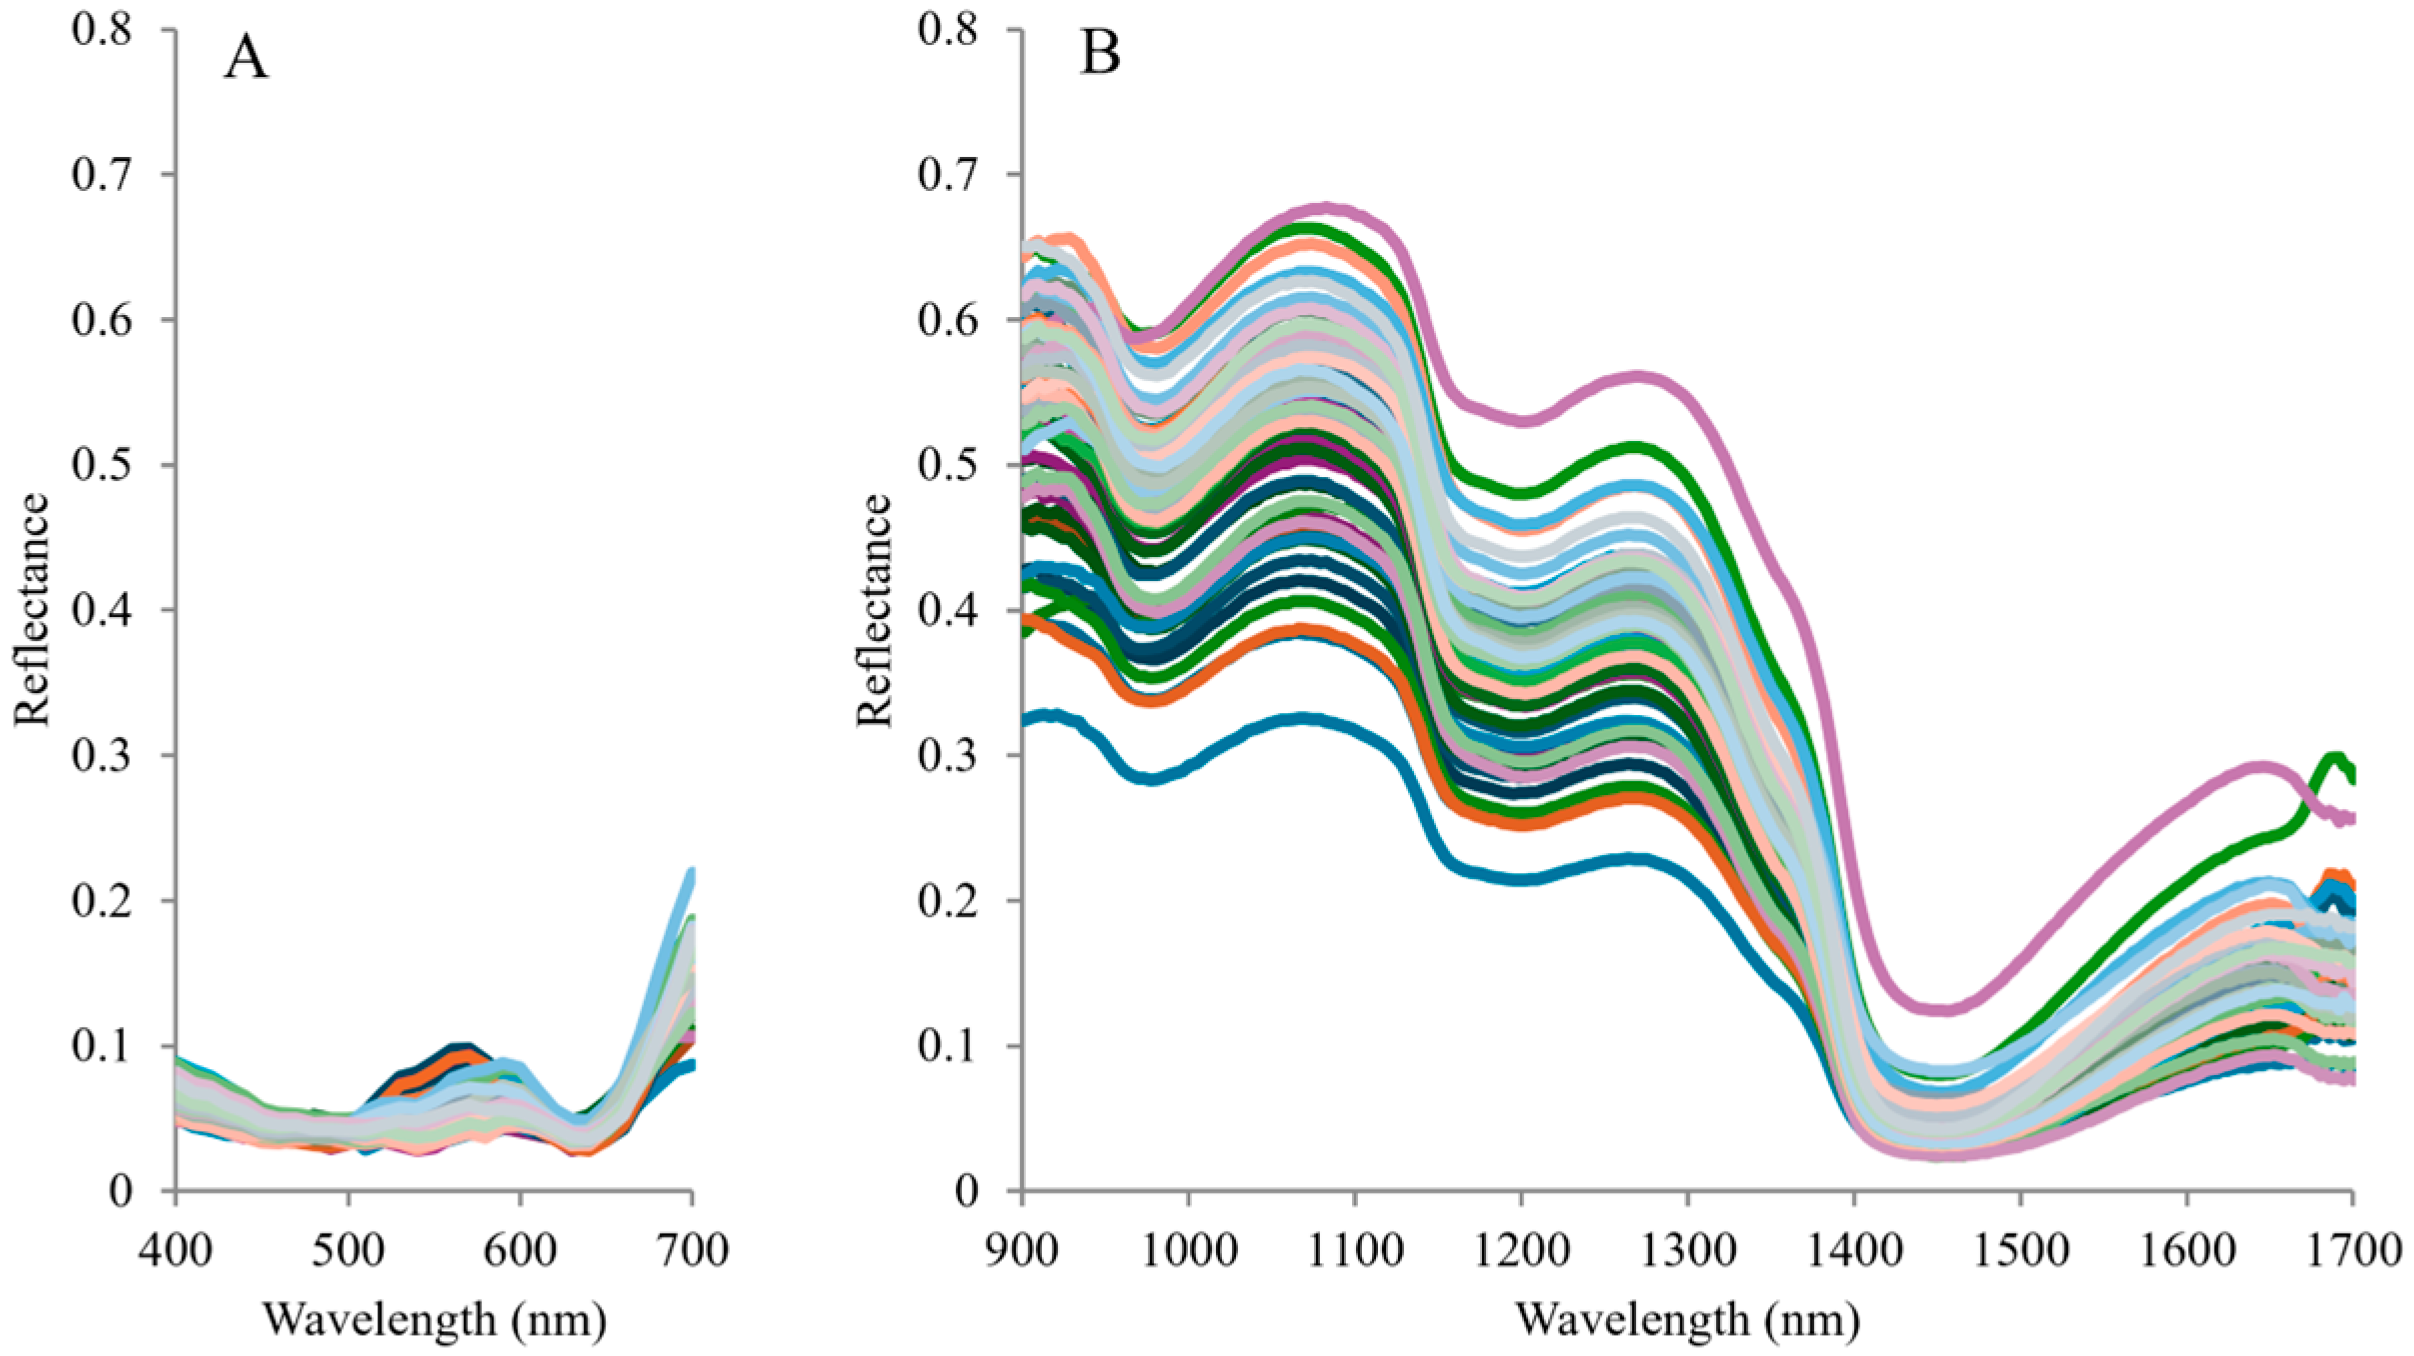
Figure 4 shows the reflectance of each fruit in the visible and near-infrared regions, and Figure 5 shows the second-derivative values. Based on the second-derivative values, a negative peak was observed at approximately 560 nm in the visible region. In the near-infrared region, positive peaks were observed at approximately 980, 1160, 1330, 1410, and 1660 nm, whereas negative peaks were observed at approximately 1120, 1300, 1380, and 1650 nm.

3.3. PLS Regression Model Using Broadband Spectra

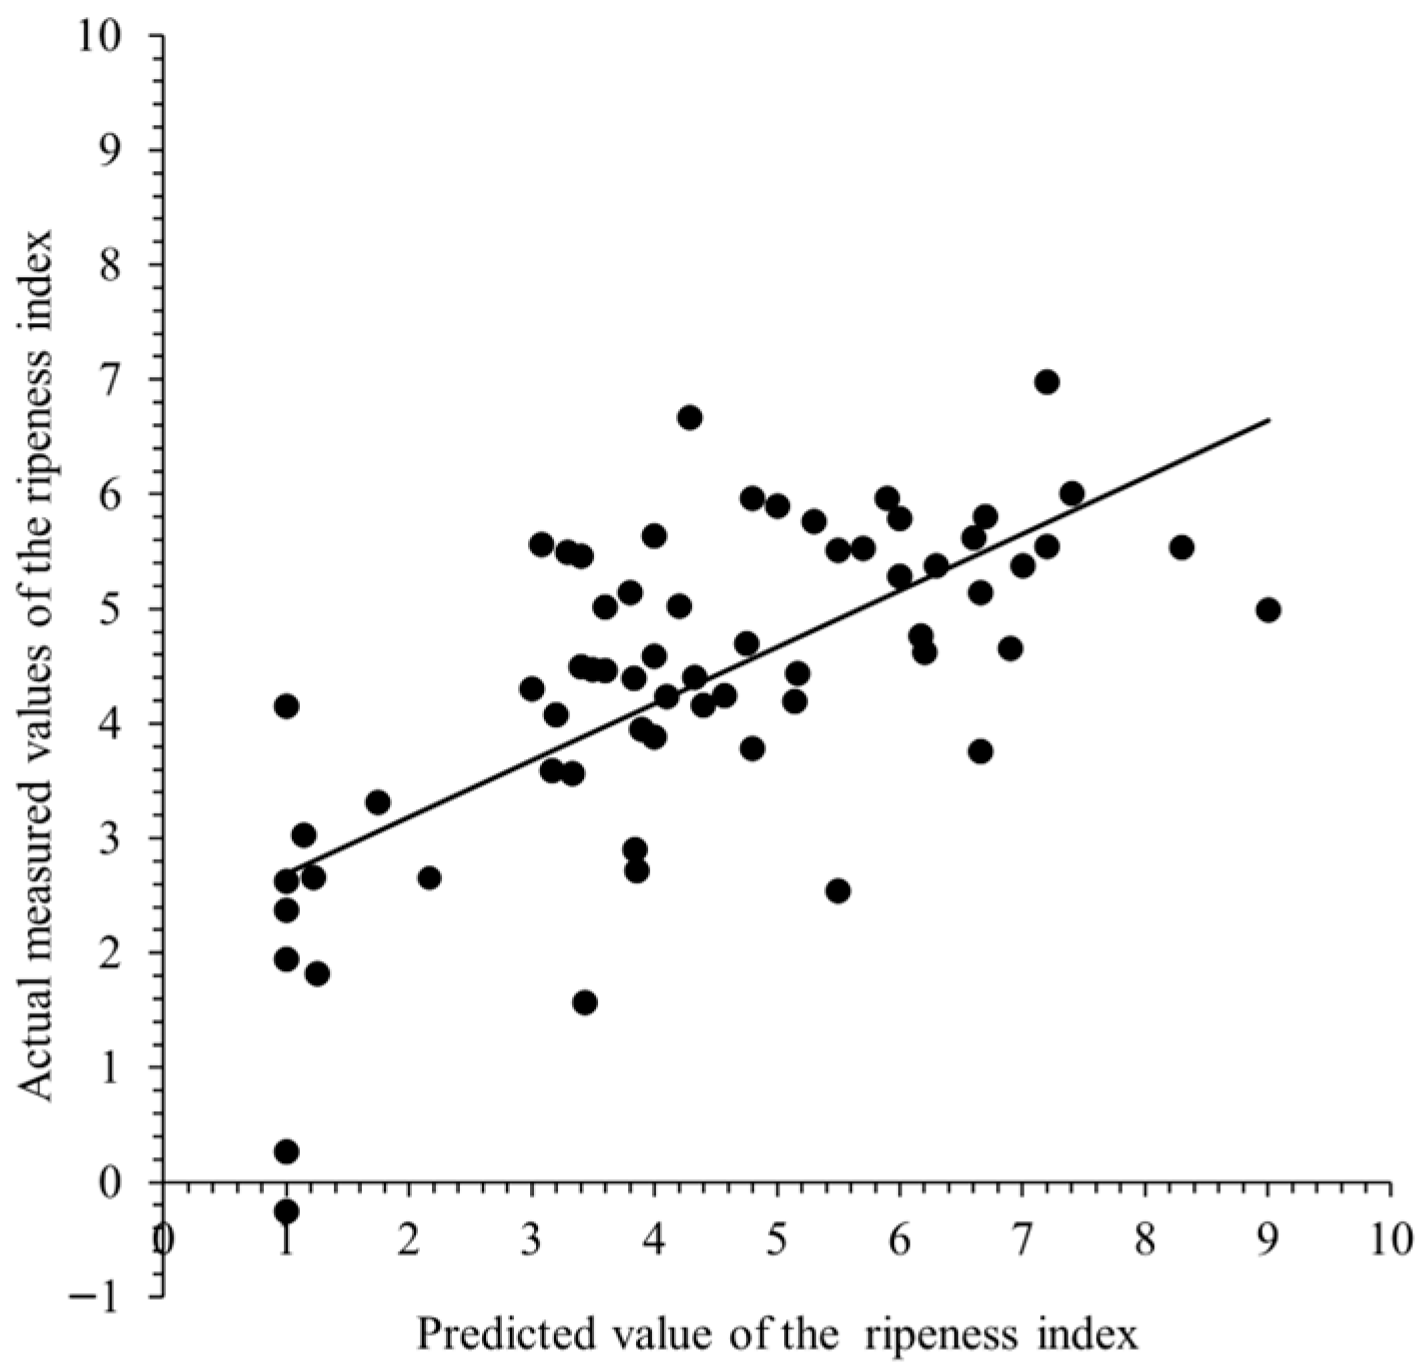
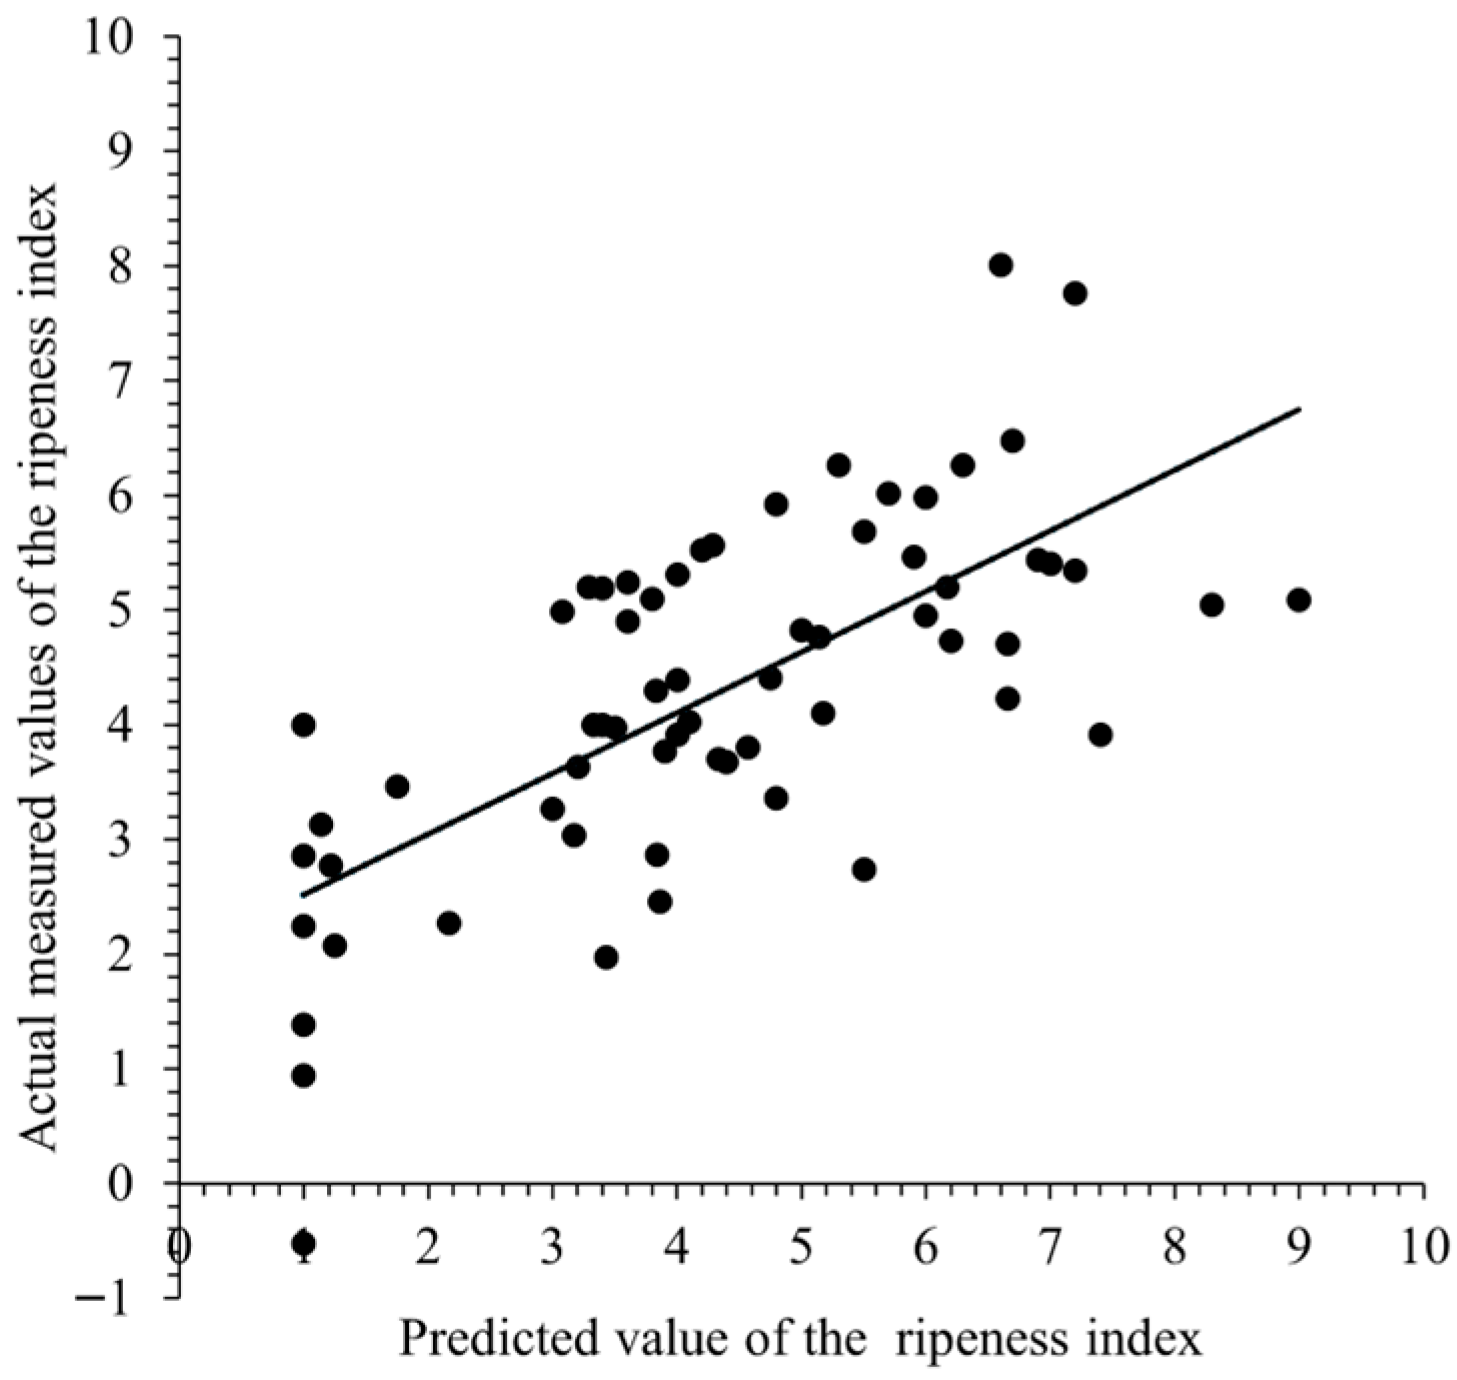
The performance of the PLS regression model based on the broadband spectra (400–700 nm and 900–1700 nm) was evaluated using repeated 10-fold cross-validation. As shown in Figure 6, the model achieved a correlation coefficient of cross-validation (rcv) of 0.687, a root mean square error of cross-validation (RMSECV) of 1.460, and a residual predictive deviation (RPD) of 1.36, utilizing 4 latent variables (LVs) selected based on the minimum RMSECV.

3.4. Analysis of VIP Scores

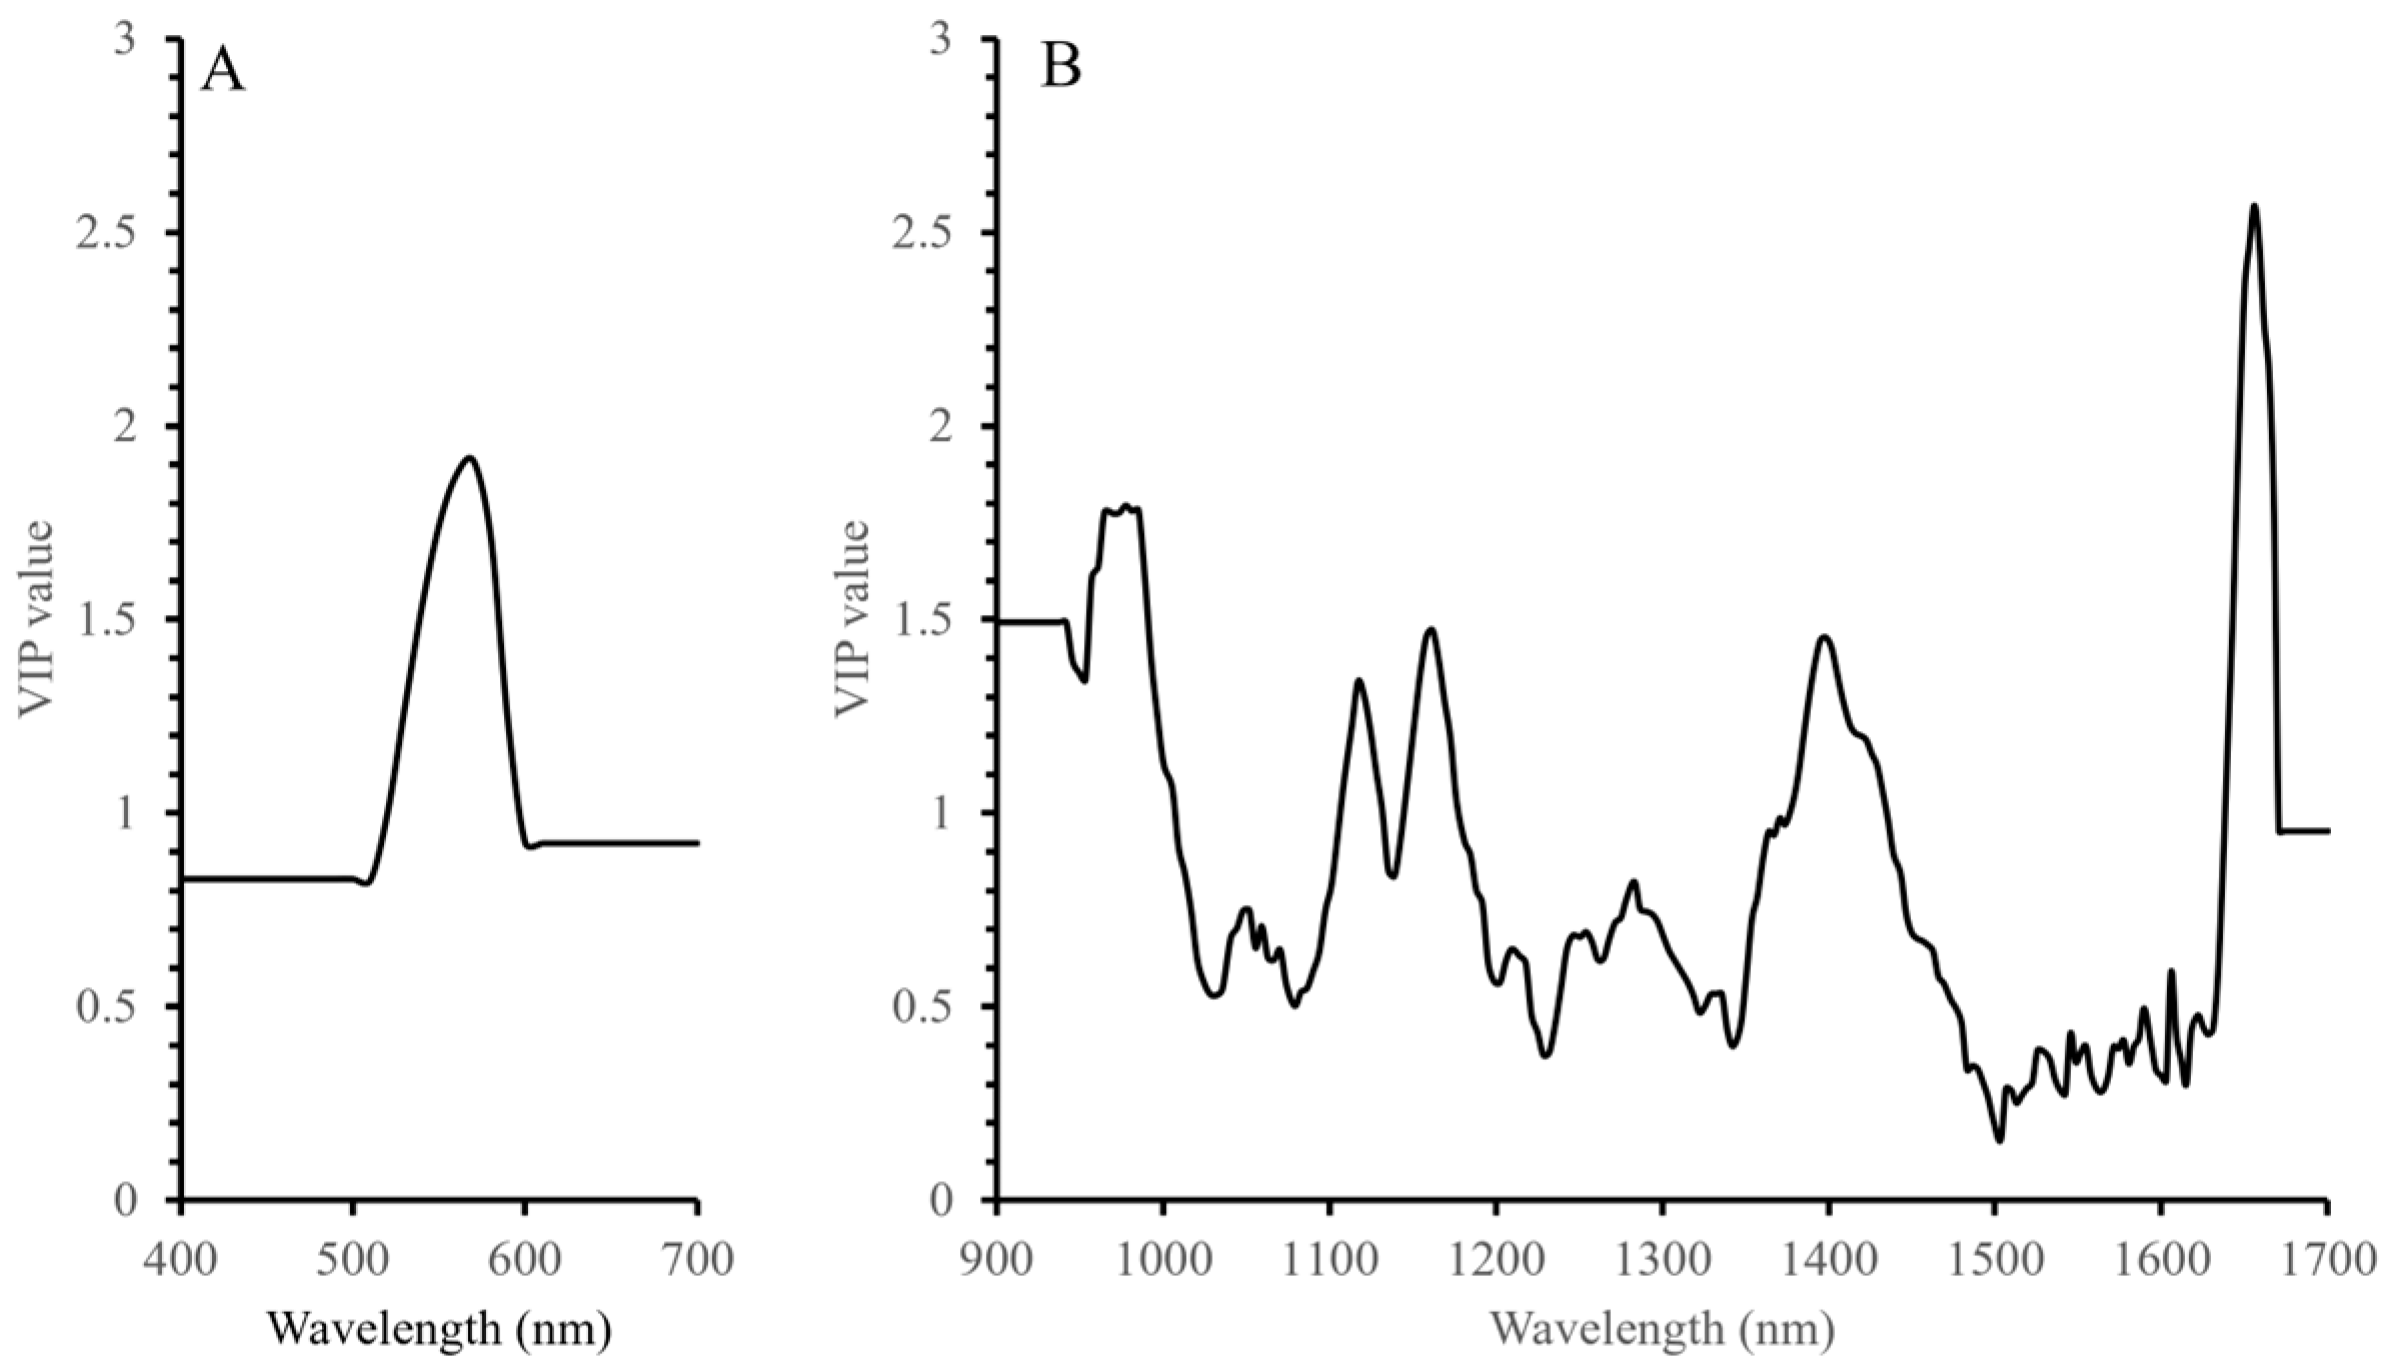
VIP scores greater than 1.0 are considered significant in the projection of PLS regression models [25,26]. The wavelength regions where the VIP score exceeded 1.0 were 520–590, 900–1005, 1108–1131, 1147–1176, 1378–1432, and 1639–1667 nm (Figure 7). Particularly high scores were observed at approximately 570, 977, 1120, 1161, 1398, 1655 nm.

3.5. PLS Model Using Selected Wavelengths

To explore the feasibility of developing a simplified handheld sensor, a PLS model was constructed using only the six specific wavelengths identified through VIP analysis (570, 977, 1120, 1161, 1398, and 1655 nm). The relationship between the measured and predicted ripeness indices for this simplified model is shown in Figure 8. The 6-wavelength model achieved a rcv of 0.696, an RMSECV of 1.370, and an RPD of 1.43, using 3 LVs selected based on the minimum RMSECV.

3.6. Estimated Relationship Between Storage Temperature and Ripening Rates

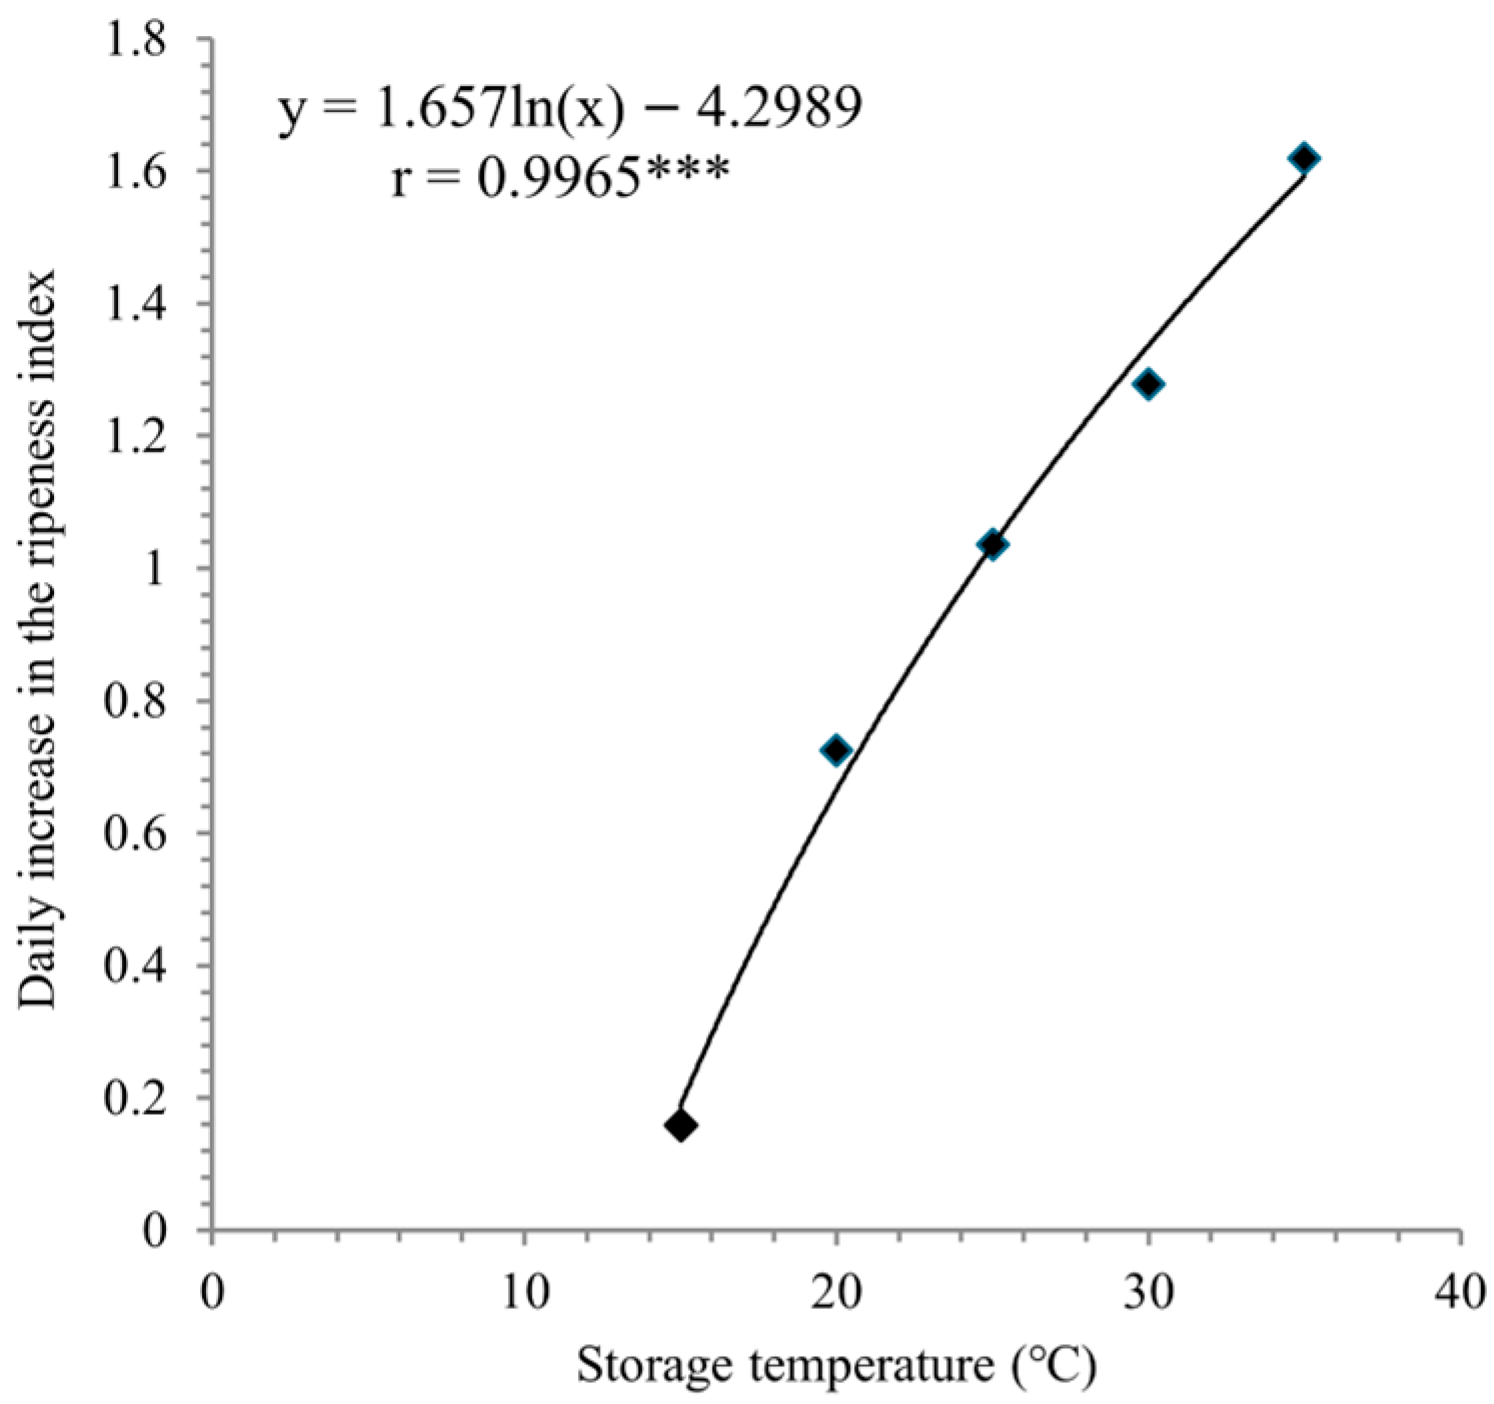
The storage temperature and the estimated daily increase in the ripeness index exhibited a significant correlation: the higher the storage temperature, the larger the increment in the predicted ripeness index (Figure 9). Based on the logarithmic approximation formula (y = 1.657 ln(x) − 4.2989, r = 0.9965), the temperature at which the increment in the ripeness index would theoretically reach zero was estimated by extrapolation to be approximately 12 °C.

4. Discussion

4.1. Reliability of Ripeness Prediction Models and the Importance of Sensory Evaluation Indicators

In this study, a non-destructive measurement method for predicting avocado ripeness based on Vis–NIR reflectance was developed. Under the rigorous repeated 10-fold cross-validation, the broadband model yielded an RPD value of 1.36 (Figure 6), while the simplified six-wavelength model achieved an RPD of 1.43 (Figure 8). Despite the use of a non-professional panel and the fact that sessions were conducted with varying sub-groups of 5 to 10 members, the high inter-rater agreement (within ±1 of the mean) suggests that our 10-point scale effectively captures the physiological progression of ripening. This consistency across different sessions and evaluators reinforces the model’s value as a preliminary screening tool that aligns with general consumer expectations. According to established criteria [24], an RPD in the range of 1.0–1.5 is considered acceptable for preliminary screening, enabling the differentiation between distinct ripeness stages such as ‘unripe,’ ‘ready-to-eat,’ and ‘over-ripe.’ This suggests that the independent pre-processing of each range successfully normalized the input data and that a multi-sensor approach, even with a spectral gap, is a viable strategy for practical field applications where all-in-one broadband portable sensors may be unavailable or cost prohibitive. On the other hand, our findings should be viewed as a preliminary proof-of-concept. While it demonstrates the feasibility of differentiating distinct ripeness stages, it is not yet ready for high-precision quantitative decision-making. Future implementation into a commercial handheld sensor would require significantly larger and more diverse datasets to enhance model robustness and achieve a higher RPD (typically > 2.0) required for reliable field applications.
Although the ripeness index increased as fruit firmness decreased, fruit firmness cannot accurately represent ripeness as perceived by consumers (Figure 2). The significance of this study lies in adopting “sensory evaluation,” which directly reflects consumer perception, as the reference standard instead of traditional physicochemical indices. Constructing a non-destructive model with a stable correlation to this sensory index provides a more consumer-centric approach to quality assessment. Although the sample size (n = 67) is relatively small, the consistent performance across validation repeats suggests that the model captures essential physiological transitions. Previous studies have demonstrated that Vis-NIR spectroscopy can effectively estimate internal quality even with similar sample sizes (n < 90) [27], supporting the validity of our approach for ripeness screening.
To enhance the practicality of this technology, we simplified the model using six wavelengths with high VIP scores. This simplified model achieved an RPD of 1.43 (Figure 8), demonstrating performance comparable to the full-wavelength model. This result suggests the possibility of developing low-cost multispectral sensors or simple LED-based instruments that measure only specific wavelength bands for practical applications. Previous study has demonstrated that sufficient accuracy can be maintained in evaluating the internal quality of apples even when selecting only a limited range of effective wavelengths [28]. To achieve practical application of these devices, further improvements in model reliability are necessary through analyses involving increased sample sizes.

4.2. Physiological Interpretation of Key Wavelengths

The PLS model achieved high predictive accuracy by capturing multiple chemical changes (pigment, moisture, and lipids) related to avocado ripeness. This is demonstrated by the alignment of the six wavelengths with high VIP scores (570, 977, 1120, 1161, 1398, 1655 nm) (Figure 7) with the major chemical changes associated with avocado ripening. Specifically, the 570 nm region in the visible spectrum corresponds to the absorption band of chlorophyll, representing the fading of the green color due to chlorophyll degradation in the peel as ripeness progresses [29]. Meanwhile, the 977 and 1398 nm regions in the near-infrared region correspond to the absorption bands related to the O-H bonds of water, reflecting changes in moisture during ripening [12,14]. Moreover, the 1120 and 1161 nm regions correspond to the absorption bands related to the C-H bonds of lipids, suggesting an increase in oil content, which is a major component of avocado flesh [9]. Furthermore, the 1655 nm region is related to lipid content and tissue structure [6]; thus, it indicates the accumulation of oil and softening of tissue as avocado ripens.
The skin of avocados changes color from green to purple/black as the fruit ripens. This color change has been reported to be associated with a decrease in chlorophyll and an increase in cyanidin 3-O-glucoside, a type of anthocyanin [29]. Cyanidin 3-O-glucoside exhibits absorption spectra that vary with pH, but possesses a main absorption band around 520 nm, appearing dark red to purple in color [30,31]. While the absorption spectrums of chlorophyll and cyanidin 3-O-glucoside can explain changes in epidermal color in the visible light range during avocado ripening, integrating near-infrared reflectance spectrums, as demonstrated in this study, is thought to enable a more detailed assessment of avocado ripeness.

4.3. Interpretation of Model-Predicted Ripening Kinetics

Another important finding of this study, derived from our predictive modeling, is the temperature-dependent progression of ripeness (Figure 9). The logarithmic relationship established between temperature and the ripening rate constant (r = 0.9965) underscores the reliability of using first-order kinetics to describe avocado spoilage. The acceleration of ripening at 35 °C compared to 15 °C follows a predictable thermal trajectory, allowing for the extrapolation of metabolic behavior at lower temperatures. Based on the logarithmic relationship between storage temperature and changes in ripeness, the threshold temperature for suppressing ripeness progression was estimated to be approximately 12 °C. In climacteric fruits like avocados, ripening is significantly inhibited at low temperatures [32,33]. This value is consistent with previous findings that chilling injury or physiological arrest in avocados often occurs below 10–12 °C [34]. The estimated threshold of 12 °C for ripening cessation provides a critical engineering parameter for refrigeration system design. Future research should integrate these biological dynamics into automated climate control systems within transport containers. By dynamically adjusting temperatures based on initial ripeness detected at origin, it may be possible to optimize energy consumption while ensuring fruit arrives at its destination at the desired stage of ripeness.
Additionally, while the current study focused on a range of 15–35 °C, this finding holds practical significance in predicting the required storage temperature to reach the optimal time when avocados can be eaten. Based on the approximation formula in Figure 9, the daily increase in ripeness at 25 °C and 15 °C can be calculated as approximately 1.89 and 0.64, respectively. Thus, it would take approximately 1.1 days for an unripe fruit (the ripeness index = 3) to reach the optimal ripeness (the ripeness index = 5) if stored at 25 °C, while it would take approximately 3.1 days if stored at 15 °C. These results show high consistency with previous physiological studies on Hass avocados. The effects of different storage temperatures (5 °C, 10 °C, 20 °C) on avocado physical (texture, color), chemical (ascorbic acid, pH), and physiological (respiratory rate) parameters were tracked, and it has been reported that higher temperatures accelerate ripening [35]. It has been reported that ‘Hass’ avocados require approximately 2 to 3 days at 25 °C and 4 to 5 days at 20 °C to reach full ripeness [36]. The value we calculated of 1.1 days at 25 °C is shorter than that in this report. This difference is thought to be due to the fact that our maturity evaluation criteria were based on sensory tests, whereas this report’s criteria were based on ethylene production.
To further quantify the temperature sensitivity of the ripening process, the temperature coefficient (Q10) was calculated. Q10 represents the factor by which the rate of a biological or chemical reaction increases for every 10 °C rise in temperature. Based on our kinetic data, the Q10 value between 15 °C and 25 °C was calculated to be approximately 2.95, while the value between 25 °C and 35 °C was 1.35. The higher Q10 in the lower temperature range indicates that avocado ripening is particularly sensitive to thermal changes when stored under cooler conditions. This finding suggests that even minor fluctuations in cold-chain maintenance (e.g., from 15 °C to 20 °C) can have a disproportionately large impact on the remaining shelf-life compared to fluctuations at higher temperatures.
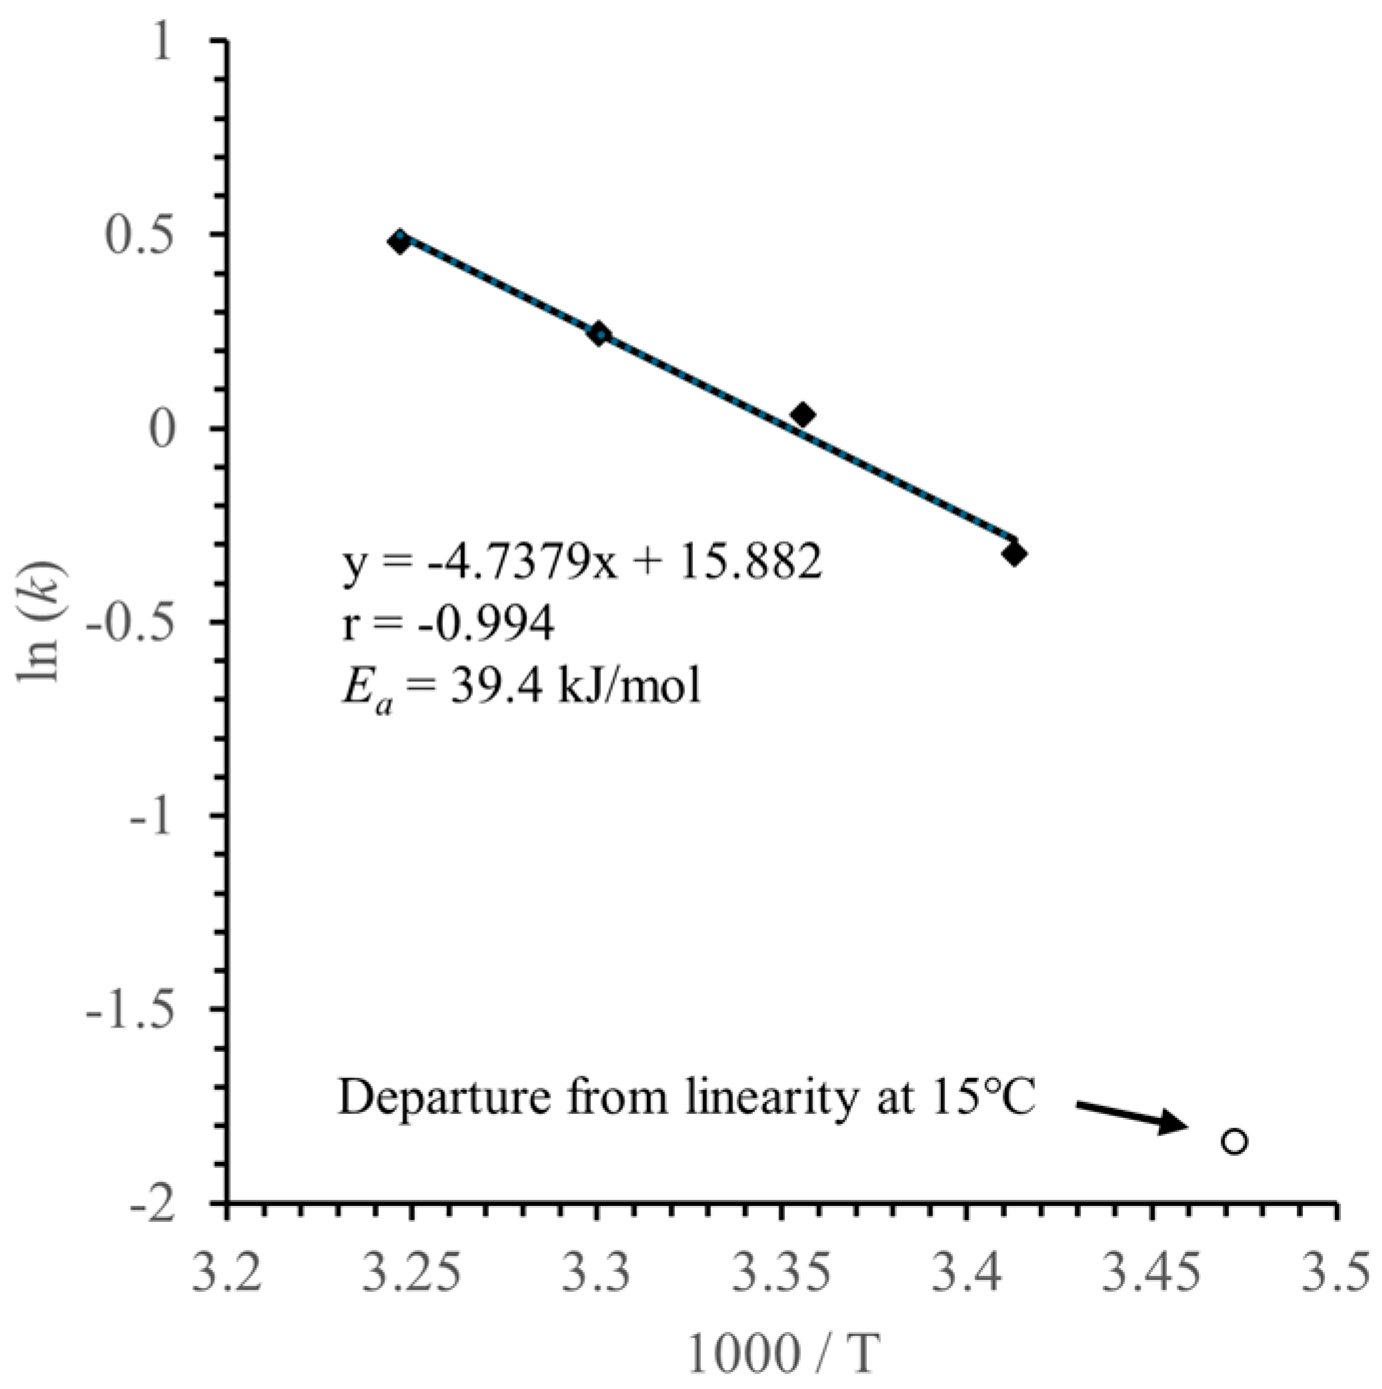
Another important finding of this study is the temperature-dependent progression of ripeness (Figure 9). The logarithmic relationship established between temperature and the ripening rate constant (r = 0.9965) underscores the reliability of using first-order kinetics to describe avocado spoilage. An exponential relationship was observed between temperature and the ripening rate constant (k), consistent with the Arrhenius equation:
k = A exp (−Ea/RT)
describing the temperature dependence of reaction rates. Plotting ln(k) versus the reciprocal of absolute temperature (1/T) enables estimation of the activation energy (Ea) for the ripening process. As shown in Figure 10, the Arrhenius plot exhibited an exceptionally high linear correlation (r = −0.994) within the temperature range of 20–35 °C. From the slope of this regression, the activation energy (Ea) for the ripening process was calculated to be 39.3 kJ/mol. This value indicates that a certain amount of thermal energy is required for the progression of biochemical reactions involved in avocado fruit softening, such as the activation of polygalacturonase (PG) and pectin methylesterase (PME) [37]. It has been reported that the rate of change in avocado ripening-related characteristics follows the Arrhenius equation with respect to temperature [38,39]. Furthermore, since the obtained data align with these fundamental thermodynamic principles, the ripening prediction model using rate constants calculated by Vis–NIR spectroscopy is considered to possess high reliability even under diverse logistics conditions. Notably, the ripening rate at 15 °C significantly deviated from I have confirmed it. the linear trend projected from the higher temperatures. This departure from the Arrhenius law at 15 °C suggests a ‘metabolic brake’ where the physiological pathways for ripening are disproportionately suppressed as the temperature approaches the critical threshold for storage. This non-linear behavior supports our hypothesis that maintaining temperatures at or below 15 °C effectively induces a state of partial physiological dormancy, thereby significantly extending the shelf-life of the fruit.
A key limitation of the kinetic analysis in this study is the reliance on model-predicted values as a proxy for ripeness. Since no independent sensory or firmness measurements were conducted during the time-course of Experiment 2, the calculated parameters such as Q10 and Ea should be regarded as apparent values reflecting the temperature sensitivity of the spectral features associated with ripening. However, the strong alignment of these spectral changes with the Arrhenius law (r = 0.9965) suggests that the Vis-NIR model effectively captures the underlying thermal sensitivity of avocado physiology, consistent with previous studies using destructive methods.
Furthermore, our extrapolation of the model-predicted index suggests that spectral changes associated with ripening are significantly suppressed at a temperature threshold of approximately 12 °C. This aligns with physiological observations that low temperatures inhibit the enzymatic processes of softening, although direct physiological verification remains a critical task for future study to confirm whether this spectral stability fully corresponds to biological dormancy.

4.4. Economic Feasibility and Practical Application

The practical application of the proposed method demonstrates the potential to reduce post-harvest losses throughout the supply chain. Integration into IoT-enabled devices could enable retail staff to perform non-destructive ripeness assessments. Furthermore, the temperature-dependent kinetics enable ‘dynamic best-before date’ labeling and FEFO (First-Expired-First-Out) strategies. From an economic perspective, while high-precision spectrometers cost over $10,000, a multispectral approach using key wavelengths could reduce costs to under $500, potentially delivering rapid ROI by optimizing sales timing.

4.5. Study Limitations and Future Perspectives

This study has several limitations that point to future directions for research. First, measurements were taken at only three points; increasing this could improve accuracy. Second, While the panel pool was expanded to include diverse age groups and genders, the number of participants per session was relatively small (5–10 members). Future studies involving larger, multi-regional consumer groups are necessary to generalize the ripeness index further. Third, behavior below 12 °C was estimated by extrapolation; direct verification remains a challenge.
Most importantly, while the simplified 6-wavelength model demonstrated stable screening performance (RPD = 1.43), it is essential to emphasize that this represents a preliminary proof-of-concept. According to NIR spectroscopy standards, an RPD in this range suggests limited predictive power, suitable mainly for distinguishing ‘high’ vs. ‘low’ values rather than high-precision quantitative decision-making. Future implementation into commercial handheld sensors requires overcoming the inherent S/N ratio limitations of low-cost photodetectors and validating the model with significantly larger, multi-seasonal datasets. Extending this framework to other varieties (e.g., Fuerte, Reed) and developing broader spectral libraries are critical next steps before this technology can be deployed for definitive retail inventory management.

5. Conclusions

In this study, a practical non-destructive framework for predicting avocado ripeness was established by integrating cost-effective Vis–NIR reflectance technology with a consumer-centric sensory index. The predictive performance of the PLS regression model, validated through a rigorous repeated 10-fold cross-validation, demonstrates its significant potential as a tool for on-site quality screening. By correlating spectral data with holistic human perception, this method provides a more realistic assessment of ripeness compared to traditional firmness-based evaluations. In addition, the identification of six key wavelengths (570, 977, 1120, 1161, 1398, and 1655 nm) provides a mathematical foundation for developing simplified, handheld sensors capable of maintaining stable screening accuracy (RPD = 1.43). Such devices could be deployed throughout the supply chain, from distribution centers to retail shelves, enabling non-specialists to assess ripeness based on objective data. Moreover, the temperature-dependent nature of avocado ripening enabled estimation of a threshold temperature (≤12 °C) that inhibits ripening and prediction of the number of days required to reach optimal eating window (optimal ripeness) at specific storage temperatures. These findings provide a quantitative framework for optimizing avocado logistics and reducing postharvest waste.
These findings provide actionable quantitative guidance for distributors and retailers to transition from static best-by dates to dynamic, quality-based shelf-life management. Ultimately, the introduction of this visible–near-infrared spectroscopy framework directly supports global efforts to reduce post-harvest food loss (SDG 12) by ensuring avocados reach consumers at peak sensory quality, thereby contributing to waste minimization and enhancing the economic sustainability of the tropical fruit industry.
Future research should explore the applicability of this framework to other climacteric fruits, such as mangoes and papayas, which face similar postharvest challenges. By establishing a digital ‘sensory standard,’ this study paves the way for a more objective and transparent global fruit trade.

Author Contributions

Conceptualization, A.O.; formal analysis, A.O. and N.Y.; investigation, M.T., R.N. and R.C.; methodology, A.O.; visualization, A.O.; writing the original draft, A.O. All authors have read and agreed to the published version of the manuscript.

Funding

This research received no external funding.

Institutional Review Board Statement

This study was conducted in accordance with the Declaration of Helsinki, and the protocol was approved by the Akita Prefectural University Research Ethics Review Committee on 24 March 2026. The approval is dated after the study was conducted because the application to the IRB was delayed. The Akita Prefectural University Research Ethics Review Committee reviewed the research content and granted retroactive approval to the IRB on the current date, in the case of delayed submission.

Informed Consent Statement

Informed consent for participation was obtained from all subjects involved in the study.

Data Availability Statement

The data presented in this study are available upon request from the Corresponding author.

Conflicts of Interest

Author Nana Yamamoto was employed by OAK Co., Ltd. The remaining authors declare that the research was conducted in the absence of any commercial or financial relationships that could be construed as a potential conflict of interest.

Abbreviations

The following abbreviations are used in this manuscript:
VISVisible
NIRNear-infrared
rcvCorrelation coefficient of cross-validation
RMSECVRoot mean square error of cross-validation
PLSPartial least squares
RPDResidual predictive deviation
VIPVariable importance in projection

References

  1. FAO. FAOSTAT Database. Available online: https://www.fao.org/faostat/en/#data/QCL (accessed on 13 November 2025).
  2. Abebe, A.; Kuma, B.; Zemedu, L. Assessment of postharvest loss of avocado at producers level (Case of Wolaita and KembataTembaro zones). J. Agric. Crops 2023, 8, 364–374. [Google Scholar] [CrossRef] [Scilit]
  3. Kassim, A.; Workneh, T.; Bezuidenhout, C. A review on postharvest handling of avocado fruit. Afr. J. Agric. Res. 2013, 8, 2385–2402. [Google Scholar]
  4. Pinto, J.; Rueda-Chacón, H.; Arguello, H. Classification of Hass avocado (Persea americana mill) in terms of its ripening via hyperspectral images. TecnoLógicas 2019, 22, 111–130. [Google Scholar] [CrossRef] [Scilit]
  5. Lindén, M. Avocado Innovation Reduces Food Waste and Consumer Disappointment. Available online: https://www.new-nutrition.com/nnbBlog/display/164 (accessed on 18 February 2026).
  6. Olarewaju, O.O.; Bertling, I.; Magwaza, L.S. Non-destructive evaluation of avocado fruit maturity using near infrared spectroscopy and PLS regression models. Sci. Hortic. 2016, 199, 229–236. [Google Scholar] [CrossRef] [Scilit]
  7. Sommaruga, R.; Eldridge, H.M. Avocado production: Water footprint and socio-economic implications. EuroChoices 2021, 20, 48–53. [Google Scholar] [CrossRef] [Scilit]
  8. Fu, X.; Ying, Y.; Liu, Y. Near-infrared spectroscopy for sugar-content detection of Fuji apples using optical fiber. PIE Proc. III 2004, 5589, 316–324. [Google Scholar] [CrossRef] [Scilit]
  9. Kawano, S.; Fujiwara, T.; Iwamoto, M. Nondestructive determination of sugar content in satsuma mandarin using near infrared (NIR) transmittance. J. Jpn. Soc. Hortic. Sci. 1993, 62, 465–470. [Google Scholar] [CrossRef] [Scilit]
  10. Tamburini, E.; Costa, S.; Rugiero, I.; Pedrini, P.; Marchetti, M.G. Quantification of lycopene, β-carotene, and total soluble solids in intact red-flesh watermelon (Citrullus lanatus) using on-line near-infrared spectroscopy. Sensors 2017, 17, 746. [Google Scholar] [CrossRef] [Scilit]
  11. Zhu, F.; Zhang, H.; Shao, Y.; He, Y.; Ngadi, M.O. Mapping of fat and moisture distribution in Atlantic salmon using near-infrared hyperspectral imaging. Food Bioprocess Technol. 2014, 7, 1208–1214. [Google Scholar] [CrossRef] [Scilit]
  12. Mishra, P.; Herrmann, I.; Angileri, M. Improved prediction of potassium and nitrogen in dried bell pepper leaves with visible and near-infrared spectroscopy utilising wavelength selection techniques. Talanta 2021, 225, 121971. [Google Scholar] [CrossRef] [Scilit]
  13. Wang, X.; Wu, C.; Hirafuji, M. Visible light image-based method for sugar content classification of citrus. PLoS ONE 2016, 11, e0147419. [Google Scholar] [CrossRef] [Scilit] [PubMed]
  14. Xiong, Y.; Ohashi, S.; Nakano, K.; Jiang, W.; Takizawa, K.; Iijima, K.; Maniwara, P. Application of the radial basis function neural networks to improve the nondestructive Vis/NIR spectrophotometric analysis of potassium in fresh lettuces. J. Food Eng. 2021, 298, 110417. [Google Scholar] [CrossRef] [Scilit]
  15. Islam, M.; Wahid, K.; Dinh, A. Assessment of ripening degree of avocado by electrical impedance spectroscopy and support vector machine. J. Food Qual. 2018, 2018, 4706147. [Google Scholar] [CrossRef] [Scilit]
  16. Flitsanov, U.; Mizrach, A.; Liberzon, A.; Akerman, M.; Zauberman, G. Measurement of avocado softening at various temperatures using ultrasound. Postharvest Biol. Technol. 2000, 20, 279–286. [Google Scholar] [CrossRef] [Scilit]
  17. Phanomsophon, T.; Jaisue, N.; Worphet, A.; Tawinteung, N.; Khurnpoon, L.; Lapcharoensuk, R.; Krusong, W.; Pornchaloempong, P.; Sirisomboon, P.; Inagaki, T.; et al. Primary assessment of macronutrients in durian (CV Monthong) leaves using near infrared spectroscopy with wavelength selection. Spectrochim. Acta. A Mol. Biomol. Spectrosc. 2024, 304, 123398. [Google Scholar] [CrossRef] [Scilit]
  18. Wang, C.; Li, X.; Wang, L.; Yang, C.; Chen, X.; Li, M.; Ma, S. Prediction of N, P, and K contents in sugarcane leaves by VIS-NIR spectroscopy and modeling of NPK interaction effects. Trans. ASABE 2019, 62, 1427–1433. [Google Scholar] [CrossRef] [Scilit]
  19. Yarce, C.J.; Rojas, G. Near infrared spectroscopy for the analysis of macro and micro nutrients in sugarcane leaves. Sugar Ind. 2012, 137, 707. [Google Scholar] [CrossRef] [Scilit]
  20. Yamamoto, N.; Kashimoto, Y.; Ogawa, A. Non-destructive measurement of potassium content in low-potassium radish and turnip using visible near-infrared spectroscopy. Environ. Control Biol. 2024, 62, 87–93. [Google Scholar] [CrossRef] [Scilit]
  21. Yamamoto, N.; Kashimoto, Y.; Ogawa, A. Non-destructive measurement of potassium content in low-potassium leaf vegetables for CKD using visible and near-infrared spectroscopy. Environ. Control Biol. 2026, 64, 1–12. [Google Scholar] [CrossRef] [Scilit]
  22. Blakey, R.; Van Rooyen, Z.; Berry, J.; Elliott, M.; Rusby, S. Successes and Challenges of Near-Infrared Spectroscopy in the Avocado Value Chain. In Proceedings of the VIII World Avocado Congress, Lima, Peru, 13–18 September 2015; pp. 410–416. [Google Scholar]
  23. ISO 8586:2012; Sensory Analysis—General Guidelines for the Selection, Training and Monitoring of Selected Assessors and Expert Sensory Assessors. International Organization for Standardization: Geneva, Switzerland, 2012.
  24. Ge, Y.; Atefi, A.; Zhang, H.; Miao, C.; Ramamurthy, R.K.; Sigmon, B.; Yang, J.; Schnable, J.C. High-throughput analysis of leaf physiological and chemical traits with VIS–NIR–SWIR spectroscopy: A case study with a maize diversity panel. Plant Methods 2019, 15, 66. [Google Scholar] [CrossRef] [Scilit] [PubMed]
  25. Ma, M.; Ma, X.; Xie, Y.; Ma, T. Analysis the relationship between ecological footprint (EF) of ningxia and influencing factors: Partial Least-Squares Regression (PLS). Acta Ecol. Sin. 2014, 34, 682–689. [Google Scholar] [CrossRef] [Scilit]
  26. Chong, I.-G.; Jun, C.-H. Performance of some variable selection methods when multicollinearity is present. Chemom. Intell. Lab. Syst. 2005, 78, 103–112. [Google Scholar] [CrossRef] [Scilit]
  27. Najjar, K.; Abu-Khalaf, N. Non-destructive quality measurement for three varieties of tomato using VIS/NIR spectroscopy. Sustainability 2021, 13, 10747. [Google Scholar] [CrossRef] [Scilit]
  28. Mehl, P.; Chao, K.; Kim, M.; Chen, Y. Detection of defects on selected apple cultivars using hyperspectral and multispectral image analysis. Appl. Eng. Agric. 2002, 18, 219. [Google Scholar] [CrossRef] [Scilit]
  29. Cox, K.A.; McGhie, T.K.; White, A.; Woolf, A.B. Skin colour and pigment changes during ripening of ‘Hass’ avocado fruit. Postharvest Biol. Technol. 2004, 31, 287–294. [Google Scholar] [CrossRef] [Scilit]
  30. Olivas-Aguirre, F.J.; Rodrigo-García, J.; Martínez-Ruiz, N.d.R.; Cárdenas-Robles, A.I.; Mendoza-Díaz, S.O.; Álvarez-Parrilla, E.; González-Aguilar, G.A.; De la Rosa, L.A.; Ramos-Jiménez, A.; Wall-Medrano, A. Cyanidin-3-O-glucoside: Physical-chemistry, foodomics and health effects. Molecules 2016, 21, 1264. [Google Scholar] [CrossRef] [Scilit]
  31. Asen, S.; Norris, K.; Stewart, R. Absorption spectra and color of aluminium-cyanidin 3-glucoside complexes as influenced by pH. Phytochemistry 1969, 8, 653–659. [Google Scholar] [CrossRef] [Scilit]
  32. Woolf, A.B.; Cox, K.A.; White, A.; Ferguson, I.B. Low temperature conditioning treatments reduce external chilling injury of ‘Hass’ avocados. Postharvest Biol. Technol. 2003, 28, 113–122. [Google Scholar] [CrossRef] [Scilit]
  33. Chen, J.; Liu, X.; Li, F.; Li, Y.; Yuan, D. Cold shock treatment extends shelf life of naturally ripened or ethylene-ripened avocado fruits. PLoS ONE 2017, 12, e0189991. [Google Scholar] [CrossRef] [Scilit]
  34. Yahia, E.M.; Woolf, A.B. Avocado (Persea americana Mill.). In Postharvest Biology and Technology of Tropical and Subtropical Fruits: Açai to Citrus; Yahia, E.M., Ed.; Woodhead Publishing: Cambridge, UK, 2011; Volume 2, pp. 125–185. [Google Scholar]
  35. Maftoonazad, N.; Ramaswamy, H. Effect of pectin-based coating on the kinetics of quality change associated with stored avocados. J. Food Process. Preserv. 2008, 32, 621–643. [Google Scholar] [CrossRef] [Scilit]
  36. Eaks, I.L. Ripening, respiration, and ethylene production of ‘Hass’ avocado fruits at 20 to 40 C. J. Am. Soc. Hortic. Sci. 1978, 103, 576–578. [Google Scholar] [CrossRef] [Scilit]
  37. Defilippi, B.G.; Ejsmentewicz, T.; Covarrubias, M.P.; Gudenschwager, O.; Campos-Vargas, R. Changes in cell wall pectins and their relation to postharvest mesocarp softening of “Hass” avocados (Persea americana Mill.). Plant Physiol. Biochem. 2018, 128, 142–151. [Google Scholar] [CrossRef] [Scilit] [PubMed]
  38. Sierra, N.M.; Londoño, A.; Gómez, J.M.; Herrera, A.O.; Castellanos, D.A. Evaluation and modeling of changes in shelf life, firmness and color of ‘Hass’ avocado depending on storage temperature. Food Sci. Technol. Int. 2019, 25, 370–384. [Google Scholar] [CrossRef] [Scilit] [PubMed]
  39. Gwanpua, S.G.; Qian, Z.; East, A.R. Modelling ethylene regulated changes in ‘Hass’ avocado quality. Postharvest Biol. Technol. 2018, 136, 12–22. [Google Scholar] [CrossRef] [Scilit]
Figure 1. Portable spectrometers used for reflectance measurements. (A): Spectro1 for visible light reflectance (wavelength range: 400–700 nm), (B): NIR-S-G1 for near-infrared reflectance (wavelength range: 900–1700 nm). Measurements were taken at three random locations per fruit sample.
Agriengineering 08 00130 g001
Figure 2. Visual examples of the ‘Hass’ avocado ripeness scale based on sensory evaluation. The index ranges from 1 (immature) to 5 (optimal) and 10 (overripe), showing the corresponding external appearance (top) and cut surface (bottom).
Agriengineering 08 00130 g002
Figure 3. Relationship between fruit firmness (kgf/cm2) and the sensory-based ripeness index. *** indicates significance at the 0.1% level.
Agriengineering 08 00130 g003
Figure 4. Original reflectance spectra of all avocado samples (n = 67) in the visible (400–700 nm) (A) and near-infrared (900–1700 nm) (B) regions.
Agriengineering 08 00130 g004
Figure 5. Second-derivative spectra calculated from the original reflectance spectra shown in Figure 4 (preprocessing: Savitzky–Golay method) in the visible (400–700 nm) (A) and near-infrared (900–1700 nm) (B) regions.
Agriengineering 08 00130 g005
Figure 6. Partial least squares regression plot repeated 10-fold cross-validation for the prediction of the sensory-based ripeness index using the full Vis-NIR wavelength region (second-derivative spectra).
Agriengineering 08 00130 g006
Figure 7. Variable importance in projection (VIP) scores from the partial least squares regression model, indicating the contribution of each wavelength to the ripeness prediction in the visible (400–700 nm) (A) and near-infrared (900–1700 nm) (B) regions.
Agriengineering 08 00130 g007
Figure 8. Partial least squares regression plot repeated 10-fold cross-validation for the prediction of the sensory-based ripeness index using only the six selected wavelengths identified from the variable importance in projection scores (570, 977, 1120, 1161, 1398, and 1655 nm).
Agriengineering 08 00130 g008
Figure 9. Relationship between storage temperature (°C) and the rate of ripening progression (increase in ripeness index per day). *** indicates significance at the 0.1% level.
Agriengineering 08 00130 g009
Figure 10. Arrhenius plot for the ripening rate constant (k) of Hass avocados. The natural logarithm of k is plotted against the reciprocal of absolute temperature (1/T × 103). The linear regression (y = −4.722x + 15.828, r = −0.994) was calculated using data from 20 to 35 °C. The data point at 15 °C (open circle) was excluded from the regression to highlight the physiological transition and inhibition of enzymatic activity at lower temperatures.
Agriengineering 08 00130 g010
Disclaimer/Publisher’s Note: The statements, opinions and data contained in all publications are solely those of the individual author(s) and contributor(s) and not of MDPI and/or the editor(s). MDPI and/or the editor(s) disclaim responsibility for any injury to people or property resulting from any ideas, methods, instructions or products referred to in the content.