Can Visceral Adiposity Index Serve as a Simple Tool for Identifying Individuals with Insulin Resistance in Daily Clinical Practice?

 , ,
, ,
Abstract
:1. Introduction
2. Material and Methods
2.1. Study Subjects
2.2. Laboratory Analysis
2.3. Statistical Analysis
3. Results
3.1. Characteristics of the Study Population
3.2. VAI Cut-Offs
3.3. Correlation Analysis
3.4. Regression Analysis—Prediction of HOMA-IR
4. Discussion
5. Conclusions
Author Contributions
Funding
Conflicts of Interest
References
- Paniagua, J.A. Nutrition, insulin resistance and dysfunctional adipose tissue determine the different components of metabolic syndrome. World J. Diabetes 2016, 7, 483–514. [Google Scholar] [CrossRef] [PubMed]
- World Health Organization. The Top 10 Causes of Death. Available online: https://www.who.int/news-room/fact-sheets/detail/the-top-10-causes-of-death (accessed on 19 June 2019).
- Kassi, E.; Pervanidou, P.; Kaltsas, G.; Chrousos, G. Metabolic syndrome: Definitions and controversies. BMC Med. 2011, 9, 48. [Google Scholar] [CrossRef]
- Xu, H.; Li, X.; Adams, H.; Kubena, K.; Guo, S. Etiology of Metabolic syndrome and dietary intervention. Int. J. Mol. Sci. 2019, 20, 128. [Google Scholar] [CrossRef] [PubMed]
- Eckel, N.; Li, Y.; Kuxhaus, O.; Stefan, N.; Hu, F.B.; Schulze, M.B. Transition from metabolic healthy to unhealthy phenotypes and association with cardiovascular disease risk across BMI categories in 90,257 women (the Nurses’ Health Study): 30-year follow-up from a prospective cohort study. Lancet Diabetes Endocrinol. 2018, 6, 714–724. [Google Scholar] [CrossRef]
- Kramer, C.K.; Zinman, B.; Retnakaran, R. Are metabolically healthy overweight and obesity benign conditions? A systematic review and meta-analysis. Ann. Intern. Med. 2013, 159, 758–769. [Google Scholar] [CrossRef] [PubMed]
- Liu, C.; Wang, C.; Guan, S.; Liu, H.; Wu, X.; Zhang, Z.; Gu, X.; Zhang, Y.; Zhao, Y.; Tse, L.A.; et al. The prevalence of metabolically healthy and unhealthy obesity according to different criteria. Obes. Facts 2019, 12, 78–90. [Google Scholar] [CrossRef] [PubMed]
- Wallace, T.M.; Levy, J.C.; Matthews, D.R. Use and abuse of HOMA modeling. Diabetes Care 2004, 27, 1487–1495. [Google Scholar] [CrossRef] [PubMed]
- Amato, M.C.; Pizzolanti, G.; Torregrossa, V.; Misiano, G.; Milano, S.; Giordano, G. Visceral adiposity index (VAI) is predictive of an altered adipokine profile in patients with type 2 diabetes. PLoS ONE 2014, 9, e91969. [Google Scholar] [CrossRef] [PubMed]
- Alberti, K.G.M.M.; Eckel, R.H.; Grundy, S.M.; Zimmet, P.Z.; Cleeman, J.I.; Donato, K.A.; Fruchart, J.C.; James, W.P.T.; Loria, C.M.; Smith, S.C. Harmonizing the metabolic syndrome: A joint interim statement of the international diabetes federation task force on epidemiology and prevention; national heart, lung, and blood institute; American heart association; world heart federation; international atherosclerosis society; and international association for the study of obesity. Circulation 2009, 120, 1640–1645. [Google Scholar] [CrossRef] [PubMed]
- Ruopp, M.D.; Perkins, N.J.; Whitcomb, B.W.; Schisterman, E.F. Youden Index and optimal cut-point estimated from observations affected by a lower limit of detection. Biom. J. 2008, 50, 419–430. [Google Scholar] [CrossRef] [PubMed]
- Tang, Q.; Li, X.; Song, P.; Xu, L. Optimal cut-off values for the homeostasis model assessment of insulin resistance (HOMA-IR) and pre-diabetes screening: Developments in research and prospects for the future. Drug Discov. Ther. 2015, 9, 380–385. [Google Scholar] [CrossRef] [PubMed] [Green Version]
- Horakova, D.; Stepanek, L.; Nagelova, R.; Pastucha, D.; Azeem, K.; Kollarova, H. Total and high-molecular-weight adiponectin levels and prediction of insulin resistance. Endokrynol. Pol. 2018, 69, 375–380. [Google Scholar] [CrossRef] [PubMed]
- Dobiasova, M.; Frohlich, J. The plasma parameter log (TG/HDL-C) as an atherogenic index: Correlation with lipoprotein particle size and esterification rate inapob-lipoprotein-depleted plasma (FERHDL). Clin. Biochem. 2001, 34, 583–588. [Google Scholar] [CrossRef]
- Pekgor, S.; Duran, C.; Berberoglu, U.; Eryilmaz, M.A. The role of visceral adiposity index levels in predicting the presence of metabolic syndrome and insulin resistance in overweight and obese patients. Metab. Syndr. Relat. Disord. 2019, 17, 296–302. [Google Scholar] [CrossRef] [PubMed]
- Amato, M.C.; Giordano, C.; Pitrone, M.; Galluzzo, A. Cut-off points of the visceral adiposity index (VAI) identifying a visceral adipose dysfunction associated with cardiometabolic risk in a Caucasian Sicilian population. Lipids Health Dis. 2011, 10, 183. [Google Scholar] [CrossRef] [PubMed]
- Liu, P.J.; Ma, F.; Lou, H.P.; Chen, Y. Visceral adiposity index is associated with pre-diabetes and type 2 diabetes mellitus in Chinese adults aged 20–50. Ann. Nutr. Metab. 2016, 68, 235–243. [Google Scholar] [CrossRef] [PubMed]
- Jabłonowska-Lietz, B.; Wrzosek, M.; Włodarczyk, M.; Nowicka, G. New indexes of body fat distribution, visceral adiposity index, body adiposity index, waist-to-height ratio, and metabolic disturbances in the obese. Kardiol. Pol. 2017, 75, 1185–1191. [Google Scholar] [CrossRef] [PubMed] [Green Version]
- Krishna, S.V.T.; Kota, S.K.; Modi, K.D. Glycemic variability: Clinical implications. Indian J. Endocrinol. Metab. 2013, 17, 611–619. [Google Scholar] [CrossRef]
- Li, R.; Li, Q.; Cui, M.; Ying, Z.; Li, L.; Zhong, T.; Huo, Y.; Xie, P. Visceral adiposity index, lipid accumulation product and intracranial atherosclerotic stenosis in middle-aged and elderly Chinese. Sci. Rep. 2017, 7, 7951. [Google Scholar] [CrossRef]
- Randrianarisoa, E.; Lehn-Stefan, A.; Hieronimus, A.; Rietig, R.; Fritsche, A.; Machann, J.; Balletshofer, B.; Häring, H.U.; Stefan, N.; Rittig, K. Visceral adiposity index as an independent marker of subclinical atherosclerosis in individuals prone to diabetes mellitus. J. Atheroscler. Thromb. 2019, 47274. [Google Scholar] [CrossRef]
- Biswas, E.; Choudhury, A.K.; Amin, M.R.; Khalequzzaman, M.; Chowdhury, S.; Kabir, F.I.; Sakib, M.M.; Mahabub, E.E.; Singha, C.K. Visceral adiposity index score is the better predictor of clinical and coronary angiographic severity assessment than other adiposity indices in patients with acute coronary syndrome. Mymensingh Med. J. 2019, 28, 382–388. [Google Scholar] [PubMed]
- Ma, C.M.; Liu, X.L.; Lu, N.; Wang, R.; Lu, Q.; Yin, F.Z. Hypertriglyceridemic waist phenotype and abnormal glucose metabolism: A system review and meta-analysis. Endocrine 2019, 64, 469–485. [Google Scholar] [CrossRef] [PubMed]
- Marra, N.F.; Bechere Fernandes, M.T.; de Melo, M.E.; da Cruz, R.M.; Tess, B.H. Fasting insulin resistance affects the prevalence of metabolically healthy obesity in Brazilian adolescents. Acta Paediatr. 2019, 108, 1295–1302. [Google Scholar] [CrossRef] [PubMed]
- Khawaja, K.I.; Mian, S.A.; Fatima, A.; Tahir, G.M.; Khan, F.F.; Burney, S.; Hasan, A.; Masud, F. Phenotypic and metabolic dichotomy in obesity: Clinical, biochemical and immunological correlates of metabolically divergent obese phenotypes in healthy South Asian adults. Singap. Med. J. 2018, 59, 431–438. [Google Scholar] [CrossRef] [PubMed]

| Characteristics | Group A | Group B | Group C |
|---|---|---|---|
| Mean ± SD (Median) | Mean ± SD (Median) | Mean ± SD (Median) | |
| n | 256 (F164, M92) | 301 (F153, M148) | 226 (F109, M117) |
| Age (years) | 41.4 ± 14.6 (39.0) | 46.0 ± 14.5 (47.0) | 52.8 ± 12.1 (54.0) |
| Glucose (mmol/L) | 4.78 ± 0.44 (4.80) | 5.11 ± 0.66 (5.07) | 5.92 ± 1.24 (5.80) |
| Insulin (mIU/L) | 6.53 ± 3.45 (6.00) | 8.29 ± 4.40 (7.40) | 15.26 ± 10.96 (13.70) |
| Total cholesterol (mmol/L) * | 5.87 ± 1.39 (5.81) | 6.34 ± 1.49 (6.34) | 6.67 ± 1.92 (6.33) |
| HDL cholesterol (mmol/L) | 1.78 ± 0.43 (1.71) | 1.41 ± 0.37 (1.35) | 1.14 ± 0.34 (1.09) |
| LDL cholesterol (mmol/L) ** | 3.58 ± 1.32 (3.47) | 3.87 ± 1.32 (3.78) | 3.89 ± 1.60 (3.76) |
| Triglycerides (mmol/L) | 1.10 ± 0.38 (1.09) | 2.48 ± 2.49 (1.86) | 4.31 ± 4.67 (2.70) |
| Apolipoprotein B (g/L) | 1.05 ± 0.32 (1.03) | 1.21 ± 0.34 (1.19) | 1.31 ± 0.40 (1.26) |
| Waist circumference (cm) | 79.2 ± 9.2 (79.0) | 89.0 ± 12.0 (90.0) | 106.2 ± 14.2 (104.0) |
| BMI (kg/m²) | 23.5 ± 2.9 (23.2) | 26.2 ± 3.8 (26.0) | 31.2 ± 4.4 (30.6) |
| HOMA-IR | 1.40 ± 0.77 (1.26) | 1.89 ± 1.06 (1.68) | 4.07 ± 3.35 (3.42) |
| VAI | 1.04 ± 0.46 (1.01) | 3.15 ± 5.02 (2.10) | 7.17 ± 9.35 (4.25) |
| AIP | −0.23 ± 0.21 (−0.36) | 0.16 ± 0.33 (−0.03) | 0.47 ± 0.37 (0.23) |
| Target Parameter | VAI Cut-Off | Sensitivity | Specificity | PPV | NPV | AUC (95% CI) |
|---|---|---|---|---|---|---|
| Metabolic syndrome | 2.372 | 0.863 | 0.781 | 0.615 | 0.933 | 0.878 (0.853–0.903) |
| HOMA-IR = 2.0 | 1.894 | 0.738 | 0.684 | 0.634 | 0.779 | 0.770 (0.735–0.804) |
| HOMA-IR = 3.8 | 2.372 | 0.785 | 0.662 | 0.294 | 0.945 | 0.765 (0.721–0.808) |
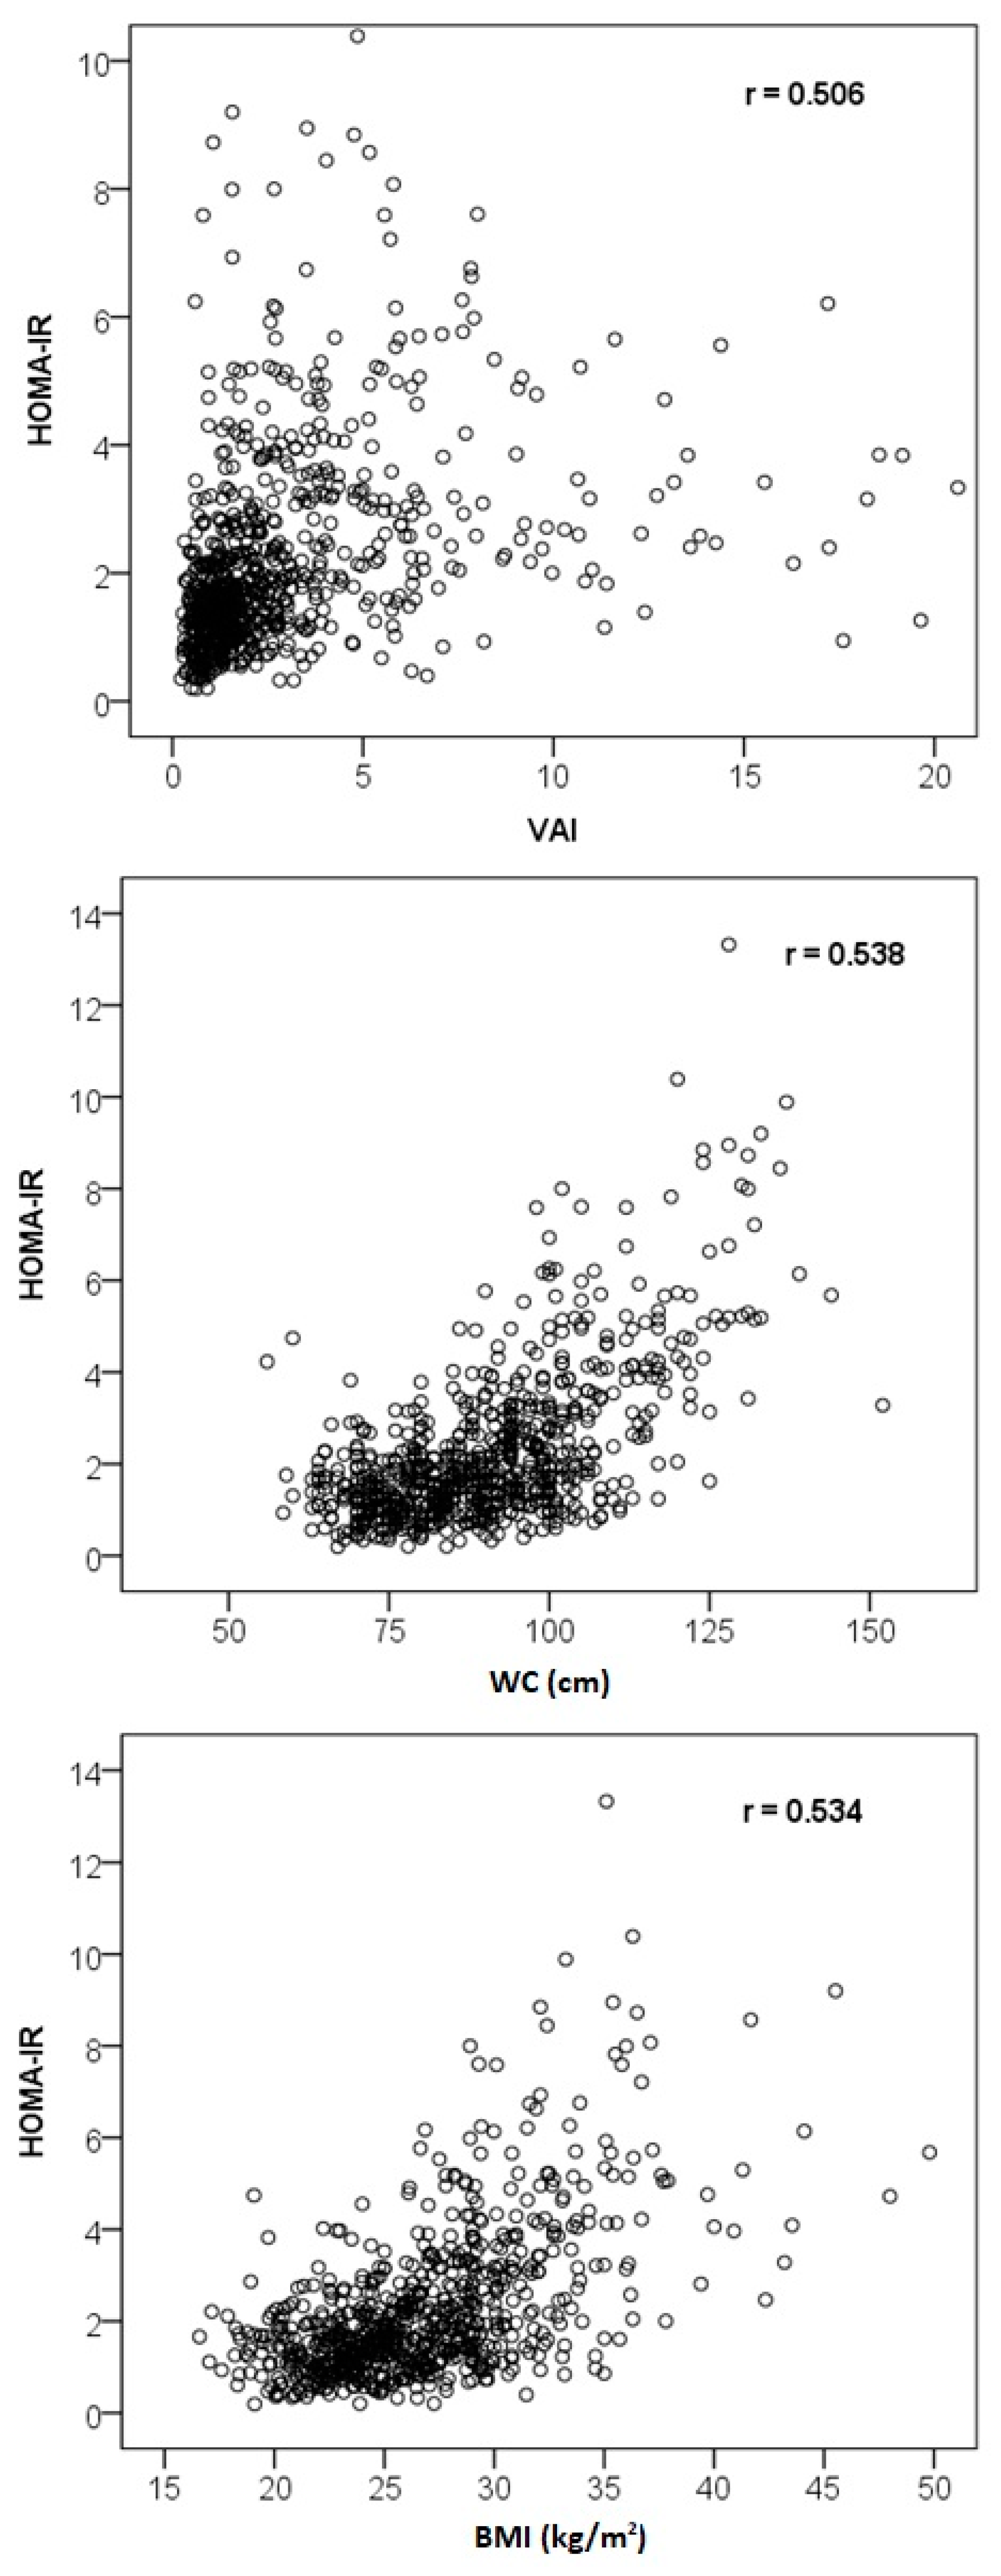
| Characteristics | VAI | Glucose | Insulin | HOMA-IR |
|---|---|---|---|---|
| Age | 0.171 ** | 0.346 ** | 0.081 * | 0.150 ** |
| Glucose | 0.313 ** | – | 0.359 ** | 0.528 ** |
| Insulin | 0.485 ** | 0.359 ** | – | 0.978 ** |
| Total cholesterol | 0.304 ** | 0.083 * | 0.039 | 0.047 |
| HDL cholesterol | −0.730 ** | −0.252 ** | −0.410 ** | −0.426 ** |
| LDL cholesterol | 0.136 ** | 0.065 | −0.012 | −0.005 |
| Triglycerides | 0.938 ** | 0.273 ** | 0.430 ** | 0.444 ** |
| Apolipoprotein B | 0.385 ** | 0.134 ** | 0.132 ** | 0.150 ** |
| Waist circumference | 0.535 ** | 0.477 ** | 0.487 ** | 0.538 ** |
| BMI | 0.496 ** | 0.449 ** | 0.490 ** | 0.534 ** |
| VAI | – | 0.313 ** | 0.485 ** | 0.506 ** |
| AIP | 0.975 ** | 0.300 ** | 0.470 ** | 0.488 ** |
© 2019 by the authors. Licensee MDPI, Basel, Switzerland. This article is an open access article distributed under the terms and conditions of the Creative Commons Attribution (CC BY) license (http://creativecommons.org/licenses/by/4.0/).
Share and Cite
Štěpánek, L.; Horáková, D.; Cibičková, Ľ.; Vaverková, H.; Karásek, D.; Nakládalová, M.; Zapletalová, J. Can Visceral Adiposity Index Serve as a Simple Tool for Identifying Individuals with Insulin Resistance in Daily Clinical Practice? Medicina 2019, 55, 545. https://doi.org/10.3390/medicina55090545
Štěpánek L, Horáková D, Cibičková Ľ, Vaverková H, Karásek D, Nakládalová M, Zapletalová J. Can Visceral Adiposity Index Serve as a Simple Tool for Identifying Individuals with Insulin Resistance in Daily Clinical Practice? Medicina. 2019; 55(9):545. https://doi.org/10.3390/medicina55090545
Chicago/Turabian StyleŠtěpánek, Ladislav, Dagmar Horáková, Ľubica Cibičková, Helena Vaverková, David Karásek, Marie Nakládalová, and Jana Zapletalová. 2019. "Can Visceral Adiposity Index Serve as a Simple Tool for Identifying Individuals with Insulin Resistance in Daily Clinical Practice?" Medicina 55, no. 9: 545. https://doi.org/10.3390/medicina55090545