Abstract
This study applied the social–ecological systems framework (SESF) to six fishing communities in northern Mozambique where marine resource management is being implemented through the Our Sea Our Life project. Data on 11 variables and 27 indicators were organised using the SESF to represent the key system dimensions (Governance system, Actors, Resource units and Resource system). Variables within each dimension were weighed to a cumulative score of one. High scores (> 0.50) for Governance system occurred where communities had fisheries management rules and good knowledge of fishing gear regulations. High scores for Actors were evident in communities with few migrant fishers and high participation in village savings and loans associations. Elevated scores of the Resource units occurred where fishers targeted a variety of fish taxa. A healthy Resource system was found in communities neighbouring highly productive and resilient reefs, characterised by high fish biomass and diversity. The status of social and ecological conditions coupled with initial levels of project support and quality of technical support were linked with project achievements. Application of the SESF is therefore valuable in understanding interdependent linkages between social and environmental conditions to inform the design of localised management interventions for social–ecological sustainability.
1. Introduction
In recent decades, there has been a shift in small-scale fisheries management from centralised government systems to more decentralised approaches, including the local communities [1,2,3,4]. This includes various forms of co-management, which has been defined as a partnership in which government, the community of resource users and other stakeholders share the responsibility and authority for the management of fisheries resources [5].
Despite the potential benefits, implementing co-management has been challenging [6] and its success has been mixed and highly variable across regions [7,8]. In some cases, co-management is effective at empowering local fishing communities (e.g., promoting participation, influence, control), but less so at improving the state of the fisheries’ resources [9]. Key challenges include poor representation of fishers in the community organisations involved in decision-making, and lack of organisational capacity and financial capability [10,11,12]. This indicates that the pathways from governance processes to ecological outcomes are complex [13].
More recently, another form of marine resources management known as locally managed marine areas (LMMAs) has gained in importance in the Pacific, Southeast Asia and the Western Indian Ocean (WIO) [14,15,16,17,18]. These are nearshore areas largely or wholly managed by local communities often involving collaborative arrangements with government and non-state actors [19]. In the WIO, LMMAs encompass a variety of management models whereby local communities decide how to manage resources, albeit in the framework of national legislation [20,21].
In the WIO, LMMAs have typically been established by community organisations empowered to manage fishing resources by national legislation, often under provisions for resources co-management [15]. These organisations often receive some degree of technical support from government agencies, private sector stakeholders or non-governmental organisations [20]. Some of the common management measures used in WIO LMMAs include temporary closures, fully protected areas and gear restrictions. Some feature a combination of these measures [15].
Small-scale fisheries are complex and can demonstrate considerable variation across relatively small geographical areas due to a range of ecological, social-cultural, economic and institutional factors [22,23,24]. Such differences are often underappreciated by policy makers and managers, leading to oversimplified one-size-fits-all solutions [25,26,27]. What works in one community may not be appropriate for another, and the barriers and leverage points to enhance sustainability may also be different. Understanding how the potential for LMMAs to achieve sustainable outcomes varies with the local context is vital and can help to target interventions to enhance such potential. Initial social and ecological conditions can help in the identification of gaps and selection of interventions in order to identify what factors are important to improve, and which ones may prevent desired social and ecological outcomes.
While there are a number of tools available to understand the factors that support and undermine the sustainability of social–ecological systems [28], data limitations are a major barrier to undertaking analyses capable of producing results relevant to the local scale [29,30]. Similarly to most of the developing world, ecological and socio-economic data on small-scale fisheries in the WIO is poor [31]. Yet most initiatives aimed at supporting LMMAs generate some baseline socio-economic, ecological and governance data for planning, monitoring and evaluation. There is potential to add value to these data with interdisciplinary analysis to better understand the trajectories of local social–ecological systems and the factors that contribute to observed outcomes.
This study applied a variant of the social–ecological systems framework (SESF) proposed by Ostrom [32,33] and further enhanced by McGinnis and Ostrom [34] to data generated within the context of a project supporting LMMAs in northern Mozambique called Our Sea Our Life. The SESF is a conceptual tool to understand how the interactions between the social, ecological and governance characteristics of a social–ecological system influence resource management outcomes, including the achievement of sustainability goals. It has been operationalised in a number of contexts, including fisheries and marine management more broadly [25,35,36,37,38,39,40,41,42,43].
The SESF conceptualises social–ecological systems into four essential dimensions, namely Actors (i.e., resource users); Governance system (i.e., institutions including rules); Resource units (i.e., fish and other resources); and Resource system (i.e., ecosystems and ecological processes). These dimensions are informed by a range of key socio-economic, governance and ecological variables characterising the current state of the system. In this paper, we examined the extent to which governance dimensions (Governance system and Actors) relate to ecological dimensions (Resource units and Resource system) across different LMMA sites; identify the key variables driving system behaviour; and determine which of these can be targeted to facilitate desired social and ecological sustainability outcomes in LMMAs.
2. Materials and Methods
2.1. Context and Study Sites
Efforts to establish LMMAs in Cabo Delgado, northern Mozambique, have been on-going since 2014 with support from the Our Sea Our Life project. Community management of marine resources in Mozambique is enabled by the fisheries legislation (Law n. 22/2013 and Decree 43/2003, currently being updated) that empowers local communities to participate in fisheries management; and by conservation legislation (Law n. 5/2017 and Decree 89/2017) that makes provisions for the creation of community conservation areas. An LMMA is effectively a marine area co-managed by government and local communities, the latter represented by a community fishing council (CCP). CCPs are community organisations mandated by the fisheries legislation to participate in the management of fishing resources (Decree 43/2003).
Data were collected in six villages in Cabo Delgado (Figure 1) where LMMAs are being established. Five are located in the mainland (Quirinde, Quiwia, Lalane, Nsangue Ponta, Malinde) and one is a small coastal island (Quifuque). The villages vary in population size, between 537 (Nsangue Ponta) and 3408 (Malinde). Cabo Delgado is home to a variety of coastal and marine habitats, including large and diverse areas of coral reefs [44,45] which have demonstrated a regionally high level of ecological resilience to coral bleaching [46]. Poverty affects 44.8% of the Cabo Delgado population [47] and most rural areas are poorly served by basic public services and infrastructure. All the communities in the study are remote and road access is precarious, particularly during the rainy season.
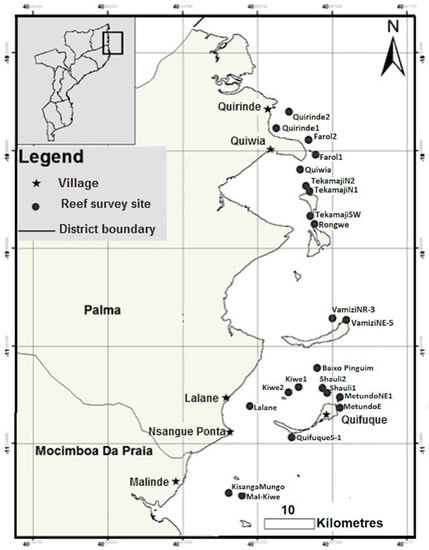
Figure 1.
Map showing the six villages of Quirinde, Quiwia, Lalane, Nsangue Ponta, Malinde and Quifuque. Fisheries monitoring and socio-economic surveys were undertaken in the six villages and fish population and benthic surveys conducted in reef sites neighbouring the villages.
The main livelihood activities in the coastal villages are farming, fishing, fish trading and small trade [48,49]. Fishing is an important source of income for families, particularly in the context of falling agriculture production due to climate change [50]. While coral mortality from increases in sea temperature has been less severe than elsewhere in the WIO, Cabo Delgado coral reefs are comprised of temperature-sensitive coral species with potential implications for fisheries-dependent populations in the context of future climate change [51]. Although fish catches in Cabo Delgado are still relatively high for Eastern Africa [22], fishers have reported declines which are likely linked to increasing fishing pressure from local and itinerant or migrant fishers and use of unsustainable fishing gear [52].
2.2. The Social–Ecological Systems Framework
The SESF conceptualises social–ecological systems into four essential dimensions or first-tier variables (Actors, Governance system, Resource units and Resource system), in turn, unpacked into a number of second-tier variables, which could further unpack into more tiers [36]. This framework was selected because of the flexibility it offers to organise existing data, in this case, data generated within the Our Sea Our Life project for baseline assessment and project monitoring and evaluation. A modification of Basurto et al.’s [36] SESF was used as a guide to structure the data, as this was developed specifically for small-scale fisheries systems and best fitted the context of LMMAs. In this paper, Actors refers to resource users and their attributes, such as dependence on the resource. These operate within the Governance system characterised by institutions, including organisations and resource use rules. Resource units are the fish harvested by users that interact with the broader Resource system that sustains productivity. Together, these interactions lead to diverse outcomes [35].
2.3. Data Sources
Previously collected data across the six fishing communities were matched to Basurto et al.’s [36] SESF (Actors, Governance system, Resource units and Resource system), resulting in a total of 11 variables for which data were available. These data were derived from field assessments for project planning, monitoring and evaluation. The data sources are described below and further summarised in Table 1 and can be broadly categorised into governance and socio-economic datasets and ecological datasets. Table S1 (Supplementary Material) describes and defines the social–ecological dimensions, variables and indicators, with the motivation for their inclusion in the study.

Table 1.
Description of social–ecological system variables with weights assigned and their corresponding lower-tier variables and indicators. Variables in each dimension were given equal weights. Data sources: 1. community fishing council (CCP) questionnaire survey 2016, 2. non-governmental organisation (NGO) staff 2016, 3. household survey 2015–2016, 4. livelihood activities and resource use census 2014–2015, 5. fisheries monitoring survey 2014–2015, 6. underwater visual census surveys 2014 and 2015. See Supplementary Material (Table S1) for a definition of the variables and indicators used together with the motivation for their inclusion.
2.3.1. Governance and Social–Economic Datasets
Governance system variables related to organisations were collected through a structured questionnaire administered to CCP officials in a focus group interview setting. The questionnaire was designed to assess the extent to which CCPs achieved a number of targets (indicators) associated with good governance and good functioning. These targets were derived from Mozambican CCP legislation setting out the requirements for CCP operation and expanded at a stakeholder workshop bringing together CCP, non-governmental organisation (NGO) and provincial fisheries administration representatives. There were 10 good governance and 8 good functioning indicators. The indicators were transformed into questions carrying yes/no answers. These were attributed scores of 1 and 0, respectively. The values used for the analysis were the sum of the scores achieved for good governance and good functioning. The questionnaire was administered in 2016. It was done only once and therefore provides a snapshot of CCP governance and functioning at the time it was applied.
The presence or absence of temporary and permanent closures was provided by NGO staff working with local communities for the establishment of LMMAs, while data on awareness of gear regulations, perceived compliance, economic dependence, livelihood diversity, livelihood diversification, migration and social capital were obtained from a household questionnaire [49] undertaken in each community in 2015–2016 (Quirinde n = 50; Quiwia n = 50; Lalane n = 51; Nsangue Ponta n = 50; Quifuque n = 50; Malinde n = 76). The number of fishers was obtained from a livelihood and marine resource use census undertaken between 2014 and 2015. Social capital was defined as features of social organisation such as networks, norms, trust and reciprocity that facilitate coordination and cooperation for mutual benefit [53]. The study focussed on trust as a component of social capital, indicated by participation in village savings and loan associations (VSLAs).
All participants gave their informed consent before participating in the CCP and household questionnaires and livelihood and marine resource use census. This included explaining the purpose of the data collection and its uses, guaranteeing the anonymity of respondents and guaranteeing their right to withdraw from the research.
2.3.2. Ecological Datasets
Resource unit variables were derived from fisheries monitoring surveys that aimed to collect catch and effort data at landing sites used by the fishers in the six fishing communities [22]. Data were collected from 2014 to 2015 at a frequency of six days per month, distributed in the neap and spring tides with more data collection during spring tides, since both men and women tend to fish more during this tidal period. Of importance to this study was information on gear type, crew size, total catch weight (kg) and species composition, which were used to calculate the gear catch per unit effort and number of taxa exploited in each fishing community.
Indicators for Resource system came from underwater visual census surveys conducted in 2014 and 2015, which quantified fish diversity, fish abundance and biomass, and coral reef resilience following methods documented in Samoilys and Randriamanantsoa [54] and Obura and Grimsditch [55]. The underwater visual census surveys consisted of 20 dives to survey fish diversity and population abundance, and 22 dives to estimate coral reef resilience. Fish populations were estimated in 50 × 5 m transects with generally n = 5 transects per reef site, collected on two dives. Coral reef resilience was estimated in 25 × 1 m transects with generally two transects per site. The reef sites were matched to the neighbouring fishing villages.
Size of resource system was provided by NGO staff working with local communities and included area in hectares being managed and/or suggested by CCP as a no-take zone (replenishment) or temporary closures.
2.3.3. Data Formatting and Analysis
Data from six fishing communities in the northern Mozambique province of Cabo Delgado were organised using the SESF dimensions. Primary data of 27 indicators were nested underneath 11 variables representing the four SESF dimensions (Table 2). Each indicator was normalised to a scale of 0-1 based on the quantile distribution of the original data following methods described in reference [35]. The variables were then nested under the four dimensions and weighed to a cumulative weight score of one (Supplementary Material, Tables S2 and S3). The relationships between these variables were then analysed to identify potential attributes defining the observed system trajectories. The relationship between first-tier variables was assessed using ordinary least squares statistic.
Table 2.
Data for each of the indicators for six villages in Cabo Delgado province, northern Mozambique. Refer to Table S1 for description of the variables.
A principal component analysis was used to detect the correlation between variables in each dimension and between the dimensions [56]. Principal component analysis is a dimension-reduction analysis tool able to reduce large sets of variables to small sets whilst still maintaining information contained in the data. Variation in the data is explained by principal components.
The orientation of villages in principal component analysis plot was linked to the achievements from social and ecological interventions: supporting the establishment and functioning of VSLAs and the creation and implementation of community no-take zones and temporary closures that were piloted in the six villages over a four-year (2014–2017) period of the Our Sea Our Life project. Under the Our Sea Our Life project, VSLAs were set up as platforms to raise awareness about marine habitats and threats they face as well as to mobilise financial resources to enhance the economic security of villagers and their ability to diversify livelihoods, particularly amongst the social groups most vulnerable to restrictive resource management measures. Data on VSLAs included number of operational VLSAs, their membership and total amount of savings. The ecological interventions were catalysed by development and support of CCPs, involvement of Provincial Directorate of Fisheries and exchange visits to operational community closures in Kenya and Madagascar, factors considered relevant in establishment of community closures [21].
3. Results
3.1. Social–Ecological System (SES) Relationships
3.1.1. Inter-SES Relationships
Governance system and Actors were positively correlated, and the same for Resource units and Resource system (Figure 2a,f). However, Governance and the ecological dimension variables—Resource units and Resource system—showed weak negative correlations (Figure 2b,c). The relationship between the Actors and ecological dimensions was not clearly defined with negative and positive relationships with Resource units and Resource system, respectively (Figure 2d,e).
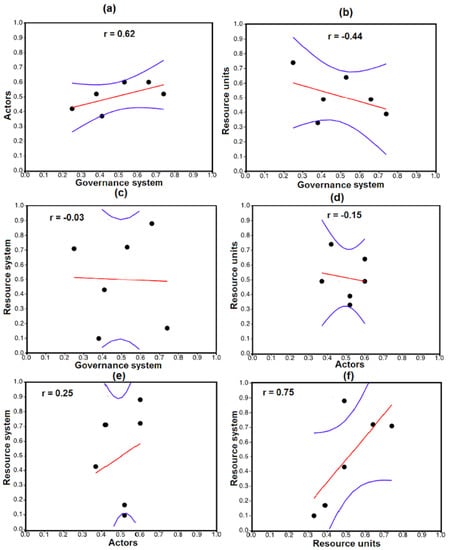
Figure 2.
Bivariate plots showing relationship between social–ecological variables: Governance system, Actors, Resource units and Resource system of six communities in northern Mozambique. The upper and lower lines in blue are 95% confidence bands and the middle red line is regression slope.
3.1.2. Intra-SES Relationships
For each SES dimension, the variable contributing most to the differences between fishing communities was derived from principal component analysis. The first principal component (PC1) explained 72.7%, 48.6%, 85.9% and 89.9% of the variance in the Governance system, Actors, Resource units and Resource system variables, respectively (Table 3). The principal component analysis loadings of Governance system variables showed rules in use (closures, awareness of gear regulations and compliance) to be positively correlated to PC1 (r = 0.91) in contrast to organisation of the fishing communities (CCP governance and functioning) that was negatively correlated (r = –0.78). The main variable of the Actors showing large positive associations with PC1 and PC2 was socio-economic attributes of resource users (r = 0.89) and social capital (r = 0.98), indicated, respectively, by the percentage of non-migrant fishers and participation in village savings and loan associations (VSLAs). Large negative associations in PC1 were also evident with the number of relevant actors (r = –0.94). For Resource units, PC1 had large positive associations with the number of taxa (r = 0.99). All variables under Resource system showed a positive correlation (r > 0.82) with PC1. These included productivity of the ecosystem represented by fish biomass and species diversity, equilibrium properties denoted by coral reef resilience, and size of resource system under co-management exemplified by area of the no-take zone and temporary zone.
Table 3.
First and second principal component (PC) variance (%) in bold and correlation coefficients of second-tier variables of each of four components of social–ecological systems in northern Mozambique.
3.2. Social–Ecological Context of Northern Mozambique
A summary of the weighted values of first-tier social–ecological variables is presented in Table 4. High Governance system scores (> 0.50) were recorded in Nsangue Ponta, Quiwia and Quirinde in comparison to Quifuque, Lalane and Malinde. For Actors, Qurinde, Quiwia, Lalane and Nsangue Ponta registered scores > 0.50 while Quifuque and Malinde had scores < 0.43. Only two villages—Quifuque and Quirinde—had Resource units scores > 0.50. High scores of Resource system were recorded in Quiwia, Quirinde and Quifuque compared to low scores in Lalane and Nsangue Ponta.
Table 4.
Weighted scores for each variable based on the ranked data reported. Each variable coded using the green–yellow–red colour scale with green as maximum and red as minimum scores.
A two-dimensional representation of the first tier social–ecological variables showed the first component of the principal component analysis to explain 69.7% of the variation and was strongly correlated with Resource system followed by Resource units (Figure 3). The second principal component explained an additional 24.9% and was positively correlated to Governance system followed by Actors. Based on the orientation of the six villages on the principal component analysis plot, four main groupings were identified, defined by a strong social–ecological system in Quiwia and Quirinde, a strong social system coupled by a weak ecological system in Nsangue Ponta, a healthy Resource system paired with a weak social system at Quifuque and a weak social–ecological system in Lalane and Malinde.
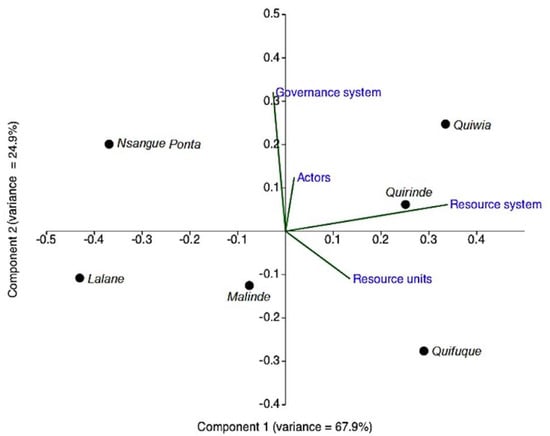
Figure 3.
Principal component analysis showing the first and second principal components of social–ecological dimensions for six communities in northern Mozambique. The lengths of biplot lines signify the variance within the social–ecological dimensions while the angle between variables approximates their correlation.
3.3. Linking Social–Ecological Context to Project Achievements
A large number of VSLAs were found in villages with a strong social system with membership dominated by women (Figure 4a). Villages with a relatively weak social system had few VSLAs with the majority (60–75%) of members being men. High savings per VSLA was recorded in Quifuque, which was characterised by a healthy Resource system but a weak social system. Savings in other villages mirrored the relative strengths of the social system (Figure 4a). The villages of Quiwia and Quirinde registered contrasting achievements compared with Lalane and Malinde. By 2017, a no-take zone and temporary closure had been set up in Quiwia but none in Quirinde (Figure 4b). A no-take zone had also been set up in Lalane while a proposal to set up one had been made in Malinde. The Global Poverty Action Fund funded project supported fishing communities in Quiwia and Quirinde from 2013 with highly committed technicians that delivered capacity building activities such as training and raising awareness on conservation and management of marine resources. This led to a first temporary closure in Quiwia in 2015. Technical support was also initiated in the other villages of Lalane, Nsangue Ponta and Quifuque through the Our Sea Our Life project, but later on.
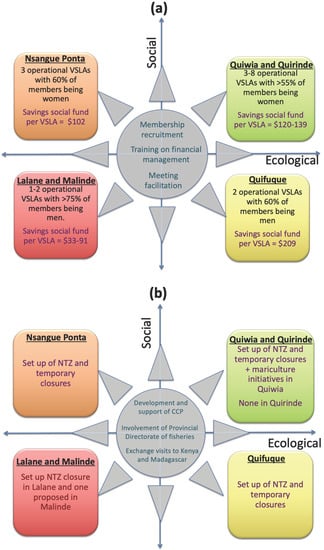
Figure 4.
Intervention achievements in six villages in northern Mozambique involving (a) set up, participation and savings in village savings and loan associations (VSLAs); and (b) set up of no-take zone (NTZ) and temporary closures. The interventions were catalysed by three activities listed in the circle.
4. Discussion
Comprehensive assessment of a social–ecological system (SES) requires careful selection of appropriate variables and indicators [36]. More often this is limited by the availability of financial and technical resources, time and community engagement [35]. In light of these limitations, this study used available data collected under the auspices of the Our Sea Our Life project and matched them to SESF variables. From a list of 11 variables and 27 indicators, we showed the inter-linkages between social and ecological dimensions, thereby improving our understanding of the dynamics of social ecological systems at a local level. Such an understanding is useful in informing pathways of transformation [57] as well as forecasting the achievement of marine resource management interventions.
4.1. Social–Ecological System of Cabo Delgado
Rules in use were an important variable of the Governance system in northern Mozambique and the existence of inherent fisheries management rules (such as permanent and temporal closures) and knowledge of gear regulations are critical in supporting the management of resources, as seen in Mexico’s molluscs fisheries [36]. Community organisations are a key feature of self-organisation for resource co-management [58,59]. Contrary to the assumption of low awareness of gear regulations amongst resource users, it is important for project implementers or managers to understand what rules are in operation (both formal and customary), who is in charge of communicating and enforcing the rules and, thereafter, explore ways to support existing institutions to become functional. For example, to achieve a strong Governance system, especially in areas where rules are lacking, would require building the capacity of community fishing councils (CCPs) to integrate and work with customary rules and institutions, as well as implement formal rules mandated by legislation. Additionally important would be to ensure the CCP works coherently with the formal village leadership, traditional structures and other local authorities, such as district authorities. The interaction with local authorities would not only strengthen their authority at the community level but also help CCPs to take forward infractions to higher levels, thereby maintaining continuous and fair application of enforcement procedures. It is through such a wide understanding and agreement of the rules in use that a sustainable Governance system can be achieved.
A key variable of the Actors was the attributes of resource users, with high scores evident where there were fewer migrant fishers. The presence of migrants can pose a significant challenge for collective management actions, as they are more often driven by immediate profits [60]. Additionally, local fishers often consider migrant fishers as the main cause of dwindling fish stocks, due to their failure to adhere to management rules, notably the use of illegal and destructive gears such as mosquito nets [52,61]. Whilst this may be true or just a perception, its implication has far-reaching consequences of corroding and weakening of the Actors. In such an instance, the presence of migrants can be regarded as an incentive for local communities to establish management regulations on resource use, involving restriction of outsiders or controlled access in the use of resources [62,63]. Therefore, an intervention that increases adherence to management rules by migrant fishers is likely to ensure a strong Actors component. This can be done by incorporating migrant fishers into local co-management rather than excluding them [64,65].
An equally significant pathway to Actors’ sustainability can involve transformative interventions that establish accountability and expand trust among resource users. Indeed, villages with high participation in village savings and loan associations (VSLAs) showed higher overall Actors scores. Considering that membership in associations such as VSLAs can be an indicator of trust and accountability in local communities [53], promoting and supporting these groups can be an important strategy to build social capital that eventually could be mobilised to facilitate cooperation for resource management.
High scores of the Resource units occurred where fishers targeted a diverse range of fish taxa using a variety of sustainable fishing gear. The number of fish taxa landed is influenced by fishing gear in use, fishing grounds habitat diversity and productivity of the system. A recent study in Cabo Delgado has shown that gear use in different villages is related to the diversity of marine and coastal habitats, which in turn host a diverse suite of fish species [22]. This supports the interpretation that areas where more fish taxa are landed harvest resources sustainably, since fishers are most likely to switch to harvesting other species, should the abundance of target species decrease because of human or natural factors [35].
High scores for Resource system were found in highly productive and more resilient reef sites characterised by high fish biomass (> 760kg/ha) and fish diversity (> 130 species). A healthy biophysical system is vital for the sustainable use of Resource units harvested by users [35]. Unsustainable use of the Resource units can lead to degradation of the Resource system. Therefore, sustainable utilisation of Resource units and maintenance of a healthy and productive Resource system would demand implementation of measures to protect fish species and their habitats. In areas such as Cabo Delgado, this can be achieved through the establishment of LMMAs that include spatial closures (no-take zones and/or temporary closures) and phasing out illegal and destructive mosquito nets [15,20,21,22]. Reduction of fishing effort and the introduction of gear management measures in areas with low scores for Resource units and Resource system could also improve and benefit the ecological dimension [35].
4.2. SES as a Diagnostic Tool to Achieving Social-Ecological Sustainability
The study showcased fine-scale differences in social–ecological conditions at a small stretch of coastline 80 kilometres long. Such localised differences are often underrepresented in social–ecological studies due to lack of data (e.g., [35]), yet they are vital in informing management measures as well as developing pathways of social transformation [57]. Understanding local social–ecological conditions has the potential to guide the selection of interventions by targeting variables considered either strengths or weakness or both. As a diagnostic tool, the SESF is useful in identifying focal variables that need interventions to ensure social–ecological sustainability [35]. For example, in villages where the Governance system scored < 0.50, building the capacity of CCP members to undertake administrative procedures and increasing member participation and accountability of leaders to members and the wider community can strengthen CCP governance (Table 5). Supporting the establishment of regulations for those communities without them, enforcing rules and regulations, awareness raising, sharing information and data collection and analysis for management can also improve CCP functioning and the overall self-organisation for resource management.
Table 5.
Overall status of social–ecological dimensions in the six villages in Cabo Delgado Province and possible social and ecological interventions to achieve sustainability. CCP—community fishing council, LMMAs—locally managed marine areas, NTZ—no-take zone.
Selection of SES variables intended to bring transformation will depend on the relationships between the community’s social and ecological variables, community acceptability, time and resources [35]. It is also important to acknowledge that social factors like local leadership and community cohesion can make or break an intervention, regardless of the scores of other indicators (e.g., dependence on fishing) [37,66]. This study relies on data collected primarily for project monitoring and evaluation purposes which did not include these variables. In retrospect, initial SES conditions in this study were able to forecast, with some degree of certainty, the success of social and ecological interventions. The successful achievements for ecological interventions in Quiwia and Quirinde were traced to the level of investment in both time and money, and potentially the quality of technical support provided through Global Poverty Action Fund and Our Sea Our Life projects. However, there were unexpected achievements in the two villages, with Quiwia setting up the first temporary closure in 2015 despite having a low exposure to working with NGOs conducting capacity building initiatives, and being quite isolated with lower levels of infrastructure and development compared to neighbouring Quirinde. In Lalane, the technician in charge of the implementation of activities was found to lack enthusiasm and was essentially not implementing the project activities. In Malinde, the Our Sea Our Life project started working only from 2015 and this may explain the low social scores. Thus, the level of technical support, as well as a well-governed and functional community organisation, are also important factors potentially influencing acceptance and success of ecological intervention [37,66].
High savings per VSLA were recorded in areas with a productive coastal environment supporting a rich fishery, which also attracts migrant fishers. This suggests that a healthy Resource system can provide monetary benefits, which, if saved in VSLAs, can improve the levels of trust. Beyond the role of VSLAs contributing to potential livelihood interventions, it was found to improve the material style of life indicators of most members (J. Huet personal observation; [67]). Otherwise, the relative strengths of the social system can influence the achievement of project interventions. This was mostly true of the Governance system that was predominantly supported by the Our Sea Our Life project, and less true of the Actors, which was made up of indicators that were less likely to be influenced by the project, apart from social capital that was represented by participation in VSLAs. The result of this forecasting was that Quirinde, Quiwia and Nsangue Ponta did fairly well on the social dimension. The initial social conditions were, therefore, informative and could forecast the success of social or ecological interventions.
4.3. Contributions to SES Scholarship, Challenges and Future Research
A key critique of the SES framework is the modification of variables and the indicators to measure them depending on the context [29], which limits the comparability of the results undertaken by different studies [28]. While this may be the case, our study shows that the framework enables adding value to previously collected data to improve our understanding of the dynamics of social–ecological systems. Its pragmatic pluralism is useful at the local scale where LMMAs are implemented and helps researchers, practitioners and local communities to identify and design interventions to steer these systems towards desired outcomes. Methodological transparency is essential in this process [29,68], as is the incorporation of the results in participatory processes to enrich the information available to communities when making resource management decisions.
Important challenges in the application of the SESF include the selection of indicators to assess variables and determining the weight of each indicator, which affects its influence on the system [69]. Future application of the SESF could involve collecting a broader suite of indicators to enable more adaptive management going forward, and generating community input into the weighting of the indicators. This includes data on leadership, which would involve expanding the governance assessment to other community leadership structures (e.g., the formal village authorities and traditional leadership structures), recognising the importance of these other Actors in the success of collective action [37,66]. In this study, indicator selection was guided by the SESF but depended on the data that was available to us. While the majority of the indicators used featured in previous uses of the SESF, they were not measured in the same way. We also gave indicators equal weights, which can be criticised since not all factors will have the same influence. However, applying specific weightings is problematic because their relative influence is difficult to define. Methodologically, one way to overcome this challenge would be to engage stakeholders in defining the weights of each variable using participatory research allied to fuzzy cognitive mapping [70]. While feasible and defensible, this also faces its own challenges including determining criteria to use in identifying stakeholders to engage in participatory processes, and the time and resources needed to promote these processes [71]. Nonetheless, advancing SES scholarship requires discussions with stakeholders to identify the most important factors from their perspective, and then put the emphasis on these factors in project interventions.
5. Conclusions
The findings suggest the importance of understanding each of the component parts of a social–ecological system. A functional community fisheries management unit, a CCP in this case, provides a foundation for the establishment of fisheries management rules that define the Governance system. Therefore, building the capacity of CCPs would improve their functioning and the overall Governance system. Membership in village savings and loan associations (VSLAs) and diversification of livelihoods are important in advancing social cohesion, and should be encouraged, as they reinforce the Actors component. Given a scenario of large numbers of migrant fishers in all communities, promoting their involvement in VSLAs can improve trust and adherence to management rules. Measures to protect fish species and their habitats through the establishment of spatial closures and other management measures defined with local communities can ensure sustainable utilisation of Resource units and maintenance of a healthy and productive Resource system. The achievements of social and ecological management interventions show correlations with the initial SES conditions including, importantly, the level of financial support and quality of extension workers providing fundamental support to communities. Therefore, application of the SESF is not only useful in understanding SES conditions, but also in informing localised management measures that contribute to social–ecological sustainability.
Supplementary Materials
The following are available online at https://www.mdpi.com/2071-1050/12/9/3904/s1. Table S1: Description of social–ecological system dimensions (in bold), variables (in italics) and indicators (underlined) analysed, their corresponding weights, position in the social–ecological framework (Basurto et al., 2013), working definition and motivation for their inclusion in the analysis. Table S2: Rankings for each of the indicators based on the primary data from Table 2. Table S3: Weighted scores for each variable based on the ranked data reported.
Author Contributions
Conceptualization, K.O., S.R. and M.S.; Data curation, K.O., S.R. and M.R.; Formal analysis, K.O., S.R. and M.D.; Funding acquisition, S.R., M.R., J.H., E.C. and M.S.; Investigation, K.O., S.R., M.R., J.H., M.D., E.C. and M.S.; Methodology, K.O., S.R. and M.D.; Project administration, J.H. and E.C.; Validation, K.O., S.R., M.R. and M.S.; Visualization, K.O. and S.R.; Writing—original draft, K.O. and S.R.; Writing—review and editing, K.O., S.R., M.R., J.H., M.D., E.C. and M.S. All authors have read and agreed to the published version of the manuscript.
Funding
This research was funded through the Our Sea Our Life (OSOL) project that received funding from various sources: European Union (DCIENV/ 2013/323–897), Darwin Initiative (20–023), Global Poverty Action Fund (GPAF), the Waterloo Foundation and Fondation Ensemble (PD/2015/01). The APC was funded by the OSOL project.
Acknowledgments
We are thankful to all field technicians who were involved in data collection of raw data: Jamen Mussa, Cecilio Amade, Mamudo Abudo, Júlio Biche, Faruque Ernesto Abdul Jorge (late), Domingos Mucolo, Daniel Selemane, Angelina Tayobo, Taresa Tsotsane. We are grateful to David Obura for collecting the benthic data. K.O. and M.S. were partially supported by the Norwegian Agency for Development Cooperation (NORAD) for the project “Innovating and sharing knowledge for coastal resilience in Eastern Africa” at CORDIO East Africa.
Conflicts of Interest
The authors declare no conflict of interest. The funders had no role in the design of the study; in the collection, analyses, or interpretation of data; in the writing of the manuscript; or in the decision to publish the results.
References
- Hauck, M.; Sowman, M. Waves of Change: Coastal and Fisheries Co-Management in Southern Africa; University of Cape Town Press: Cape Town, South Africa, 2003; ISBN 1919713808. [Google Scholar]
- Berkes, F.; Mahon, R.; McConney, P.; Pollnac, R.; Pomeroy, R. Managing Small-Scale Fisheries: Alternative Directions and Methods; IDRC: Ottwa, ON, Canada, 2001; ISBN 0889369437. [Google Scholar]
- Pomeroy, R.S. Community-based and co-management institutions for sustainable coastal fisheries management in Southeast Asia. Ocean. Coast. Manag. 1995, 27, 143–162. [Google Scholar] [CrossRef]
- Jentoft, S. Fisheries co-management. Delegating government responsibility to fishermen’s organizations. Mar. Policy 1989, 13, 137–154. [Google Scholar] [CrossRef]
- Pomeroy, R.S. Devolution and fisheries comanagement. In Collective Action, Property Rights, and Devolution of Natural Resource Management: Exchange of Knowledge and Implications for Policy: Proceedings of the International Conference eld from 21–25 June, 1999 in Puerto Azul, The Philippines; Meinzen-Dick, R.S., Knox, A., Gregorio, M.D., Eds.; Zentralstelle für Ernährung und Landwirtschaft: Feldafing, Germany, 1999; pp. 111–146. [Google Scholar]
- Purcell, S.W.; Pomeroy, R.S. Driving small-scale fisheries in developing countries. Front. Mar. Sci. 2015, 2, 44. [Google Scholar] [CrossRef]
- Evans, L.; Cherrett, N.; Pemsl, D. Assessing the impact of fisheries co-management interventions in developing countries: A meta-analysis. J. Environ. Manage. 2011, 92, 1938–1949. [Google Scholar] [CrossRef]
- Wamukota, A.W.; Cinner, J.E.; McClanahan, T.R. Co-management of coral reef fisheries: A critical evaluation of the literature. Mar. Policy 2012, 36, 481–488. [Google Scholar] [CrossRef]
- Maliao, R.J.; Pomeroy, R.S.; Turingan, R.G. Performance of community-based coastal resource management (CBCRM) programs in the Philippines: A meta-analysis. Mar. Policy 2009, 33, 818–825. [Google Scholar] [CrossRef]
- McConney, P.; Baldeo, R. Lessons in co-management from beach seine and lobster fisheries in Grenada. Fish. Res. 2007, 87, 77–85. [Google Scholar] [CrossRef]
- De Moura, R.L.; Minte-Vera, C.V.; Curado, I.B.; Francini-Filho, R.B.; Rodrigues, H.D.C.L.; Dutra, G.F.; Alves, D.C.; Souto, F.J.B. Challenges and prospects of fisheries co-management under a marine extractive reserve framework in northeastern Brazil. Coast. Manag. 2009, 37, 617–632. [Google Scholar] [CrossRef]
- Wilson, D.C.K.; Ahmed, M.; Delaney, A.; Donda, S.; Kapasa, C.K.; Malasha, I.; Muyangali, K.; Njaya, F.; Olesen, T.; Poiosse, E.; et al. Fisheries co-management institutions in Southern Africa: A hierarchical analysis of perceptions of effectiveness. Int. J. Commons 2010, 4, 643. [Google Scholar] [CrossRef]
- Plummer, R.; Armitage, D. A resilience-based framework for evaluating adaptive co-management: Linking ecology, economics and society in a complex world. Ecol. Econ. 2007, 61, 62–74. [Google Scholar] [CrossRef]
- Ratsimbazafy, H.; Lavitra, T.; Kochzius, M.; Hugé, J. Emergence and diversity of marine protected areas in Madagascar. Mar. Policy 2019. [Google Scholar] [CrossRef]
- Samoilys, M.; Osuka, K.; Muthiga, N.; Harris, A. Locally Managed Fisheries in the Western Indian Ocean: A Review of Past and Present Initiatives; WIOMSA: Zanzibar, Tanzania, 2017. [Google Scholar]
- Mcclanahan, T.; Muthiga, N.A.; Abunge, C.A. Establishment of Community Managed Fisheries’ Closures in Kenya: Early Evolution of the Tengefu Movement. Coast. Manag. 2016, 44, 1–20. [Google Scholar] [CrossRef]
- Christie, P.; White, A.T. Best practices for improved governance of coral reef marine protected areas. Coral Reefs 2007, 26, 1047–1056. [Google Scholar] [CrossRef]
- Cohen, P.; Evans, L.; Govan, H. Community-Based, Co-management for Governing Small-Scale Fisheries of the Pacific: A Solomon Islands’ Case Study; Springer: Cham, Switzerland, 2015; pp. 39–59. [Google Scholar]
- Govan, H.; Aalbersberg, W.; Tawake, A.; Parks, J. Locally Managed Marine Areas: A guide to Supporting Community-Based Adaptive Management; FAO: Rome, Italy, 2008. [Google Scholar]
- Rocliffe, S.; Peabody, S.; Samoilys, M.; Hawkins, J.P. Towards A Network of Locally Managed Marine Areas (LMMAs) in the Western Indian Ocean. PLoS ONE 2014, 9, e103000. [Google Scholar] [CrossRef] [PubMed]
- Kawaka, J.A.; Samoilys, M.A.; Murunga, M.; Church, J.; Abunge, C.; Maina, G.W. Developing locally managed marine areas: Lessons learnt from Kenya. Ocean. Coast. Manag. 2017, 135, 1–10. [Google Scholar] [CrossRef]
- Samoilys, M.A.; Osuka, K.; Mussa, J.; Rosendo, S.; Riddell, M.; Diade, M.; Mbugua, J.; Kawaka, J.; Hill, N.; Koldewey, H. An integrated assessment of coastal fisheries in Mozambique for conservation planning. Ocean. Coast. Manag. 2019, 182. [Google Scholar] [CrossRef]
- Wilson, E. Adapting to Climate Change at the Local Level: The Spatial Planning Response. Local Environ. 2006, 11, 609–625. [Google Scholar] [CrossRef]
- Andrew, N.L.; Béné, C.; Hall, S.J.; Allison, E.H.; Heck, S.; Ratner, B.D. Diagnosis and management of small-scale fisheries in developing countries. Fish. Fish. 2007, 8, 227–240. [Google Scholar] [CrossRef]
- Delgado-Serrano, M.; Ramos, P.A. Making Ostrom’s framework applicable to characterise social ecological systems at the local level. Int. J. Commons 2015, 9, 808–830. [Google Scholar] [CrossRef]
- Cox, M. Advancing the diagnostic analysis of environmental problems. Int. J. Commons 2011, 5, 346–363. [Google Scholar] [CrossRef]
- Ostrom, E.; Janssen, M.A.; Anderies, J.M. Going beyond panaceas. Proc. Natl. Acad. Sci. USA 2007, 104, 15176–15178. [Google Scholar] [CrossRef] [PubMed]
- Binder, C.R.; Hinkel, J.; Bots, P.W.G.; Pahl-Wostl, C. Comparison of Frameworks for Analyzing Social-ecological Systems. Ecol. Soc. 2013, 18, art26. [Google Scholar] [CrossRef]
- Partelow, S. A review of the social-ecological systems framework: Applications, methods, modifications, and challenges. Ecol. Soc. 2018, 23. [Google Scholar] [CrossRef]
- Drakou, E.G.; Kermagoret, C.; Comte, A.; Trapman, B.; Rice, J.C. Quo Vadimus Shaping the future of marine socio-ecological systems research: When early-career researchers meet the seniors. ICES J. Mar. Sci. 2017, 74, 1957–1964. [Google Scholar] [CrossRef]
- Kolding, J.; Béné, C.; Bavinck, M. Governance for Marine Fisheries and Biodiversity Conservation. Interaction and coevolution; Wiley-Blackwell: Hoboken, NJ, USA, 2014. [Google Scholar]
- Ostrom, E. A diagnostic approach for going beyond panaceas. Proc. Natl. Acad. Sci. USA 2007, 104, 15181–15187. [Google Scholar] [CrossRef]
- Ostrom, E. A general framework for analyzing sustainability of social-ecological systems. Science 2009, 325, 419–422. [Google Scholar] [CrossRef]
- McGinnis, M.D.; Ostrom, E. Social-ecological system framework: Initial changes and continuing challenges. Ecol. Soc. 2014, 19, art30. [Google Scholar] [CrossRef]
- Leslie, H.M.; Basurto, X.; Nenadovic, M.; Sievanen, L.; Cavanaugh, K.C.; Cota-Nieto, J.J.; Erisman, B.E.; Finkbeiner, E.; Hinojosa-Arango, G.; Moreno-Báez, M.; et al. Operationalizing the social-ecological systems framework to assess sustainability. Proc. Natl. Acad. Sci. USA 2015, 112, 5979–5984. [Google Scholar] [CrossRef]
- Basurto, X.; Gelcich, S.; Ostrom, E. The social-ecological system framework as a knowledge classificatory system for benthic small-scale fisheries. Glob. Environ. Chang. 2013, 23, 1366–1380. [Google Scholar] [CrossRef]
- Gutiérrez, N.L.; Hilborn, R.; Defeo, O. Leadership, social capital and incentives promote successful fisheries. Nature 2011, 470, 386–389. [Google Scholar] [CrossRef]
- Cinner, J.E.; McClanahan, T.R.; MacNeil, M.A.; Graham, N.A.J.; Daw, T.M.; Mukminin, A.; Feary, D.A.; Rabearisoa, A.L.; Wamukota, A.; Jiddawi, N.; et al. Comanagement of coral reef social-ecological systems. Proc. Natl. Acad. Sci. USA 2012, 109, 5219–5222. [Google Scholar] [CrossRef] [PubMed]
- Schlüter, A.; Madrigal, R. The SES Framework in a Marine Setting: Methodological Lessons. Ration. Mark. Morals 2012, 3, 148–167. [Google Scholar]
- García Lozano, A.J.; Heinen, J.T. Identifying Drivers of Collective Action for the Co-management of Coastal Marine Fisheries in the Gulf of Nicoya, Costa Rica. Environ. Manage. 2016, 57, 759–769. [Google Scholar] [CrossRef] [PubMed]
- Partelow, S. Key steps for operationalizing social-ecological system framework research in small-scale fisheries: A heuristic conceptual approach. Mar. Policy 2015, 51, 507–511. [Google Scholar] [CrossRef]
- Guevara, L.E.T.; Schlüter, A.; Lopez, M.C. Collective action in a tropical estuarine lagoon: Adapting Ostrom’s SES framework to Ciénaga Grande de Santa Marta, Colombia. Int. J. Commons 2016, 10, 334–362. [Google Scholar] [CrossRef]
- Rahimi, S.; Gaines, S.D.; Gelcich, S.; Deacon, R.; Ovando, D. Factors driving the implementation of fishery reforms. Mar. Policy 2016, 71, 222–228. [Google Scholar] [CrossRef]
- Obura, D. The Diversity and Biogeography of Western Indian Ocean Reef-Building Corals. PLoS ONE 2012, 7, e45013. [Google Scholar] [CrossRef]
- Hill, N.; Davidson, J.; Silva, I.; Mucave, S.; Muaves, L.; Guissamulo, A.; Debney, A.; Garnier, J. Coral and Reef Fish in the Northern Quirimbas Archipelago, Mozambique – A First Assessment. West. Indian Ocean. J. Mar. Sci. 2010, 8. [Google Scholar] [CrossRef]
- McClanahan, T.R.; Muthiga, N.A. Environmental variability indicates a climate-adaptive center under threat in northern Mozambique coral reefs. Ecosphere 2017, 8, e01812. [Google Scholar] [CrossRef]
- MEF/DEEF. MEF/DEEF. Pobreza e bem-estar em Moçambique: Quarta avaliação nacional, (IOF 2014/15); Ministerio da Economa e Financas (MEF), Direccao de Estudos Economicos e Financeiros (DEEF): Maputo, Mozambique, 2016. [Google Scholar]
- Rosendo, S.; Brown, K.; Joubert, A.; Jiddawi, N.; Mechisso, M. A clash of values and approaches: A case study of marine protected area planning in Mozambique. Ocean. Coast. Manag. 2011, 54. [Google Scholar] [CrossRef]
- Rosendo, S. Summary Report from the Phase 2 Livelihood Baseline | Our Sea Our Life, Cabo Delgado, April 2016; Centro Interdisciplinary em Ciências Sociais (CICS.NOVA), Faculdade de Ciências Sociais e Humanas (FCSH), Universidade Nova de Lisboa (UNL): Lisbon, Portugal, 2016. [Google Scholar]
- Riddell, M.; Rosendo, S. Climate Vulnerability and Capacity Assessment of Quirimbas National Park, Mozambique; Unpublished report; WWF Mozambique: Maputo, Mozambique, 2015. [Google Scholar]
- McClanahan, T.R.; Ateweberhan, M.; Darling, E.S.; Graham, N.A.J.; Muthiga, N.A. Biogeography and change among regional coral communities across the western Indian Ocean. PLoS ONE 2014. [Google Scholar] [CrossRef] [PubMed]
- Wanyonyi, I.; Crona, B.; Rosendo, S. Migrant Fishers and Fishing in the Western Indian Ocean: Socio-Economic Dynamics and Implications for Management. Final Report of Commissioned Research Project MASMA/CR/2008/02; WIOMSA: Zanzibar, Tanzania, 2011. [Google Scholar]
- Putnam, R. The Prosperous Community: Social Capital and Public Life. Am. Prospect. 2001, 13, 35–42. [Google Scholar]
- Samoilys, M.A.; Randriamanantsoa, B. Reef fishes of northeast Madagascar. In A Rapid Marine Biodiversity Assessment of the Coral Reefs of Northeast Madagascar; Obura, D., Di Carlo, G., Rabearisoa, A., Oliver, T., Eds.; Conservation International: Arlington, VA, USA, 2011; pp. 29–39. [Google Scholar]
- Obura, D.; Grimsditch, G. Resilience Assessment of Coral Reefs - Assessment Protocol for Coral Reefs, Focusing on Coral Bleaching and Thermal Stress. Rapport, IUCN, Gland, Switzerland; IUCN: Gland, Switzerland, 2009; ISBN 9782831711515. [Google Scholar]
- Hammer, D.A.T.; Ryan, P.D.; Hammer, Ø.; Harper, D.A.T. Past: Paleontological Statistics Software Package for Education and Data Analysis. Palaeontologia Electronica 2001, 4, 9. [Google Scholar]
- Andrachuk, M.; Armitage, D.; Dung Hoang, H.; Van Le, N. Building blocks for social-ecological transformations: Identifying and building on governance successes for small-scale fisheries. Ecol. Soc. 2018. [Google Scholar] [CrossRef]
- Nielsen, J.R.; Degnbol, P.; Viswanathan, K.K.; Ahmed, M.; Hara, M.; Abdullah, N.M.R. Fisheries co-management—An institutional innovation? Lessons from South East Asia and Southern Africa. Mar. Policy 2004, 28, 151–160. [Google Scholar] [CrossRef]
- Berkes, F. Evolution of co-management: Role of knowledge generation, bridging organizations and social learning. J. Environ. Manage. 2009, 90, 1692–1702. [Google Scholar] [CrossRef]
- Poteete, A.R.; Ostrom, E. Heterogeneity, Group Size and Collective Action: The Role of Institutions in Forest Management. Dev. Change 2004, 35, 435–461. [Google Scholar] [CrossRef]
- Wanyonyi, I.N.; Wamukota, A.; Mesaki, S.; Guissamulo, A.T.; Ochiewo, J. Artisanal fisher migration patterns in coastal East Africa. Ocean. Coast. Manag. 2016, 119, 93–108. [Google Scholar] [CrossRef]
- Curran, S. Migration, Social Capital, and the Environment: Considering Migrant Selectivity and Networks in Relation to Coastal Ecosystems. Popul. Dev. Rev. 2002, 28, 89–125. [Google Scholar]
- Cassels, S.; Curran, S.R.; Kramer, R. Do Migrants Degrade Coastal Environments? Migration, Natural Resource Extraction and Poverty in North Sulawesi, Indonesia. Hum. Ecol. 2005, 33, 329–363. [Google Scholar] [CrossRef]
- Crona, B.; Rosendo, S. Outside the law? Analyzing policy gaps in addressing fishers’ migration in East Africa. Mar. Policy 2011, 35, 379–388. [Google Scholar] [CrossRef]
- Cripps, G.; Gardner, C.J. Human migration and marine protected areas: Insights from Vezo fishers in Madagascar. Geoforum 2016, 74, 49–62. [Google Scholar] [CrossRef]
- Carrillo, I.I.C.; Partelow, S.; Madrigal-Ballestero, R.; Schlüter, A.; Gutierrez-Montes, I. Do responsible fishing areas work? Comparing collective action challenges in three small-scale fisheries in Costa Rica. Int. J. Commons 2019, 13, 705–746. [Google Scholar] [CrossRef]
- Musinguzi, L.K. The role of social networks in savings groups: Insights from village savings and loan associations in Luwero, Uganda. Commun. Dev. J. 2016, 51, 499–516. [Google Scholar] [CrossRef][Green Version]
- Sala, S.; Ciuffo, B.; Nijkamp, P. A systemic framework for sustainability assessment. Ecol. Econ. 2015, 119, 314–325. [Google Scholar] [CrossRef]
- Partelow, S.; Senff, P.; Buhari, N.; Schlüter, A. Operationalizing the social-ecological systems framework in pond aquaculture. Int. J. Commons 2018, 12, 485–518. [Google Scholar] [CrossRef]
- Özesmi, U.; Özesmi, S.L. Ecological models based on people’s knowledge: A multi-step fuzzy cognitive mapping approach. Ecol. Modell. 2004, 176, 43–64. [Google Scholar] [CrossRef]
- Hubacek, K.; Prell, C.; Reed, M.; Boys, D.; Bonn, A.; Dean, C. Using stakeholder and social network analysis to support participatory processes. Proc. Int. J. Biodiversity Sci. Manag. 2006, 2, 249–252. [Google Scholar] [CrossRef]


© 2020 by the authors. Licensee MDPI, Basel, Switzerland. This article is an open access article distributed under the terms and conditions of the Creative Commons Attribution (CC BY) license (http://creativecommons.org/licenses/by/4.0/).