Agave Syrup as an Alternative to Sucrose in Muffins: Impacts on Rheological, Microstructural, Physical, and Sensorial Properties
Abstract
:1. Introduction
2. Materials and Methods
2.1. Muffin Batter Ingredients
2.2. Batter and Muffin Preparation
2.3. Rheology and Microstructure of Batters
2.4. Muffin Height and Crumb Structure
2.5. Muffin Texture
2.6. Muffin Crust and Crumb Color
2.7. Sensory Evaluation of Final Product
2.8. Statistical Analysis
3. Results and Discussion
3.1. Rheological Properties of Muffin Batters
3.2. Microstructural Properties of Muffin Batters
3.3. Muffin Crumb Structure
3.4. Muffin Texture
3.5. Muffin Crust and Crumb Color
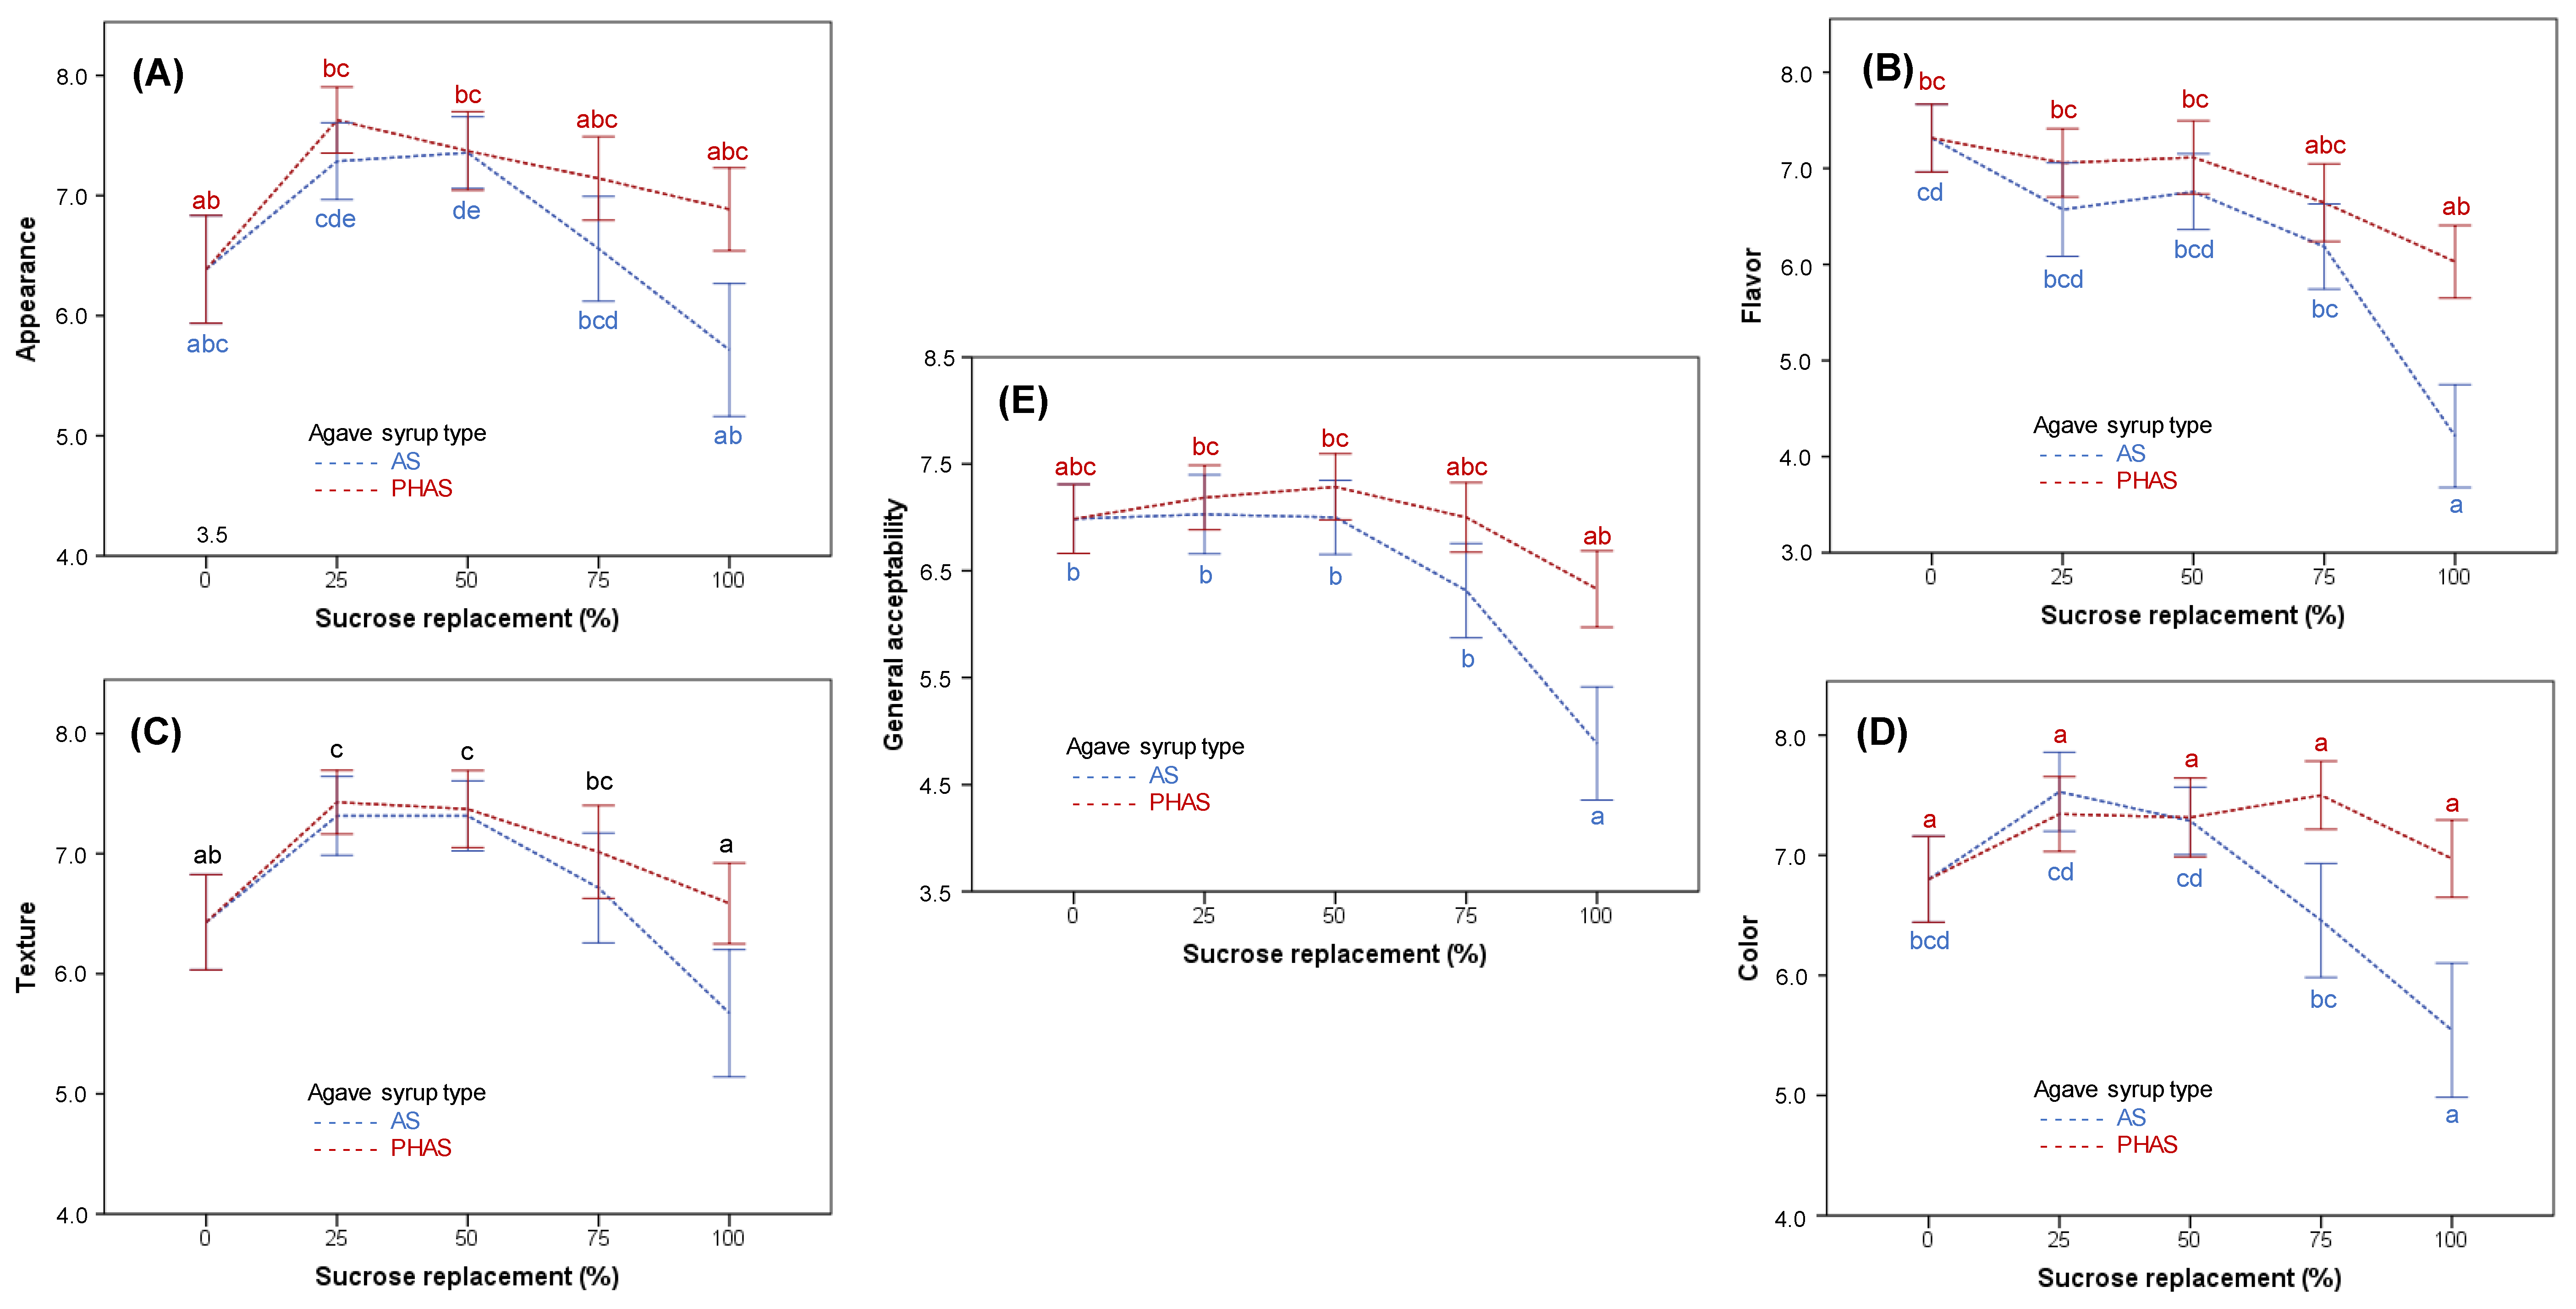
3.6. Sensory Evaluation of Final Product
4. Conclusions
Author Contributions
Funding
Acknowledgments
Conflicts of Interest
References
- Luo, X.; Arcot, J.; Gill, T.; Louie, J.C.Y.; Rangan, A. A review of food reformulation of baked products to reduce added sugar intake. Trends Food Sci. Technol. 2019, 86, 412–425. [Google Scholar] [CrossRef]
- Peris, M.; Rubio-Arraez, S.; Castelló, M.L.; Ortolá, M.D. From the laboratory to the kitchen: New alternatives to healthier bakery products. Foods 2019, 8, 660. [Google Scholar] [CrossRef] [Green Version]
- Martínez-Cervera, S.; de la Hera, E.; Sanz, T.; Gómez, M.; Salvador, A. Effect of using erythritol as a sucrose replacer in making spanish muffins incorporating xanthan gum. Food Bioprocess. Technol. 2012, 5, 3203–3216. [Google Scholar] [CrossRef]
- Othman, N.A.; Manaf, M.A.; Harith, S.; Ishak, W.R.W. Influence of avocado purée as a fat replacer on nutritional, fatty acid, and organoleptic properties of low-fat muffins. J. Am. Coll. Nutr. 2018, 37, 583–588. [Google Scholar] [CrossRef] [PubMed]
- Bucher Della Torre, S.; Keller, A.; Laure Depeyre, J.; Kruseman, M. Sugar-sweetened beverages and obesity risk in children and adolescents: A systematic analysis on how methodological quality may influence conclusions. J. Acad. Nutr. Diet. 2016, 116, 638–659. [Google Scholar] [CrossRef] [PubMed]
- Moynihan, P.J.; Kelly, S.A.M. Effect on caries of restricting sugars intake: Systematic review to inform WHO guidelines. J. Dent. Res. 2014, 93, 8–18. [Google Scholar] [CrossRef] [PubMed] [Green Version]
- OMS. Obesity and Overweight. Available online: https://www.who.int/news-room/fact-sheets/detail/obesity-and-overweight (accessed on 30 March 2020).
- Ghosh, S.; Sudha, M.L. A review on polyols: New frontiers for health-based bakery products. Int. J. Food Sci. Nutr. 2012, 63, 372–379. [Google Scholar] [CrossRef] [PubMed]
- Di Monaco, R.; Miele, N.A.; Cabisidan, E.K.; Cavella, S. Strategies to reduce sugars in food. Curr. Opin. Food Sci. 2018, 19, 92–97. [Google Scholar] [CrossRef]
- Sahin, A.W.; Zannini, E.; Coffey, A.; Arendt, E.K. Sugar reduction in bakery products: Current strategies and sourdough technology as a potential novel approach. Food Res. Int. 2019, 126, 108583. [Google Scholar] [CrossRef]
- Struck, S.; Jaros, D.; Brennan, C.S.; Rohm, H. Sugar replacement in sweetened bakery goods. Int. J. Food Sci. Technol. 2014, 49, 1963–1976. [Google Scholar] [CrossRef]
- Liang, S.; Were, L.M. Chlorogenic acid oxidation-induced greening of sunflower butter cookies as a function of different sweeteners and storage conditions. Food Chem. 2018, 241, 135–142. [Google Scholar] [CrossRef] [PubMed] [Green Version]
- Rothschild, J.; Rosentrater, K.A.; Onwulata, C.; Singh, M.; Menutti, L.; Jambazian, P.; Omary, M.B. Influence of quinoa roasting on sensory and physicochemical properties of allergen-free, gluten-free cakes. Int. J. Food Sci. Technol. 2015, 50, 1873–1881. [Google Scholar] [CrossRef]
- Zamora-Gasga, V.M.; Bello-Pérez, L.A.; Ortíz-Basurto, R.I.; Tovar, J.; Sáyago-Ayerdi, S.G. Granola bars prepared with agave tequilana ingredients: Chemical composition and in vitro starch hydrolysis. LWT Food Sci. Technol. 2014, 56, 309–314. [Google Scholar] [CrossRef]
- Mellado-Mojica, E.; López-Pérez, M.G. Análisis comparativo entre jarabe de agave azul (Agave tequilana weber Var. Azul) y otros jarabes naturales. Agrociencia 2013, 47, 233–244. [Google Scholar]
- Santiago-García, P.A.; Mellado-Mojica, E.; León-Martínez, F.M.; López, M.G. Evaluation of Agave angustifolia fructans as fat replacer in the cookies manufacture. LWT 2017, 77, 100–109. [Google Scholar] [CrossRef]
- Hooshmand, S.; Holloway, B.; Nemoseck, T.; Cole, S.; Petrisko, Y.; Hong, M.Y.; Kern, M. Effects of Agave nectar versus sucrose on weight gain, adiposity, blood glucose, insulin, and lipid responses in mice. J. Med. Food 2014, 17, 1017–1021. [Google Scholar] [CrossRef]
- Koehler, P.E.; Kays, S.J. Sweet Potato Flavor: Quantitative and qualitative assessment of optimum sweetness. J. Food Qual. 1991, 14, 241–249. [Google Scholar] [CrossRef]
- Belščak-Cvitanović, A.; Komes, D.; Dujmović, M.; Karlović, S.; Biškić, M.; Brnčić, M.; Ježek, D. Physical, bioactive and sensory quality parameters of reduced sugar chocolates formulated with natural sweeteners as sucrose alternatives. Food Chem. 2015, 167, 61–70. [Google Scholar] [CrossRef]
- Rodríguez-García, J.; Salvador, A.; Hernando, I. Replacing fat and sugar with inulin in cakes: Bubble size distribution, physical and sensory properties. Food Bioprocess. Technol. 2014, 7, 964–974. [Google Scholar] [CrossRef]
- Diez-Sánchez, E.; Quiles, A.; Llorca, E.; Reiβner, A.-M.; Struck, S.; Rohm, H.; Hernando, I. Extruded flour as techno-functional ingredient in muffins with berry pomace. LWT 2019, 113, 108300. [Google Scholar] [CrossRef]
- Nieto-Mazzocco, E.; Saldaña-Robles, A.; Franco-Robles, E.; Rangel-Contreras, A.K.; Cerón-García, A.; Ozuna, C. Optimization of sorghum, rice, and amaranth flour levels in the development of gluten-free bakery products using response surface methodology. J. Food Process. Preserv. 2020, 44, e14302. [Google Scholar] [CrossRef]
- Wilderjans, E.; Luyts, A.; Brijs, K.; Delcour, J.A. Ingredient functionality in batter type cake making. Trends Food Sci. Technol. 2013, 30, 6–15. [Google Scholar] [CrossRef]
- Carrascal, A.; Rasines, L.; Ríos, Y.; Rioja, P.; Rodríguez, R.; Alvarez-Sabatel, S. Development of reduced-fat muffins by the application of jet-impingement microwave (JIM) technology. J. Food Eng. 2019, 262, 131–141. [Google Scholar] [CrossRef]
- Alvarez, M.D.; Herranz, B.; Fuentes, R.; Cuesta, F.J.; Canet, W. Replacement of wheat flour by chickpea flour in muffin batter: Effect on rheological properties. J. Food Process. Eng. 2017, 40, e12372. [Google Scholar] [CrossRef] [Green Version]
- Fye, A.M.; Setser, C.S. Optimizing texture of reduced-calorie yellow layer cakes. Cereal Chem. 1991, 69, 338–343. [Google Scholar]
- Encina-Zelada, C.R.; Cadavez, V.; Monteiro, F.; Teixeira, J.A.; Gonzales-Barron, U. Combined Effect of xanthan gum and water content on physicochemical and textural properties of gluten-free batter and bread. Food Res. Int. 2018, 111, 544–555. [Google Scholar] [CrossRef] [PubMed] [Green Version]
- Gao, J.; Brennan, M.A.; Mason, S.L.; Brennan, C.S. Effects of Sugar Substitution with “Stevianna” on the Sensory Characteristics of Muffins. Available online: https://www.hindawi.com/journals/jfq/2017/8636043/ (accessed on 9 February 2020).
- Gómez, M.; Ronda, F.; Caballero, P.A.; Blanco, C.A.; Rosell, C.M. Functionality of different hydrocolloids on the quality and shelf-life of yellow layer cakes. Food Hydrocoll. 2007, 21, 167–173. [Google Scholar] [CrossRef]
- Bodart, M.; de Peñaranda, R.; Deneyer, A.; Flamant, G. Photometry and colorimetry characterisation of materials in daylighting evaluation tools. Build. Environ. 2008, 43, 2046–2058. [Google Scholar] [CrossRef]
- Peressini, D.; Sensidoni, A. Effect of soluble dietary fibre addition on rheological and breadmaking properties of wheat doughs. J. Cereal Sci. 2009, 49, 190–201. [Google Scholar] [CrossRef]
- Conforti, F.D.; Strait, M.J. The effects of liquid honey as a partial substitute for sugar on the physical and sensory qualities of a fat-reduced muffin. J. Consum. Stud. Home Econ. 1999, 23, 231–237. [Google Scholar] [CrossRef]
- Kocer, D.; Hicsasmaz, Z.; Bayindirli, A.; Katnas, S. Bubble and pore formation of the high-ratio cake formulation with polydextrose as a sugar- and fat-replacer. J. Food Eng. 2007, 78, 953–964. [Google Scholar] [CrossRef]
- Kim, J.-N.; Park, S.; Shin, W.-S. Textural and Sensory characteristics of rice chiffon cake formulated with sugar alcohols instead of sucrose. J. Food Qual. 2014, 37, 281–290. [Google Scholar] [CrossRef]


| Ingredients | CONTROL | AS-25 | AS-50 | AS-75 | AS-100 | PHAS-25 | PHAS-50 | PHAS-75 | PHAS-100 |
|---|---|---|---|---|---|---|---|---|---|
| Wheat flour | 100 | 100 | 100 | 100 | 100 | 100 | 100 | 100 | 100 |
| Sucrose | 100 | 75 | 50 | 25 | - | 75 | 50 | 25 | - |
| AS | - | 15.48 | 30.95 | 46.42 | 61.90 | - | - | - | - |
| PHAS | - | - | - | - | - | 16.68 | 33.36 | 50.05 | 66.73 |
| Xanthan gum | - | 0.5 | 0.5 | 0.5 | 0.5 | 0.5 | 0.5 | 0.5 | 0.5 |
| Pure water | - | 30 | 30 | 30 | 30 | 30 | 30 | 30 | 30 |
| Whole liquid egg | 81 | 81 | 81 | 81 | 81 | 81 | 81 | 81 | 81 |
| Skimmed milk | 100 | 100 | 100 | 100 | 100 | 100 | 100 | 100 | 100 |
| Sunflower oil | 46 | 46 | 46 | 46 | 46 | 46 | 46 | 46 | 46 |
| Sodium bicarbonate | 4 | 8 | 8 | 8 | 8 | 8 | 8 | 8 | 8 |
| Malic and tartaric acid | 3 | 6 | 6 | 6 | 6 | 6 | 6 | 6 | 6 |
| Salt | 1.5 | 1.5 | 1.5 | 1.5 | 1.5 | 1.5 | 1.5 | 1.5 | 1.5 |
© 2020 by the authors. Licensee MDPI, Basel, Switzerland. This article is an open access article distributed under the terms and conditions of the Creative Commons Attribution (CC BY) license (http://creativecommons.org/licenses/by/4.0/).
Share and Cite
Ozuna, C.; Trueba-Vázquez, E.; Moraga, G.; Llorca, E.; Hernando, I. Agave Syrup as an Alternative to Sucrose in Muffins: Impacts on Rheological, Microstructural, Physical, and Sensorial Properties. Foods 2020, 9, 895. https://doi.org/10.3390/foods9070895
Ozuna C, Trueba-Vázquez E, Moraga G, Llorca E, Hernando I. Agave Syrup as an Alternative to Sucrose in Muffins: Impacts on Rheological, Microstructural, Physical, and Sensorial Properties. Foods. 2020; 9(7):895. https://doi.org/10.3390/foods9070895
Chicago/Turabian StyleOzuna, César, Eugenia Trueba-Vázquez, Gemma Moraga, Empar Llorca, and Isabel Hernando. 2020. "Agave Syrup as an Alternative to Sucrose in Muffins: Impacts on Rheological, Microstructural, Physical, and Sensorial Properties" Foods 9, no. 7: 895. https://doi.org/10.3390/foods9070895
APA StyleOzuna, C., Trueba-Vázquez, E., Moraga, G., Llorca, E., & Hernando, I. (2020). Agave Syrup as an Alternative to Sucrose in Muffins: Impacts on Rheological, Microstructural, Physical, and Sensorial Properties. Foods, 9(7), 895. https://doi.org/10.3390/foods9070895


