Article

Wave Run-Up on Mortar-Grouted Riprap Revetments

by
Moritz Kreyenschulte
1,*,
David Schürenkamp
2,
Benedikt Bratz
2,
Holger Schüttrumpf
1 and
Nils Goseberg
2,3
1
Institute of Hydraulic Engineering and Water Resources Management, RWTH Aachen University, 52056 Aachen, Germany
2
Division of Hydromechanics, Coastal and Ocean Engineering, Leichtweiß-Institute for Hydraulic Engineering and Water Resources, Technische Universität Braunschweig, 38106 Braunschweig, Germany
3
Coastal Research Center, Joint Research Unit of Technische Universität Braunschweig and Leibniz University Hannover, 30419 Hannover, Germany
*
Author to whom correspondence should be addressed.
Water 2020, 12(12), 3396; https://doi.org/10.3390/w12123396
Submission received: 8 October 2020 / Revised: 19 November 2020 / Accepted: 30 November 2020 / Published: 2 December 2020
(This article belongs to the Special Issue Advances in Coastal and Ocean Engineering)

Abstract

:
The wave run-up height is a crucial design parameter that determines the crest height of a sea dike and is used for estimating the number of overtopping waves. Therefore, a reduction of the wave run-up height is generally aspired in the design of dikes, which can be achieved by mortar-grouted riprap revetments (MGRR). Although MGRRs are widely utilized revetments along the German North Sea coast, no investigations into the wave run-up height on this revetment type are available to date. Full-scale hydraulic model tests were hence conducted to investigate wave run-up heights on partially grouted and fully grouted MGRRs. The wave run-up was determined using 2D-LIDAR measurements, which were validated by video data. Partially grouted MGRRs, due to their roughness, porosity, and permeability, reduce wave run-up heights from 21% to 28%, and fully grouted MGRRs due to their roughness reduce wave run-up heights from 12% to 14% compared to smooth impermeable revetments. Influence factors have been determined for four widely used revetment configurations, which can now be used for design purposes. A comparison and subsequent discussion about the representation of the physics of wave run-up by different parameters is carried out with the results presented.

1. Introduction

1.1. Motivation

The wave run-up height is a crucial design parameter that determines the crest height of sea dikes, and is used for estimating the number of overtopping waves as well as the overtopping volume per meter. In combination with the wave run-down, it defines the part of the revetment in which wave loading takes place [1]. Therefore, a reduction of the wave run-up height is a key aspect in the design of coastal dikes. This can be achieved by, e.g.,
  • measures in the dike foreland, e.g., wave-damping vegetation [2,3,4] or underwater break-waters [5,6,7], thereby reducing the wave height at the toe of the dike,
  • changing the cross-section of the dike by installing a berm or decreasing the slope angle [5,8],
  • choosing a revetment that reduces wave run-up [1,8].
The first measure requires additional structures and/or maintenance of structures and vegetation, whereas the second measure comes with the drawback of a wider base and increased volume of a dike. Due to an often limited space dedicated to dike construction and limited possibilities for measures in the foreland, for example, in densely populated areas or because of existing land use, the wave run-up height is often reduced by choosing a suitable revetment type [5,9]. In order to increase energy dissipation during wave run-up, rough and impermeable or rough, porous, and permeable revetments are suitable choices in that context.
Mortar-grouted riprap revetments (MGRR) are riprap layers with a thickness of at least 0.4 m in coastal environments mostly made of riprap of stone weight class LMB5/40 or LMB10/60 (light mass with stone mass of 5–40 kg and 10–60 kg, respectively, according to DIN EN 13383-1 [10]). Either the entire pore volume of the riprap is grouted with mortar, creating an impermeable top layer with a rough revetment surface, or it is partially grouted, creating a rough, porous, and permeable top layer. Beneath the top layer, mostly geotextiles are used as a separation and filter layer. Figure 1 gives an impression of MGRR top layers with different amounts of mortar, either in experimental (Figure 1a,c) or in situ settings (Figure 1b,d) (all additional information can be found in Appendix A).
Due to the grouting mortar, MGRRs form a coherent structure that is able to withstand shear forces and momentums. Given the same wave loading, MGRRs can therefore withstand this loading, although constructed of smaller and lighter riprap and thinner armor layers than non-grouted riprap. Although MGRRs are widely utilized revetments along the German North Sea coast, no investigations into the wave run-up height on this revetment type are available to date, leaving the designer of such a revetment with little guidance to design economically while at the same time not compromising safety. Therefore, full-scale hydraulic model tests with different configurations of MGRRs have been conducted in the Large Wave Flume (in German “Großer Wellenkanal”, GWK) of the Coastal Research Center based in Hannover, Germany, to get new insight into wave run-up on MGRRs for different wave parameters as well as structural and hydraulic parameters of the revetments.

1.2. Wave Run-Up

The wave run-up height is defined as the vertical distance between the still water line and the maximum excursion of a single wave on a slope. The limit of the excursion of the wave is defined as a thickness of the wave run-up tongue on the slope of approximately two centimeters in prototype scale [8]. Because wave spectra are most relevant to dike design, the following literature review and the results presented for MGRRs focus on wave run-up due to random waves, expressed by wave spectra. The relevant wave run-up for design is given as wave run-up height Ru2%, which is exceeded by 2% of the incoming waves. The main influences on wave run-up are the wave parameters, slope angle, and overall geometry of the embankment, shallow foreshores, and the hydraulic properties of the embankment or revetment on which the incoming waves run up, such as roughness, porosity, and permeability [11,12,13,14].
Due to the complex interactions of these factors, an exact mathematical model to describe wave run-up is missing. However, various approaches to model wave run-up have been utilized, namely analytically derived equations, numerical models, empirical equations, and machine learning techniques. An overview of these different approaches is given, for example, by [8,15]. Lately, machine learning techniques have been used with success to model wave run-up on beaches [16,17] and rubble mound structures [18,19,20] or perforated coastal structures [15].
In this work, empirical models with different parameters are utilized to model wave run-up for the following reasons:
  • they are the most widely used models for design purposes
  • they are easy to use and comprehensible
  • full-scale hydraulic model tests on MGRRs have been conducted, thus, the number of experiments is not suited for machine learning techniques
  • we test the ability of different parameters for describing wave run-up for different roughnesses, porosities, and permeabilities, as these parameters vary considerably for MGRRs.
Most empirical run-up equations make use of some form of the surf similarity parameter ξ [21], which describes wave breaking and energy dissipation on the slope depending on wave steepness s and slope angle α:
ξ = tan α s = tan α H / L
In Equation (1), H denotes the wave height and L the wave length. In the state-of-the-art design guideline EurOtop [8], the wave run-up height Ru2% on rubble mound structures is calculated using Equation (2):
R u 2 % H m 0 = m i n 1.65 × γ b × γ f × γ β × ξ m 1 , 0 1.00 × γ f , s u r g i n g × γ β 4 1.5 γ b × ξ m 1 , 0
where Hm0 is the mean spectral wave height, γf the influence factor for roughness, γb the influence factor for a berm, γβ the influence factor for oblique wave attack, and ξm−1,0 the surf similarity parameter. The surf similarity parameter ξm−1,0 is a fictitious parameter, because it combines the wave height at the toe of the structure with the deep water wavelength, which is calculated using the wave period Tm−1,0 at the toe of the structure. For rubble mound revetments, the influence factor γf,surging is equal to γf for ξm−1,0 ≤ 1.8, and linearly increases ξm−1,0 > 1.8, thereby accounting for the decreasing influence of roughness on wave run-up for surging waves:
γ f , s u r g i n g = γ f + ξ m 1 , 0 1.8 × 1 γ f / 8.2
All influence factors in Equation (2) become γi = 1 for a smooth impermeable revetment without a berm and for perpendicular wave attack. The influence factor γf’ is called the “influence factor due to roughness”, but is used in the EurOtop Manual [8] and by many researchers, e.g., [22,23], as a factor that summarizes the influence of roughness, porosity, and permeability. Because these influences are summarized in a single influence factor, this factor is determined for each revetment type as a constant or depending on wave parameters and structural parameters of the revetment type being investigated. The influence factors γf for different revetment types have been summarized by various authors (e.g., [8,24,25]); readers are referred to these and citations therein for a further read. As a non-exhaustive summary, Table 1 provides influence factors for some rough, porous, and permeable revetments.
Besides Equation (2), other models have been proposed to describe wave run-up heights on revetments as a function of the surf similarity parameter. These equations are of two basic types for irregular waves. They either use a different equation in combination with an influence factor to consider the revetment type, see e.g., Schüttrumpf [29]:
R u 2 % H m 0 = 3 × tanh 0.65 × ξ m 1 , 0 × γ f
or they propose an equation only valid for one specific type of revetment. For example, in the case of riprap revetments, Ahrens & Heimbaugh [30] give:
R u 2 % H m 0 = 1.022 × ξ p 1 + 0.247 × ξ p
In Equation (5), ξp is based on the peak period of the spectrum Tp. As no further insight into the wave run-up on MGRRs can be gained from the existing equations of the second type because they are specific for only one revetment type, they are not discussed further here. For a more comprehensive overview of existing run-up equations for revetments see for example [13,24], or more recently [14].
Besides the surf similarity parameter, several other parameters have been proposed as the main variable to describe wave run-up. There is an ongoing debate as to which combination of model and main influencing parameter is best suited for describing wave run-up for rough, porous, and permeable coastal structures [14,27,31,32]. Therefore, in this work, we investigate the use of the surf similarity parameter [21], the wave momentum flux parameter [31], the reflection coefficient [32], and the modified surf similarity parameter [14] for modeling wave run-up on MGRRs. A brief presentation of these parameters is given in the following.
Hughes [31] described wave run-up as a function of the maximum depth-integrated wave momentum flux of a wave just before it reaches the toe of a structure, and argues that this momentum flux will be proportional to the weight of the water on the slope at maximum wave run-up, the shape of which is idealized as a wedge. The dimensionless wave momentum flux parameter MF,dim is in the case of irregular waves calculated using the water depth h, wave height Hm0, peak period Tp, and empirical constants A0 and A1:
M F , d i m = M F ρ g h 2 m a x = A 0 h g T p 2 A 1
A 0 = 0.64 × H m 0 / h 2.03
A 1 = 0.18 × H m 0 / h 0.39
For irregular waves on smooth impermeable slopes, the wave run-up showed two distinct trends for breaking (criterion according to [31]: Hm0/Lp < 0.0225, where Lp is the wave length corresponding to the peak period Tp) and non-breaking waves (criterion according to [31]: Hm0/Lp > 0.0225). For non-breaking waves, Hughes [31] gives:
R u 2 % h = 1.75 × 1 e 1.3 c o t α × M F , d i m 0.5
For breaking waves in a more recent formulation [27]:
R u 2 % h = 4.4 × tan α 0.7 × M F , d i m 0.5 × γ f , M
For wave run-up on riprap slopes on an impermeable embankment based on the data of [33] and [30], no clear distinction between breaking and non-breaking waves was found [27]. Thus, all data were described by Equation (10) with an influence factor of γf,M = 0.505, which in case of a smooth impermeable revetment is γf,M = 1 [27]. In general, using the wave momentum flux parameter to describe wave run-up gives better results for non-breaking than for breaking waves, as the run-up tongue is, in this case, well-characterized by a wedge, which is assumed in the derivation of the parameter. For breaking waves, however, this assumption can be violated, and therefore, it is expected that the accuracy of the wave momentum flux parameter for describing wave run-up is reduced [14,31,34]. Nevertheless, in addition to Hughes [27], other researchers used the wave momentum flux parameter to describe wave run-up for breaking and non-breaking waves alike, making use of only one equation (Equation (10)) for all of the wave conditions, e.g., [34] for irregular waves on rubble mound breakwaters and [14] for regular waves on rough, porous, and permeable slopes.
Hammeken Arana [14] investigated wave run-up on rough, porous, and permeable slopes with regular waves in hydraulic model tests and found that for breaking waves the wave run-up is best described by the surf similarity parameter ξ. For non-breaking waves, however, the influence of the wave length on wave run-up differed to that of breaking waves. Hammeken Arana therefore suggested a modified surf similarity parameter ϕ and a power function to describe wave run-up:
R u 2 % H s = a ϕ b = a ξ m 1 , 0 × h L m 1 , 0 b
Equation (11) is used for irregular waves, for which the empirical constants in the case of a smooth impermeable embankment are a = 2.11 and b = −0.17. The water depth h was implemented in the modified surf similarity parameter ϕ in order to make it a dimensionless parameter. As the water depth remained constant in the tests of [14] on which the parameter was validated, no statement can be made as to the specific influence of the water depth. More specifically, the modified surf similarity parameter should not be understood as incorporating a relative water depth as long as further tests with varying water depth are lacking.
Muttray [35] and Muttray et al. [32] reasoned that in front of a breakwater, a partial standing wave system is present, and therefore wave run-up can be interpreted as a slightly distorted anti-knot of the partial standing wave system. Therefore, the wave run-up height should be closely related to the height of the clapotis, which is the sum of the incident and reflected wave height. Using the reflection coefficient Cr = Hr/Hi, they gave the empirical equation:
R u 2 % H m 0 = a 1 + C r
For a rubble mound breakwater made of AccropodesTM with cot(α) = 1.5 and a permeable core, Muttray et al. [32] give a = 1.65 for TMA spectra with no wave breaking on the foreshore. While it is useful to sketch the physical process of wave run-up in this way, the usefulness of the model for design purposes depends not only on the quality of the description of wave run-up as a function of the wave reflection coefficient, but also on the quality of the model that describes the wave reflection coefficient as a function of wave parameters and structural parameters of the revetment or breakwater.
Irrespective of the parameter used to describe wave run-up, the wave run-up reduction due to hydraulic properties of rough, porous, and permeable revetments is accounted for by an influence factor in the equations presented herein. For rough revetments subject to irregular waves, some equations have been derived that describe the influence factor depending on the wave parameters and structural parameters of the revetment. However, they are each only valid for one type of rough revetment, see, for example, [26] for stepped revetments or [28] for block revetments with enhanced roughness. In conclusion, no method to determine the wave run-up height on MGRRs is available yet, nor have the influence factors been determined. Which combination of model and main influencing parameter is best suited for describing wave run-up on MGRRs remains to be investigated. This being said, the specific objectives of this work are:
  • To analyze the wave run-up process in the presence of partially or fully mortar-grouted riprap
  • To determine the appropriate influence factors in the framework of the EurOtop equations
  • To contrast this wave run-up formulation and provide comparisons with formulations of Hughes [27], Muttray et al. [32], and Hammeken Arana [14].

2. Materials and Methods

To achieve the aforementioned objectives, an experimental approach at full scale was chosen, since flow processes with larger void fractions of air as well as turbulent flow through riprap and geotextiles is addressed. To that end, a state-of-the-art, large-scale wave flume facility was employed. The GWK of the Coastal Research Centre (FZK) is a joint research facility of Technische Universität Braunschweig and Leibniz Universität Hannover. The GWK has a length of 307 m, a depth of 7 m, and a width of 5 m. A piston-type wave generator generates regular waves with heights up to H = 2 m and periods up to T = 10 s, as well as irregular waves with significant wave heights of up to Hs = 1.4 m and peak periods of up to Tp = 12 s [36].

2.1. Revetment Configurations

Four different configurations of mortar-grouted riprap revetments were tested in the flume. The width of the embankment section was split in half by a thin wooden wall (see Figure 2). By splitting the embankment section of the flume in half, two revetment configurations were tested at the same time, and a maximum of different revetment configurations and wave parameters could be tested while minimizing testing time. The separation wall separated the hydraulic processes on and beneath the revetment effectively, as was also reported by [22] and [37], who employed a separation wall as well. At the toe of the structure, the wave characteristics were the same across the whole width of the flume and therefore also for both revetments. Adding to this, no cross-directional waves were observed in the flume. The setup with the separation wall resulted in two test phases; phase one with partially grouted and phase two with fully grouted riprap.
The slope angle of all of the revetment configurations was cot(α) = 3. On the north side of the separation wall (see Figure 2), a 0.6 m thick riprap revetment was built, while on the south side, the thickness of the revetment was t = 0.4 m. These revetment thicknesses were chosen because a thickness of 0.4 m represents the minimum thickness of a MGRR made of riprap of stone weight class LMB5/40, while most MGRRs have a thickness of 0.6 m [38]. Before the first test phase, both revetments were partially grouted with 80 l/m2 mortar. Assuming a porosity of 0.45 before grouting (riprap dumped in dry conditions and with medium density according to [39]), this resulted in permeable revetments after grouting, with a porosity of 0.25 (t = 0.4 m) and 0.32 (t = 0.6 m), respectively.
Before test phase two, the revetment on the south side of the separation wall was removed completely and replaced by a riprap revetment with a layer thickness of 0.4 m. This revetment was then fully grouted so that the whole pore volume of the stone layer was filled with mortar. This constitutes the standard process of constructing an impermeable, fully-grouted revetment [39]. The amount of mortar needed to fill up the entire pore volume was 180 l/m2, confirming the assumption of a porosity of 0.45 before grouting, which results in an available pore volume of 180 l/m2 (0.45 × 0.4 m × 1000 l/m3) before grouting.
The revetment on the north side of the separation wall was not removed, but instead grouted until the top layer was apparently impermeable. The amount of mortar needed for this was 100 l/m2, confirming that the lower part of the cross-section of the top layer still exhibits a free pore volume and is only partially grouted. The potential free pore volume before any grouting of the top layer took place (before test phase 1) was 270 l/m2 (0.45 × 0.6 m × 1000 l/m3), thus, a pore volume of 90 l/m2 was still available in the lower part of the top layer in test phase two. The overall volumetric porosity of the revetment equaled 0.16, while it was at the same time impermeable for any flow perpendicular to the embankment. The revetments were grouted by hand by the staff of experienced contractors that have been grouting MGRRs for decades.
The revetment on the north side that was re-grouted after a partial grouting is of particular, yet practical, relevance. It represents a revetment that was constructed as a permeable revetment, but, due to repair works, during which the damaged parts of the revetment were re-grouted with mortar, got more and more impermeable over the years. It also represents a revetment which was designed as a fully grouted revetment, but was grouted with mortar that was not sufficiently fluidized and poorly adjusted to fill the free pore volume of the riprap. However, this is consequential only for other loading characteristics, like pressures beneath the revetment, and does not influence wave run-up heights of this revetment configuration. All revetment configurations that were tested and their characteristics are listed in Table 2.
All top layers were placed on a geotextile (permeability k10,H50mm = 2.86 × 10⁻³ m/s, thickness 8 mm, characteristic opening size 0.1 mm), which was directly placed on the sand embankment. The toe structure of the revetment below the lowest wave run-down was made of concrete blocks (see Figure 2a and Figure 3) in order to support the revetment. By this means, an efficient construction of the revetment was ensured, covering only the relevant section of the slope with grouted riprap material. The crest of the embankment was constructed of concrete blocks behind which any overtopping water was collected in a basin and discharged back into the flume during the tests. The cross-section of the revetment on the north side of the flume is shown in Figure 3.
The riprap used for the top layer was stone weight class LMB5/40, with a median weight of G50 = 23.5 kg and a narrow grading, with d85/d15 = 1.5.
In order for the mortar to be used for grouting riprap, it has to fulfill requirements for fresh and hardened grout according to the Code of Practice “Use of Cementitious and Bituminous Materials for Grouting Armourstone on Waterways” [39], which particularly states requirements concerning the consistency of the fresh grout, ensuring a good distribution of mortar inside the pore space of the riprap that results in a “sufficient” permeability and bonding of the individual stones. This can be done either by adding additives to the mortar or by mixing it in a colloidal mixer with high velocity shear action [40]. The latter method was chosen for grouting the riprap for the experiments in the GWK. The mortar was tested and fulfilled all requirements according to [39].

2.2. Instrumentation

The aim of the investigation was to describe wave loading on MGRRs as a function of wave parameters and structural parameters. Incident wave parameters, wave run-up, and wave-induced pressures on and beneath the revetment were measured. For the results presented in this work, only wave run-up is addressed. Figure 4 shows a longitudinal section of the GWK and the instrumentation relevant for investigations on wave run-up.
In order to measure the wave parameters, two wave gauge arrays were set up in the GWK, each consisting of four resistance type wave gauges, sampled at a measuring frequency of 100 Hz. The wave gauge array next to the revetment was used to calculate the wave parameters at the toe of the structure. Analyzing the signal of the four wave gauges with the computer program L~davis (Leichtweiß-Institute for Hydraulic Engineering and Water Resources 2017, TU Braunschweig, Germany, see also [41]), which makes use of the method of Mansard and Funke [42], gave the incident and reflected wave parameters. Wave reflection at the wave paddle was prevented by active wave absorption. Using the incident wave period Tm−1,0, the fictitious wave length in deep water according to the EurOtop Manual [8] was calculated:
L m 1 , 0 = g T m 1 , 0 2 2 π
The fictitious surf similarity parameter in deep water was calculated with Equation (14) [8].
ξ m 1 , 0 = tan α H m 0 L m 1 , 0
The wave run-up height was measured using 2D-LIDAR, which is a proven method for reliable water surface measurements [43,44], especially on revetments [45,46]. Two 2D-LIDAR scanners of type LMS511 manufactured by SICK [47] Hofland et al, gave a line measurement of wave run-up along the center axis of each revetment configuration. The measuring frequency was set to 25 Hz, resulting in an angular resolution of 0.167°. For the distances between measured surfaces and the scanner recorded during wave run-up in the experiments (Δ ≈ 7.9…11 m), the systematic error of the scanner was ± 25 mm and the statistical error ± 6 mm. The laser scanners were installed in the middle of each revetment section under the roof of the GWK (11.83 m above the bottom of the flume), with the minimum (perpendicular) distance between the laser scanners and the surface of the revetment at the still water line, with Δ = 7.9 m.
Calibration of the laser scanner was done by placing three beams across the top edge of the flume, whose positions in the coordinate system of the GWK were measured beforehand. That way, the local coordinates logged as angle and distance to the laser scanner could be converted to the coordinate system of the GWK.
The laser scanner is only able to measure a surface if the reflection from this surface is diffuse [46]. During wave run-up on MGRRs for almost all wave parameters, a great amount of turbulence was introduced and therefore air bubbles were entrained in the wave run-up front, yielding a distinct white water front at the tip of the wave running up the slope, see Figure 2b. There was also some sand from previous experiments and from the water supply dissolved in the water. The water surface on the revetment was therefore well-detected by the laser scanners.

2.3. Experimental Program

The revetments were exposed to JONSWAP spectra with a minimum of 1000 waves per test. Wave heights from Hm0 = 0.38–0.94 m and wave periods from Tm−1,0 = 2.7–9.0 s were generated, which resulted in surf similarity parameters ξm−1,0 = 1.55–4.64. In this way, a wide range of wave-loading conditions and breaker types were covered. The still water level in all experiments was set to 4 m at the toe of the structure. A list of the experimental conditions used for the experiments described in this work is provided with all results (see Section 3) in the appendix.

2.4. Detection of the Wave Run-Up Height

The data of the calibrated 2D-LIDAR scanners was processed with MATLAB (MathWorks® MATLAB R2018b, Natick, MA, USA) routines, including various filter functions. The LIDAR data was used to determine the water surface elevation on the revetment using the difference between the measured surface of the revetment and the measured surface (water and revetment) at each time step. These elevation data were filtered for outliers, which are detected by criteria describing non-physical values, such as measured points above the canal height or wave run-up velocities exceeding a physically meaningful range. Considering the systematic error of the 2D-LIDAR scanner, to identify the top of the leading edge of the water surface on the revetment, the minimum layer thickness was defined with a limit of 25 mm. From this data, time series of the wave run-up were established.
In addition, the wave run-up heights detected with the LIDAR data were validated by a video analysis for every test. Two cameras each filmed one side of the revetment during the tests. The wave run-up height was detected semi-automatically by manually marking the point of highest wave run-up and relating the position of the pixels in the video frame to the coordinates in the GWK coordinate system. The relation between pixels in the video frames and the GWK coordinate system was established with characteristic points in the video frames that were clearly visible and whose coordinates in the GWK coordinate system were known.
Subsequently, the wave run-up height Ru2% that is exceeded by 2% of the incoming waves was determined.

2.5. Error Evaluation of Different Equations and Parameters

The bias, root mean squared error (RMSE), and scatter index (SI) were used in this work to compare the predictions of different models and parameters to the measured values:
bias = 1 N i = 1 N R u 2 % , p , i R u 2 % , m , i
RMSE = 1 N i = 1 N R u 2 % , p , i R u 2 % , m , i 2
SI = RMSE 1 N i = 1 N R u 2 % , m , i
Here, Ru2%,p denotes the predicted run-up height, Ru2%,m is the measured run-up height, and N is the number of experiments conducted. Note, however, that in Equations (15)–(17), the run-up height Ru2% in meters was used instead of its dimensionless form in order to directly compare the predicted values of the empirical Equation (2) and Equations (10)–(12) used for modeling wave run-up on MGRRs, because these equations make use of either Ru2%/Hm0 or Ru2%/h. Consequently, bias and RMSE are in unit meters.

3. Results

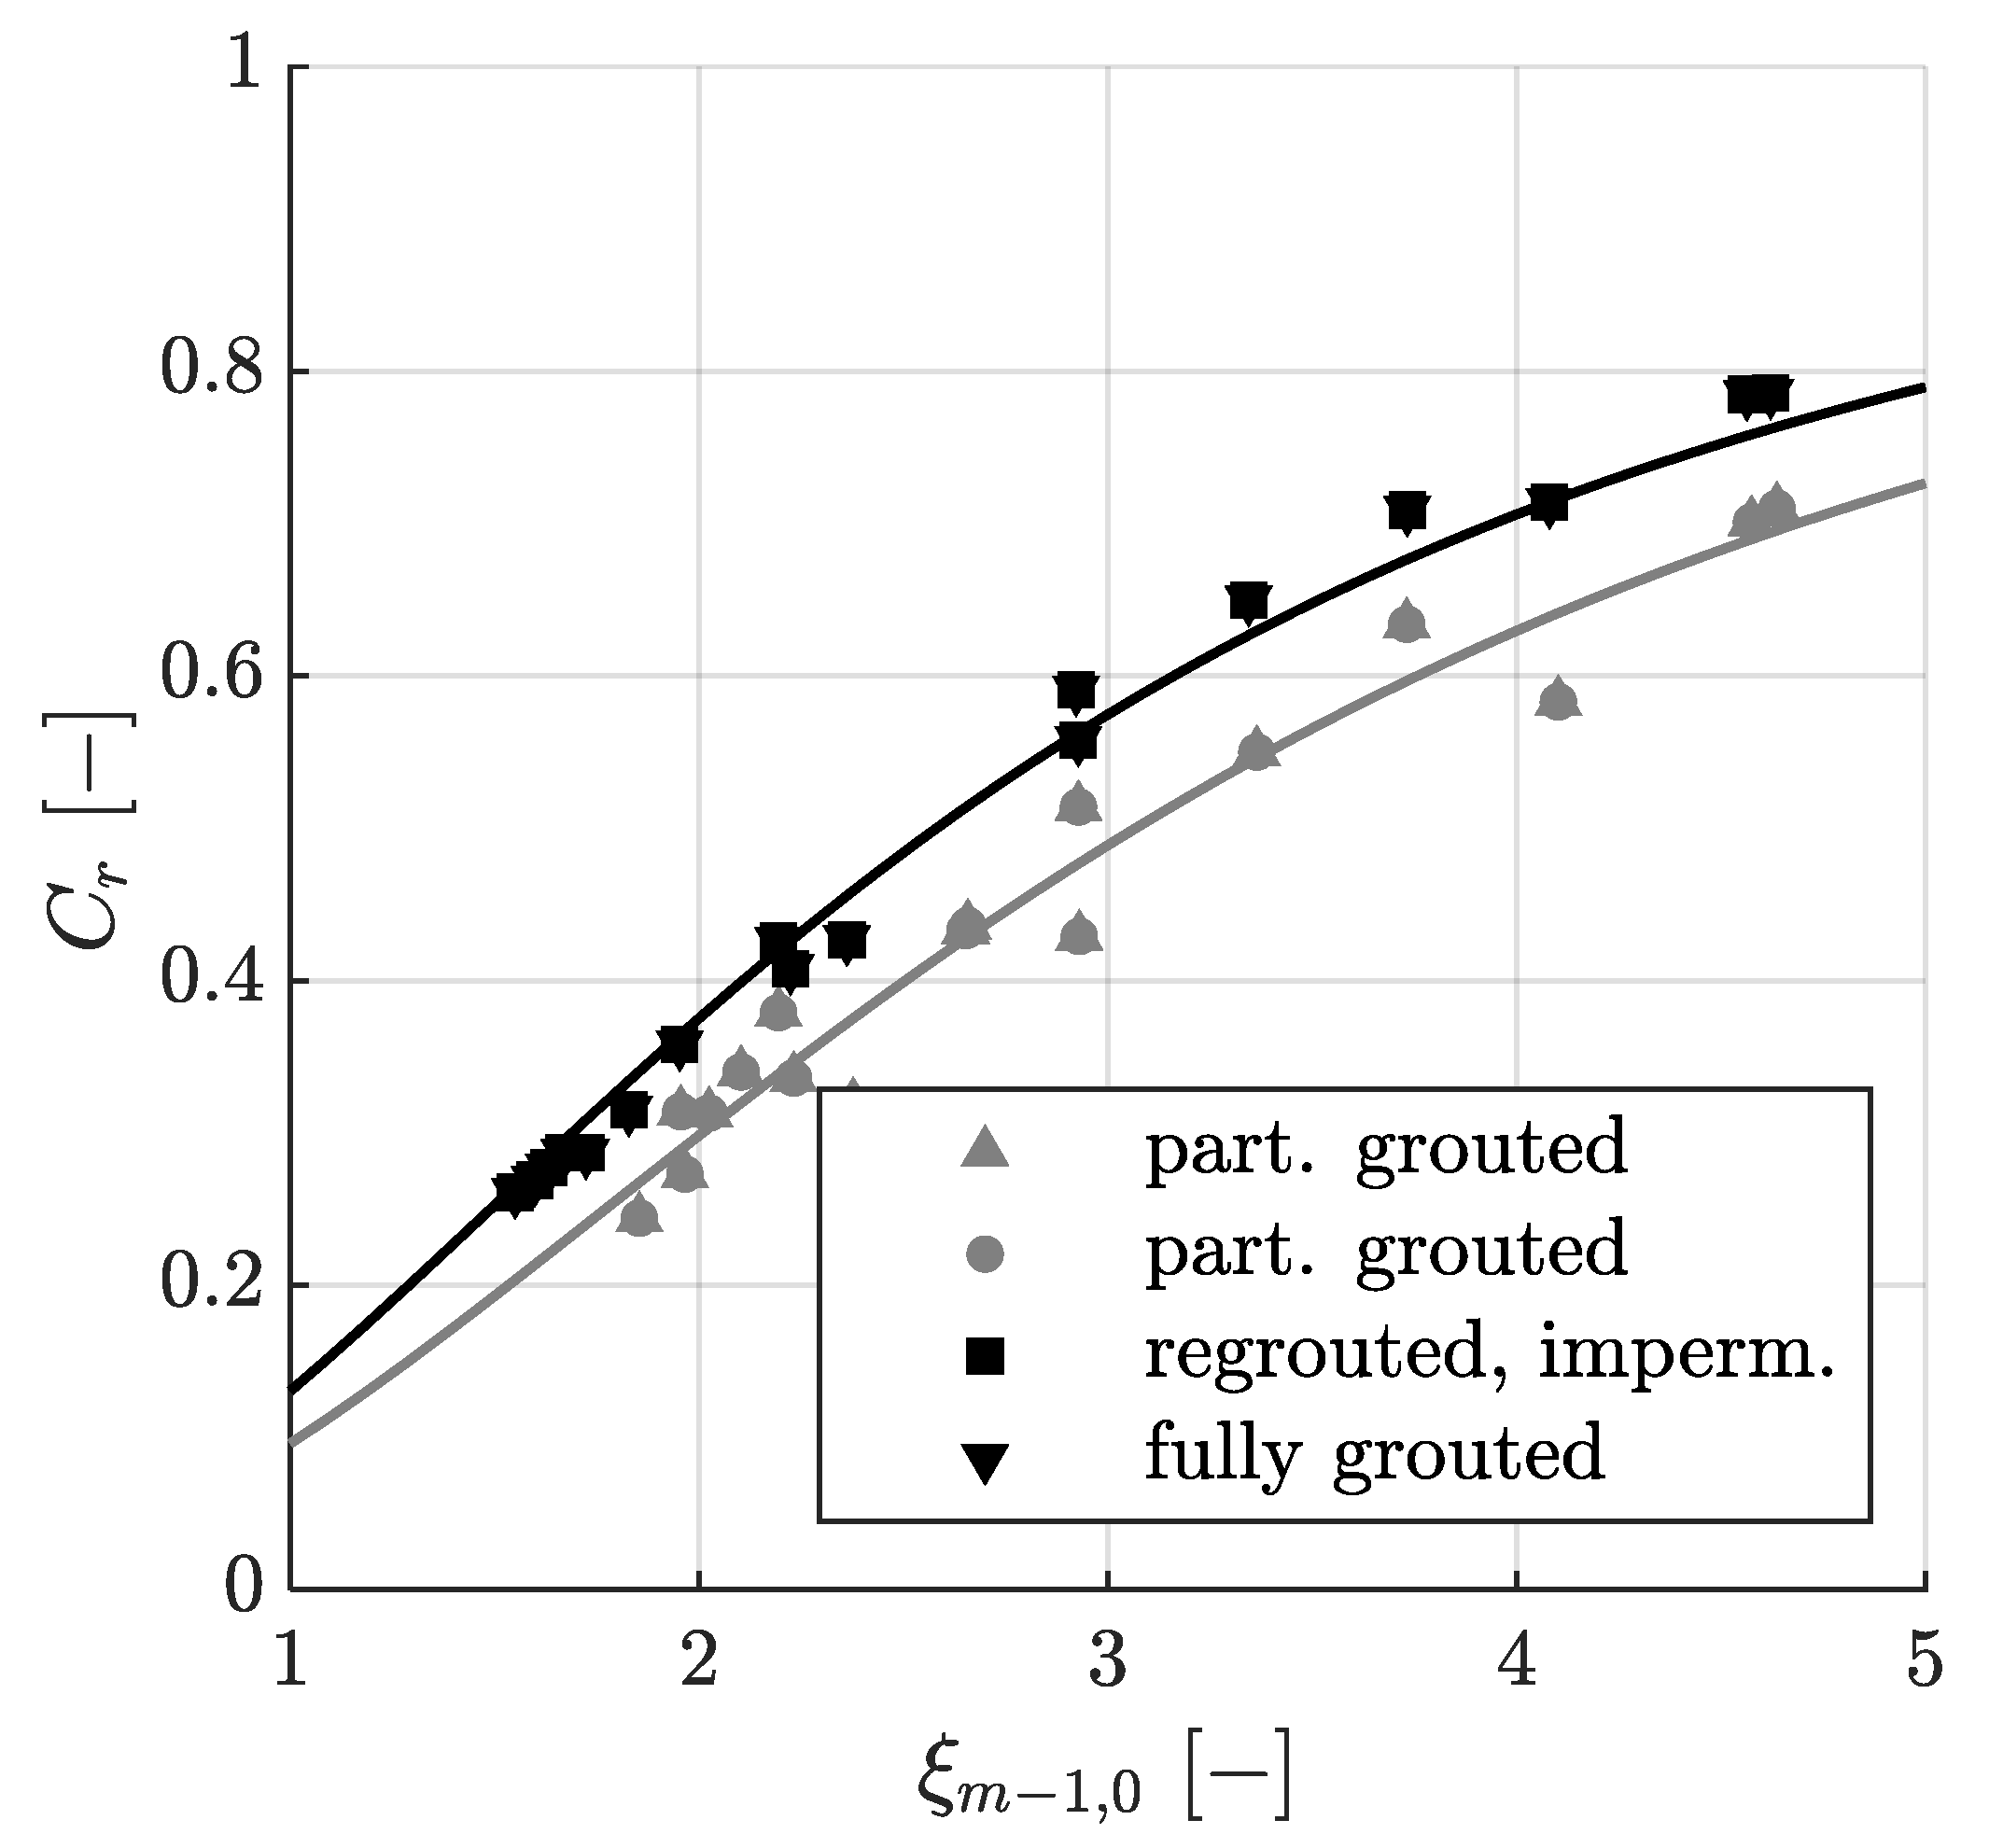
3.1. Relative Wave Run-Up Height as a Function of Surf Similarity Parameter ξm−1,0

Figure 5 presents the relative wave run-up height exceeded by 2% of the incoming waves Ru2%/Hm0 dependent on the surf similarity parameter ξm−1,0 for the partially grouted and fully grouted MGRRs. Only results with less than 2% wave overtopping events and without wave breaking in the flume are presented. For reference, Equation (2) for smooth impermeable revetments (γf = 1) and a riprap revetment with two layers (γf = 0.55) are plotted in Figure 5 as well.
A distinct reduction of the wave run-up height in comparison to a smooth impermeable revetment was seen for both the partially grouted and the re-grouted impermeable MGRR, with a top layer thickness t = 0.6 m in Figure 5a. Wave run-up was lower for the partially grouted MGRR than for the re-grouted MGRR because of higher roughness and due to the fact that the partially grouted MGRR was permeable, and therefore the water could penetrate into the porous revetment. While there is only small scatter in the results of the partially grouted MGRR for surf similarity parameters ξm−1,0 < 3, and these are well-described by Equation (2), scatter increases for ξm−1,0 > 3. Regarding the fully grouted MGRR, there is less scatter, with the exception of two particularly high wave run-up heights for ξm−1,0 = 2.36 and ξm−1,0 = 4.62. The influence factor γf was determined by least square fitting of Equation (2) to the measurements, yielding influence factors of 0.72 and 0.86 for the partially grouted and re-grouted MGRR, respectively. Because there was no berm and all waves approached the revetment perpendicularly, the influence factors for a berm γb and oblique wave attack γβ were set to unity. Statistical parameters for all models are given in the discussion section to compare them more easily.
Qualitatively, the same statements hold true for the partially and fully grouted MGRR with a thickness of t = 0.4 m (see Figure 5b). The influence factor in Equation (2) was γf = 0.88 for the fully grouted and γf = 0.79 for the partially grouted MGRR.
Comparing the wave run-up heights of the different top layer thicknesses of the partially grouted MGRR in Figure 5a,b, it can be seen that the wave run-up heights for t = 0.6 m (γf = 0.72) were lower than for t = 0.4 m (γf = 0.79). Since the same amount of mortar (80 l/m2) was used for both revetments, the 0.6 m thick revetment had a higher porosity and thus a higher permeability than the 0.4 m thick revetment. During wave run-up, water could therefore penetrate the existing pore space more easily. The pore volume after partially grouting for the 0.6 m thick revetment was 270 l/m2 − 80 l/m2 = 190 l/m2, and for the 0.4 m thick revetment was 180 l/m2 − 80 l/m2 = 100 l/m2 (see also Table 2). The roughness was also higher in the case of the thicker revetment, as the riprap was less embedded in the mortar.
The difference in wave run-up heights when comparing the different cover layer thicknesses of the fully grouted cover layers was much smaller, cf. Figure 5a,b as well as the influence factors γf = 0.86 (t = 0.6 m) and γf = 0.88 (t = 0.4 m). Since both cover layers were impermeable, the different wave run-up heights could only be caused by different roughness of the cover layers. This is also supported by the fact that the differences in wave run-up heights are largest for small surf similarity parameters and become smaller for larger surf similarity parameters. A decreasing influence of roughness on wave run-up heights with increasing surf similarity parameters is widely described in the literature, see for example [8,26,28]. This is modeled in Equation (2) by the steady increase of the influence factor γf,surging with increasing surf similarity parameter ξm−1,0 > 1.8, which becomes γf = 1 when ξm−1,0 ≥ 10. However, as described in the EurOtop manual, the maximum relative wave run-up height does not become the same as for smooth impermeable revetments for all types of revetments. For example, in the case of a two-layer riprap revetment on an impermeable embankment, the maximum relative wave run-up height is Ru2%/Hm0 = 3 [8]. However, this maximum is not reached until ξm−1,0 ≈ 7.6, which is out of the range of the investigated surf similarity parameters of this work. Further research towards the maximum relative wave run-up height will be required to cover that range of surf similarity parameters.

3.2. Relative Wave Run-Up Height as a Function of the Momentum Flux Parameter MF

Figure 6 presents the wave run-up height relative to the water depth Ru2%/h dependent on the dimensionless momentum flux parameter MF/(ρgh2) for MGRRs. Equation (10) with corresponding influence factors γf,M (see caption of Figure 6) as well as Equation (10) for smooth impermeable revetments (γf,M = 1) and a riprap revetment (two layers, γf,M = 0.51) are also plotted in Figure 6 for comparison.
As for the qualitative description of the differences between the results of the wave run-up heights on MGRRs, refer to Section 3.1. When plotting the wave run-up height as a function of the wave momentum flux parameter, especially for the fully grouted MGRR, only small scatter in the results is present. However, there is slightly larger scatter for the partially grouted MGRR.
According to the breaker criterion of Hughes [31], which classifies waves with Hm0/Lp > 0.0225 as breaking waves, 7 of 17 tests on the fully grouted MGRRs and 3 of 16 tests for the partially grouted MGRRs were conducted with breaking waves in the GWK tests. However, Equation (10) for breaking waves was used to describe all results, as Hughes [27] also does for riprap revetments. Hughes [27] justifies using a single equation, as there was no clear difference in run-up behavior for breaking and non-breaking waves according to the breaker criterion for the data of [30,33], and as the wave run-up heights for riprap are well-described by Equation (10). This is the case for MGRRs as well.

3.3. Relative Wave Run-Up Height as a Function of the Modified Surf Similarity Parameter ϕ

Figure 7 presents the relative wave run-up Ru2%/Hm0 as a function of the modified surf similarity parameter ϕ for MGRRs. According to the breaker criterion defined by Hammeken Arana [14], which classifies waves with tanα/(Hs/h) < 1.4 as breaking waves, all tests on the MGRRs were tests with non-breaking waves. This suggests the applicability of Equation (11), which according to [14] is valid only for non-breaking waves. The modified surf similarity parameter ϕ has, to the authors’ knowledge, up until now not been used to describe wave run-up on rough, porous, and permeable revetments under irregular waves, so no comparison for a lower limit of relative wave run-up can be provided. As a comparison for an upper limit, Equation (11) for smooth impermeable revetments with a = 2.11 and b = −0.17 according to [14] is plotted in Figure 7. To make the predictions with Equation (11) comparable to the results for MGRRs, it is assumed that Hs = Hm0.
As can be seen in Figure 7, the trend in the wave run-up heights of MGRRs is described reasonably well by Equation (11) and for all configurations except the partially grouted MGRR with t = 0.4 m (b = −0.22), with b = −0.18 almost equal to that of smooth impermeable revetments with b = −0.17 [14].
For partially grouted MGRRs, the wave run-up heights are underestimated by Equation (11) and the respective best fit parameters a and b for ϕ > 0.38, in which case they are close to Equation (11) for smooth impermeable revetments given by Hammeken Arana [14]. For smaller ϕ, the measured wave run-up heights decreased and remained almost constant until for ϕ < 0.2 they increased sharply (see Figure 7).
The measured wave run-up for fully grouted MGRRs is subject to high scatter when plotted as dependent on ϕ. Here again, as for the partially grouted MGRRs, wave run up heights sharply increased for ϕ < 0.2, which is poorly described by Equation (11). The wave run-up height is in many cases higher for fully grouted MGRRs than predicted for smooth impermeable embankments by Equation (11) with empirical factors by [14].

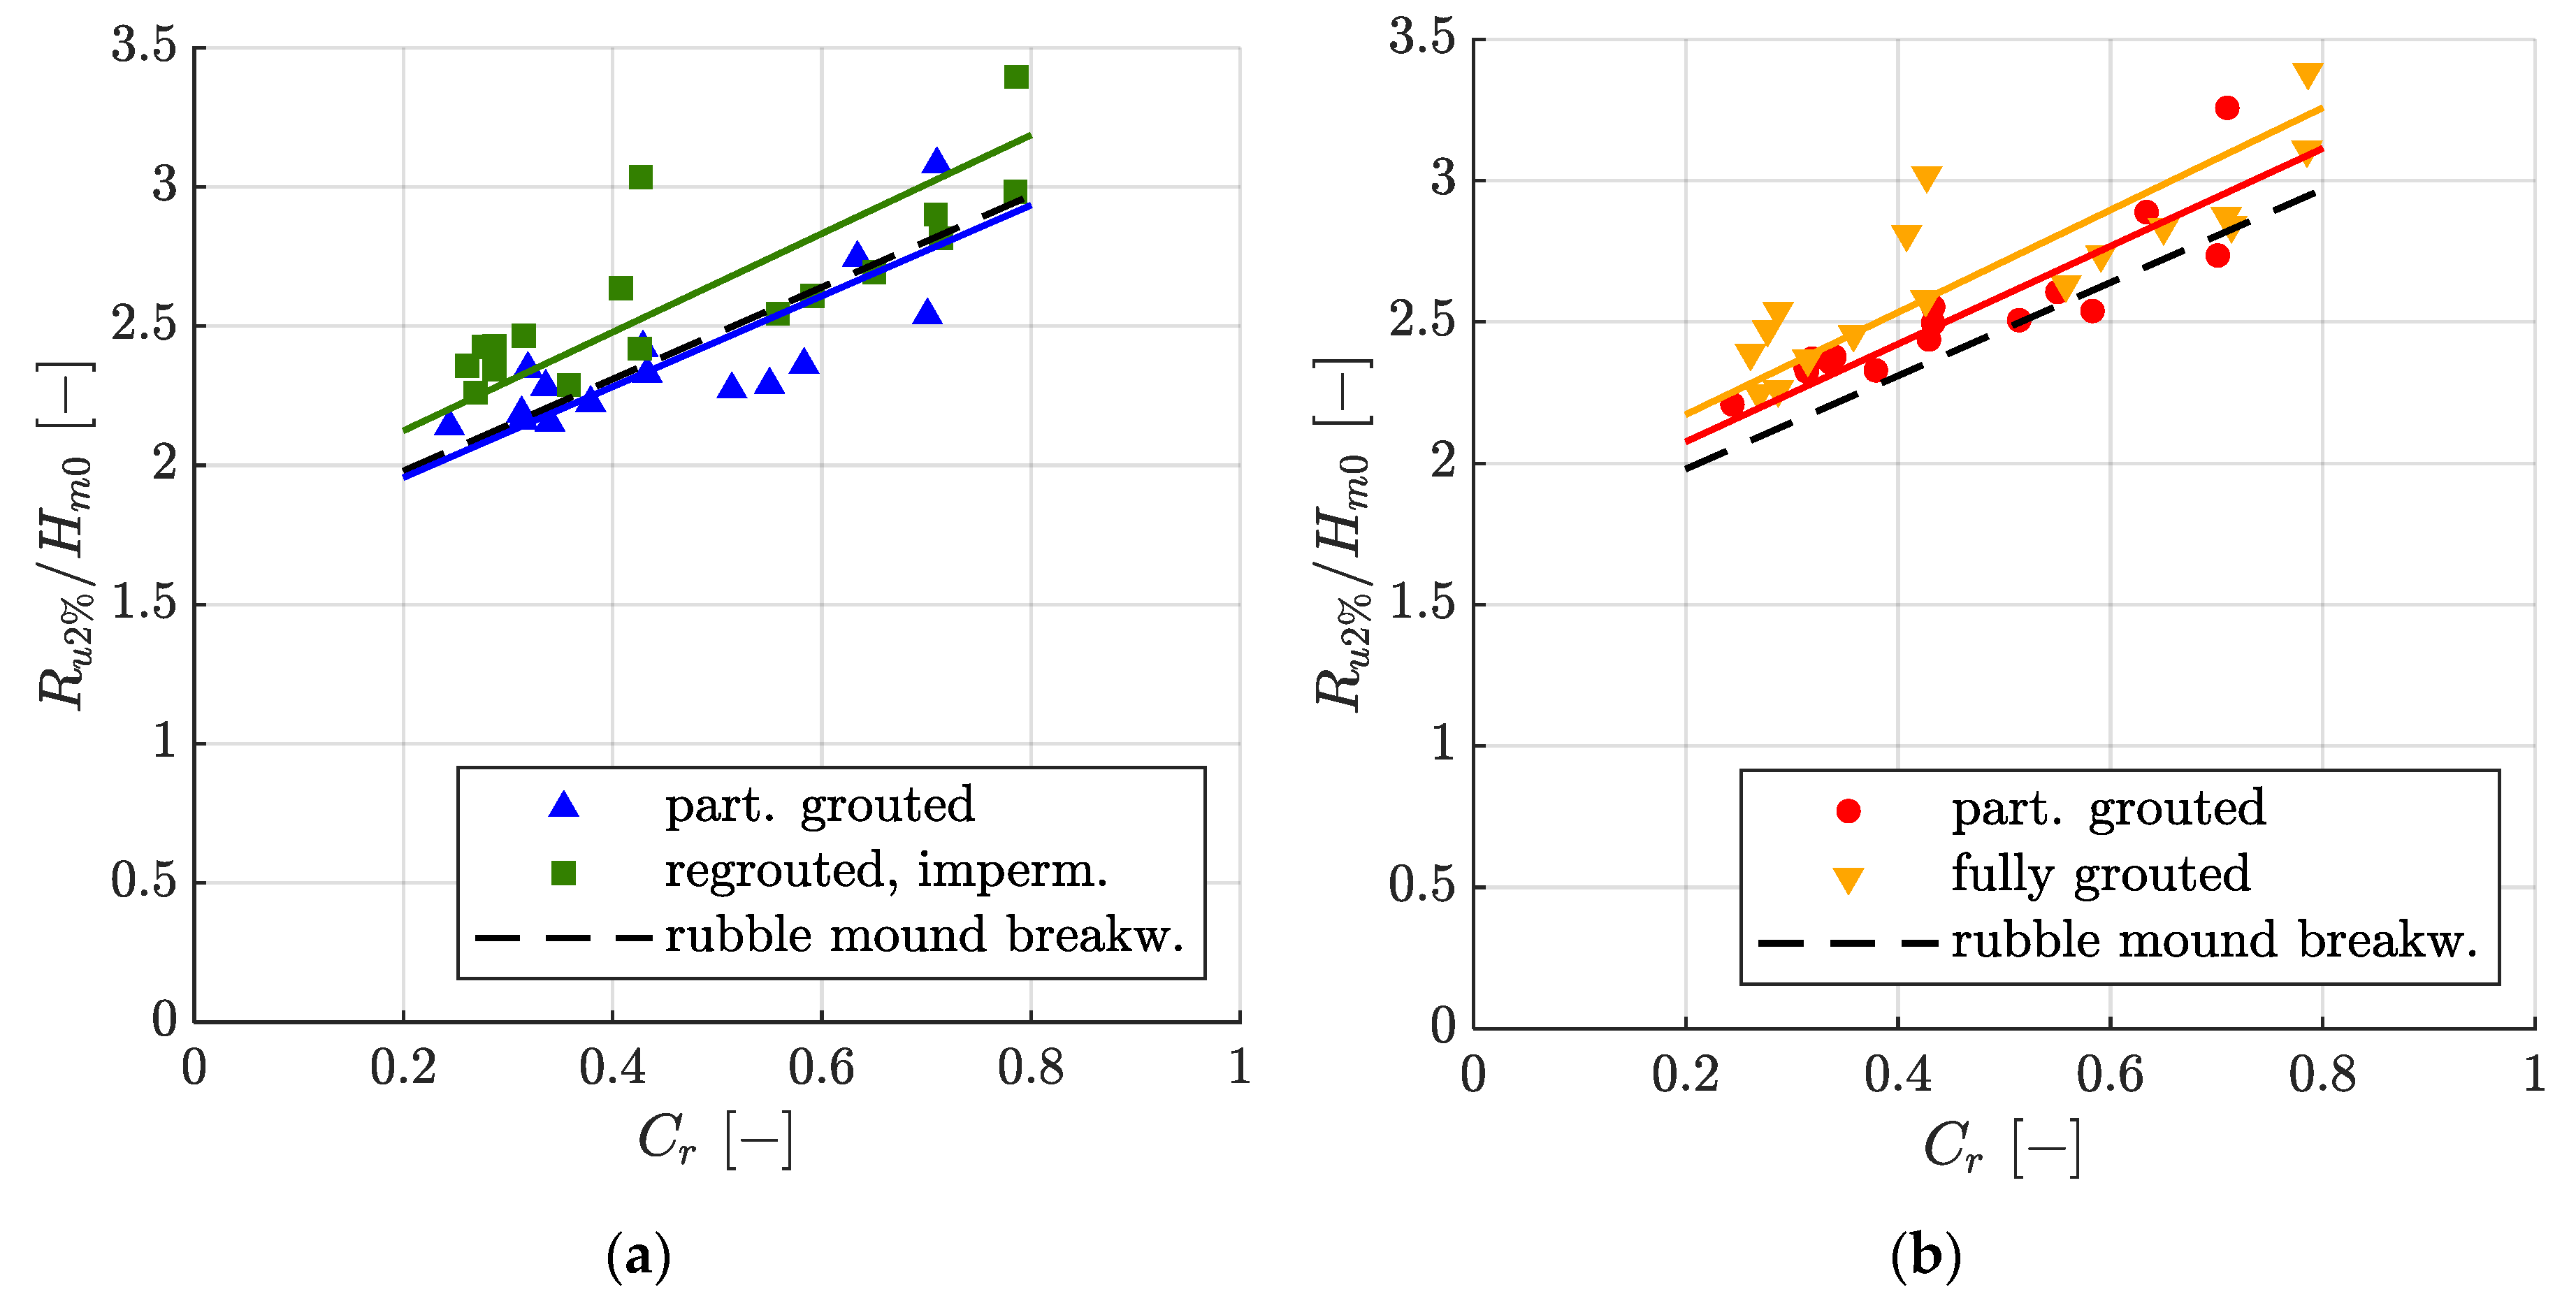
3.4. Relative Wave Run-Up Height as a Function of the Reflection Coefficient Cr

Figure 8 presents the relative wave run-up Ru2%/Hm0 dependent on the reflection coefficient Cr for MGRRs. Equation (12) with corresponding empirical factors a (see caption of Figure 8) as well as, for reference, Equation (12) for a rubble mound breakwater with cot(α) = 1.5 (a = 1.65 [32]) is plotted in Figure 8.
The linear trend of wave run-up heights as a function of the reflection coefficient as described by Equation (12) was also observed for MGRRs. For partially as well as for fully grouted MGRRs, scatter increases for increasing reflection coefficients. There were three exceptionally high wave run-ups for fully grouted MGRRs at Cr ≈ 0.4 and Cr ≈ 0.8. No distinction was made between breaking and non-breaking waves when wave run-up was described as a function of the reflection coefficient [32].
When designing a revetment for wave run-up, the reflection coefficient has to be calculated from wave parameters and structural parameters. Figure 9 shows the reflection coefficient for MGRRs dependent on the surf similarity parameter ξm−1,0, as well as Equation (18) [48], with c1 = 1.0 and c2 = 9.4 for partially grouted and c1 = 1.0 and c2 = 6.7 for fully grouted MGRRs.
C r = H r H i = c 1 × ξ m 1 , 0 2 c 2 + ξ m 1 , 0 2
In Equation (18), Hr denotes the reflected wave height and Hi the incident wave height.

4. Discussion

Generally, the wave run-up heights on MGRRs are lower than for smooth impermeable revetments and higher than for non-grouted riprap revetments. The results were further checked for plausibility by comparing the results gained with the 2D-LIDAR data to the visual evaluation of wave run-up heights using video cameras. In the following, the accuracy of the 2D-LIDAR measurements, the quality of the description of the measured wave run-up heights with different parameters, and the use of the influence factors are discussed.

4.1. 2D-LIDAR Measurements

The accuracy of the 2D-LIDAR measurements will be discussed by referencing the wave run-up heights dependent on the surf similarity parameter ξm−1,0 (see Figure 5). While there was only small scatter in the results of the partially grouted MGRRs for surf similarity parameters ξm−1,0 < 3, scatter increased for ξm−1,0 > 3 and is higher for the top layer with t = 0.6 m compared to the top layer with t = 0.4 m. This could be because the LIDAR scanner gives a line measurement of the wave run-up only. During the tests in the GWK, differences in wave run-up perpendicular to the embankment slope were observed visually. Using the video data, this difference is estimated to be at maximum roughly ΔRu2%/Hm0 ≈ 0.25 for partially grouted MGRRs and smaller for fully grouted MGRRs. Thus, using a line measurement of wave run-up like an LIDAR scanner for revetments with bigger surface irregularities may introduce arbitrary scatter depending on the position of the line scan on the revetment. This resulting scatter seems to occur in the same magnitude for all wave conditions and tests presented in this paper. It therefore generally accounts for some scatter, but does not explain the increase in scatter for ξm−1,0 > 3.

4.2. Comparison of Models and Corresponding Parameters

The performance of the empirical models and corresponding parameters to describe wave run-up on MGRRs is compared given the statistical parameters in Table 3 and the description of the results in Section 3.
In case of the partially grouted MGRRs, Equation (12) (Ru2%/Hm0 = f(Cr)) performs best, as it gives the lowest RMSE and SI, but the differences between the quality of the model predictions are generally small. All models give an absolute bias < 0.02 m, a RMSE < 0.12 m, and a SI < 8.17 %. Equation (11) (Ru2%/Hm0 = f(ϕ)) performs worst judged by the statistical parameters, but also judging by the qualitative comparison between predicted and measured values (cf. Section 3.3).
Although Equation (12) performs best for partially grouted MGRRs judged by the statistical parameters given in Table 3, when designing a MGRR for wave run-up, the reflection coefficient has to be determined as a function of the wave parameters and structural parameters of the revetment. This gives additional uncertainty when designing a specific structure, although Equation (18) predicts the reflection coefficient with high accuracy. This uncertainty is higher (or put differently: the quality of the prediction deteriorates) for partially grouted MGRRs, because in describing the reflection coefficient as a function of the surf similarity parameter, it is implicitly assumed that the slope angle and wave steepness are the predominant factors influencing the reflection coefficient. When the roughness, porosity, and permeability of the structure gain importance in the dissipation of energy during wave run-up, their influence is not comprehensively modeled using the surf similarity parameter [32]. Furthermore, the wave reflection coefficient cannot be measured directly, but it is itself calculated from the incident and reflected wave height, which are determined using a method (in this case, the method of Mansard and Funke [42]) to separate these two wave heights from the original measurements of the water depth.
Regarding the fully grouted MGRRs, Equation (2) (Ru2%/Hm0 = f(ξm−1,0)) performs best (zero bias, RMSE < 0.11 m and SI < 6 %), although there are two exceptionally high wave run-up heights for ξm−1,0 = 2.36 and ξm−1,0 = 4.62 (cf. Section 3.1). The prediction of the reflection coefficient as a function of the surf similarity parameter is very good for fully grouted MGRRs (see Figure 9) and better for partially grouted MGRRs because of the aforementioned reasons, yielding better input parameters to Equation (12) (Ru2%/Hm0 = f(Cr)). However, wave run-up on fully grouted MGRRs is not as well described as by Equation (2) (see Table 3).
As in the case of partially grouted MGRRs, again, Equation (11) (Ru2%/Hm0 = f(ϕ)) performs worst of all models for fully grouted MGRRs. For both fully grouted and partially grouted MGRRs, there is a sharp increase in wave run-up height for ϕ < 0.2 that cannot be modeled by Equation (11) (cf. Section 3.3).
Equation (11) for smooth impermeable revetments, as given by Hammeken Arana [14], in some cases predicts lower wave run-up heights than were measured for partially grouted MGRRs and in a majority of cases for fully grouted MGRRs. The coefficients in Equation (11) for smooth impermeable slopes were fitted to the results for irregular waves that were generated with a numerical model, which was calibrated and validated with physical model tests with regular waves only [14]. A validation with data of irregular waves was not done. Furthermore, each numerical simulation had a duration of 300 s, with the peak period of the JONSWAP wave spectra ranging from Tp = 1–2.86 s [14], so the number of incident waves may roughly have been 400 at maximum. Thus, the above stated absolute values of these parameters (a = 2.11 and b = −0.17 [14]) for smooth impermeable embankments, due to the way they were determined, should not be regarded as reliable or valid as long as a comparison to validated physical model tests with irregular waves is missing. This could explain why, using these values, in some instances lower wave run-up heights are predicted for smooth impermeable revetments than were measured for MGRRs (cf. Figure 7).
For the interpretation of the results of Equation (10) and the corresponding relative wave run-up Ru2%/h, it needs to be kept in mind that the water depth was kept at a constant level of 4 m during the tests. Therefore, no empirical data is available to determine how well Equation (10) performs and whether γf,M would remain constant in case the water depth changes.
Of the models describing wave run-up, Equation (2) from the state-of-the-art design guideline EurOtop [8] gives the best results for MGRRs, suggesting that the predominant factor influencing wave run-up on MGRRs is wave breaking on the revetment.

4.3. Further Discussion

The tests presented herein are among the scarce examples of full-scale hydraulic model tests of porous coastal structures, providing valuable information on wave−structure interaction, which is otherwise in scaled experiments especially susceptible to scale (and potentially model) effects. However, all empirical models and corresponding influencing factors presented in this work only apply to the wave parameters and structural parameters of the revetments examined in the hydraulic model test in the GWK, and must not be extrapolated beyond these parameters.
In all equations that describe wave run-up using an influence factor to account for roughness, porosity, and permeability, there is the implicit assumption that the wave run-up height for every type of revetment can be calculated by multiplying the wave run-up height of a smooth impermeable revetment with a reduction factor. Yet, the effect of permeability will vary with the wave period, thereby also influencing the effect of pore volume or porosity on the energy dissipation during wave run-up [27]. However, for the structural and hydraulic parameters investigated in the flume tests presented herein, this influence is assessed to be rather small, and a good description of the results is possible using a single influence factor.

5. Conclusions

Full-scale hydraulic model tests were conducted to determine wave run-up heights on partially grouted and fully grouted MGRRs. These full-scale hydraulic model tests are among the scarce examples of full-scale hydraulic model tests of porous coastal structures, providing valuable information on wave−structure interaction.
With regard to the objectives stated in Section 1, the main findings of this work are:
  • The wave run-up heights on MGRRs are generally lower than for smooth impermeable revetments and higher than for non-grouted riprap revetments. Partially grouted MGRRs, due to their roughness, porosity, and permeability, reduce wave run-up heights from 21% to 28%, and fully grouted MGRRs, due to their roughness, reduce wave run-up heights from 12% to 14% compared to smooth impermeable revetments.
  • Influence factors for the state-of-the-art design guideline EurOtop have been determined for four widely used revetment configurations, which can now be used for design purposes.
  • For the results acquired in the model tests, wave run-up for all MGRR configurations is best described by the state-of-the-art EurOtop equation, which describes wave run-up as a function of the surf similarity parameter ξm−1,0. The model of Hughes [27], which describes wave run-up as a function of the momentum flux parameter MF, also gives very good results. Models describing wave run-up as a function of the modified surf similarity parameter ϕ or the reflection coefficient Cr give poorer results for MGRRs.
The influence factors determined herein are each only valid for one specific revetment configuration of MGRR. Future research should concentrate on the effort to give a better understanding of and derive a quantitative correlation for the contribution of each of the individual factors reducing wave run-up, namely roughness, porosity, and permeability.

Author Contributions

Conceptualization: M.K., D.S., H.S. and N.G.; methodology: M.K., D.S., H.S. and N.G.; software: D.S. and B.B.; formal analysis: M.K., D.S. and B.B.; investigation: M.K. and others; data curation: D.S., B.B. and M.K.; writing—original draft preparation: M.K. and D.S.; writing—review and editing: H.S. and N.G.; visualization: M.K.; supervision: H.S. and N.G.; project administration: H.S. and N.G.; funding acquisition: H.S. and others. All authors have read and agreed to the published version of the manuscript.

Funding

This research was funded by the German Federal Ministry of Education and Research within the project “Wave Loading and Stability of Hydraulically Bonded Revetments”, grant numbers 03KIS110 and 03KIS111. The project was initiated in the framework of the German Coastal Engineering Research Council.

Acknowledgments

The authors thank the technical staff at the Coastal Research Center in Hannover. Further, the authors acknowledge the continued administrative and financial support of the Leibniz Universität Hannover and Technische Universität Braunschweig to operate and maintain the Coastal Research Center and its Large Wave Flume (GWK). The authors further would like to thank the project support group and Prof. Dr.-Ing. Hocine Oumeraci for their scientific support and expertise.

Conflicts of Interest

The authors declare no conflict of interest. The funders had no role in the design of the study; in the collection, analyses, or interpretation of data; in the writing of the manuscript, or in the decision to publish the results.

Appendix A

Table A1 lists the experimental conditions and all results described in this work.
Table A1. Experimental conditions and results.
Configuration Nr.Hm0 [m]Tm−1,0 [s]Tp [s]Lm−1,0 [m]Ru2% [m]Ru2%/Hm0 [-]Ru2%/h [-]ξm−1,0 [-]MF/(ρgh2) [-]Φ [-]Cr [-]Hm0/Lp [-]tan(α)/(Hm0/h) [-]
10.3752.733.0111.600.802.140.2011.850.0210.6390.240.0273.56
10.3896.147.0858.920.922.360.2304.100.0480.2790.580.0053.43
10.3833.534.0119.480.902.350.2252.380.0280.4880.320.0153.48
10.5776.146.5858.781.322.290.3303.360.0750.2290.550.0092.31
10.7596.136.8558.571.722.270.4312.930.1120.2000.510.0101.76
10.7657.849.2495.872.102.740.5253.730.1390.1560.630.0061.74
10.3894.394.8930.060.942.420.2362.930.0350.3900.430.0103.43
10.5798.3610.10109.071.472.540.3674.570.1050.1680.700.0042.30
10.6599.0412.18127.542.033.080.5084.640.1410.1450.710.0032.02
10.6673.974.2724.611.462.190.3642.020.0670.3290.310.0232.00
10.7644.415.0830.411.652.150.4112.100.0920.2770.340.0191.75
10.8534.875.3036.971.902.220.4742.190.1120.2370.380.0191.56
10.7654.114.4426.321.652.160.4131.960.0840.2970.310.0251.74
10.5804.855.3636.681.352.330.3382.650.0650.2890.430.0132.30
10.5724.054.4725.631.302.280.3262.230.0550.3480.340.0182.33
10.5804.855.3636.761.352.330.3382.650.0650.2890.430.0132.30
20.3752.733.0111.600.832.210.2071.850.0210.6390.240.0273.56
20.3896.147.0858.920.992.540.2474.100.0480.2790.580.0053.43
20.3833.534.0119.480.912.370.2272.380.0280.4880.320.0153.48
20.5776.146.5858.781.502.610.3763.360.0750.2290.550.0092.31
20.7596.136.8558.571.902.510.4762.930.1120.2000.510.0101.76
20.7657.849.2495.872.212.890.5523.730.1390.1560.630.0061.74
20.3894.394.8930.060.952.440.2372.930.0350.3900.430.0103.43
20.5798.3610.10109.071.582.740.3964.570.1050.1680.700.0042.30
20.6599.0412.18127.542.153.260.5374.640.1410.1450.710.0032.02
20.6673.974.2724.611.562.340.3902.020.0670.3290.310.0232.00
20.7644.415.0830.411.822.380.4542.100.0920.2770.340.0191.75
20.8534.875.3036.971.992.330.4972.190.1120.2370.380.0191.56
20.7654.114.4426.321.782.320.4451.960.0840.2970.310.0251.74
20.5804.855.3636.681.482.550.3702.650.0650.2890.430.0132.30
20.5724.054.4725.631.352.360.3372.230.0550.3480.340.0182.33
20.5804.855.3636.761.452.500.3622.650.0650.2890.430.0132.30
Table A2. Experimental conditions and results (continued).
Configuration Nr.Hm0 [m]Tm−1,0 [s]Tp [s]Lm−1,0 [m]Ru2% [m]Ru2%/Hm0 [-]Ru2%/h [-]ξm−1,0 [-]MF/(ρgh2) [-]Φ [-]Cr [-]Hm0/Lp [-]tan(α)/(Hm0/h) [-]
30.7684.114.4426.361.762.290.4391.950.0850.2960.360.0251.74
30.8564.875.4337.082.072.420.5182.190.1140.2370.430.0191.56
30.7606.126.8558.421.982.610.4962.920.1120.2000.590.0101.75
30.3863.523.6819.381.173.040.2932.360.0270.4880.430.0183.45
30.3904.394.5330.090.992.540.2482.930.0330.3890.560.0123.42
30.5826.137.0658.591.572.690.3923.340.0800.2280.650.0072.29
30.7637.838.4795.672.212.900.5533.730.1310.1560.710.0071.75
30.6649.0412.18127.652.253.400.5644.620.1420.1450.790.0032.01
30.3936.146.5758.901.112.820.2774.080.0460.2770.710.0063.39
30.5764.054.5525.631.522.640.3802.220.0560.3470.410.0182.31
30.5848.379.36109.461.742.980.4354.560.1000.1670.790.0042.28
30.7523.593.9020.101.832.430.4571.720.0750.3430.290.0321.77
30.7273.343.7917.451.762.430.4411.630.0700.3740.280.0331.83
30.9414.264.7728.312.322.470.5801.830.1210.2580.320.0271.42
30.9293.874.4223.322.182.350.5451.670.1130.2860.290.0301.44
30.9083.664.1020.872.052.260.5131.600.1040.3060.270.0351.47
30.7223.163.4315.611.702.360.4261.550.0640.3970.260.0391.85
40.7684.114.4426.361.892.460.4721.950.0850.2960.360.0251.74
40.8564.875.4337.082.212.580.5522.190.1140.2370.430.0191.56
40.7606.126.8558.422.082.740.5202.920.1120.2000.590.0101.75
40.3863.523.6819.381.173.020.2912.360.0270.4880.430.0183.45
40.3904.394.5330.091.032.630.2572.930.0330.3890.560.0123.42
40.5826.137.0658.591.652.830.4123.340.0800.2280.650.0072.29
40.7637.838.4795.672.192.880.5483.730.1310.1560.710.0071.75
40.6649.0412.18127.652.253.380.5624.620.1420.1450.790.0032.01
40.3936.146.5758.901.122.840.2794.080.0460.2770.710.0063.39
40.5764.054.5525.631.622.810.4052.220.0560.3470.410.0182.31
40.5848.379.36109.461.823.110.4544.560.1000.1670.790.0042.28
40.7523.593.9020.101.912.540.4771.720.0750.3430.290.0321.77
40.7273.343.7917.451.802.470.4501.630.0700.3740.280.0331.83
40.9414.264.7728.312.232.370.5571.830.1210.2580.320.0271.42
40.9293.874.4223.322.102.260.5251.670.1130.2860.290.0301.44
40.9083.664.1020.872.042.250.5101.600.1040.3060.270.0351.47
40.7223.163.4315.611.732.390.4311.550.0640.3970.260.0391.85

References

  1. Pilarczyk, K.W. Other Design Considerations. In Dikes and Revetments: Design, Maintanance and Safety Assessment; Pilarczyk, K.W., Ed.; Rijkswaterstaat, DWW: Delft, The Netherlands, 1998; pp. 407–428. ISBN 9054104554. [Google Scholar]
  2. Schoonees, T.; Gijón Mancheño, A.; Scheres, B.; Bouma, T.J.; Silva, R.; Schlurmann, T.; Schüttrumpf, H. Hard Structures for Coastal Protection, Towards Greener Designs. Estuaries Coasts 2019, 42, 1709–1729. [Google Scholar] [CrossRef]
  3. Rupprecht, F.; Möller, I.; Paul, M.; Kudella, M.; Spencer, T.; van Wesenbeeck, B.K.; Wolters, G.; Jensen, K.; Bouma, T.J.; Miranda-Lange, M.; et al. Vegetation-Wave Interactions in Salt Marshes under Storm Surge Conditions. Ecol. Eng. 2017, 100, 301–315. [Google Scholar] [CrossRef] [Green Version]
  4. Anderson, M.E.; Smith, J.M. Wave Attenuation by Flexible, Idealized Salt Marsh Vegetation. Coast. Eng. 2014, 83, 82–92. [Google Scholar] [CrossRef]
  5. Burcharth, H.F.; Lykke Andersen, T.; Lara, J.L. Upgrade of Coastal Defence Structures against Increased Loadings Caused by Climate Change: A First Methodological Approach. Coast. Eng. 2014, 87, 112–121. [Google Scholar] [CrossRef]
  6. Ahrens, J.P. Reef Type Breakwaters. In Proceedings of the 19th International Conference on Coastal Engineering, Houston, TX, USA, 3–7 September 1984; pp. 2648–2662. [Google Scholar] [CrossRef] [Green Version]
  7. Seabrook, S.R.; Hall, K.R. Wave Transmission at Submerged Rubblemound Breakwaters. In Proceedings of the 26th International Conference on Coastal Engineering, Copenhagen, Denmark, 22–26 June 1998; pp. 2000–2013. [Google Scholar] [CrossRef]
  8. EurOtop. Manual on Wave Overtopping of Sea Defences and Related Structures. An Overtopping Manual Largely Based on European Research, but for Worldwide Application, Second Edition. 2018. Available online: http://www.overtopping-manual.com/assets/downloads/EurOtop_II_2018_Final_version.pdf (accessed on 19 October 2020).
  9. CIRIA. The International Levee Handbook (C731); CIRIA: London, UK, 2013; ISBN 978-0-86017-734-0. [Google Scholar]
  10. German Institute for Standardization. Armourstone—Part 1: Specification; Beuth Verlag GmbH: Berlin, Germany, 2002. [Google Scholar]
  11. Losada, M.A.; Giménez-Curto, L.A. Flow Characteristics on Rough, Permeable Slopes under Wave Action. Coast. Eng. 1981, 4, 187–206. [Google Scholar] [CrossRef]
  12. Van der Meer, J.W. Wave Run-Up and Overtopping. In Dikes and Revetments: Design, Maintanance and Safety Assessment; Pilarczyk, K.W., Ed.; Rijkswaterstaat, DWW: Delft, The Netherlands, 1998; pp. 145–159. ISBN 9054104554. [Google Scholar]
  13. Alcerreca-Huerta, J.C. Process-Based Modelling of Waves Interacting with Porous Bonded Revetments and Their Sand Foundation. Ph.D. Thesis, Technische Universität Carolo-Wilhelmina, Braunschweig, Germany, 2014. [Google Scholar]
  14. Hammeken Arana, A. Wave Run-Up on Beaches and Coastal Structures. Ph.D. Thesis, University College London, London, UK, 2017. [Google Scholar]
  15. Elbisy, M.S. Estimation of Regular Wave Run-Up on Slopes of Perforated Coastal Structures Constructed on Sloping Beaches. Ocean Eng. 2015, 109, 60–71. [Google Scholar] [CrossRef]
  16. Passarella, M.; Goldstein, E.B.; de Muro, S.; Coco, G. The Use of Genetic Programming to Develop a Predictor of Swash Excursion on Sandy Beaches. Nat. Hazards Earth Syst. Sci. 2018, 18, 599–611. [Google Scholar] [CrossRef] [Green Version]
  17. Power, H.E.; Gharabaghi, B.; Bonakdari, H.; Robertson, B.; Atkinson, A.L.; Baldock, T.E. Prediction of Wave Runup on Beaches Using Gene-Expression Programming and Empirical Relationships. Coast. Eng. 2019, 144, 47–61. [Google Scholar] [CrossRef]
  18. Erdik, T.; Savci, M.E.; Şen, Z. Artificial Neural Networks for Predicting Maximum Wave Runup on Rubble Mound Structures. Expert Syst. Appl. 2009, 36, 6403–6408. [Google Scholar] [CrossRef]
  19. Bonakdar, L.; Etemad-Shahidi, A. Predicting Wave Run-Up on Rubble-Mound Structures Using M5 Model Tree. Ocean Eng. 2011, 38, 111–118. [Google Scholar] [CrossRef] [Green Version]
  20. Abolfathi, S.; Yeganeh-Bakhtiary, A.; Hamze-Ziabari, S.M.; Borzooei, S. Wave Runup Prediction Using M5′ Model Tree Algorithm. Ocean Eng. 2016, 112, 76–81. [Google Scholar] [CrossRef]
  21. Hunt, I.A. Design of Seawalls and Breakwaters. J. Waterw. Harb. Div. 1959, 85, 123–152. [Google Scholar]
  22. Oumeraci, H.; Staal, T.; Pförtner, S.; Ludwigs, G. Hydraulic Performance, Wave Loading and Response of PBA Revetments and Their Foundations. Eur. J. Environ. Civ. Eng. 2012, 16, 953–980. [Google Scholar] [CrossRef]
  23. Schimmels, S.; Vousdoukas, M.; Wziatek, D.; Becker, K.; Gier, F.; Oumeraci, H. Wave Run-Up Observations on Revetments with Different Porosities. In Proceedings of the 33rd Conference on Coastal Engineering, Santander, Spain, 1–6 July 2012. [Google Scholar] [CrossRef] [Green Version]
  24. Allsop, N.W.H.; Franco, R.; Hawkes, P.J. Wave Run-Up on Steep Slopes—A Literature Review; Report No SR 1; Hydraulics Research Wallingford: Wallingford, Oxfordshire, UK, 1985. [Google Scholar]
  25. Technical Advisory Committee on Flood Defences. Technical Report Wave Run-up and Wave Overtopping at Dikes; Rijkswaterstaat, DWW: Delft, The Netherlands, 2002. [Google Scholar]
  26. Kerpen, N. Wave-Induced Responses of Stepped Revetments. Ph.D. Thesis, Gottfried Wilhelm Leibniz Universität, Hannover, Germany, 2017. [Google Scholar]
  27. Hughes, S.A. Estimating Irregular Wave Runup on Rough, Impermeable Slopes; Coastal and Hydraulics Engineering Technical Note ERDC/CHL CHETN-III-70; U.S. Army Engineer Research and Development Center Environmental Laboratory: Vicksburg, MS, USA, 2005. [Google Scholar]
  28. Capel, A. Wave Run-Up and Overtopping Reduction by Block Revetments with Enhanced Roughness. Coast. Eng. 2015, 104, 76–92. [Google Scholar] [CrossRef]
  29. Schüttrumpf, H. Wellenüberlaufströmung Bei Seedeichen: Experimentelle und Theoretische Untersuchungen. Ph.D. Thesis, Universität Carolo-Wilhelmina, Braunschweig, Germany, 2001. [Google Scholar]
  30. Ahrens, J.P.; Heimbaugh, M.S. Approximate Upper Limit of Irregular Wave Runup on Riprap; Technical Report CERC-88-5; Coastal Engineering Research Center: Vicksburg, MS, USA, 1988. [Google Scholar]
  31. Hughes, S.A. Estimation of Wave Run-Up on Smooth, Impermeable Slopes Using the Wave Momentum Flux Parameter. Coast. Eng. 2004, 51, 1085–1104. [Google Scholar] [CrossRef]
  32. Muttray, M.O.; Oumeraci, H.; ten Oever, E. Wave Reflection and Wave Run-Up at Rubble Mound Breakwaters. In Proceedings of the 30th Conference on Coastal Engineering, San Diego, CA, USA, 3–8 September 2006; Smith, J.M., Ed.; World Scientific Publishing Co. Pte. Ltd.: Singapore, 2006; pp. 4313–4324. [Google Scholar]
  33. Van der Meer, J.W.; Stam, C.-J.M. Wave Runup on Smooth and Rock Slopes of Coastal Structures. J. Waterw. Port Coast. Ocean Eng. 1992, 118, 534–550. [Google Scholar] [CrossRef]
  34. Calabrese, M.; Buccino, M.; Ciardulli, F.; Di Pace, P.; Tomasicchio, R.; Vicinanza, D. Wave Run-Up and Reflection at Rubble Mound Breakwaters With Ecopode Armor Layer. Int. Conf. Coastal. Eng. 2011, 1. [Google Scholar] [CrossRef] [Green Version]
  35. Muttray, M.O. Wellenbewegung an und in einem geschütteten Wellenbrecher: Laborexperimente im Großmaßstab und theoretische Untersuchungen. Ph.D. Thesis, Technische Universität Carolo-Wilhelmina, Braunschweig, Germany, 2000. [Google Scholar]
  36. Oumeraci, H. More Than 20 Years of Experience Using the Large Wave Flume (GWK): Selected Research Projects. In Die Küste Heide; Holstein: Boyens, Germany, 2010; pp. 179–239. [Google Scholar]
  37. Gier, F.; Schüttrumpf, H.; Mönnich, J.; van der Meer, J.; Kudella, M.; Rubin, H. Stability of Interlocked Pattern Placed Block Revetments. In Proceedings of the Coastal Engineering Conference, Santander, Spain, 1–6 July 2012; Volume 1, p. 46. [Google Scholar] [CrossRef] [Green Version]
  38. Kreyenschulte, M. Wellen-Bauwerks-Interaktion Bei Mörtelvergossenen Schüttsteindeckwerken. Ph.D. Thesis, RWTH Aachen University, Aachen, Germany, 2020. [Google Scholar]
  39. Federal Waterways Engineering and Research Institute. Use of Cementitious and Bituminous Materials for Grouting Armourstone on Waterways (Anwendung von hydraulisch gebundenen Stoffen zum Verguss von Wasserbausteinen an Wasserstraßen, MAV); Federal Waterways Engineering and Research Institute: Karlsruhe, Germany, 2017. [Google Scholar]
  40. Monnet, W.; Dartsch, B.; Wehefritz, K. Colcrete-Beton im Wasserbau; Beton-Verlag: Düsseldorf, Germany, 1980; ISBN 3-7640-0134-8. [Google Scholar]
  41. Leichtweiß-Institut für Wasserbau. L~Davis: Manual for the Data Analysis and Visualization Software of the Leichtweiss Institute; Leichtweiß-Institut für Wasserbau: Braunschweig, Germany, 2007. [Google Scholar]
  42. Mansard, E.P.D.; Funke, E.R. The Measurement of Incident and Reflected Spectra Using a Least Square Method. In Proceedings of the 17th International Conference on Coastal Engineering (ICCE), Sydney, Australia, 23–28 March 1980; pp. 154–172. [Google Scholar]
  43. SICK. Laser Measurement Systems of the LMS5xx Product Family. 2020. Available online: www.sick.com (accessed on 19 October 2020).
  44. Howe, D. Bed Shear Stress under Wave Runup on Steep Slopes. Ph.D. Thesis, University of New South Wales, Sydney, Australia, 2016. [Google Scholar]
  45. Blenkinsopp, C.E.; Mole, M.A.; Turner, I.L.; Peirson, W.L. Measurements of the Time-Varying Free-Surface Profile across the Swash Zone Obtained Using an Industrial LIDAR. Coast. Eng. 2010, 57, 1059–1065. [Google Scholar] [CrossRef]
  46. Blenkinsopp, C.E.; Turner, I.L.; Allis, M.J.; Peirson, W.L.; Garden, L.E. Application of LiDAR Technology for Measurement of Time-Varying Free-Surface Profiles in a Laboratory Wave Flume. Coast. Eng. 2012, 68, 1–5. [Google Scholar] [CrossRef]
  47. Hofland, B.; Diamantidou, E.; van Steeg, P.; Meys, P. Wave Runup and Wave Overtopping Measurements Using a Laser Scanner. Coast. Eng. 2015, 106, 20–29. [Google Scholar] [CrossRef]
  48. Seelig, W.N.; Ahrens, J.P. Estimation of Wave Reflection and Energy Dissipation Coefficients for Beaches, Revetments, and Breakwaters; Report No. TP-81-1; US Army Corps of Engineers, Coastal Engineering Research Center: Fort Belvoir, VA, USA, 1981. [Google Scholar]
Figure 1. MGRRs made of LMB5/40, (a) partially grouted (top layer thickness t = 0.6 m, grouted with an amount of mortar of vg = 80 l/m2, Coastal Research Center’s Large Wave Flume (GWK) hydraulic model test configuration 1), (b) partially grouted in the upper part, fully grouted in the lower part of the top layer (t = 0.4 m, upper part vg ≈ 60 l/m2, revetment in the field), (c) fully grouted (t = 0.4 m, grouted with vg = 180 l/m2, GWK hydraulic model test configuration 4), and (d) fully grouted (t = 0.6 m, revetment in the field).
Water 12 03396 g001
Figure 2. MGRRs in the GWK: (a) view from the empty flume to the revetment with the toe structure in the lower part of the picture. (b) Wave run-up event on a fully grouted MGRR in the GWK with high aeration of the up-rushing wave after the wave plunged on the revetment; view is from the revetment to the flume.
Water 12 03396 g002
Figure 3. Cross-section of the MGRR on the north side of the flume (t = 0.6 m, after [38]).
Water 12 03396 g003
Figure 4. Longitudinal cross-section (a) and top view (b) of the GWK showing the wave paddle at the left, the instrumentation along the flume, and the revetment on the right, with the 2D-LIDAR above.
Water 12 03396 g004
Figure 5. Relative wave run-up height Ru2%/Hm0 as a function of the surf similarity parameter ξm−1,0 (a) for the partially grouted (▲) and re-grouted impermeable (■) MGRR with a thickness of t = 0.6 m, as well as the best fit EurOtop equation with γf = 0.72 and γf = 0.86, respectively. (b) Ru2%/Hm0 for the partially grouted (●) and fully grouted (▼) MGRR with a thickness of t = 0.4 m, as well as the best fit EurOtop equation with γf = 0.79 and γf = 0.88, respectively. For reference, Equation (2) for smooth impermeable revetments (γf = 1 [8]) and riprap revetments (two layers, γf = 0.55 [8]) is given.
Water 12 03396 g005
Figure 6. Relative wave run-up height Ru2%/h as a function of the dimensionless momentum flux parameter MF/(ρgh2) for (a) the partially grouted (▲) and re-grouted impermeable (■) MGRR with a thickness of t = 0.6 m, as well as the best fit Equation (10) with γf,M = 0.65 and γf,M = 0.76, respectively. (b) Ru2%/h for the partially grouted (●) and fully grouted (▼) MGRR with a thickness of t = 0.4 m, as well as the best fit Equation (10) with γf,M = 0.70 and γf,M = 0.77, respectively. For reference, Equation (10) for smooth impermeable revetments (γf,M = 1 [27]) and riprap revetments (two layers, γf,M = 0.51 [27]) is given.
Water 12 03396 g006
Figure 7. Relative wave run-up height Ru2%/Hm0 as a function of the modified surf similarity parameter ϕ for (a) the partially grouted (▲) and re-grouted impermeable (■) MGRR with a thickness of t = 0.6 m, as well as the best fit Equation (11) with a = 1.87, b = −0.18 and a = 2.07, b = −0.18, respectively. (b) Ru2%/Hm0 for the partially grouted (●) and fully grouted (▼) MGRR with a thickness of t = 0.4 m, as well as the best fit Equation (11) with a = 1.90, b = −0.22 and a = 2.13, b = −0.18, respectively. For reference, Equation (11) for smooth impermeable revetments (a = 2.11; b = −0.17 [14]) is given.
Water 12 03396 g007
Figure 8. Relative wave run-up height Ru2%/Hm0 as a function of the reflection coefficient Cr for (a) the partially grouted (▲) and re-grouted impermeable (■) MGRR with a thickness of t = 0.6 m, as well as the best fit Equation (12) with a = 1.63 and a = 1.77, respectively. (b) Ru2%/Hm0 for the partially grouted (●) and fully grouted (▼) MGRR with a thickness of t = 0.4 m, as well as the best fit Equation (12) with a = 1.73 and a = 1.81, respectively. For reference, Equation (12) for a rubble mound breakwater (a = 1.65 [32]) is given.
Water 12 03396 g008
Figure 9. Reflection coefficient Cr as a function of the surf similarity parameter ξm−1,0 for the partially grouted (▲,●; SI = 6.88%) as well as fully grouted and re-grouted impermeable MGRR (■,▼; SI = 3.97%).
Water 12 03396 g009
Table 1. Overview of some influence factors γf as well as characteristics of the revetment type for which they are valid and the equation in this work for which the influence factor was determined.
Type of RevetmentInfluence Factor γfEquation Nr. in This WorkRevetment CharacteristicsReference
RoughPorousPermeable
Grass0.9–1.0(2)(x) [8]
Polyurethane bonded gravel≈0.75mod. (2)(x)xx[22,23]
Basalt0.9(2)(x)(x)(x)[8]
Stepped revetments0.4–0.9(4)x [26]
Two layers of rock0.55(2)xxx[8]
Two layers of rock0.51(10)xxx[27]
Pattern placed revetments with enhanced roughness0.65–0.85(4)x(x)(x)[28]
Table 2. Characteristics of the MGRRs in the GWK (Data from [38]).
Partially GroutedFully Grouted
SectionNorthSouthNorthSouth
Configuration Nr.1234
Top layer thickness t [m]0.60.40.60.4
Amount of mortar vg [l/m2]808080+100180
Estimated porosity n before grouting [-]0.450.450.450.45
Porosity n after grouting [-]0.320.250.160
Pore volume Vp after grouting [l/m2]190100900
Table 3. Influence factors and empirical parameters for the MGRRs in the GWK, as well as corresponding statistical parameters.
Partially GroutedFully Grouted
SectionNorthSouthNorthSouth
Equation Nr.1 (▲)2 (●)3 (■)4 (▼)
(2) R u 2 % H m 0 = m i n 1.65 × γ f × ξ m 1 , 0 1.00 × γ f , s u r g i n g × 4 1.5 ξ m 1 , 0 γf0.720.790.860.88
bias−0.02000
RMSE0.090.080.110.10
SI6.275.516.005.56
(10) R u 2 % h = 4.4 tan α 0.7 M F ρ g h 0.5 × γ f , M γf,M0.650.700.760.77
bias0.010.020.010
RMSE0.110.110.130.12
SI7.867.387.226.68
(11) R u 2 % H s = a ϕ b = a ξ m 1 , 0 × h L m 1 , 0 b a1.871.902.072.13
b−0.18−0.22−0.18−0.18
bias0.010.020.030.05
RMSE0.120.100.160.19
SI8.176.849.2610.29
(12) R u 2 % H m 0 = a 1 + C r a [-]1.631.731.771.81
bias0−0.01−0.010
RMSE0.090.070.110.10
SI6.114.726.375.68
Note that bias [m], RMSE [m], and SI [%] are calculated using Ru2% [m] (see Section 2.5).
Publisher’s Note: MDPI stays neutral with regard to jurisdictional claims in published maps and institutional affiliations.

