Article

Changes in Runoff and Sediment Load and Potential Causes in the Malian River Basin on the Loess Plateau

1
State Key Laboratory of Soil Erosion and Dryland Farming on the Loess Plateau, Institute of Soil and Water Conservation, Chinese Academy of Sciences & Ministry of Water Resources, Yangling 712100, China
2
University of Chinese Academy of Sciences, Beijing 100049, China
3
Laboratory of Soil Erosion and Dryland Farming on the Loess Plateau, Institute of Soil and Water Conservation, Northwest A&F University, Yangling 712100, China
*
Author to whom correspondence should be addressed.
Sustainability 2021, 13(2), 443; https://doi.org/10.3390/su13020443
Submission received: 17 December 2020 / Revised: 23 December 2020 / Accepted: 31 December 2020 / Published: 6 January 2021

Abstract

:
The loessial tableland is a unique landform type on the Loess Plateau in China. Long-term soil erosion has led to the retreat of gullies and the rapid reduction of fertile arable land, which has further decreased agricultural production. In this study, we chose the Malian River basin to analyze the temporal and spatial variation of its runoff and sediment load, as well as the potential causes. The annual runoff and sediment load at six hydrological stations in the study area were collected for the period between 1960 and 2016. The Mann−Kendall and Pettitt tests were respectively applied to detect temporal variations and abrupt changes in the runoff and sediment loads. The results showed that an abrupt change in the runoff and sediment loads occurred in 2003. The average annual runoff in the Malian River was 4.42 × 10⁸ m3 yr−1 from 1960 to 2002, and decreased to 3.32 × 10⁸ m3 yr−1 in 2003–2016. The average annual sediment load was 1.27 × 10⁸ t yr−1 in 1960–2002, and decreased to 0.65 × 10⁸ t yr−1 in 2003–2016. The spatial patterns in the sediment load suggested that the Hongde sub-basin contributed a higher sediment count to the Malian River, which may require additional attention for soil and water conservation in the future. Anthropogenic activities significantly affected runoff and sediment load reduction according to the double-mass curve method, accounting for 90.7% and 78.7%, respectively, whereas rainfall changes were 9.3% and 21.3%, respectively. As such, the present study analyzed the loessial tableland runoff and sediment load characteristics of the Malian River basin for soil and water erosion management.

1. Introduction

The loessial tableland is an important agricultural production region on the Loess Plateau in China. It has a flat terrain and is surrounded by valleys due to a high deposition of loess soil [1,2,3]. Thousands of years of human habitation and agricultural activities have increased soil erosion in the tableland, which not only affects the management and development of the Yellow River, but also fragments the Loess Plateau [4,5,6]. Significant sediment discharge into the Yellow River has been observed due to extreme soil erosion, resulting in high-risk sedimentation and flooding in the lower reaches of the Yellow River [7,8]. As a result, many studies have investigated the loessial tableland runoff and sediment load as a means to further understand soil erosion changes across the Loess Plateau [9].
River runoff and sediment load connect marine and terrestrial ecosystems, and have important effects on surface material transport, geomorphology, and ocean circulation [10,11,12]. In recent decades, numerous large rivers have exhibited runoff and sediment loads, including the Ebor River, Mississippi River, Colorado River, and Columbia River [13,14,15,16]. Therefore, river protection and the promotion of sustainable basin development has been of great significance in understanding the variation of sediment load and runoff, as well as their probable sources. Lowered runoff and sediment load have been significantly affected by climate change and human activities such as the implementation of reservoirs, check dams, soil and water conservation, and afforestation. Climate change stimulates the water cycle and changes the distribution and quantity of runoff, especially rainfall. Labat et al. reported increasing runoff in 221 rivers across the world following an increase in rainfall [17]. However, other research suggests that anthropogenic activities predominantly affected runoff and sediment loads. Walling observed significant decreased annual runoff and sediment loads in 145 international rivers due to severe anthropogenic activities [18]. Wang et al. indicated that sediment load decreased with an increasing percentage of vegetation cover in the Yellow River [19]. In addition, the construction of terraces and check dams also led to runoff and sediment load reduction in related areas [20,21,22].
The Yellow River, the second-largest river in China, is among the highest sediment-laden rivers [23]. Driven by a series of soil and water conservation measures, the sharp decrease in runoff and sediment load in the Yellow River and its tributaries has attracted wide attention. Wei et al. investigated the runoff changes of eight hydrological stations across the Yellow River mainstream, to which the annual average streamflow exhibited an M-type spatial pattern and a parabolic annual average suspended sediment discharge curve. A distinct decreasing streamflow and suspended sediment discharge was observed between 1950 and 2013 [24]. Mu et al. conducted a systematic sediment change analysis of the Yellow River from 1919 to 2008 by using the anomaly accumulation method and double-mass curve, and anthropogenic activities were deemed the primary cause of the significant sediment decrease in the Yellow River [25]. Yao et al. observed a decreasing annual average runoff and sediment load trend in the Yellow River across 50 years of recent data, primarily due to anthropogenic activities [26]. Similarly, Gao et al. analyzed the linkage between runoff and sediment load in 14 Loess Plateau sub-basins; the results indicated that check dams and reservoirs significantly affected sediment load reduction, while vegetation restoration was the main factor after 2000 [27].
The Malian River, a third Yellow River tributary, is located on the loessial tableland. It contributed an annual average of 1.34 × 10⁸ t sediment to the Yellow River, accounting for 8% of the annual total in the whole basin [28,29]. Existing literature has reported significant reductions in runoff and sediment load in a majority of rivers except those on the loessial tableland. A number of studies have investigated the temporal and spatial variations in runoff and sediment loads on the entire Loess Plateau; however, these studies did not deeply investigate the entirety of the loessial tableland, such as the Malian River. Most of the existing research has focused on the erosion model simulations and isotope labeling from soil erosion studies, but no analysis of the long-term series data has been conducted using the runoff and sediment loads. Furthermore, few studies have analyzed the potential sources of these regional runoff and sediment load changes. Therefore, our study sought to investigate the spatial-temporal variations in annual runoff and sediment load in the Malian River basin and characterize the underling factors that affect these runoff and sediment load variations. We checked and revised the data homogenization process and described the characteristics of runoff and sediment loads in the Malian River basin in detail. This provides a theoretical basis for soil and water conservation in the gully region of the Loess Plateau.

2. Material and Methods

2.1. Study Area

The Malian River is situated in the central reaches of the Yellow River (between 35°14′–37°23′ N and 106°40′–108°35′ E). The total length of the main stream is 374.8 km, with a basin area of 19,086 km2. The basin has a temperate continental climate that is hot and rainy in the summer and cold and dry in the winter. The average annual rainfall is 531.12 mm, and the average annual air temperature is 9.14 °C. The northern part of the basin is mainly low mountains, and the middle and downstream of the basin are flat loessial tableland. This basin has the typical characteristics of the Loess Plateau, with basic geomorphic units such as loessial tableland, loessial ridge, and loessial hillock, which is representative of the gully region on the Loess Plateau [30]. The average specific sediment yield of the basin is 5862.94 t km−2 yr−1.

2.2. Data Sources

The annual runoff and sediment load from 1960 to 2016 were collected from six hydrologic stations: the Hongde, Qingyang, and Yuluoping stations on the main stream, and the Yuele, Banqiao, and Jiaqiao stations on the tributaries of the river (Table 1 and Figure 1). The Yuluoping hydrologic station is at the outlet of the basin, which has a drainage area of 19,019 km2. The presented hydrological data were provided by the Yellow River Water Conservancy Commission (YRCC) of the Ministry of Water Resources, China. The continuous annual rainfall and air temperatures were collected from eight meteorological stations between 1960 and 2016 (Chinese Climate Center; http://data.cma.cn/site/index.html). Most importantly, the consistency, homogeneity, and quality of the data were checked prior to their release.

2.3. Methodologies

A simple linear regression test and a Mann–Kendall test were applied to characterize any variations in the annual runoff and sediment load trends at the different stations. The abrupt changes of runoff and sediment load were detected using the Pettitt test method [31,32,33]. Additionally, a double-mass curve and a sediment identity factor method were implemented to evaluate the potential runoff and the effects of the sediment load changes.

2.3.1. Mann–Kendall Trend Test

The Mann–Kendall non-parametric statistical test (M–K test) can effectively detect variations in hydrological data over time, and has been widely employed in the fields of hydrology and climate [34,35,36]. The method assumes a stable time series, and a random independence of the time series is required. This method reflects a changing trend by constructing statistics. A positive standardized statistic value indicates an increasing sequence trend; otherwise, a decreasing statistical trend is observed. At a significance level of 0.05, the critical value of the statistical parameters was ±1.96. At a significance level of 0.01, the critical value of the statistical parameters was ±2.58.

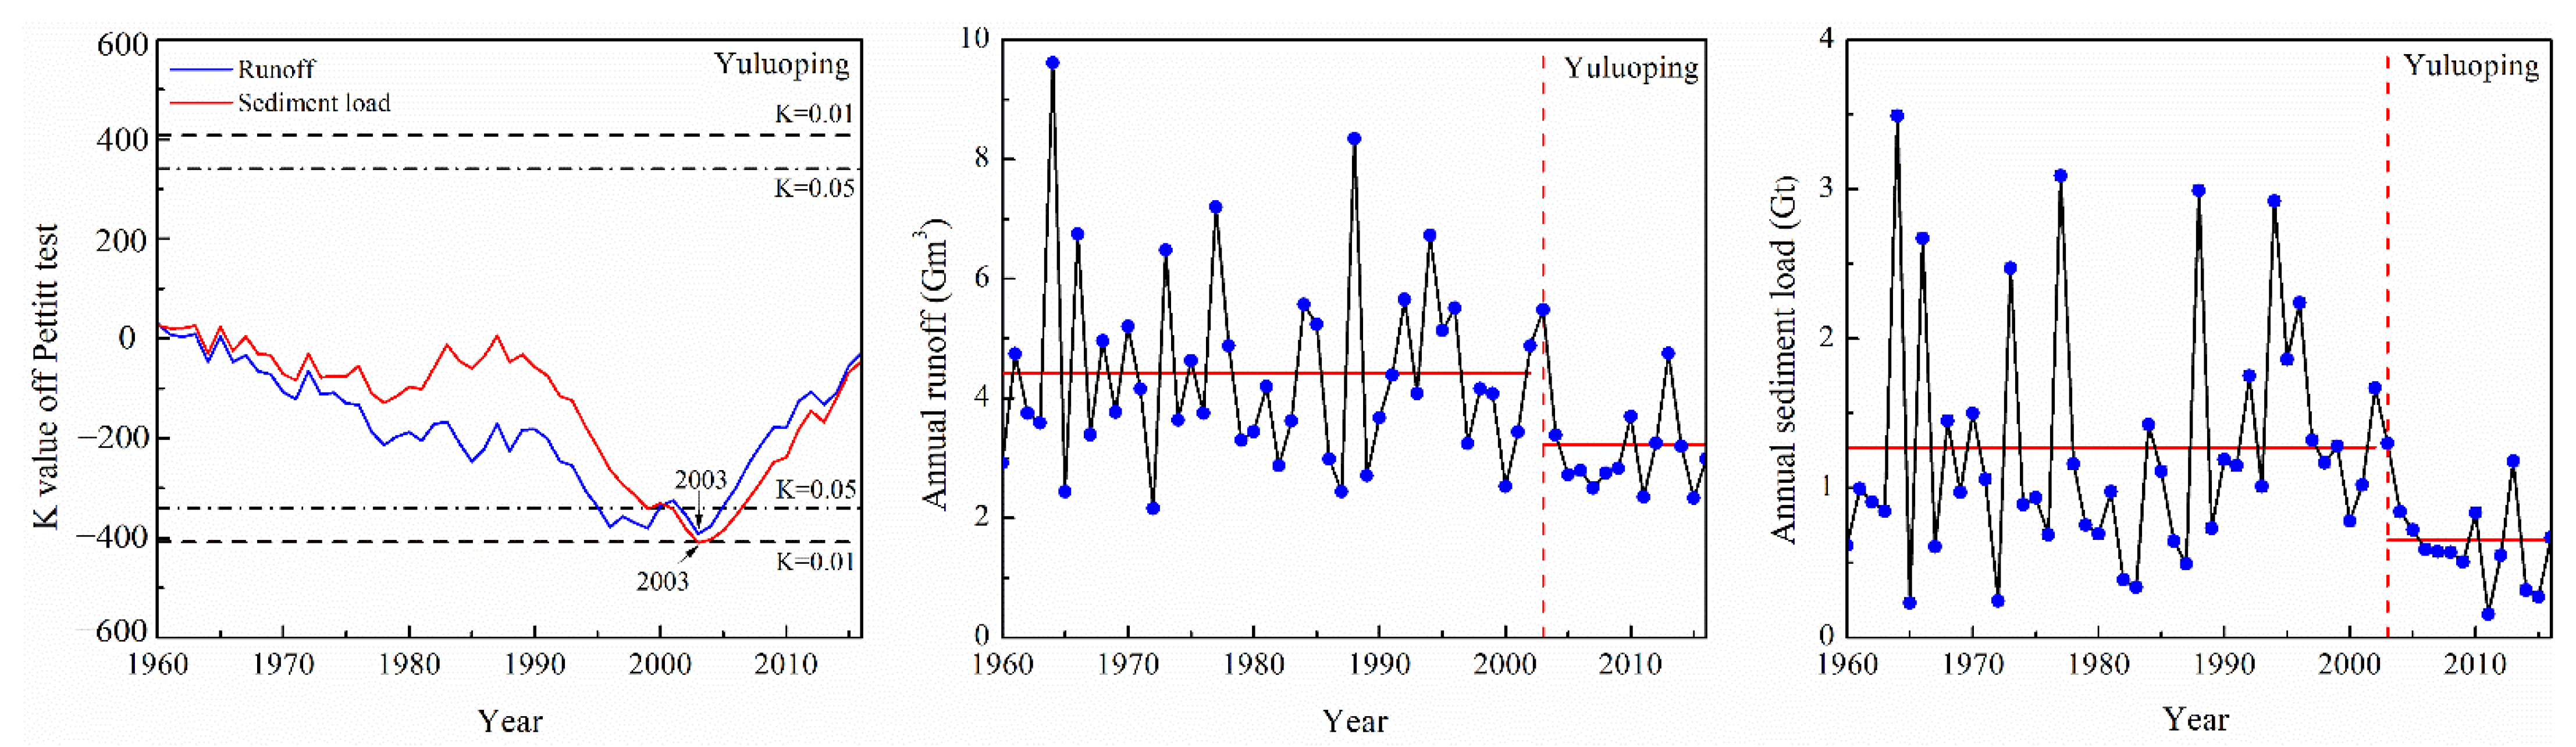
2.3.2. Change Point Analysis

The Pettitt test determines the mutation point of a sequence based on the change of trend of a long time series [37]. For a time series X with a length of T, the change point is t. Then, the hypothesis sequence is divided into two segments. The two samples are ( x 1 , x 2 , , x t ) and ( x t + 1 , x t + 2 , , x T ) . The formula for | U t | is written as follows:
U t = i = 1 t j = t + 1 T sgn ( x i x j )
where sgn() is determined as follows:
i f ( x i - x j ) > 0 r i = 1 i f ( x i - x j ) = 0 r i = 0 i f ( x i - x j ) < 0 r i = - 1
The possible abrupt change points of a time series are determined by the maximum value of | U t | .

2.3.3. Runoff Depth and Specific Sediment Yield

The runoff and sediment load spatial patterns in the Malian River basin were characterized based on the runoff depth and specific sediment yield. The runoff depth (R) was calculated as:
R = V A
The area between two hydrologic stations was calculated as follows:
R = V l o w e r - V u p p e r A
where V represents the annual runoff (m3) and A represents the control area between the two hydrological stations (km2). The specific sediment yield (t km−2 yr−1) exhibited similarities to the runoff depth, and was thus calculated based on the observed sediment load-to-control area ratio.

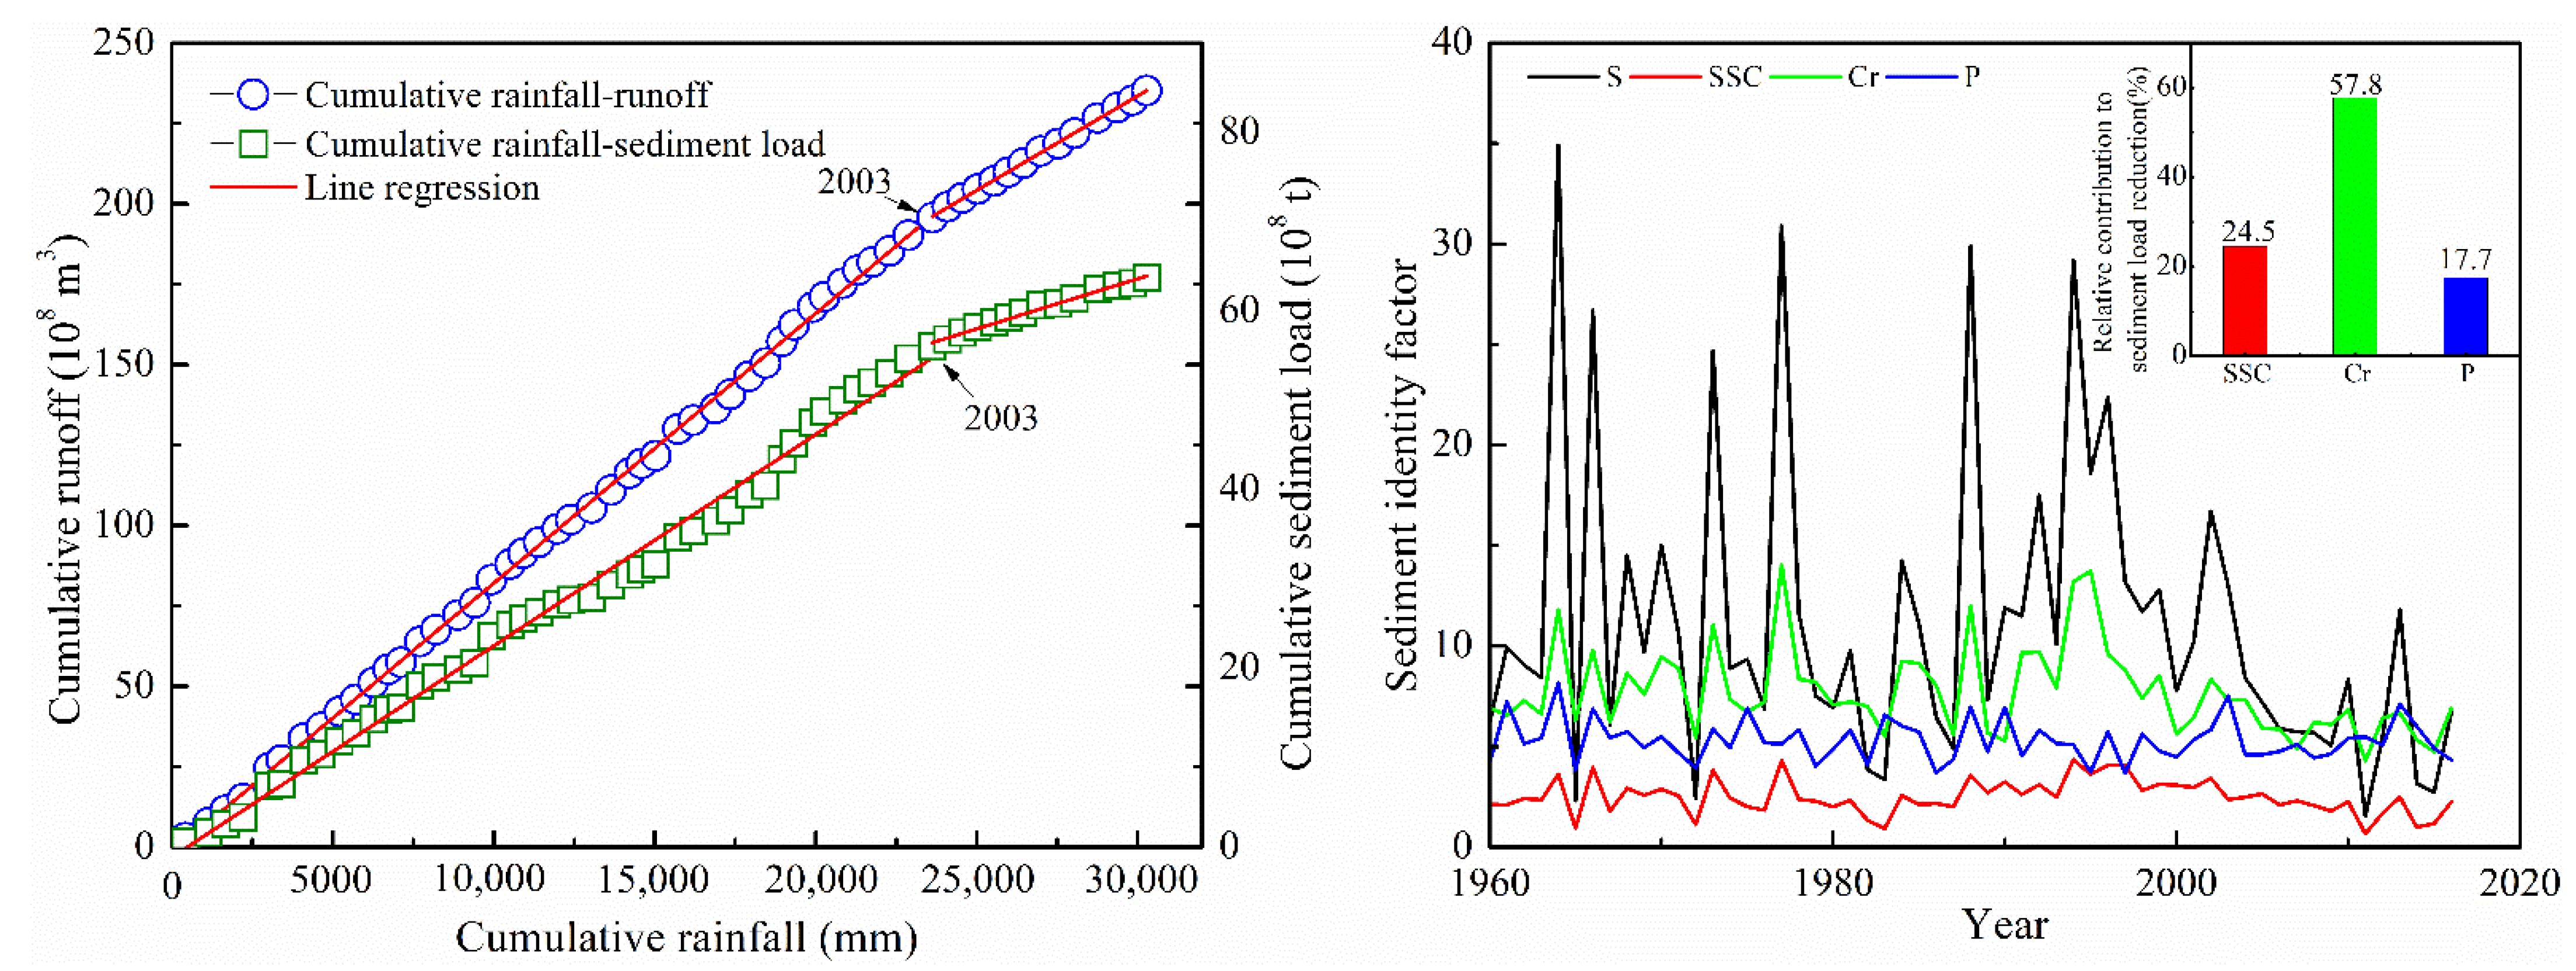
2.3.4. Double-Mass Curve Method

In general, the double-mass curve method is applied to investigate consistencies and/or variations in two parameters [25,38]. A relationship line is drawn in a rectangular coordinate system between the individual continuous cumulative values of two separate variables over the same period. The slope is generally analyzed after a double-mass curve of runoff and sediment load and rainfall is drawn. If the slope of the straight line does not deviate significantly, it means that human activities have no significant effect on runoff and sediment load; otherwise, the results indicate the significance of anthropogenic activities [39].

2.3.5. Sediment Identity Factor Analysis

The sediment identity factor method was first applied in economics. Wang et al. applied this method to characterize various conditions and their potential contributions in reducing the sediment load in the Yellow River basin [40]. According to their results, the basin sediment load variations were significantly dependent upon the rainfall, runoff coefficient, and sediment concentration. As such, the river sediment load was defined as:
S = P ( R P ) ( S R ) = P C r S S C
where S is the annual sediment load of the basin, R is the annual runoff, P is the annual rainfall, Cr is the ratio of annual runoff to rainfall (runoff coefficient), and SSC is the suspended sediment concentration.
When defining a function as r ( X ) = X 1 d X / d t with time, the counterpart for sediment load decrease rate was:
S - 1 d S d t = P - 1 d P d t + C r - 1 d C r d t + S S C - 1 d S S C d t
r ( S ) = r ( P ) + r ( C r ) + r ( S S C )
Therefore, the variation of sediment load in the basin was regarded as the attribution from rainfall, the runoff coefficient, and the sediment concentration. The reduction rate of the sediment load was calculated as the sum of the reduction rates of these three factors, and then their relative contributions to reducing sediment in the basin were estimated [41].

3. Results

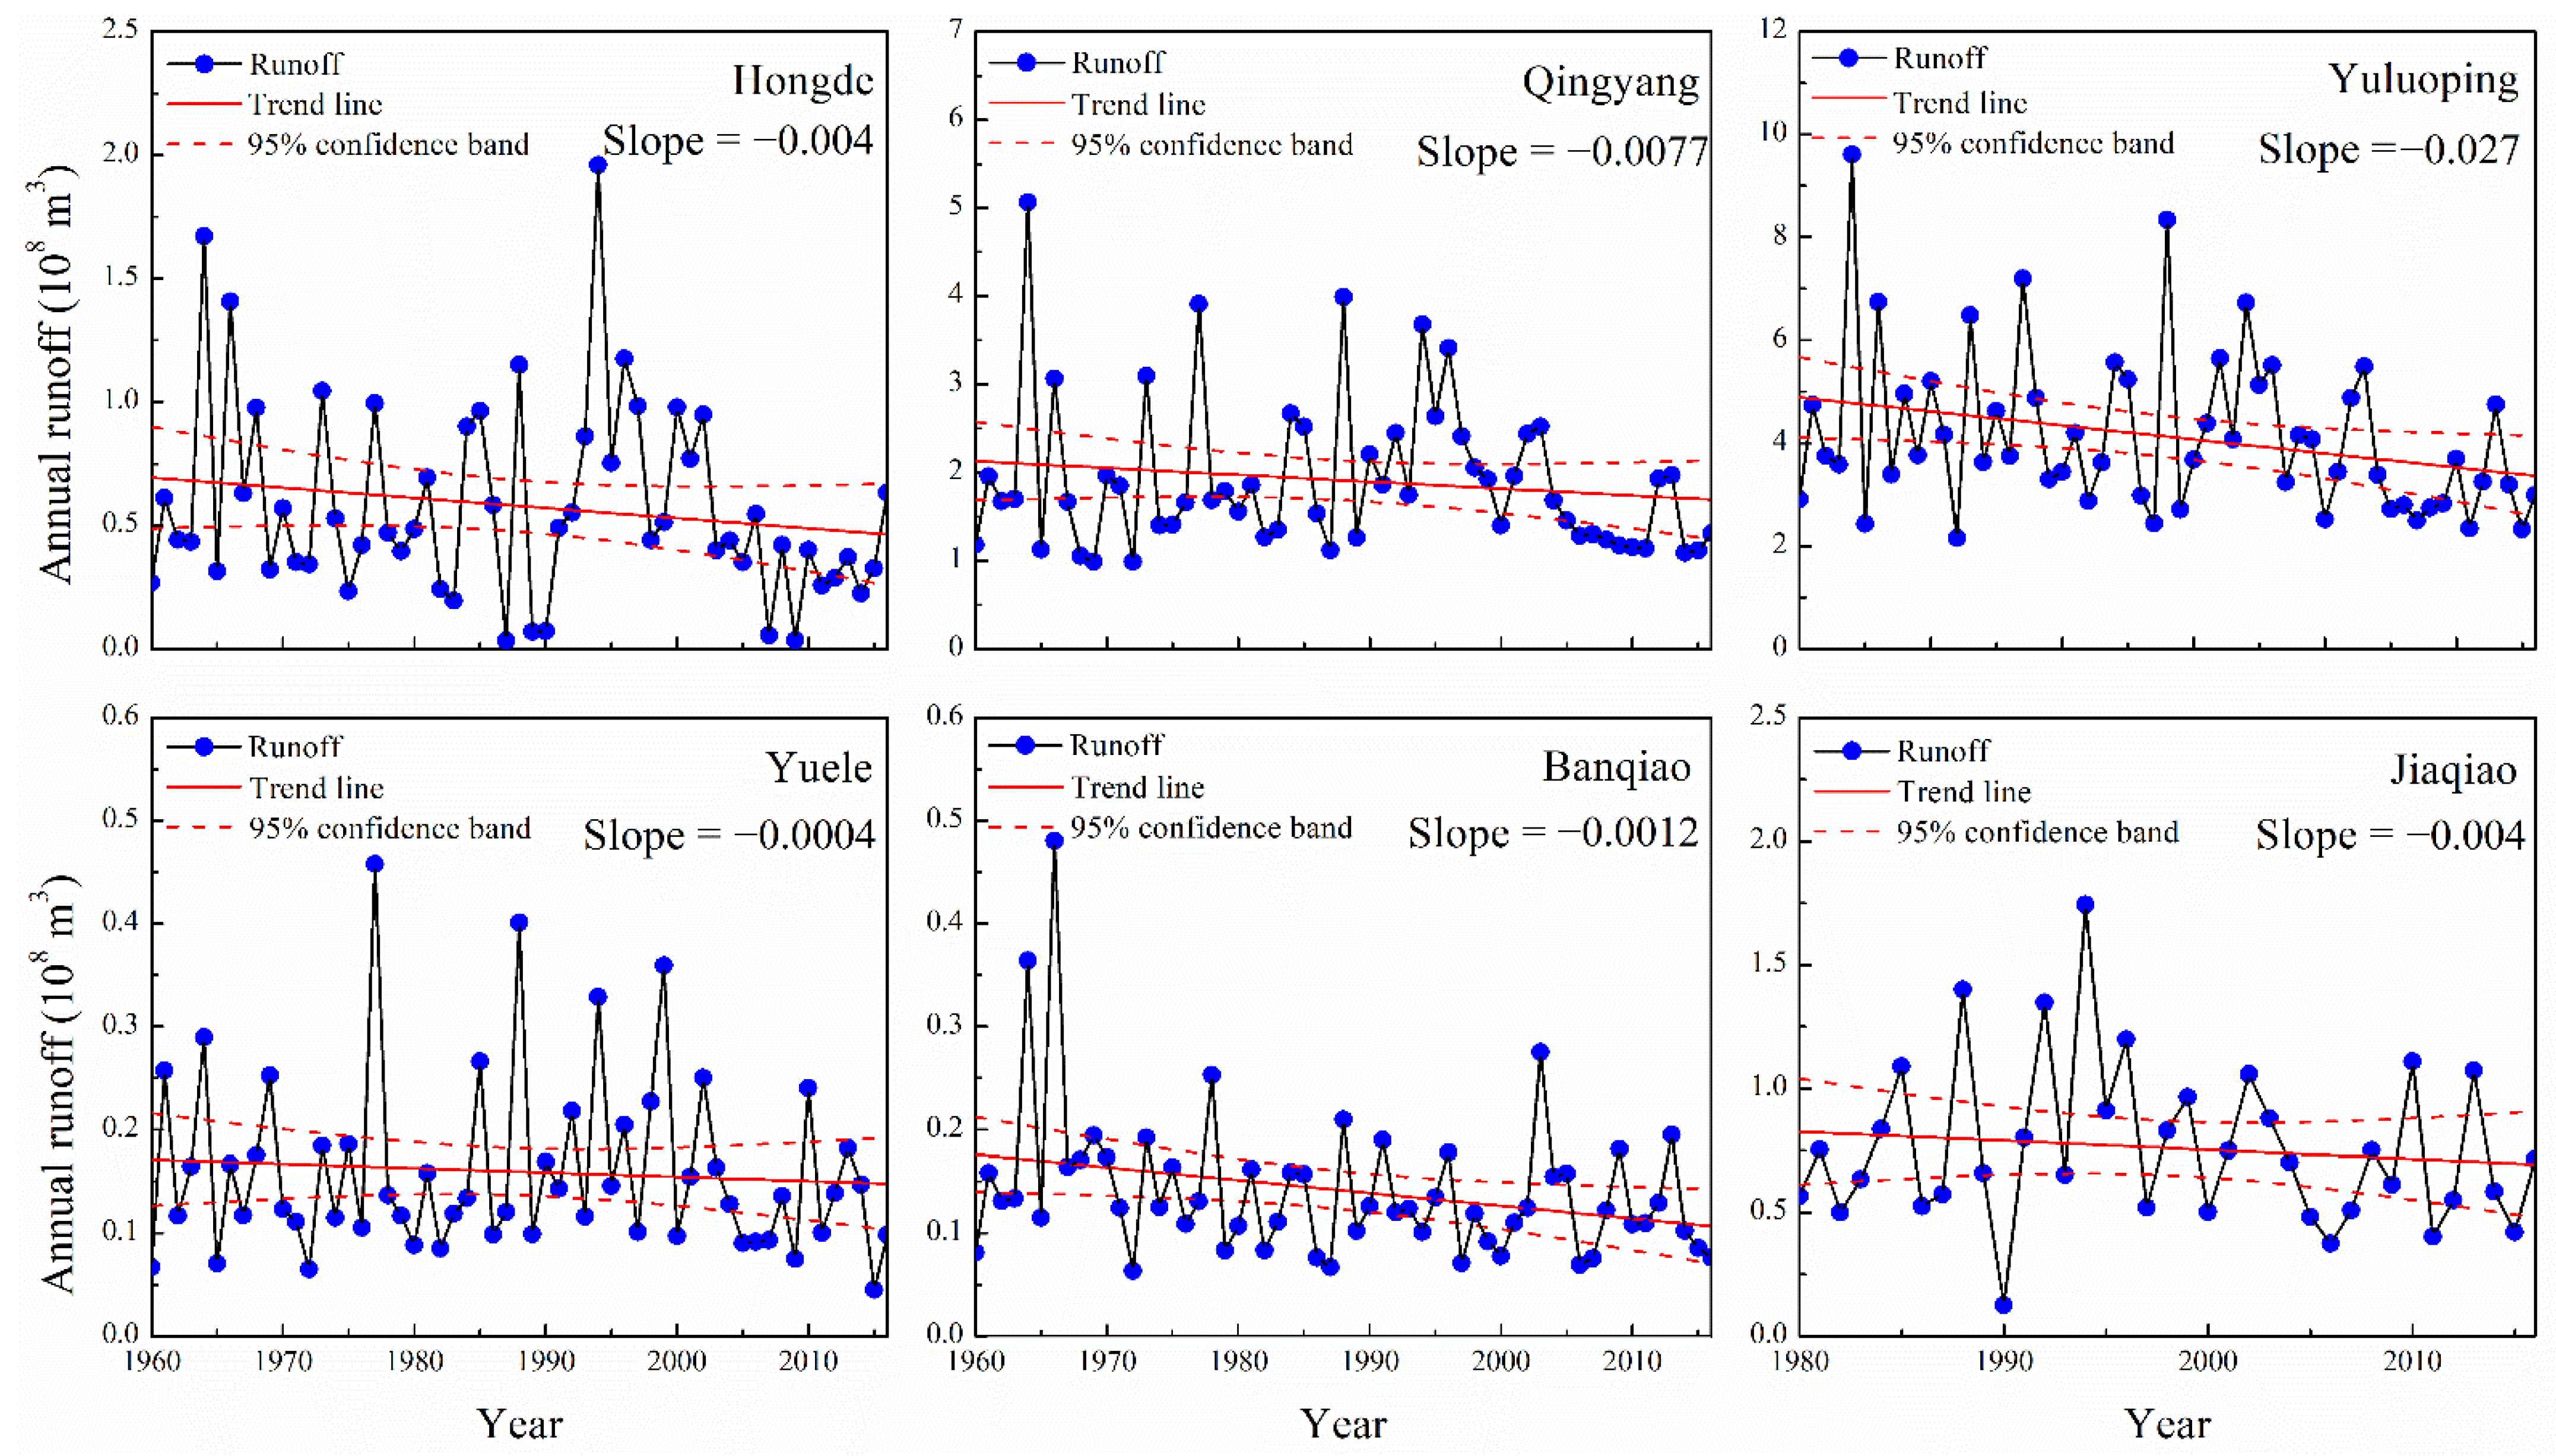
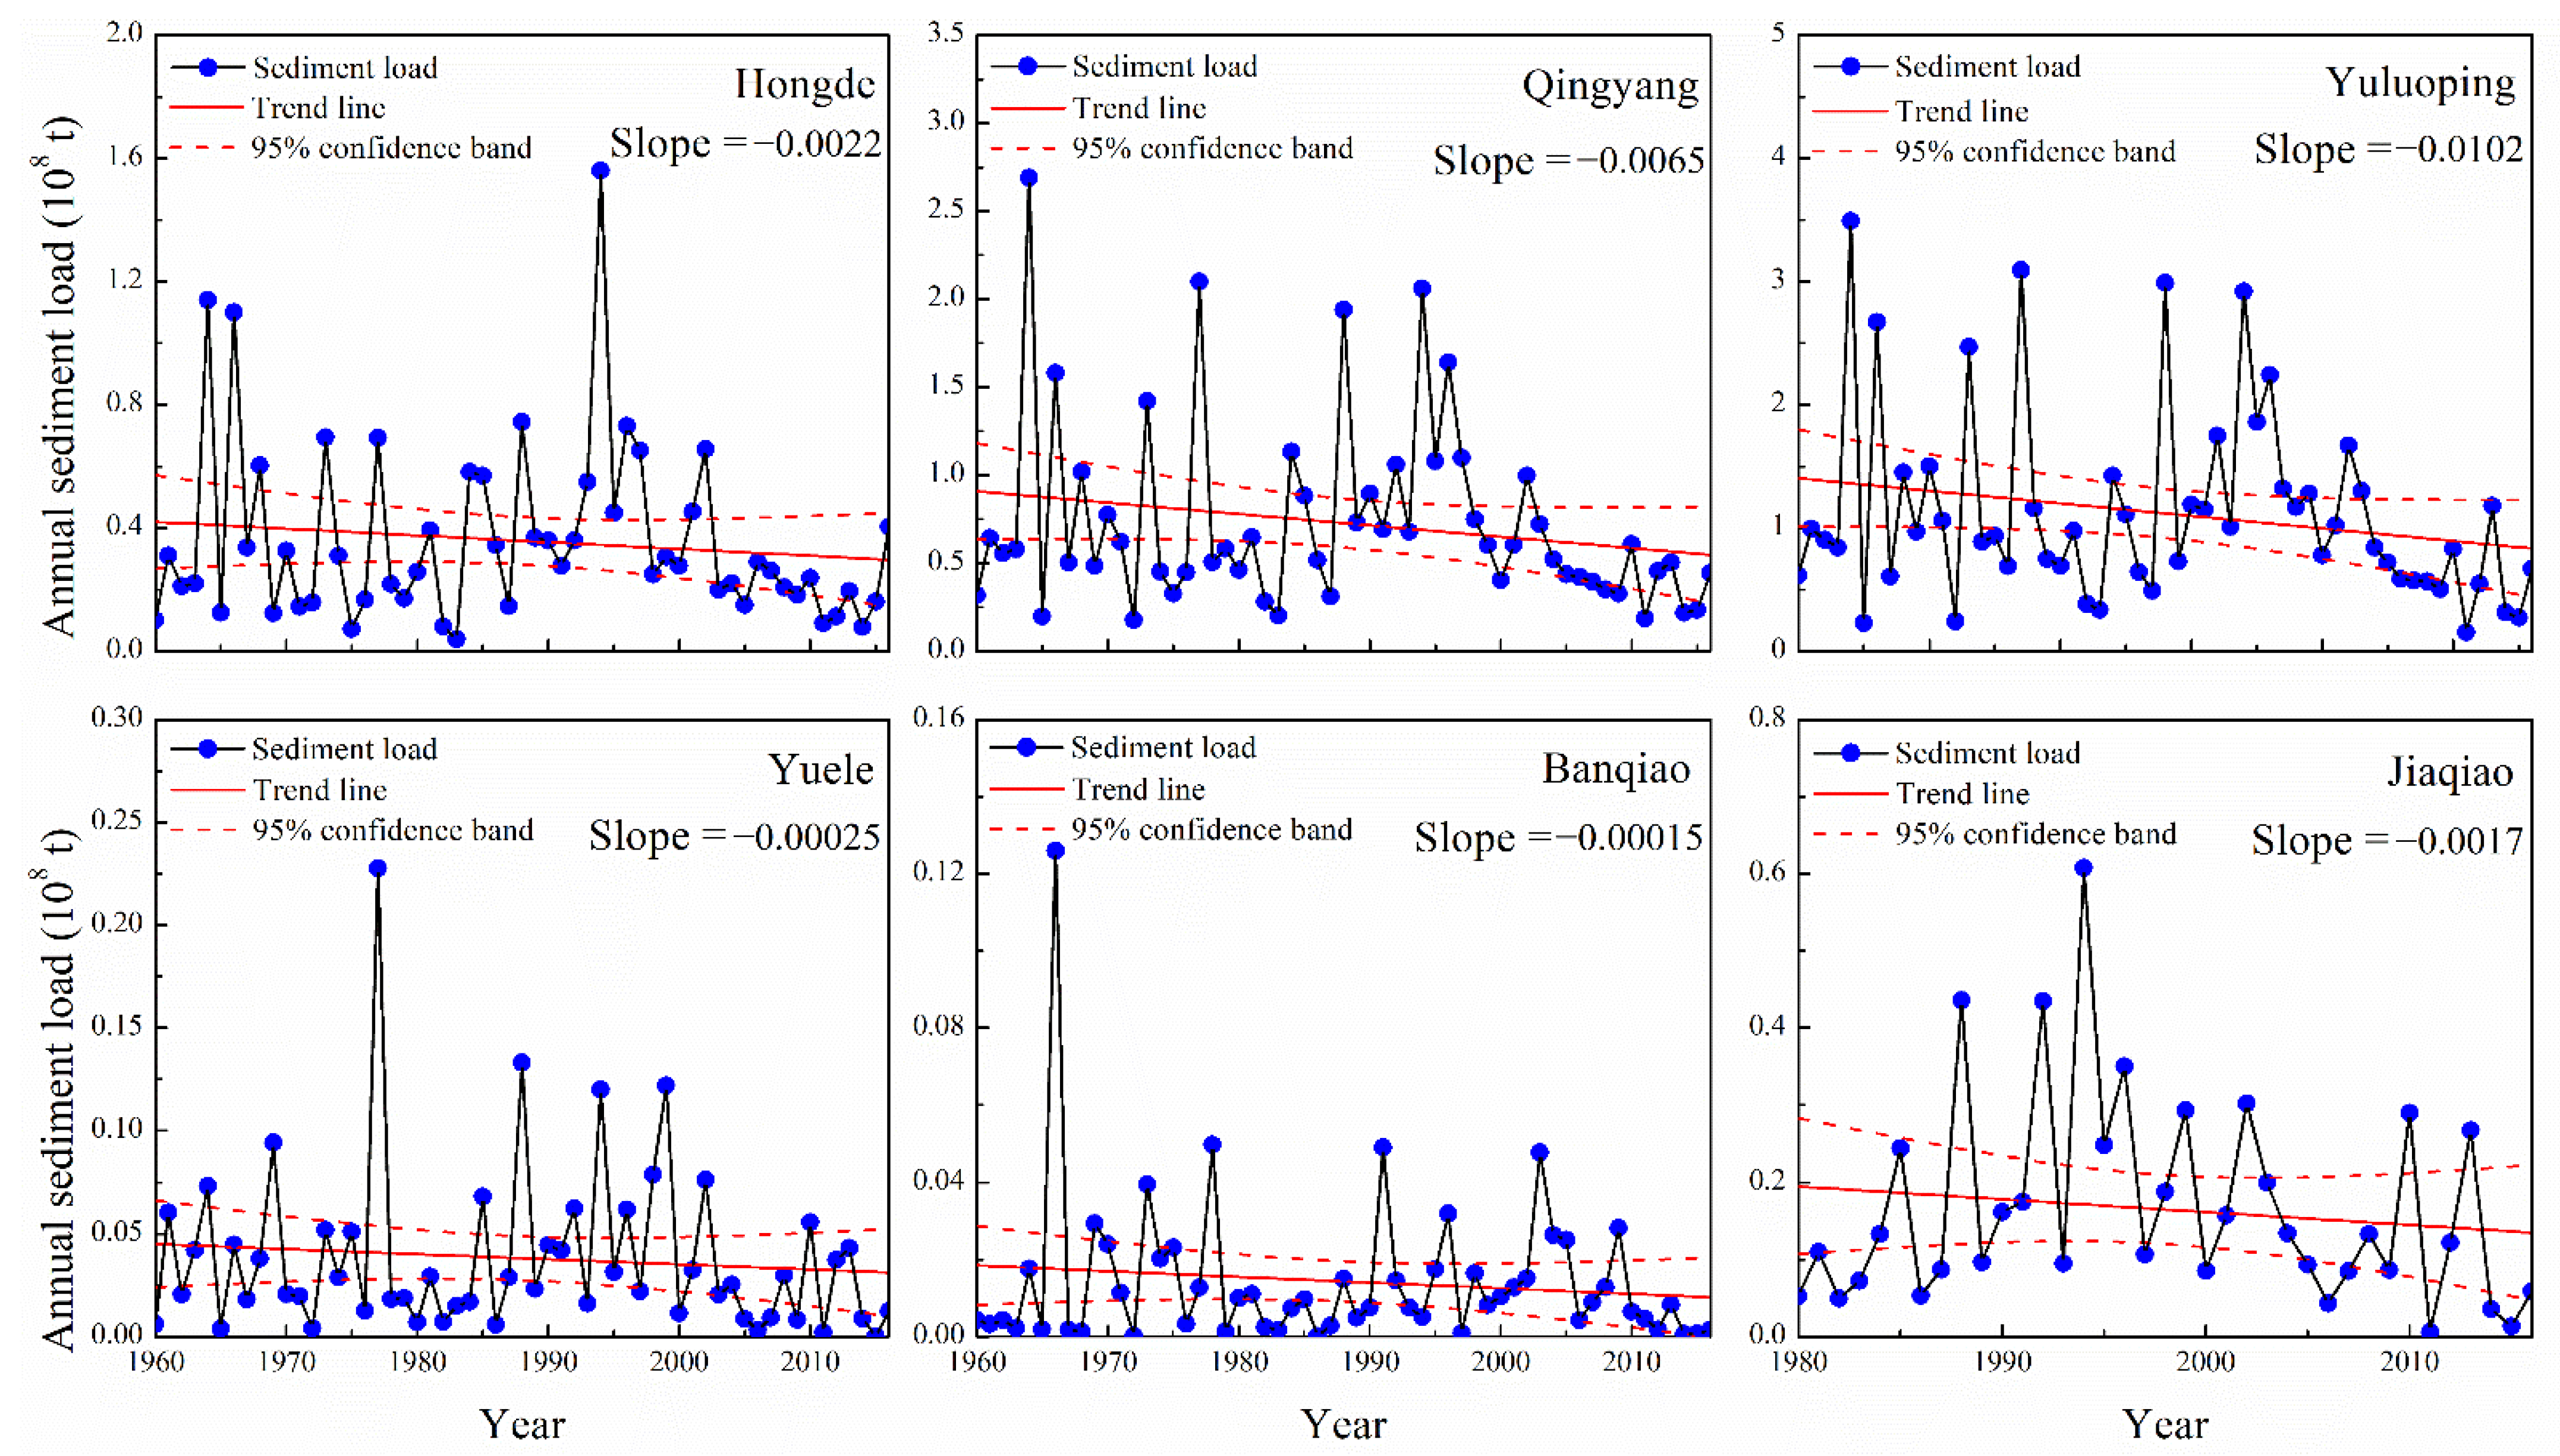
3.1. Temporal Variation of Runoff And Sediment Load

The annual runoff and sediment load varied distinctly within different decades in the Malian River basin. The average annual runoff in the Malian River basin was 4.13 × 10⁸ yr−1, ranging from 2.15 × 10⁸ m3 (1972) to 9.62 × 10⁸ m3 (1964). The average annual sediment load was 1.12 × 10⁸ t yr−1, ranging from 0.16 × 10⁸ t (2011) to 3.49 × 10⁸ t (1964). Accordingly, we found that average annual runoff at all the stations showed the lowest values during the period of 2010–2016.
Figure 2 and Figure 3 show the linear regression in the annual runoff and sediment loads at six hydrological stations in the Malian River basin. Both the annual runoff and annual sediment loads across all observed stations presented a decreasing trend between 1960 and 2016. Among these stations, the annual runoff at the Yuluoping Station decreased significantly (0.027 × 10⁸ m3 yr−1), while the annual sediment load had decreasing trends at all stations, but were insignificant from 1960 to 2016.
The M–K test trend analysis was applied to investigate the runoff and sediment loads at six Malian River basin hydrological stations from 1960 to 2016 (Table 2). The annual runoff at the Yuluoping and Banqiao Stations showed significant decreasing trends (p < 0.05).
Any disruptions in runoff and sediment loads across the six Malian River basin hydrological stations were investigated using the Pettitt test (Figure 4). Both the annual runoff and sediment loads of the Yuluoping station exhibited an abrupt change in 2003. The average annual runoff was 4.42 × 10⁸ m3 yr−1 in the period of 1960–2002; it decreased to 3.22 × 10⁸ m3 yr−1 in 2003–2016. The annual sediment load was 1.27 × 10⁸ t yr−1 in the baseline period; it decreased to 0.65 × 10⁸ t yr−1 in 2003–2016.

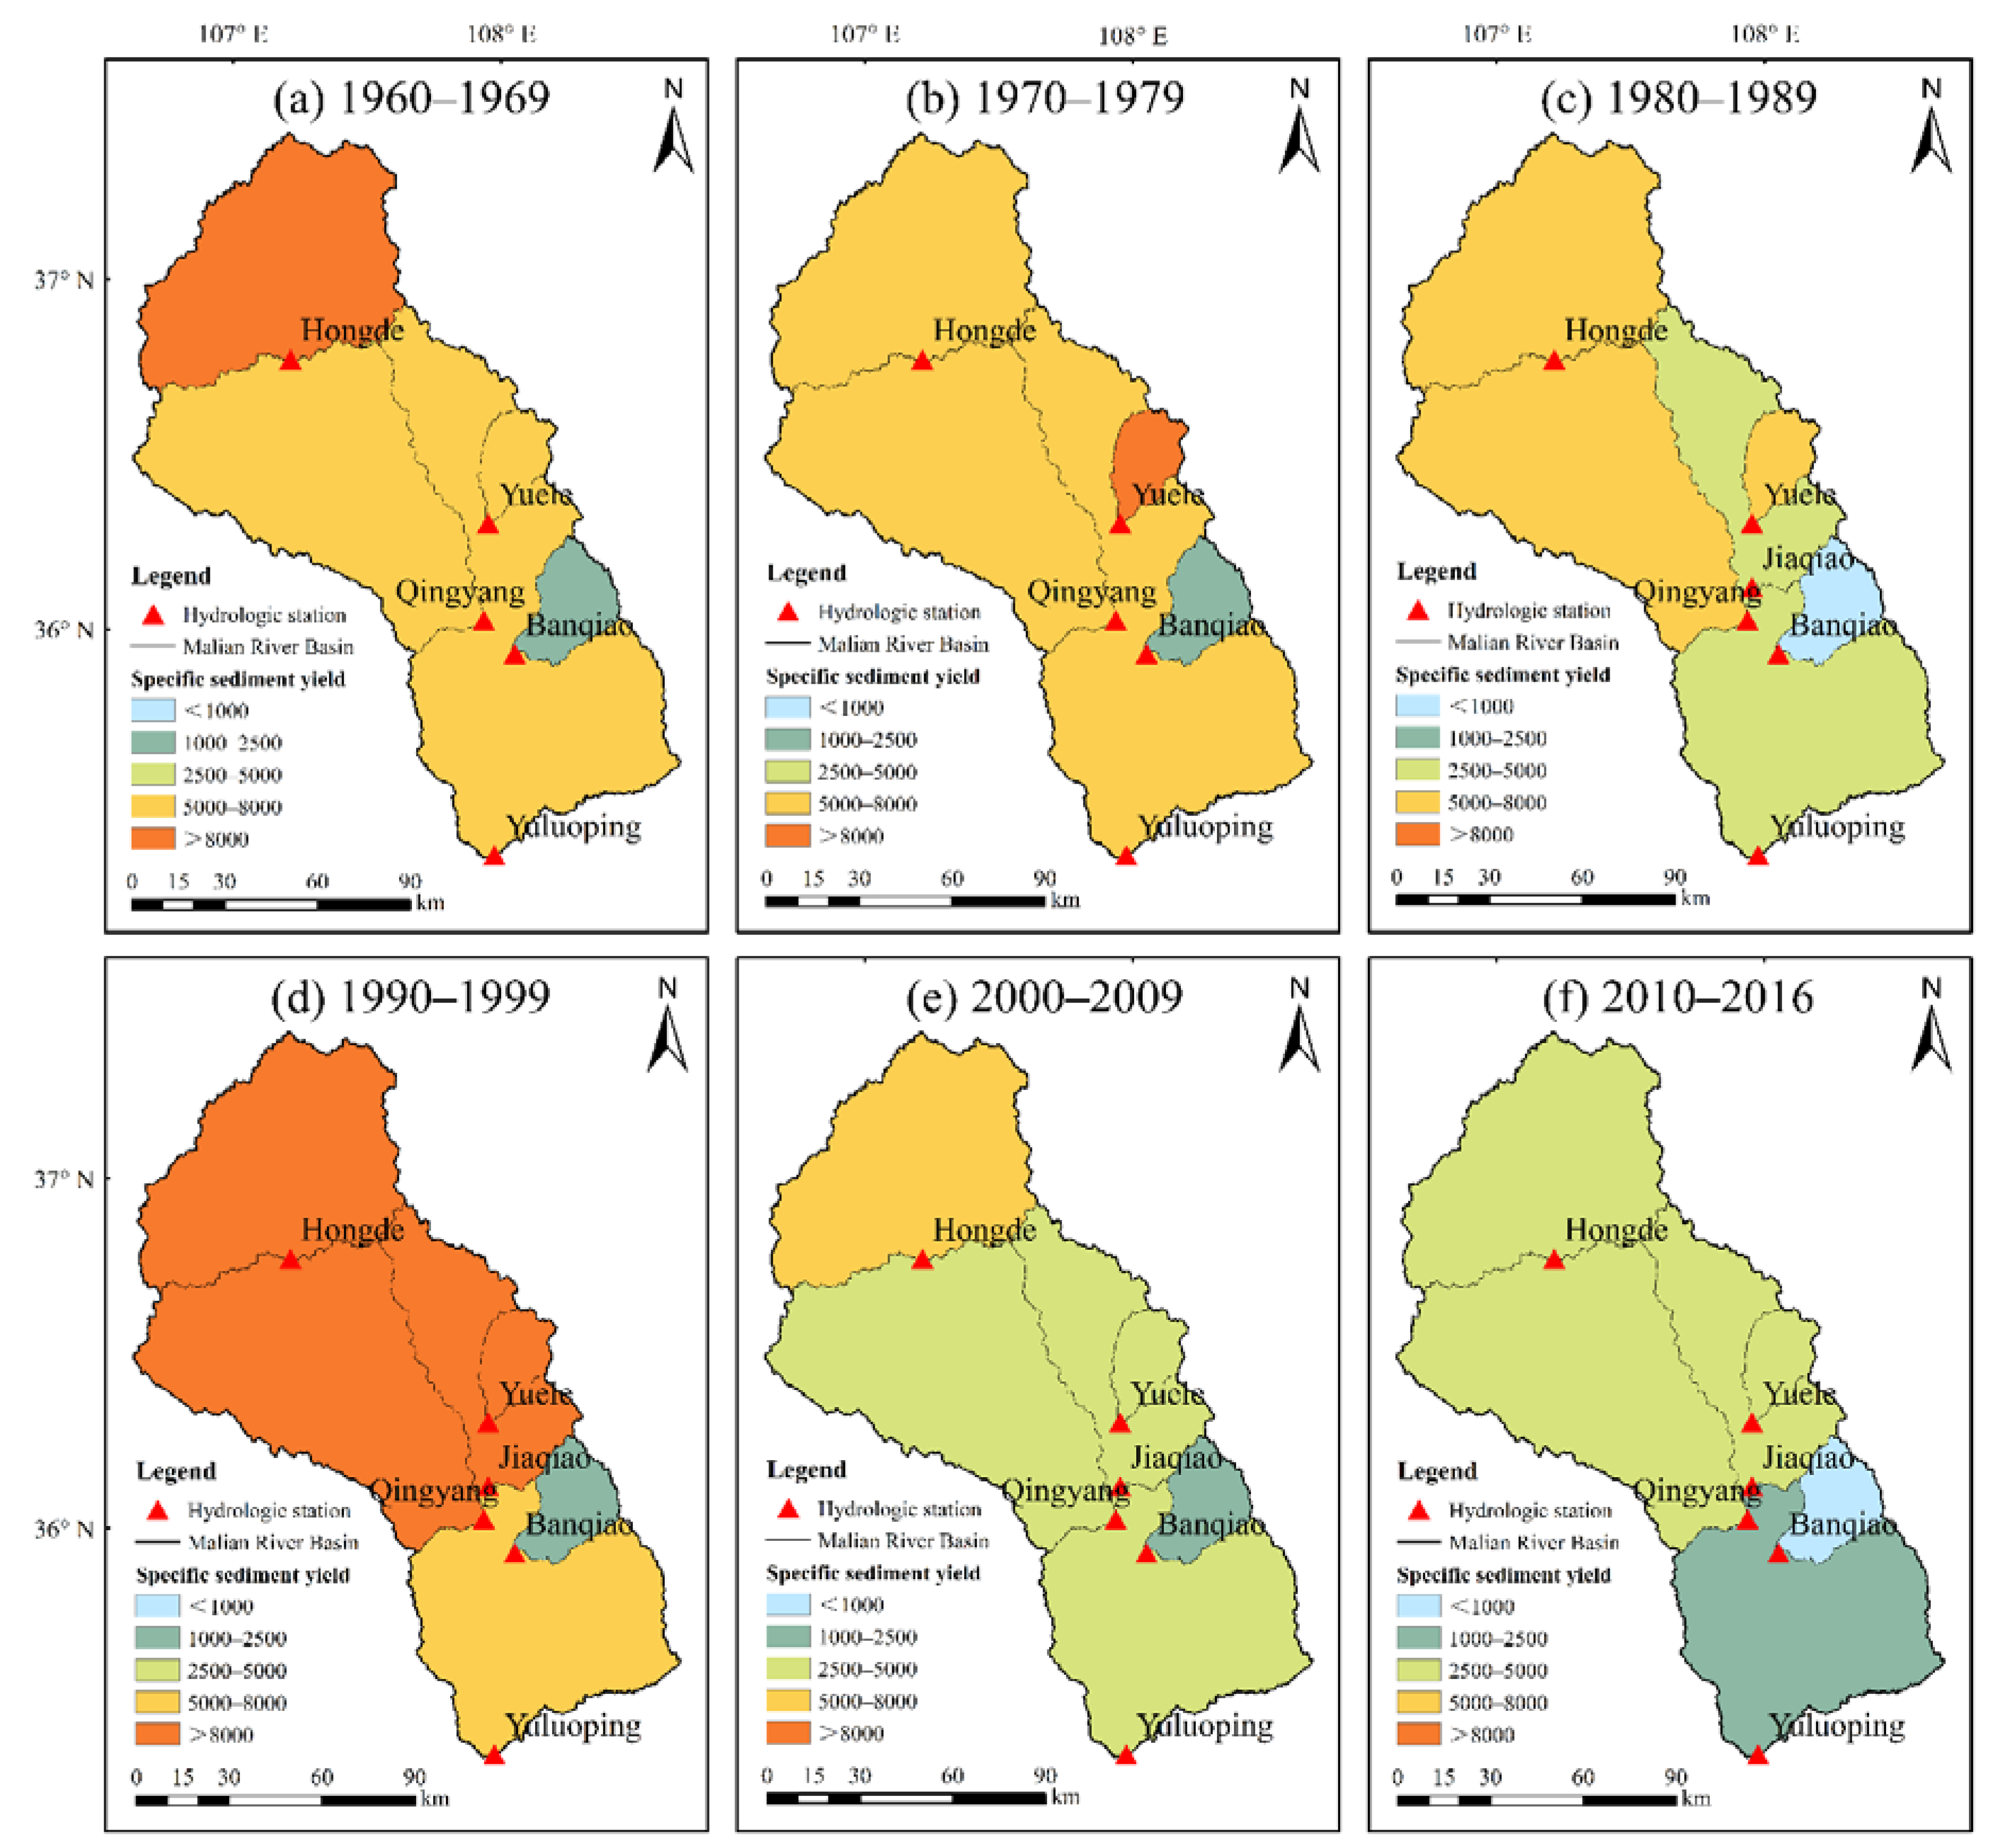
3.2. Spatial Patterns in Runoff and Sediment Load

Figure 5 shows the spatial distribution of runoff depth in the Malian River basin during different decades. Overall, the runoff depth showed a decreasing trend from south to north during different decades in the basin. The annual average runoff depth indicated a decreasing trend from 1960 to 2016 at a rate of 0.14 mm yr−1. From the 1960s to 1980s, the runoff depth varied moderately. In the 1990s, the runoff depth in most sub-basins was less than 30 mm, except for that controlled by the Yuele Station. The runoff depth decreased significantly in the downstream of the Malian River basin from 1990–1999. After 2000, the runoff depth continued to decrease, and an extremely low runoff depth was detected in the area controlled by Hongde (10 mm yr−1) between 2010 and 2016.
The specific sediment yield reflected soil erosion rates in the sub-basin. An overall decreasing annual sediment yield was observed between 1960 and 2016 at a rate of 53.50 t km−2 yr−1. Figure 6 shows a higher specific sediment yield in the upstream of the basin (controlled by Hongde station). In the 1960s, the specific sediment yield decreased gradually from upstream to downstream at an average of 6721.7 t km−2 yr−1 in the entire basin. From the 1970s to 1990s, however, the specific sediment yield varied in different regions, with some higher than 5000 t km−2 yr−1. After 2000, no sub-basins exhibited a specific sediment yield larger than 5000 t km−2 yr−1, and an extremely low specific sediment yield was observed downstream of the Malian River basin between 2010 and 2016.

3.3. Contributions of Human Activities and Rainfall to Runoff and Sediment Load Reduction

Double-mass curves were drawn to further quantify changes in the runoff and sediment load before and after the abrupt change (Figure 7). The results suggested that rainfall contributed 9.3% to the decrease in runoff, and human activities contributed to 90.7% of the runoff. For the sediment load, the changes in the annual rainfall accounted for 21.3% of the decrease, and human activities contributed to 78.7%. The analysis indicates that human activities had significant impacts on the runoff and sediment-load reduction in the Malian River basin (Table 3).
The sediment identity factor method indicated that the sediment concentration, runoff coefficient, and rainfall contributed an average of 24.5%, 57.8%, and 17.7% to the sediment load reduction, respectively (Figure 7). Therefore, the sediment load reduction was mainly achieved by reducing the sediment concentration and the runoff coefficient. When we compared the attributions from rainfall changes, both the double-mass curve and sediment identity factor method showed similar results.

4. Discussion

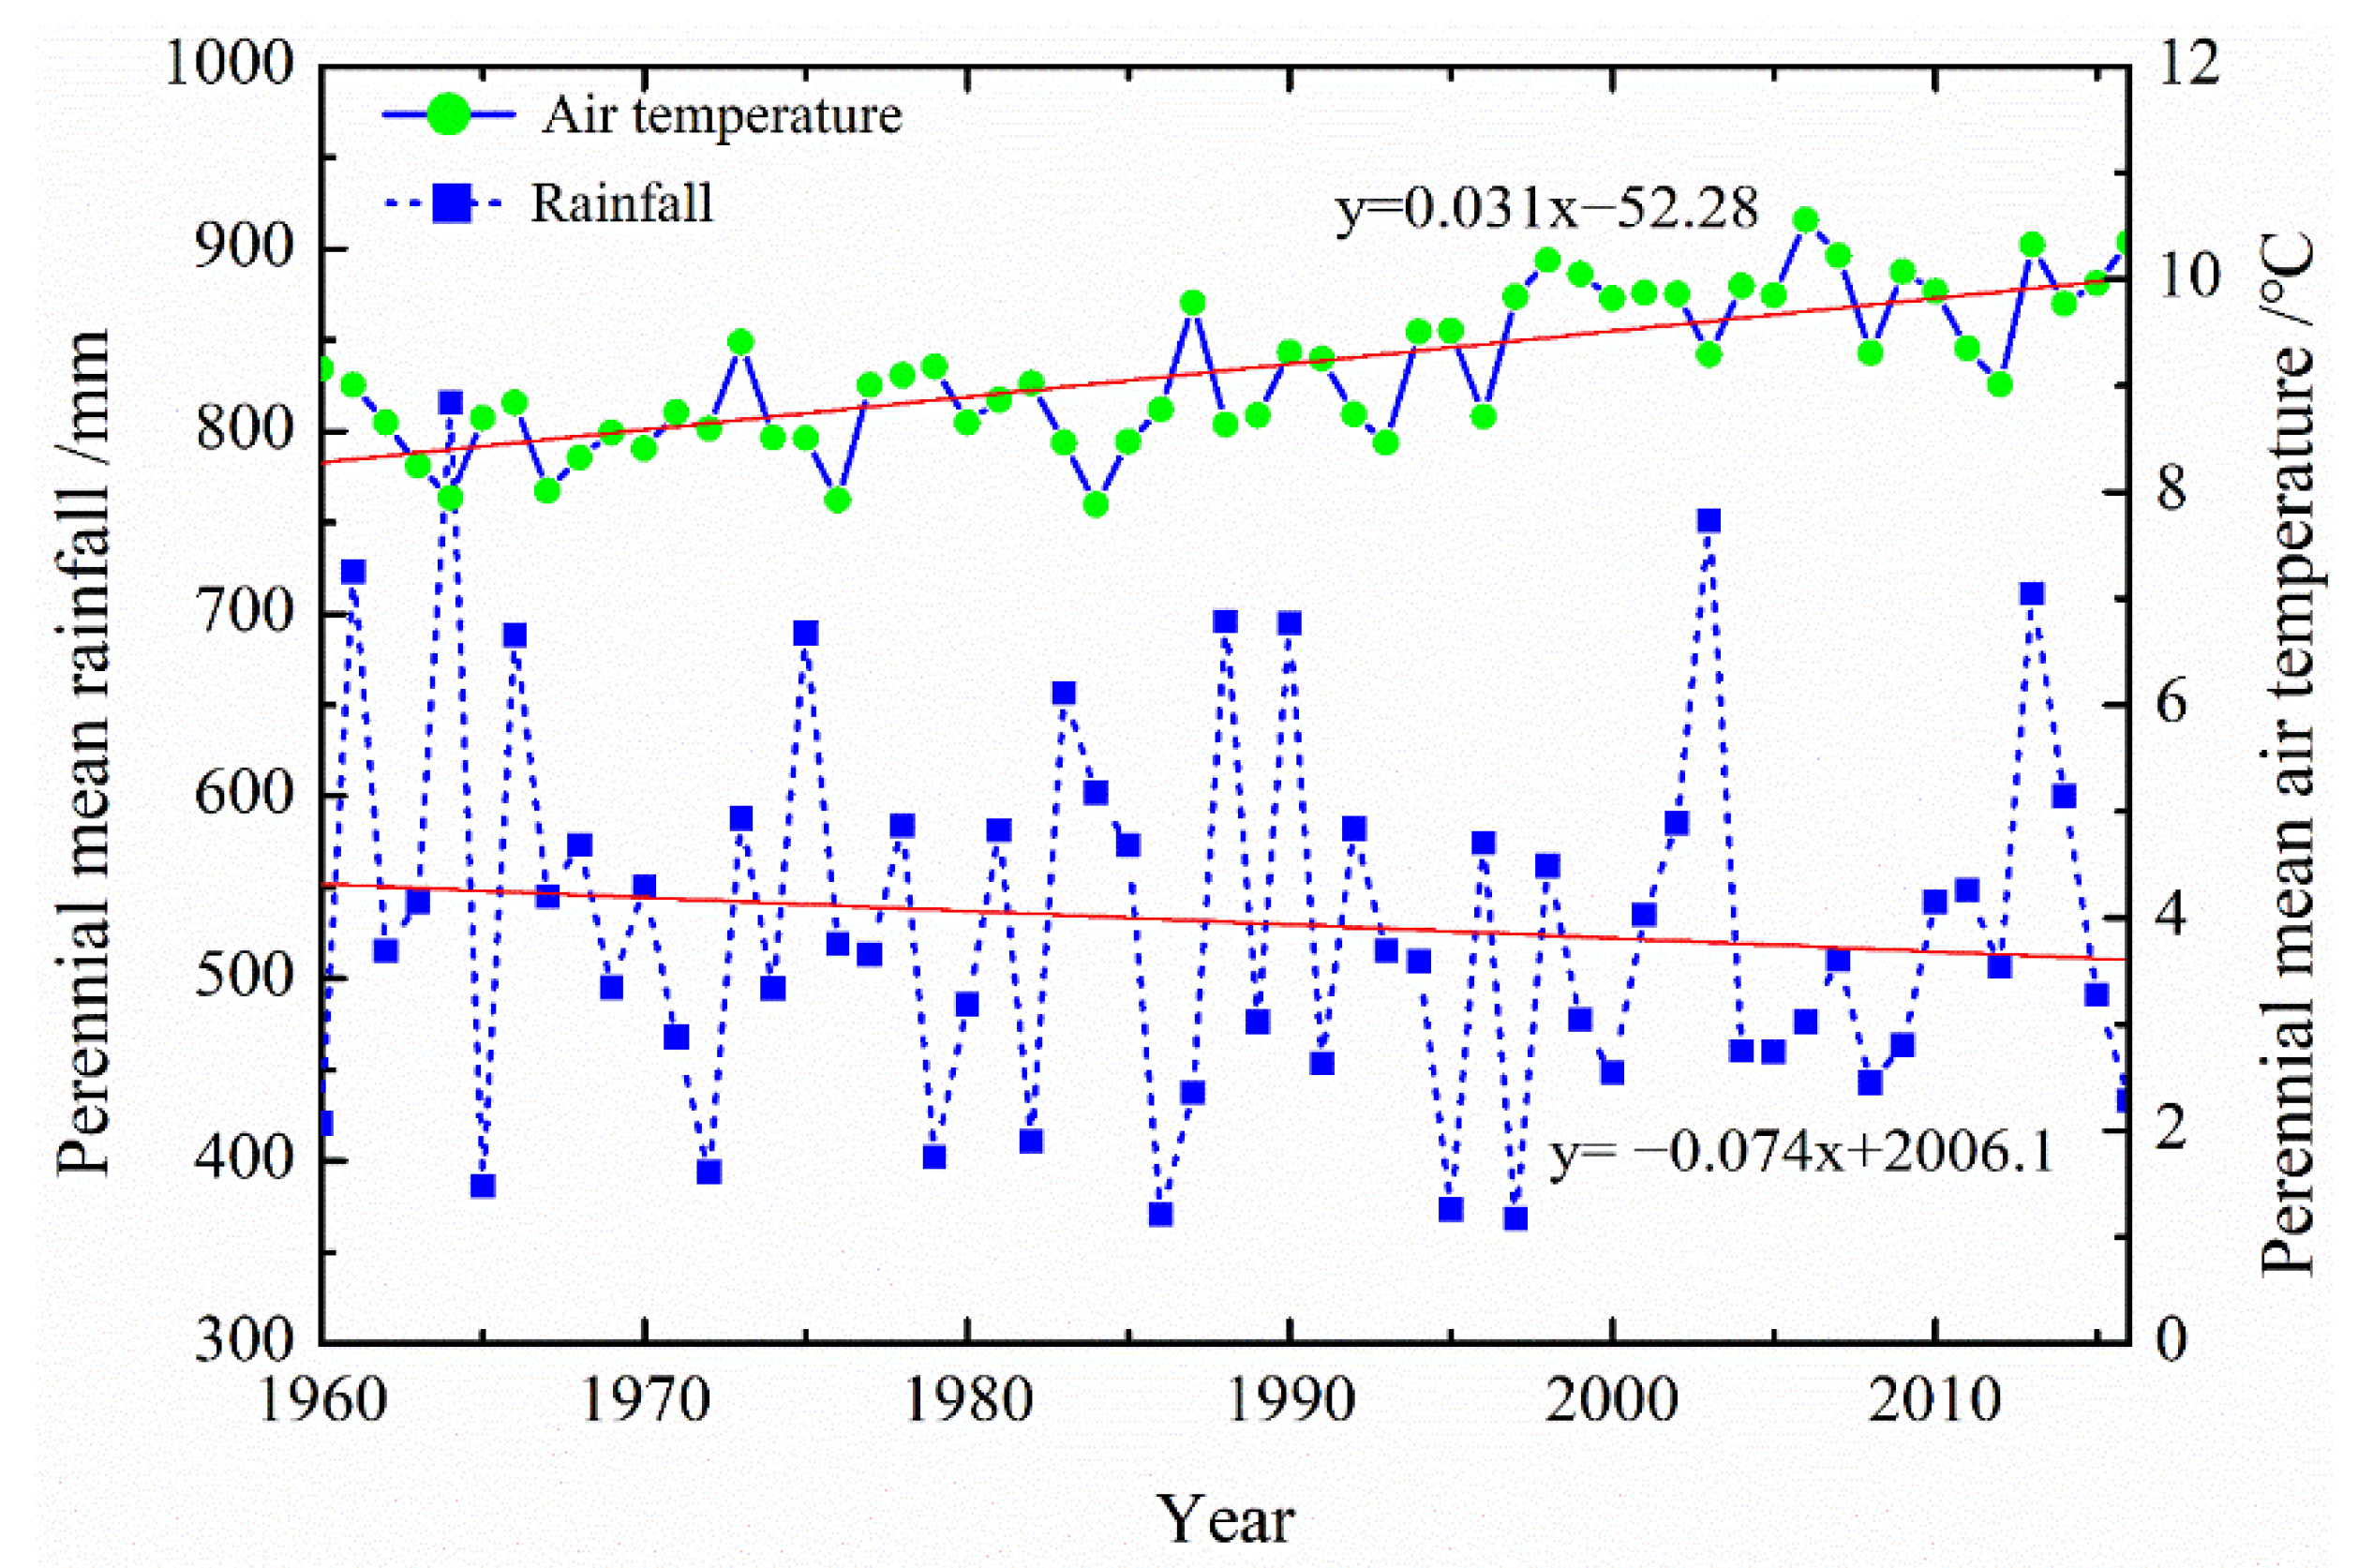
4.1. Impacts of Climate Change on Runoff and Sediment Load

Previous studies have examined changes in the runoff and sediment loads of different rivers and the influencing factors on the Loess Plateau [42]. Climate changes affected the runoff and sediment load based on the rainfall and air temperatures [24,42,43,44]. Figure 8 shows the changing trends of annual average air temperature and annual average rainfall in the Malian River basin. The annual rainfall decreased by 0.074 mm yr−1, and the annual air temperature increased by 0.031 °C yr−1. This suggested that the study area experienced a relatively drier and warmer period from 1960 to 2016, which was similar to the results of the previous studies of the Yellow River basin [45,46,47].
In our study, rainfall changes were responsible for 9.3% of the runoff and 21.3% of the sediment load reduction. A comparison with other tributaries on the Loess Plateau indicated that changes in the runoff and sediment loads in the Malian River basin were insignificant. However, the attributions were consistent with other rivers. As shown in Table 4, most of the studies suggested that anthropogenic activities significantly reduced the runoff and sediment load in most rivers surrounding the Yellow River basin [43,48,49,50,51,52,53]. For example, Wang et al. reported that 30% of the sediment load reduction observed between 1969 and 2005 in the Yellow River basin area was produced by rainfall changes. Similar attributions were also documented in other tributaries of the Yellow River basin [51].

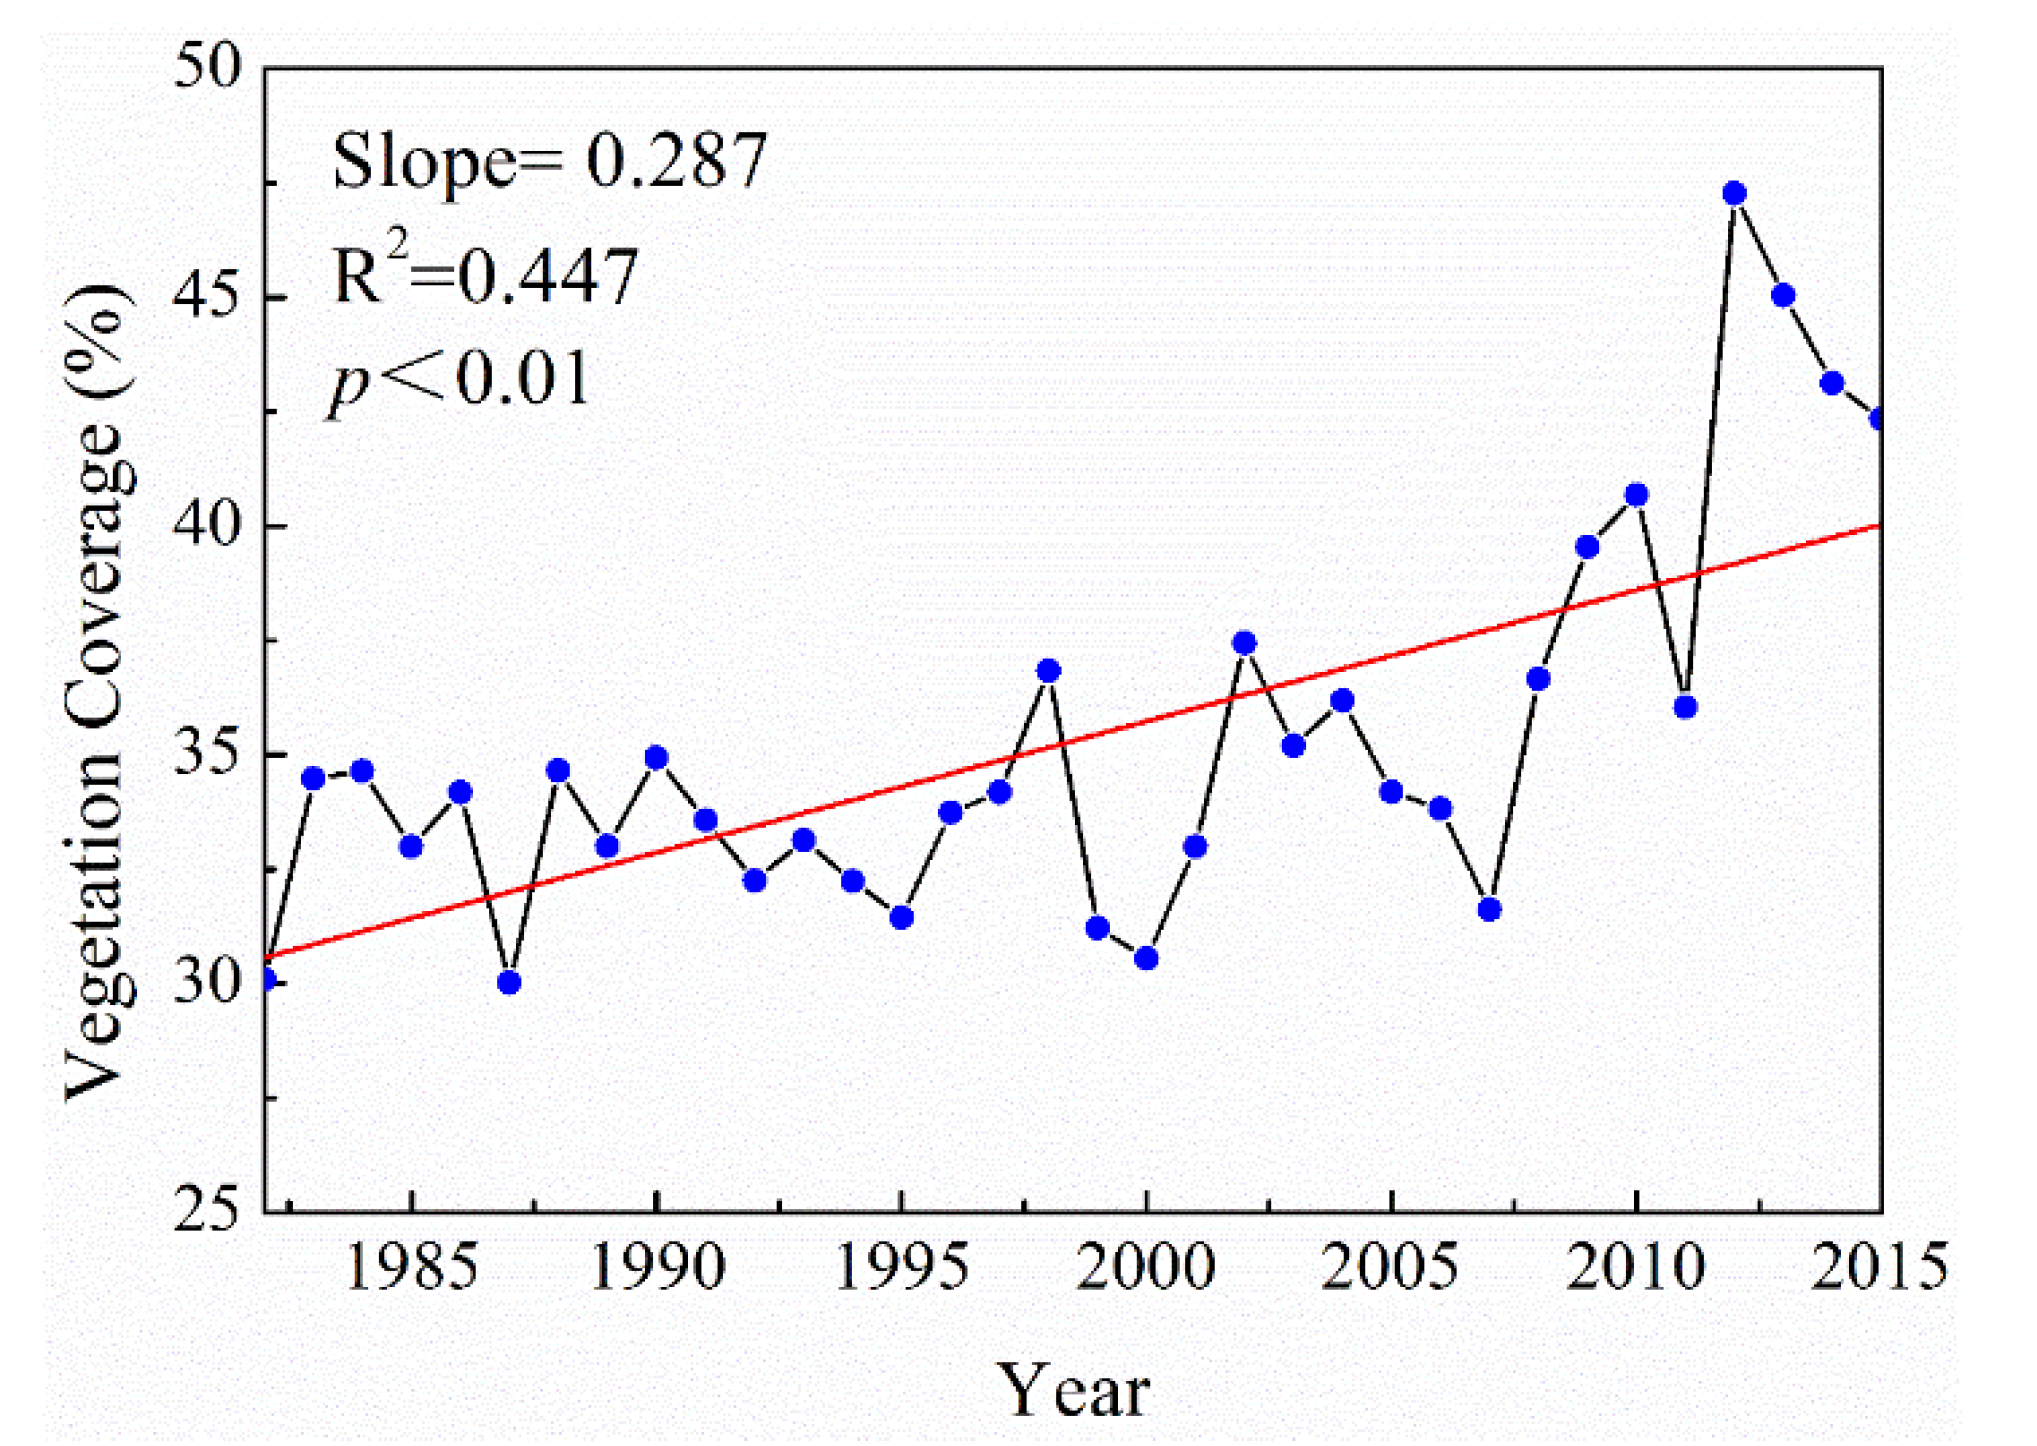
4.2. Impacts of Human Activities on Runoff and Sediment Load

Anthropogenic activities produced a significant runoff and sediment load decrease in the Yellow River basin, particularly in the Loess Plateau region. In particular, large-scale water and soil conservation measures have been implemented in the Yellow River basin region since the 1950s, including afforestation, fish-scale pits, terraces, and check dam and reservoir applications [54,55,56]. Numerous studies have reported the significance of soil and water conservation measures in drastically reducing runoff and sediment loads in the Yellow River [57,58,59,60] and many other rivers around the world. Meade and Moody showed sediment discharge changes in the Missouri–Mississippi River from 1987 to 2006, and their results indicated that check-dam retention characteristics in the 1950s significantly reduced the sediment in the muddy part of the river [14]. Sharda et al. analyzed the runoff and sediment load reduction benefits of terrace fields in India, and showed that the efficiency of water and sediment reduction could reach approximately 80% and 90%, respectively [61]. In addition, reservoir construction also significantly affected the runoff and sediment load reduction. Naik and Jay showed that the decrease in runoff and sediment load in the Columbia River over the past 150 years was due to reservoir regulation and irrigation water control [16].
Previous literature has indicated that the 80% runoff reduction and 70% sediment load decrease in the Yellow River basin were a result of anthropogenic activities. Check dams are an effective measure to trap large amounts of sediment [62,63]. During the past 70 years, approximately 56,000 check dams have been established in the Loess Plateau region, including 5500 large dams [64]. However, the number of check dams in the Malian River basin is limited. Statistics have indicated the presence of 211 check dams (storage capacity > 0.005 × 10⁸ m3) in the Malian River basin, with a total storage capacity of 1.75 × 10⁸ m3. Reservoirs can reduce the flood peaks and increase flow during the dry period by impounding upstream incoming water [65,66]. Only two medium-sized reservoirs are present in the Malian River basin, thereby limiting the trapping effects of reservoirs to streamflow reduction in the basin.
A large-scale ecological restoration project known as “Grain for Green” was established in 1999 as a means to mitigate severe soil erosion and enhance vegetation coverage by converting steeply sloping arable land into forestland and grassland [67,68,69]. After implementing this project, the vegetation coverage for most basins on the Loess Plateau increased significantly [70,71]. Zhang et al. showed that the Malian River basin experienced three periods of vegetation coverage from 1977 to 2010: degradation (1977–1987), deterioration (1987–2000), and recovery (2000–2010) [72]. In the early stage, forest degradation was the main factor. In the middle stage, vegetation coverage reached a turning point when deterioration continued and arable land area significantly increased, especially in the loessial tableland. Forest and grassland restoration have recently improved. Figure 9 shows the level of vegetation coverage in the Malian River basin from 1982 to 2015. The vegetation coverage significantly increased with time (p < 0.01), and the average annual vegetation coverage of the growing season was 35.31%, increasing at an annual rate of 0.287% yr−1. From 1982 to 1999, the average annual vegetation coverage was 33.2%, compared to approximately 47% in 2012. These results indicate that large-scale engineering measures increased the vegetation coverage significantly due to the implementation of the Grain for Green project in 1999.
After the Grain for Green policy was instituted, the region of forestland and grassland in the basin gradually increased, which is an important factor for the reduction of runoff and sediment loads. Due to the geographical location, water resources are restricted in the northern region, where the vegetation restoration is far less vigorous than in the southern forest region, and the sediment load is still the most serious across the basin. In addition, numerous gullies in the northern region hinder vegetation, and since the vegetation is mostly herbaceous, runoff and sediment load reductions were limited compared to the use of macrophanerophytes in the southern region. Future research should be conducted to examine soil and water conservation in the northern basin region, which is controlled by Hongde Station.

5. Conclusions

The present study examined the spatial and temporal variations of runoff and sediment load at six hydrological stations in the Malian River basin between 1960 and 2016.The Malian River basin exhibited a decreasing annual runoff and sediment load trend of 0.027 × 10⁸ m3 yr−1 and 0.0102 × 10⁸ t yr−1, respectively. A higher runoff depth was observed downstream, while the sediment yield was higher upstream of the basin. Rainfall and anthropogenic activity contributed to runoff and sediment load reductions in the Malian River basin based on the double-mass curve. Specifically, anthropogenic activities accounted for 90.7% and 78.7% of the runoff and sediment load reduction, respectively. The sediment identity factor analysis indicated that the sediment concentration, runoff coefficient, and rainfall contributed an average of 24.5%, 57.8%, and 17.7% to the sediment load reduction, respectively. The sediment yield was still higher in the Malian River basin compared to other watersheds on the Loess Plateau; however, it exhibited an evident decreasing trend. The spatial distribution results exhibited a high sediment yield upstream of the study area, possibly due to significant implementations of soil and water conservation in this region.

Author Contributions

The research content was written by M.D. and X.M. The revision of the manuscript was completed by G.Z., P.G. and W.S. All authors have read and agreed to the published version of the manuscript.

Funding

This research was funded by the National Science Foundation of China grant number 42077075 and 41671285.

Institutional Review Board Statement

Not applicable.

Informed Consent Statement

Informed consent was obtained from all subjects involved in the study.

Data Availability Statement

Restrictions apply to the availability of these data. Data was obtained from Yellow River Water Conservancy Commission (YRCC) of the Ministry of Water Resources, China and Chinese Climate Center (http://data.cma.cn/site/index.html).

Conflicts of Interest

The authors declare no conflict of interest.

References

  1. Guo, M.M.; Wang, W.L.; Kang, H.L.; Yang, B. Changes in soil properties and erodibility of gully heads induced by vegetation restoration on the Loess Plateau, China. J. Arid Land 2018, 10, 712–725. [Google Scholar] [CrossRef] [Green Version]
  2. Shi, Q.H.; Wang, W.; Zhu, B.; Guo, M. Experimental study of hydraulic characteristics on headcut erosion and erosional response in the tableland and gully regions of China. Soil Sci. Soc. Am. J. 2020, 84, 700–716. [Google Scholar] [CrossRef] [Green Version]
  3. Li, Z.; Liu, W.-Z.; Zhang, X.-C.; Zheng, F.-L. Assessing the site-specific impacts of climate change on hydrology, soil erosion and crop yields in the Loess Plateau of China. Clim. Chang. 2010, 105, 223–242. [Google Scholar] [CrossRef]
  4. Li, Z.; Zhang, Y.; Zhu, Q.; He, Y.; Yao, W. Assessment of bank gully development and vegetation coverage on the Chinese Loess Plateau. Geomorphology 2015, 228, 462–469. [Google Scholar] [CrossRef]
  5. Zhao, M.W.; Tang, G.A.; Li, F.Y.; Yuan, B.Y.; Lu, Z.C. Significance of impact factors upon Erosion and sediment yield on Northern Shaanxi Loess Plateau Province based on BP neural network. Bull. Soil Water Conserv. 2012, 32, 5–9. [Google Scholar]
  6. Zhu, S.J.; Tang, G.A.; Li, F.X.; Xiong, L.Y. Spatial variation of hypsometric integral in the loess plateau based on DEM. Acta Geogr. Sin. 2013, 68, 921–932. [Google Scholar]
  7. Wu, Z.J.; Zhao, D.Y.; Che, A.L.; Chen, D.W.; Liang, C. Dynamic response characteristics and failure mode of slopes on the loess tableland using a shaking-table model test. Landslides 2020, 17, 1561–1575. [Google Scholar] [CrossRef]
  8. Zhang, X.P.; Zhang, L.; Zhao, J.; Rustomji, P.; Hairsine, P. Responses of streamflow to changes in climate and land use/cover in the Loess Plateau, China. Water Resour. Res. 2008, 44. [Google Scholar] [CrossRef]
  9. Zhang, B.J.; Zhang, G.H.; Yang, H.Y.; Wang, H. Soil resistance to flowing water erosion of seven typical plant communities on steep gully slopes on the Loess Plateau of China. Catena 2019, 173, 375–383. [Google Scholar] [CrossRef]
  10. Haddeland, I.; Heinke, J.; Biemans, H.; Eisner, S.; Florke, M.; Hanasaki, N.; Konzmann, M.; Ludwig, F.; Masaki, Y.; Schewe, J.; et al. Global water resources affected by human interventions and climate change. Proc. Natl. Acad. Sci. USA 2014, 111, 3251–3256. [Google Scholar] [CrossRef] [Green Version]
  11. Walling, D.E.; Fang, D. Recent trends in the suspended sediment loads of the world’s rivers. Glob. Planet. Chang. 2003, 39, 111–126. [Google Scholar] [CrossRef]
  12. Wang, H.J.; Saito, Y.; Zhang, Y.; Bi, N.S.; Sun, X.X.; Yang, Z.S. Recent changes of sediment flux to the western Pacific Ocean from major rivers in East and Southeast Asia. Earth-Sci. Rev. 2011, 108, 80–100. [Google Scholar] [CrossRef]
  13. Mikhailova, M.V. Transformation of the Ebro River Delta under the impact of intense human-induced reduction of sediment runoff. Water Resour. 2003, 30, 370–378. [Google Scholar] [CrossRef]
  14. Meade, R.H.; Moody, J.A. Causes for the decline of suspended-sediment discharge in the Mississippi River system, 1940–2007. Hydrol. Process. 2010, 24, 35–49. [Google Scholar] [CrossRef]
  15. Carriquiry, J.D.; Sánchez, A. Sedimentation in the Colorado river delta and upper gulf of California after nearly a century of discharge loss. Mar. Geol. 1999, 158, 125–145. [Google Scholar] [CrossRef]
  16. Naik, P.K.; Jay, D.A. Distinguishing human and climate influences on the Columbia River: Changes in mean flow and sediment transport. J. Hydrol. 2011, 404, 259–277. [Google Scholar] [CrossRef]
  17. Labat, D.; Godderis, Y.; Probst, J.L.; Guyot, J.L. Evidence for global runoff increase related to climate warming. Adv. Water Resour. 2004, 27, 631–642. [Google Scholar] [CrossRef]
  18. Walling, D.E. Human impact on land–ocean sediment transfer by the world’s rivers. Geomorphology 2006, 79, 192–216. [Google Scholar] [CrossRef]
  19. Wang, S.; Fu, B.J.; Piao, S.L.; Lv, Y.H.; Ciais, P.; Feng, X.M.; Wang, Y.F. Reduced sediment transport in the Yellow River due to anthropogenic changes. Nat. Geosci. 2015, 9, 38–41. [Google Scholar] [CrossRef]
  20. Chen, D.; Wei, W.; Chen, L.D. Effects of terracing practices on water erosion control in China: A meta analysis. Earth Sci. Rev. 2017, 173, 109–121. [Google Scholar] [CrossRef]
  21. Boix-Fayos, C.; de Vente, J.; Martinez-Mena, M.; Barbera, G.G.; Castillo, V. The impact of land use change and check-dams on catchment sediment yield. Hydrol. Process. 2008, 22, 4922–4935. [Google Scholar] [CrossRef]
  22. Abedini, M.; Said, M.A.M.; Ahmad, F. Effectiveness of check dam to control soil erosion in a tropical catchment (The Ulu Kinta Basin). Catena 2012, 97, 63–70. [Google Scholar] [CrossRef]
  23. Wang, F.; Zhao, G.J.; Mu, X.M.; Gao, P.; Sun, W.Y. Regime shift identification of runoff and sediment loads in the Yellow River Basin, China. Water 2014, 6, 3012–3032. [Google Scholar] [CrossRef] [Green Version]
  24. Wei, Y.H.; Jiao, J.Y.; Zhao, G.J.; Zhao, H.K.; He, Z.; Mu, X.M. Spatial-temporal variation and periodic change in streamflow and suspended sediment discharge along the mainstream of the Yellow River during 1950–2013. Catena 2016, 140, 105–115. [Google Scholar] [CrossRef] [Green Version]
  25. Mu, X.M.; Zhang, X.Q.; Shao, H.B.; Gao, P.; Wang, F.; Jiao, J.Y.; Zhu, J.L. Dynamic changes of sediment discharge and the influencing factors in the Yellow River, China, for the recent 90 years. CLEAN–Soil Air Water 2012, 40, 303–309. [Google Scholar] [CrossRef]
  26. Yao, W.Y.; Xiao, P.X.; Shen, Z.Z.; Wang, J.H.; Jiao, P. Analysis of the contribution of multiple factors to the recent decrease in discharge and sediment yield in the Yellow River Basin, China. J. Geogr. Sci. 2016, 26, 1289–1304. [Google Scholar] [CrossRef]
  27. Gao, G.Y.; Fu, B.J.; Zhang, J.J.; Ma, Y.; Sivapalan, M. Multiscale temporal variability of flow-sediment relationships during the 1950s-2014 in the Loess Plateau, China. J. Hydrol. 2018, 563, 609–619. [Google Scholar] [CrossRef]
  28. Zhang, Y.Z.; Zhang, D.Y.; Liu, Y.Y. Precipitation variation in Malianhe River Basin of the Loess Plateau in recent 50 years. Sci. Soil Water Conserv. 2016, 14, 44–52. [Google Scholar]
  29. Zhao, H.Y.; Zhang, X.D.; Wang, Y.H.; Zhang, Q.; Ma, P.L.; Yao, H.; Sun, L.D.; Qu, W.; Mao, Y.Q.; Yang, X.L. Climate change and their impact on water resources in the Loess Plateau of east Gansu. Agric. Res. Arid Areas 2011, 29, 262–268. [Google Scholar]
  30. Wang, Y.S.; Cheng, X.X.; Zhang, M.N.; Qi, X.F. Hydrochemical characteristics and formation mechanisms of Malian River in Yellow River basin during dry season. Environ. Chem. 2018, 37, 164–172. [Google Scholar]
  31. Mann, H.B. Non-parametric test against trend. Econometrica 1945, 13, 245–259. [Google Scholar] [CrossRef]
  32. Kendall, M.G. Rank Correlation Measures; Charles Grifn: London, UK, 1975; p. 202. [Google Scholar]
  33. Pettitt, A.N. A non-parametric approach to the change-point problem. J. R. Stat. Soc. 1979, 28, 126–135. [Google Scholar] [CrossRef]
  34. Assefa, K.; Moges, M.A. Low flow trends and frequency analysis in the Blue Nile Basin, Ethiopia. J. Water Resour. Prot. 2018, 10, 182–203. [Google Scholar] [CrossRef] [Green Version]
  35. Burn, D.H.; Elnur, M.A.H. Detection of hydrologic trends and variability. J. Hydrol. 2002, 255, 107–122. [Google Scholar] [CrossRef]
  36. Hirsch, R.M.; Slack, J.R.; Smith, R.A. Techniques of trend analysis for monthly water quality data. Water Resour. Res. 1982, 18, 107–121. [Google Scholar] [CrossRef] [Green Version]
  37. Guo, L.P.; Yu, Q.; Gao, P.; Nie, X.F.; Liao, K.T.; Chen, X.L.; Hu, J.M.; Mu, X.M. Trend and change-point analysis of streamflow and sediment discharge of the Gongshui River in China during the last 60 years. Water 2018, 10, 1273. [Google Scholar] [CrossRef] [Green Version]
  38. Siakeu, J.; Oguchi, T.; Aoki, T.; Esaki, Y.; Jarvie, H.P. Change in riverine suspended sediment concentration in central Japan in response to late 20th century human activities. Catena 2004, 55, 231–254. [Google Scholar] [CrossRef]
  39. Gao, P.; Li, P.F.; Zhao, B.L.; Xu, R.R.; Zhao, G.J.; Sun, W.Y.; Mu, X.M. Use of double mass curves in hydrologic benefit evaluations. Hydrol. Process. 2017, 31, 4639–4646. [Google Scholar] [CrossRef]
  40. Wang, S.; Fu, B.J.; Liang, W.; Liu, Y.; Wang, Y.F. Driving forces of changes in the water and sediment relationship in the Yellow River. Sci. Total Environ. 2017, 576, 453–461. [Google Scholar] [CrossRef]
  41. Zhao, G.J.; Mu, X.M.; Jiao, J.Y.; Gao, P.; Sun, W.Y.; Li, E.H.; Wei, Y.H.; Huang, J.C. Assessing response of sediment load variation to climate change and human activities with six different approaches. Sci. Total Environ. 2018, 639, 773–784. [Google Scholar] [CrossRef]
  42. Shi, H.Y.; Wang, G.Q. Impacts of climate change and hydraulic structures on runoff and sediment discharge in the middle Yellow River. Hydrol. Process. 2015, 29, 3236–3246. [Google Scholar] [CrossRef] [Green Version]
  43. Li, B.Q.; Liang, Z.M.; Zhang, J.Y.; Wang, G.Q.; Zhao, W.M.; Zhang, H.Y.; Wang, J.; Hu, Y.M. Attribution analysis of runoff decline in a semiarid region of the Loess Plateau, China. Theor. Appl. Climatol. 2016, 131, 845–855. [Google Scholar] [CrossRef]
  44. Nunes, J.P.; Seixas, J.; Keizer, J.J. Modeling the response of within-storm runoff and erosion dynamics to climate change in two Mediterranean watersheds: A multi-model, multi-scale approach to scenario design and analysis. Catena 2013, 102, 27–39. [Google Scholar] [CrossRef]
  45. Huang, Y.; Cai, J.L.; Yin, H.; Cai, M.T. Correlation of precipitation to temperature variation in the Huanghe River (Yellow River) basin during 1957–2006. J. Hydrol. 2009, 372, 1–8. [Google Scholar] [CrossRef]
  46. Xu, X.L.; Scanlon, B.R.; Schilling, K.; Sun, A. Relative importance of climate and land surface changes on hydrologic changes in the US Midwest since the 1930s implications for biofuel production. J. Hydrol. 2013, 497, 110–120. [Google Scholar] [CrossRef]
  47. Zhao, G.J.; Tian, P.; Mu, X.M.; Jiao, J.Y.; Wang, F.; Gao, P. Quantifying the impact of climate variability and human activities on streamflow in the middle reaches of the Yellow River basin, China. J. Hydrol. 2014, 519, 387–398. [Google Scholar] [CrossRef]
  48. Gao, G.Y.; Ma, Y.; Fu, B.J. Multi-temporal scale changes of streamflow and sediment load in a loess hilly watershed of China. Hydrol. Process. 2016, 30, 365–382. [Google Scholar] [CrossRef] [Green Version]
  49. Gao, P.; Geissen, V.; Ritsema, C.J.; Mu, X.M.; Wang, F. Impact of climate change and anthropogenic activities on stream flow and sediment discharge in the Wei River basin, China. Hydrol. Earth Syst. Sci. 2013, 17, 961–972. [Google Scholar] [CrossRef] [Green Version]
  50. Miao, C.Y.; Shi, W.; Chen, X.H.; Yang, L. Spatio-temporal variability of streamflow in the Yellow River: Possible causes and implications. Hydrol. Sci. J. 2012, 57, 1355–1367. [Google Scholar] [CrossRef] [Green Version]
  51. Wang, H.; Yang, Z.; Saito, Y.; Liu, J.P.; Sun, X.; Wang, Y. Stepwise decreases of the Huanghe (Yellow River) sediment load (1950–2005): Impacts of climate change and human activities. Glob. Planet. Chang. 2007, 57, 331–354. [Google Scholar] [CrossRef]
  52. Wang, Y.; Ding, Y.J.; Ye, B.S. Contributions of climate and human activities to changes in runoff of the Yellow and Yangtze rivers from 1950 to 2008. Earth Sci. 2013, 56, 1398–1412. [Google Scholar] [CrossRef]
  53. Yue, X.L.; Mu, X.M.; Zhao, G.J.; Shao, H.B.; Gao, P. Dynamic changes of sediment load in the middle reaches of the Yellow River basin, China and implications for eco-restoration. Ecol. Eng. 2014, 73, 64–72. [Google Scholar] [CrossRef]
  54. Chen, L.D.; Wei, W.; Fu, B.J.; Lv, Y.H. Soil and water conservation on the Loess Plateau in China: Review and perspective. Prog. Phys. Geogr. 2007, 31, 389–403. [Google Scholar] [CrossRef]
  55. Hessela, R.; Messing, I.; Chen, L.D.; Ritsemad, C.; Stolte, J. Soil erosion simulations of land use scenarios for a small Loess Plateau catchment. Catena 2003, 54, 289–302. [Google Scholar] [CrossRef]
  56. Jiao, J.J.; Joseph, T.; Xofis, P.; Bai, W.J.; Ma, X.H.; Mitchley, J. Can the study of natural vegetation succession assist in the control of soil erosion on abandoned croplands on the Loess Plateau, China? Restor. Ecol. 2007, 15, 391–399. [Google Scholar] [CrossRef]
  57. Li, B.Q.; Liang, Z.M.; Bao, Z.X.; Wang, J.; Hu, Y.M. Changes in streamflow and sediment for a planned large reservoir in the middle Yellow River. Land Degrad. Dev. 2019, 30, 878–893. [Google Scholar] [CrossRef] [Green Version]
  58. Miao, C.; Ni, J.; Borthwick, A.G.L.; Yang, L. A preliminary estimate of human and natural contributions to the changes in water discharge and sediment load in the Yellow River. Glob. Planet. Chang. 2011, 76, 196–205. [Google Scholar] [CrossRef] [Green Version]
  59. Mu, X.M.; Zhang, L.; McVicar, T.R.; Chille, B.; Gao, P. Analysis of the impact ofconservation measures on stream flow regime in catchments of the loess plateau, China. Hydrol. Process. 2007, 21, 2124–2134. [Google Scholar] [CrossRef]
  60. Xin, Z.B.; Yu, B.F.; Han, Y.G. Spatiotemporal variations in annual sediment yield from the middle Yellow River, China, 1950–2010. J. Hydrol. Eng. 2015. [Google Scholar] [CrossRef]
  61. Sharda, V.N.; Juyal, G.P.; Singh, P.N. Hydrologic and sedimentologic behavior of a conservation Bench Terrace System in a sub-humid climate. Trans. ASAE 2002, 45, 1433–1444. [Google Scholar] [CrossRef]
  62. Ma, Y.X.; Huang, H.Q.; Nanson, G.C.; Li, Y.; Yao, W.Y. Channel adjustments in response to the operation of large dams: The upper reach of the lower Yellow River. Geomorphology 2012, 147, 5–48. [Google Scholar] [CrossRef] [Green Version]
  63. Mekonnen, M.; Keesstra, S.D.; Stroosnijder, L.; Baartman, J.E.M.; Maroulis, J. Soil conservation through sediment trapping: A review. Land Degrad. Dev. 2015, 26, 544–556. [Google Scholar] [CrossRef]
  64. Jin, Z.; Cui, B.L.; Song, Y.; Shi, W.Y.; Wang, K.B.; Wang, Y.; Liang, J. How many check dams do we need to build on the Loess Plateau? Environ. Sci. Technol. 2012, 46, 8527–8528. [Google Scholar] [CrossRef]
  65. Ayalew, T.B.; Krajewski, W.F.; Mantilla, R. Exploring the effect of reservoir storage on peak discharge frequency. J. Hydrol. Eng. 2013, 18, 1697–1708. [Google Scholar] [CrossRef]
  66. Vörösmarty, C.J.; Meybeck, M.; Fekete, B.; Sharma, K.; Green, P.; Syvitski, J.P.M. Anthropogenic sediment retention: Major global impact from registered river impoundments. Glob. Planet. Chang. 2003, 39, 169–190. [Google Scholar] [CrossRef]
  67. Cao, S.X.; Chen, L.; Yu, X.X. Impact of China’s grain for green project on the landscape of vulnerable arid and semi-arid agricultural regions: A case study in northern Shanxi Province. J. Appl. Ecol. 2009, 46, 536–543. [Google Scholar] [CrossRef]
  68. McVicar, T.R.; Li, L.T.; Van Niel, T.G.; Zhang, L.; Li, R.; Yang, Q.Y.; Zhang, X.P.; Mu, X.M.; Wen, Z.M.; Liu, W.Z.; et al. Developing a decision support tool for China’s re-vegetation program: Simulating regional impacts of afforestation on average annual streamflow in the Loess Plateau. For. Ecol. Manag. 2007, 251, 65–81. [Google Scholar] [CrossRef]
  69. Xin, Z.B.; Ran, L.S.; Lu, X.X. Soil erosion control and sediment load reduction in the Loess Plateau: Policy perspectives. Int. J. Water Resour. Dev. 2012, 28, 325–341. [Google Scholar] [CrossRef]
  70. Yang, X.N.; Sun, W.Y.; Li, P.F.; Mu, X.M.; Gao, P.; Zhao, G.J. Reduced sediment transport in the Chinese Loess Plateau due to climate change and human activities. Sci. Total Environ. 2018, 642, 591–600. [Google Scholar] [CrossRef]
  71. Zuo, D.P.; Xu, Z.X.; Yao, W.Y.; Jin, S.Y.; Xiao, P.Q.; Ran, D.C. Assessing the effects of changes in land use and climate on runoff and sediment yields from a watershed in the Loess Plateau of China. Sci. Total Environ. 2016, 544, 238–250. [Google Scholar] [CrossRef]
  72. Zhang, J.X.; Zhang, B.; Ma, Z.H.; Yin, H.X.; Sun, L.W. A multitemporal study in Malian River Watershed of Loess Plateau. Remote Sens. Technol. Appl. 2013, 28, 137–143. [Google Scholar]
Figure 1. The location and topography of the study area.
Sustainability 13 00443 g001
Figure 2. Interannual variations in the annual runoff in the Malian River basin.
Sustainability 13 00443 g002
Figure 3. Interannual variations in the annual sediment load in the Malian River basin.
Sustainability 13 00443 g003
Figure 4. The results of the Pettitt test of runoff and sediment load in the Malian River basin.
Sustainability 13 00443 g004
Figure 5. Spatial patterns of runoff depth (mm yr−1) in different decades in the Malian River basin.
Sustainability 13 00443 g005
Figure 6. Spatial distribution of the specific sediment yield (t km−2 yr−1) in different decades in the Malian River basin.
Sustainability 13 00443 g006
Figure 7. Relative rainfall change and anthropogenic activity contributions to variations in the runoff and sediment loads.
Sustainability 13 00443 g007
Figure 8. Change trends of rainfall and air temperature in the Malian River basin from 1960 to 2016.
Sustainability 13 00443 g008
Figure 9. Characteristics variation of annual vegetation coverage in the Malian River basin from 1982 to 2015.
Sustainability 13 00443 g009
Table 1. The observation data from hydrological stations in the Malian River basin.
River NameHydrological StationControl Area (km2)Data SeriesAnnual RunoffAnnual Sediment Load
Average (108 m3)Standard DeviationAverage (108 t)Standard Deviation
1Malian streamHongde46401960–20160.5790.3950.3590.289
2Malian streamQingyang10,6031960–20161.9120.8520.7280.528
3Malian streamYuluoping19,0191960–20164.1271.5461.1190.765
4RouyuanchuanYuele5281960–20160.1600.0850.0380.040
5HeshuichuanBanqiao8071960–20160.1410.0720.0140.020
6DongchuanJiaqiao29881980–20160.7600.3250.1650.136
Table 2. Trend analysis of the runoffs and sediment loads in the Malian River basin.
Hydrologic StationRunoff (108 m3)Sediment Load (108 t)
M–K TestLinear TrendM–K TestLinear Trend
Hongde−1.449 ns0.198 ns−0.912 ns0.352 ns
Qingyang−1.154 ns0.260 ns−1.798 ns0.131 ns
Yuluoping−2.442 *0.027 *−1.918 ns0.099 ns
Yuele−0.872 ns0.548 ns−1.248 ns0.449 ns
Banqiao−2.099 *0.031 *−0.040 ns0.354 ns
Jiaqiao−0.779 ns0.470 ns−1.207 ns0.426 ns
Note: ns means not significant; * means a reliability level of 0.05.
Table 3. Contribution rates of rainfall and human activities before and after changing the point year.
YearRunoff (108 m3)Runoff reduction (108 m3)RainfallHuman activities
MeasuredCalculatedValuePercentageValuePercentageValuePercentage
1960–20024.42
2003–20163.214.31.2127.30%0.129.30%1.0990.70%
YearSediment load (108 t)Sediment load reduction (108 t)RainfallHuman activities
MeasuredCalculatedValuePercentageValuePercentageValuePercentage
1960–20021.27
2003–20160.651.140.6249.10%0.1321.30%0.4978.70%
Table 4. Summary of the impacts of climate and human activity on runoff and sediment loads in the Yellow River.
ReferencesBasinPeriodsChange PointMethodologyContribution to Runoff (%)
ClimateHuman Activities
[52]Yellow River basin1950–20081969Runoff coefficient1783
[43]Wudinghe basin1961–20131970Double-mass curve---85.2–90.3 *
[49]Wei River1932–20081968Double-mass curve17.882.8
[50]Yellow River basin2000–2008---Runoff coefficient4555
[48]Yanhe River1952–20111979Double-mass curve34.2965.71
BasinPeriodsChange PointMethodologyContribution to Sediment Load (%)
ClimateHuman Activities
[51]Yellow River basin1950–20051968Linear regression3070
[53]Middle reaches of the Yellow River1962–20091979Linear regression44.655.4
[49]Wei River basin1932–20081981Double-mass curve4.4495.56
[50]Yellow River basin2000–2008---Sediment-load coefficient5654
[48]Yanhe River1952–20111979Double-mass curve34.2965.71
Note: * means the impact of soil and water conservation.
Publisher’s Note: MDPI stays neutral with regard to jurisdictional claims in published maps and institutional affiliations.

