Application of Optical Remote Sensing in Rubber Plantations: A Systematic Review


Abstract
:
1. Introduction
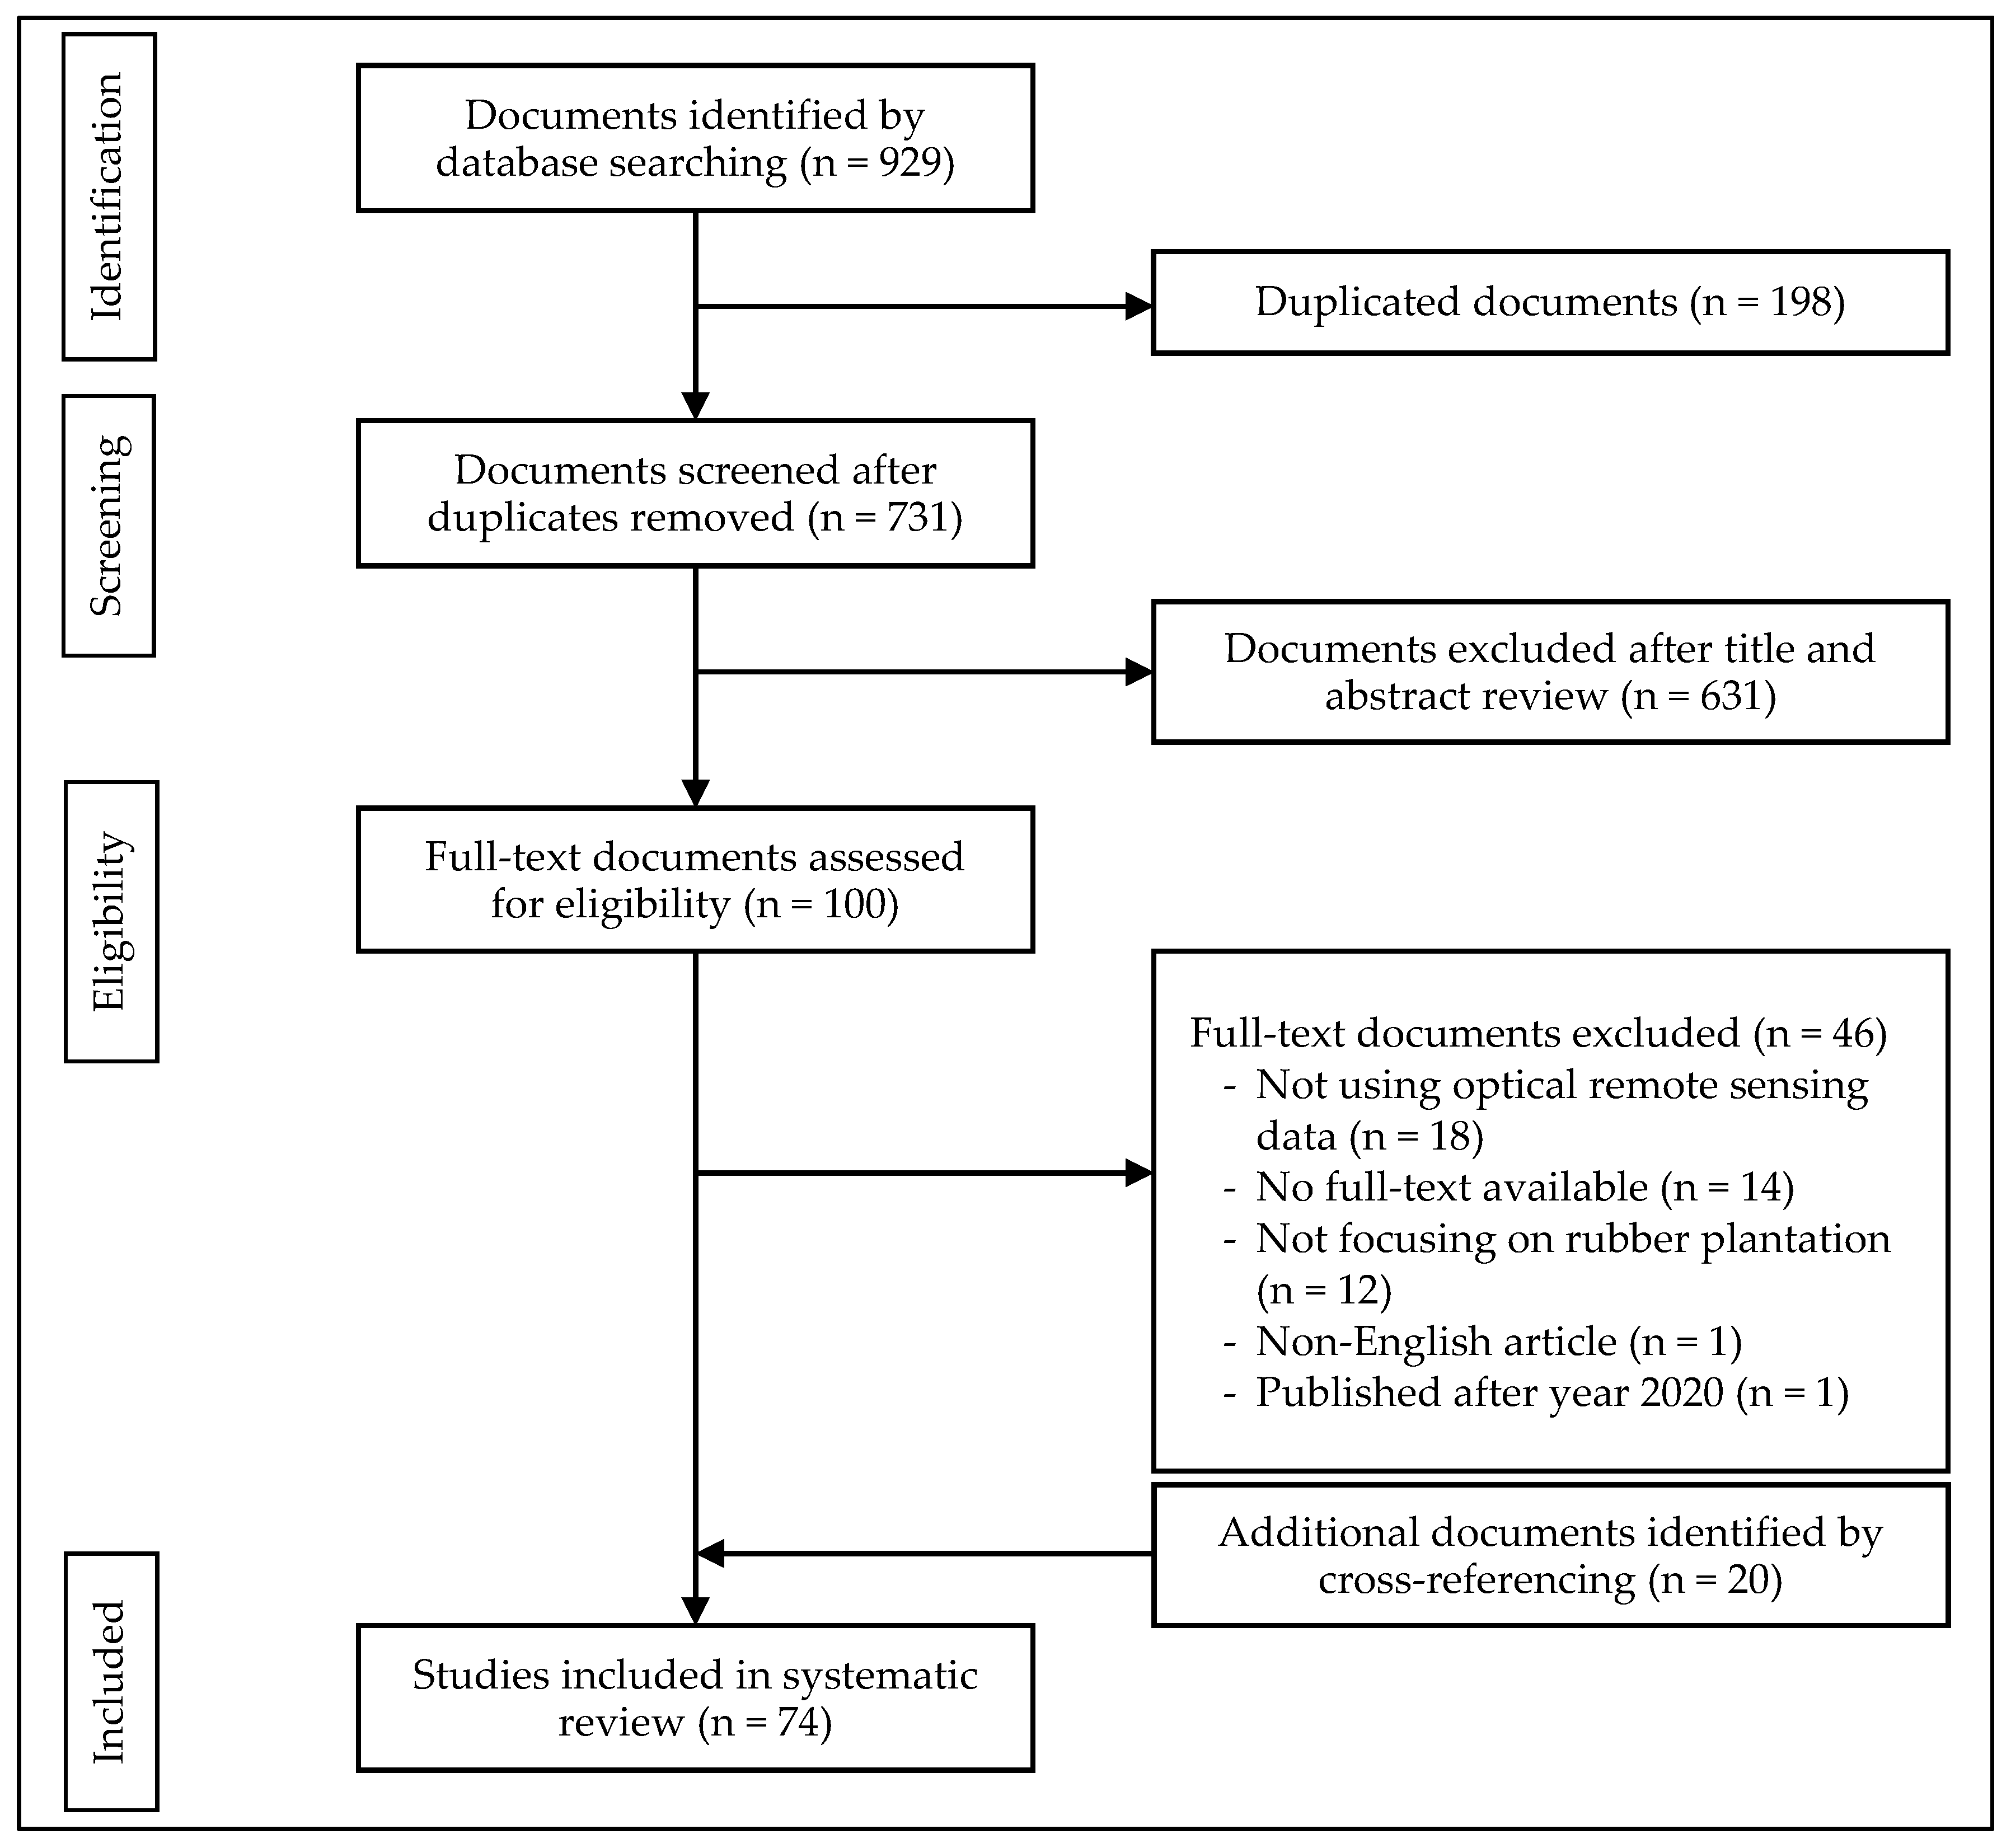
2. Methods
2.1. Inclusion and Exclusion Criteria
2.2. Search Methodology
2.3. Additional Search
3. Descriptive Analysis
3.1. Document Details
3.2. Study Setting
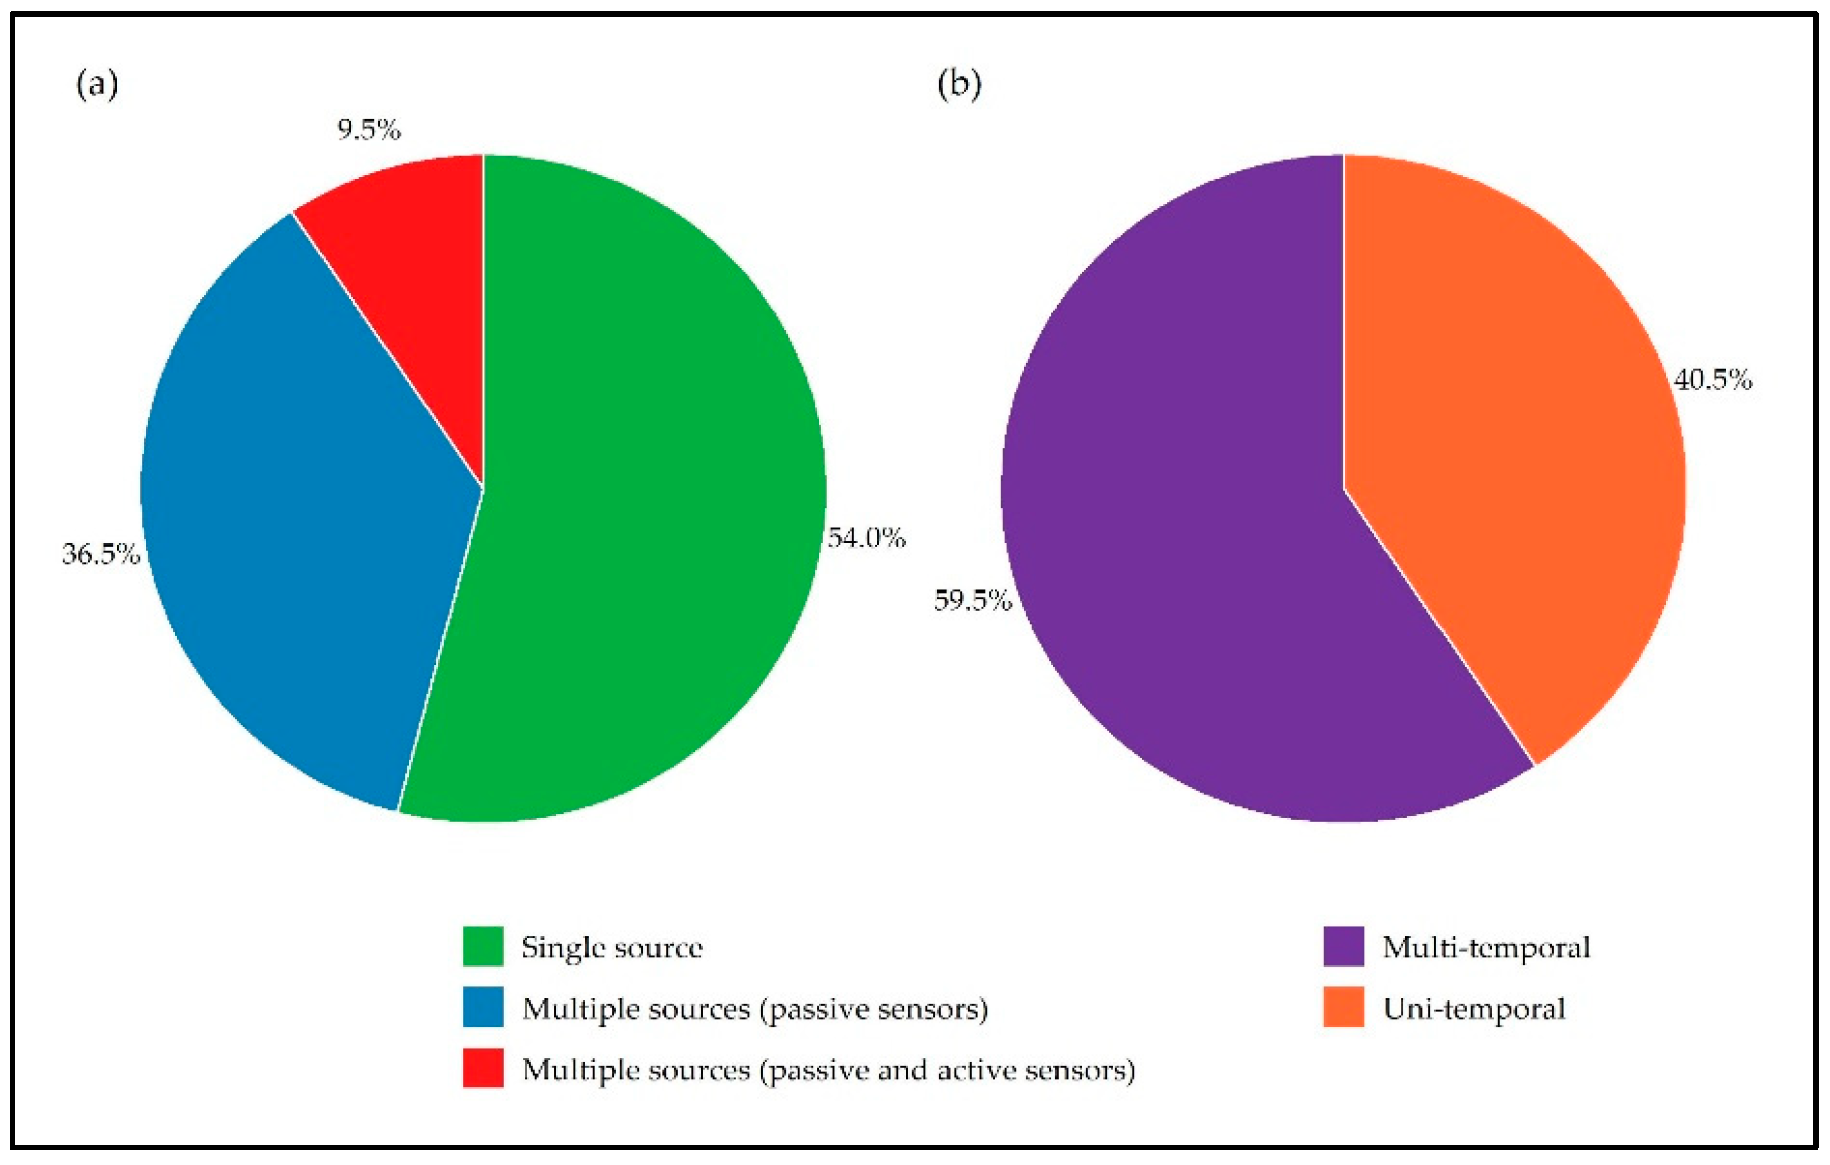
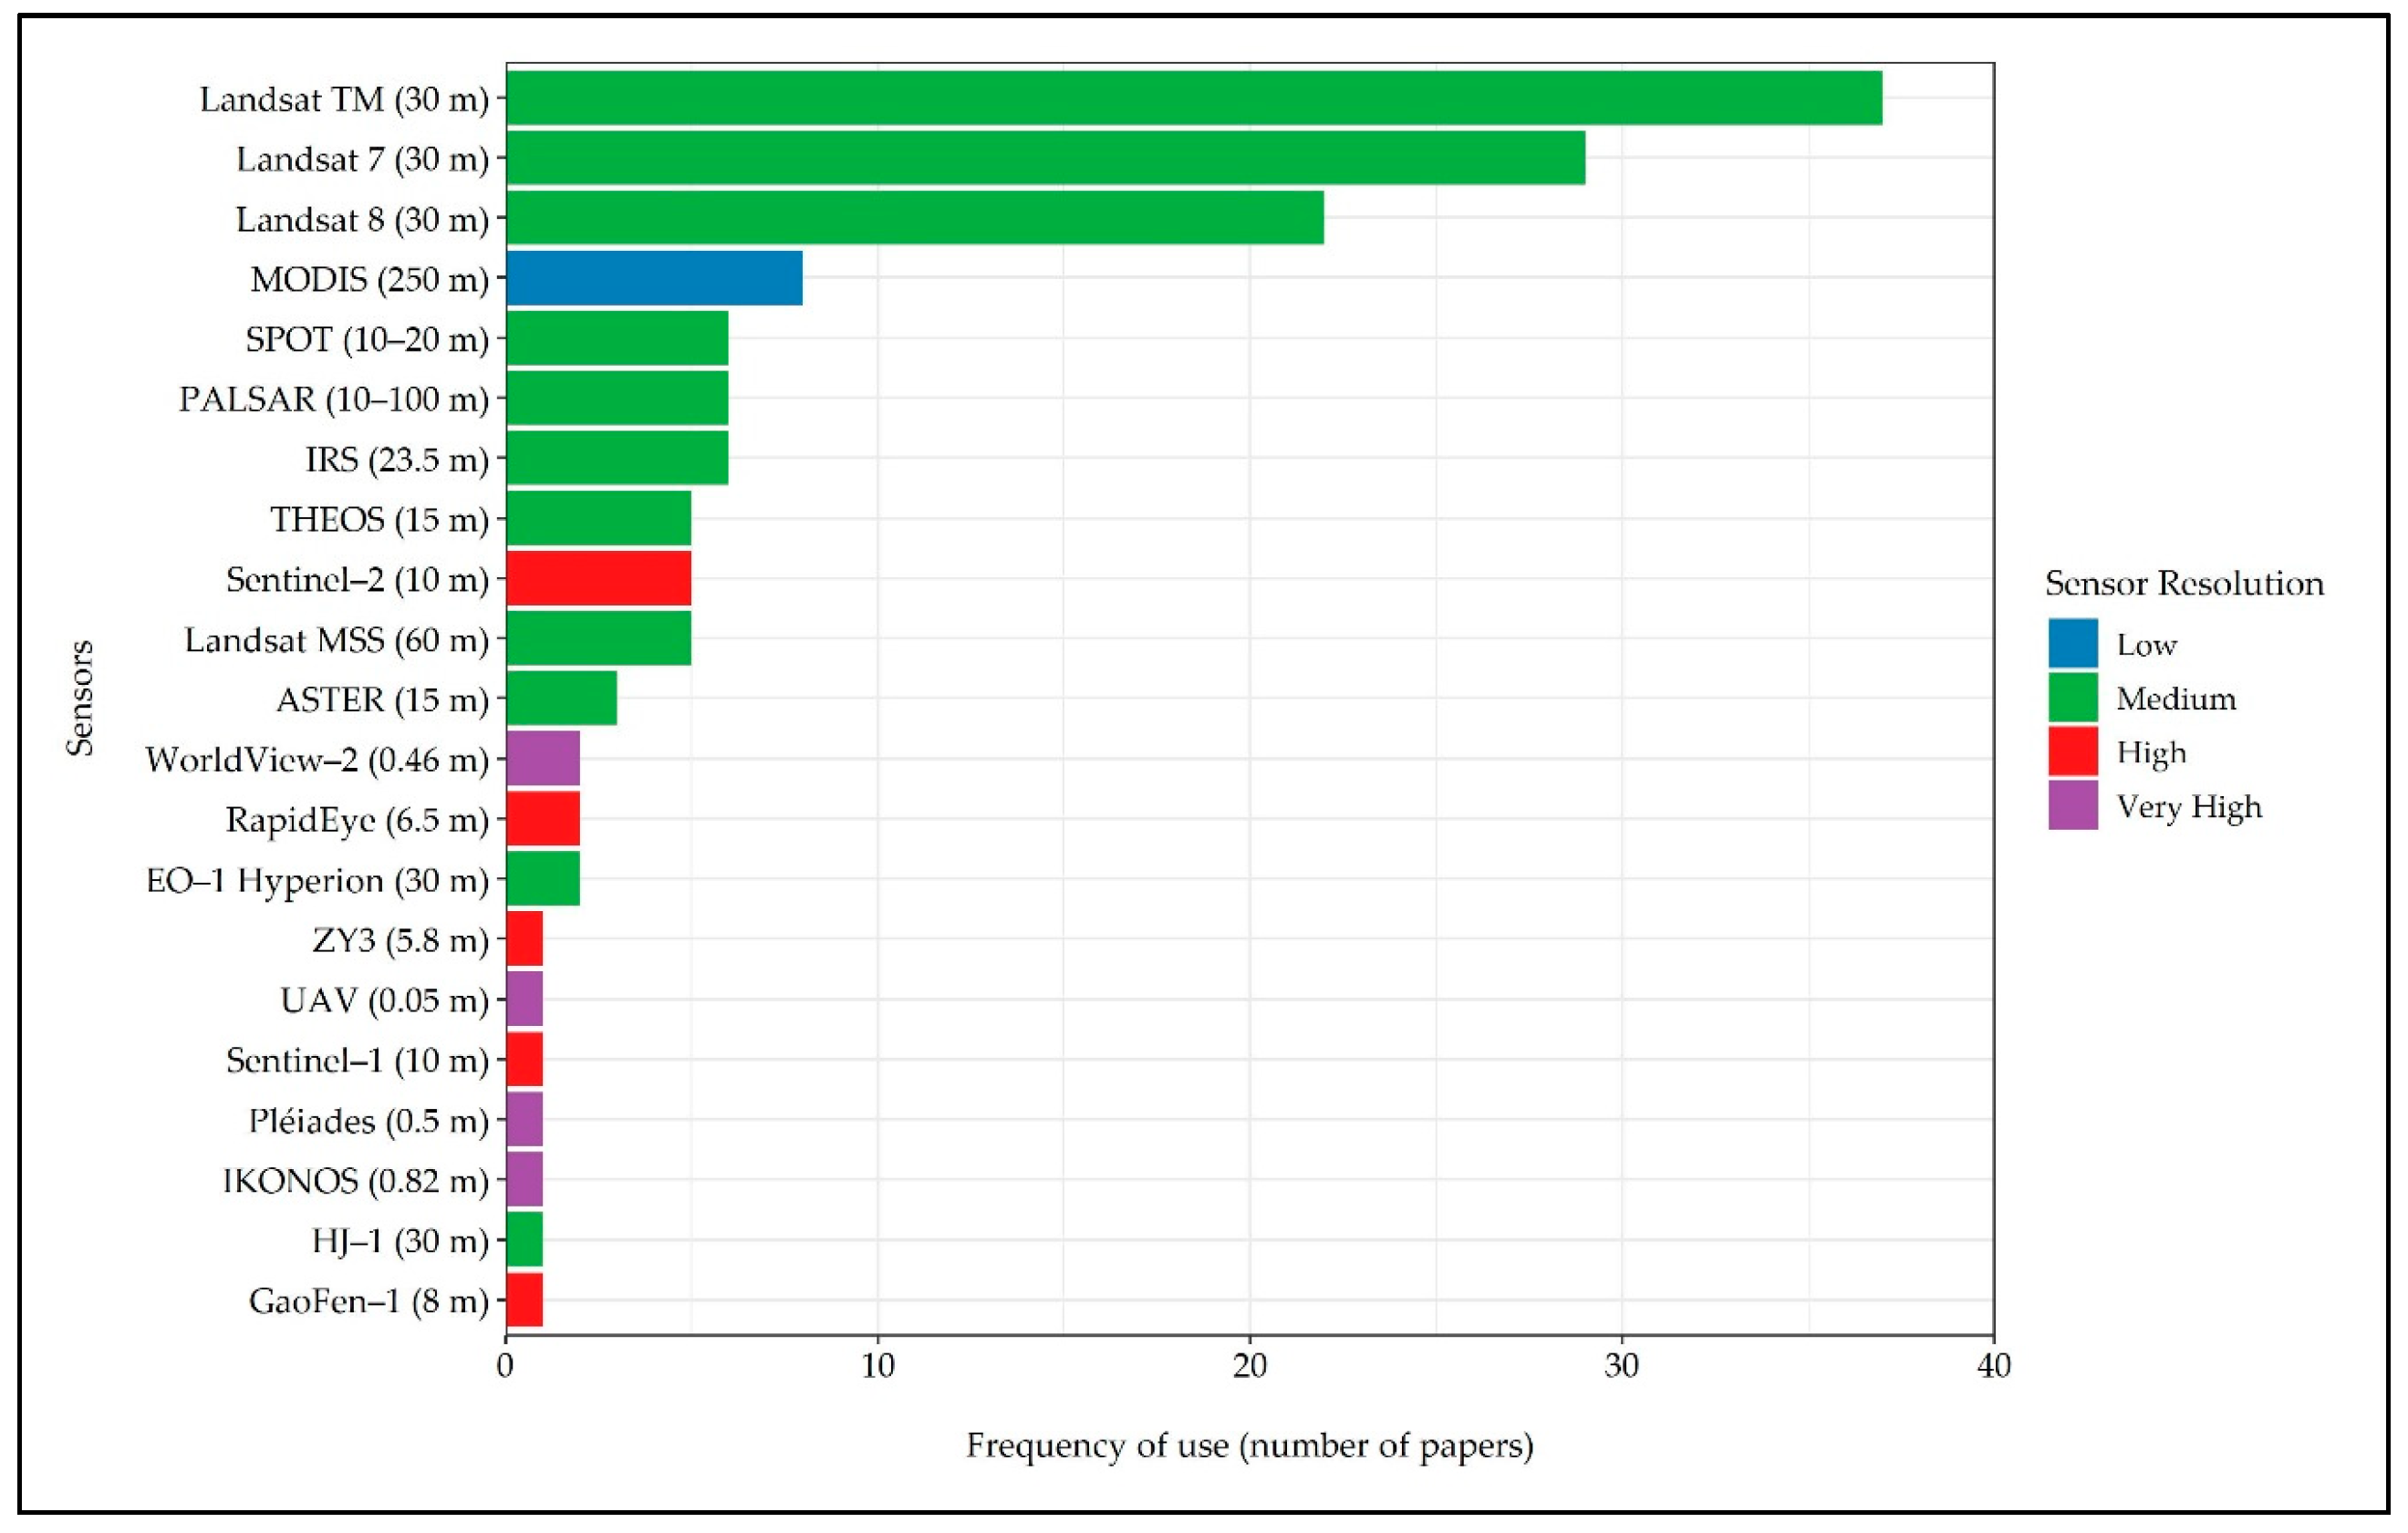
3.3. Remote Sensing Data
3.4. Accuracy Assessment
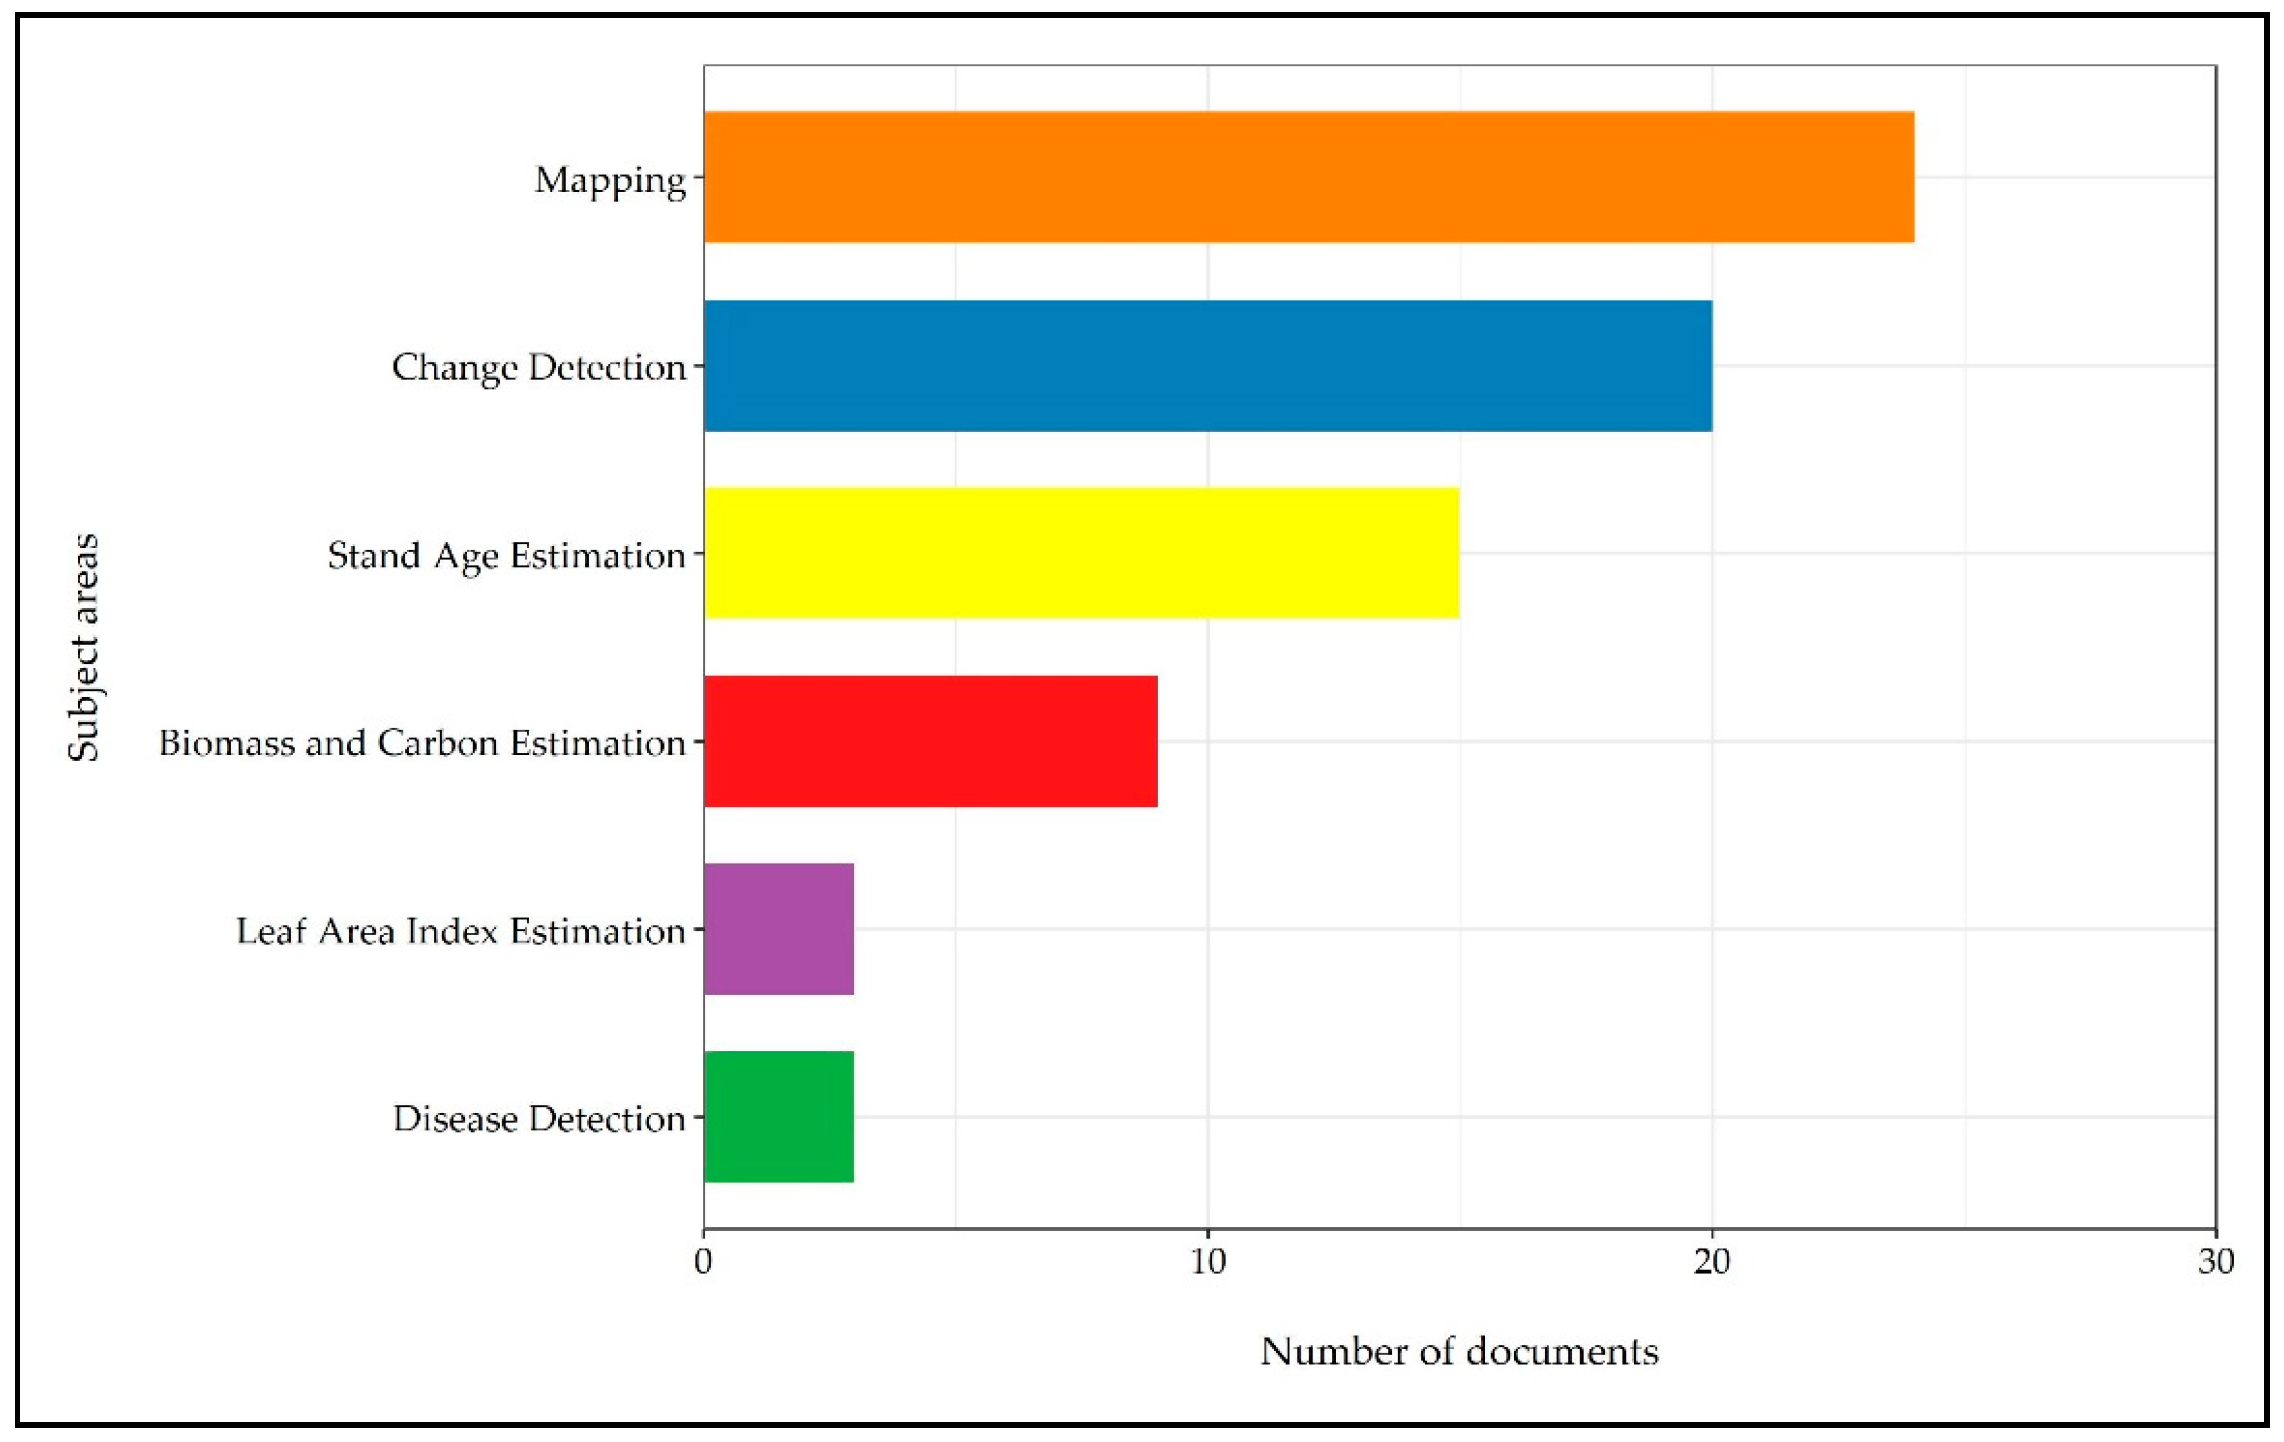
3.5. Application Categories
4. Remote Sensing Application in the Study of Rubber Plantations
4.1. Plantation Mapping
4.2. Change Detection
4.3. Stand Age Estimation
4.4. Biomass and Carbon Estimation
4.5. Leaf Area Index Estimation
4.6. Disease Detection
5. Discussion
5.1. Benefits
5.2. Challenges
5.3. Future Potentials
5.3.1. Use of Higher Resolution Data
5.3.2. Algorithm Enhancements
5.3.3. Use of Emerging Processing Platforms
5.3.4. Application in Less Studied Subject Areas
6. Conclusions
- The number of studies keeps increasing partly due to the availability of remote sensing data over the years and the rubber boom in the mid-2000s. The majority of the selected studies are focused at a local scale with the most common study locations in Xishuangbanna and Hainan Island, China. Fewer studies were conducted in Southeast Asian countries, although there are a lot of major rubber producing countries in the region.
- More studies at the regional scale using remote sensing should also be undertaken. It has now become more feasible given the enhancement of big data algorithms and emerging processing platforms.
- Subject areas of mapping, change detection and stand age were extensively explored using several types of remote sensing data and classification algorithms. In contrast, for biomass, carbon and leaf area index estimation, most studies develop models to establish relationships between remote sensing data and these parameters. Examples of model inputs include spectral bands, vegetation indices and tree growth data.
- Disease detection remains understudied but has the potential for growth. The use of remote sensing technology may benefit future studies on recent leaf fall disease outbreaks by examining changes in trees, understanding the spread pattern, estimating affected area, and predicting yield loss. The findings give greater control and support in monitoring and managing rubber plantations, especially for millions of smallholders.
- The unique and outstanding rubber phenology characteristics have helped to delineate rubber from other land cover types and reduce misclassification error. Several recent documents have exploited this characteristic while performing classification, and some have developed phenology-based algorithm.
- Expectedly, Landsat is the most frequently used optical sensor in the selected studies of this review. This is due to its long-term and free-cost availability. Future studies are suggested to consider using freely available high-resolution remote sensing data (e.g Sentinel-2, PlanetScope) and data fusion from multiple sensors with different resolutions in the study of monitoring rubber. Fewer studies have employed these types of data and demonstrated better accuracy than single-source remote sensing data studies.
Author Contributions
Funding
Institutional Review Board Statement
Informed Consent Statement
Data Availability Statement
Acknowledgments
Conflicts of Interest
Appendix A

| No | Authors | Ref | Year | Country | Sensor | Sensor Resolution | Spatial Extent | Temporal Scale | Subject Area | Approach | Reference Data | Accuracy Method | ||||
|---|---|---|---|---|---|---|---|---|---|---|---|---|---|---|---|---|
| Ground Data | High Resolution Image | Others | Error Matrix | Kappa | R2/RMSE | |||||||||||
| 1 | Rao et al. | [38] | 2003 | India | IRS | Medium | Local | Multi-temporal | Mapping | Land cover | Y | N | N | N | N | N |
| 2 | Suratman | [18] | 2003 | Malaysia | Landsat TM | Medium | Local | Uni-temporal | Mapping | Land cover | N | N | Y | Y | Y | N |
| 3 | Suratman et al. | [67] | 2005 | Malaysia | Landsat TM | Medium | Local | Uni-temporal | Mapping | Statistical model | Y | N | Y | Y | N | N |
| 4 | Meti et al. | [65] | 2008 | India | LISS III | Medium | Local | Uni-temporal | Mapping | Land cover | N | N | N | Y | Y | N |
| 5 | Li & Fox | [68] | 2011 | Thailand, Laos, China | ASTER | Medium | Regional | Uni-temporal | Mapping | Land cover | Y | Y | N | Y | Y | Y |
| 6 | Li & Fox | [36] | 2012 | China, Myanmar, Laos, Thailand, Vietnam, Cambodia | MODIS | Low | Regional | Multi-temporal | Mapping | Land cover | N | Y | Y | Y | Y | N |
| 7 | Dong et al. | [72] | 2013 | China | Landsat TM, Landsat 7, PALSAR | Low + Medium | Local | Multi-temporal | Mapping | Phenology-based Algorithm | Y | Y | Y | Y | Y | N |
| 8 | Shidiq et al. | [69] | 2014 | Malaysia | Landsat TM | Medium | Local | Multi-temporal | Mapping | Land cover | N | N | Y | Y | Y | N |
| 9 | Dai et al. | [73] | 2014 | China | Landsat TM | Medium | Local | Uni-temporal | Mapping | Land cover | Y | Y | N | Y | Y | N |
| 10 | P. Li et al. | [74] | 2015 | China | Landsat TM, Landsat 7, Landsat 8 | Medium | Local | Multi-temporal | Mapping | Phenology-based Algorithm | Y | Y | N | Y | Y | N |
| 11 | Fan et al. | [39] | 2015 | China | Landsat 8 | Medium | Local | Multi-temporal | Mapping | Phenology-based Algorithm | Y | Y | N | Y | Y | N |
| 12 | Abd Razak et al. | [59] | 2017 | Malaysia | Landsat TM, Landsat 7, Landsat 8 | Medium | Local | Multi-temporal | Mapping | Land cover | N | Y | N | Y | Y | N |
| 13 | Dibs et al. | [29] | 2017 | Malaysia | SPOT-5 | Medium | Local | Uni-temporal | Mapping | Land cover | Y | N | N | Y | Y | N |
| 14 | Pradeep et al. | [75] | 2017 | India | IRS | Medium | Local | Uni-temporal | Mapping | Land cover | Y | N | Y | Y | N | N |
| 15 | Shidiq et al. | [70] | 2017 | Malaysia | Landsat 5, PALSAR | Medium | Local | Uni-temporal | Mapping | Land cover | Y | N | N | Y | Y | N |
| 16 | Han et al. | [58] | 2018 | China | Landsat 8 | Medium | Local | Multi-temporal | Mapping | Land cover | Y | Y | N | Y | Y | N |
| 17 | Zhai et al. | [76] | 2018 | China | MODIS, Landsat 5, Landsat 7, PALSAR | Low+ Medium | Local | Multi-temporal | Mapping | Phenology-based Algorithm | Y | Y | N | Y | Y | N |
| 18 | Gao et al. | [31] | 2019 | China | MODIS, Landsat TM, Landsat 7, Landsat 8 | Low + Medium | Local | Multi-temporal | Mapping | Land cover | Y | Y | N | Y | Y | N |
| 19 | Xiao et al. | [77] | 2019 | China | Landsat 8 | Medium | Local | Uni-temporal | Mapping | Phenology-based Algorithm | Y | Y | N | Y | Y | N |
| 20 | Xiao et al. | [78] | 2019 | China | Landsat 8 | Medium | Local | Multi-temporal | Mapping | Phenology-based Algorithm | Y | Y | N | Y | Y | N |
| 21 | Hazir & Muda | [79] | 2020 | Malaysia | Landsat 8 | Medium | Local | Multi-temporal | Mapping | Land cover | Y | N | N | Y | N | N |
| 22 | Xiao et al. | [80] | 2020 | Laos | Sentinel-2 | High | Local | Multi-temporal | Mapping | Phenology-based Algorithm | Y | Y | N | Y | Y | N |
| 23 | Xiao et al. | [81] | 2020 | Laos | Landsat 8 | Medium | Local | Multi-temporal | Mapping | Phenology-based Algorithm | Y | Y | Y | Y | Y | N |
| 24 | Zhang et al. | [71] | 2020 | Thailand | Sentinel-1, Sentinel-2, GaoFen-1, Landsat 8 | Medium + High | Local | Uni-temporal | Mapping | Textural and Spectral Features | Y | Y | N | Y | Y | N |
| 25 | Liu et al. | [89] | 2006 | China | Landsat TM, Landsat 7 | Medium | Local | Multi-temporal | Change Detection | Land use/land cover change | Y | Y | Y | Y | N | N |
| 26 | Suratman | [64] | 2007 | Selangor | Landsat TM | Medium | Local | Multi-temporal | Change Detection | Land use/land cover change | Y | N | Y | N | N | N |
| 27 | H. Li et al. | [94] | 2007 | China | Landsat MSS, Landsat TM, Landsat 7 | Medium | Local | Multi-temporal | Change Detection | Land use/land cover change | Y | N | Y | Y | N | N |
| 28 | Pensuk & Shrestha | [57] | 2008 | Thailand | Landsat MSS, Landsat TM, Landsat 7 | Medium | Local | Multi-temporal | Change Detection | Land use/land cover change | Y | N | N | N | N | N |
| 29 | Vadjunec et al. | [100] | 2009 | Brazil | Landsat TM, Landsat 7 | Medium | Local | Multi-temporal | Change Detection | Land use/land cover change | Y | N | N | Y | N | N |
| 30 | Ekadinata & Vincent | [101] | 2011 | Indonesia | Landsat MSS, Landsat TM, Landsat 7 | Medium | Local | Multi-temporal | Change Detection | Land use/land cover change | Y | N | N | Y | N | N |
| 31 | Mongkolsawat & Putklang | [19] | 2012 | Thailand | THEOS | Medium | Local | Multi-temporal | Change Detection | Land use/land cover change | Y | N | N | Y | Y | N |
| 32 | Xiaona Liu et al. | [32] | 2013 | China, Laos, Myanmar | Landsat MSS, Landsat TM, Landsat 7, MODIS | Low+ Medium | Regional | Multi-temporal | Change Detection | Land use/land cover change | Y | N | Y | Y | N | N |
| 33 | Phompila et al. | [103] | 2014 | Laos | Landsat 7 | Medium | Local | Multi-temporal | Change Detection | Land use/land cover change | Y | Y | N | Y | N | N |
| 34 | Grogan et al. | [88] | 2015 | Cambodia, Vietnam | Landsat TM, Landsat 7, MODIS | Low + Medium | Regional | Multi-temporal | Change Detection | Land use/land cover change | N | Y | N | Y | N | N |
| 35 | H. Chen et al. | [85] | 2016 | China | Landsat TM, Landsat 7, RapidEye | Medium + High | Local | Multi-temporal | Change Detection | Land use/land cover change | Y | Y | N | Y | Y | N |
| 36 | X. Liu et al. | [97] | 2016 | Laos, China | Landsat TM, Landsat 7 | Medium | Regional | Multi-temporal | Change Detection | Land use/land cover change | Y | N | N | Y | N | N |
| 37 | Sun et al. | [62] | 2017 | China | Landsat TM, Landsat 7, Landsat 8 | Medium | Local | Multi-temporal | Change Detection | Land use/land cover change | Y | Y | N | Y | Y | N |
| 38 | Ye et al. | [99] | 2018 | Cambodia | Landsat TM, Landsat 7, Landsat 8 | Medium | Local | Multi-temporal | Change Detection | Land use/land cover change | N | Y | N | Y | Y | N |
| 39 | Chakraborty et al. | [63] | 2018 | India | LISS III | Medium | Local | Multi-temporal | Change Detection | Land use/land cover change | Y | N | N | N | N | N |
| 40 | Özdoğan et al. | [96] | 2018 | Laos | Landsat TM, Landsat 7 | Medium | Local | Multi-temporal | Change Detection | Land use/land cover change | Y | N | N | Y | N | N |
| 41 | Kou et al. | [98] | 2018 | China | MODIS, Landsat 5, Landsat 7, PALSAR | Medium | Local | Multi-temporal | Change Detection | Land use/land cover change | Y | Y | Y | Y | N | N |
| 42 | Grogan et al. | [87] | 2019 | Cambodia | MODIS, Landsat TM, Landsat 7, Landsat8, Sentinel-2 | Low+ Medium + High | Local | Multi-temporal | Change Detection | Land use/land cover change | N | Y | N | Y | N | N |
| 43 | Xiao et al. | [53] | 2019 | China | Landsat TM, Landsat 7, Landsat 8 | Medium | Local | Multi-temporal | Change Detection | Land use/land cover change | Y | Y | N | Y | Y | N |
| 44 | Xiao et al. | [84] | 2019 | China | Landsat TM, Landsat 7, Landsat 8 | Medium | Local | Multi-temporal | Change Detection | Land use/land cover change | Y | Y | Y | Y | Y | N |
| 45 | Suratman et al. | [108] | 2004 | Malaysia | Landsat TM | Medium | Local | Uni-temporal | Stand Age | Statistical Model | Y | N | Y | Y | N | Y |
| 46 | Mongkolsawat et al. | [112] | 2010 | Thailand | SPOT-2, SPOT-4, SPOT-5, THEOS | Medium | Local | Uni-temporal | Stand Age | Image Classification | Y | N | Y | Y | Y | N |
| 47 | Li & Fox | [113] | 2011 | Thailand | Landsat TM | Medium | Local | Uni-temporal | Stand Age | Image Classification | N | N | Y | N | N | Y |
| 48 | Putklang et al. | [86] | 2012 | Thailand | THEOS | Medium | Local | Uni-temporal | Stand Age | Image Classification | Y | N | N | N | Y | N |
| 49 | Chen et al. | [110] | 2012 | China | Landsat TM | Medium | Local | Uni-temporal | Stand Age | Statistical Model | N | N | N | N | N | Y |
| 50 | Koedsin & Huete | [114] | 2015 | Thailand | Pléiades | Very High | Local | Uni-temporal | Stand Age | Image Classification | N | Y | Y | Y | Y | N |
| 51 | Dibs & Mansor | [115] | 2015 | Malaysia | SPOT-5 | Medium | Local | Uni-temporal | Stand Age | Image Classification | Y | N | Y | Y | Y | N |
| 52 | Kou et al. | [119] | 2015 | China | Landsat TM, Landsat 7, PALSAR | Medium | Local | Multi-temporal | Stand Age | Land Use Land Cover (LULC) Detection | Y | Y | N | Y | Y | N |
| 53 | Shidiq & Ismail | [109] | 2016 | Malaysia | Landsat 8 | Medium | Local | Uni-temporal | Stand Age | Statistical Model | Y | N | N | N | N | Y |
| 54 | Beckschäfer | [117] | 2017 | China | Landsat TM, Landsat 7 | Medium | Local | Multi-temporal | Stand Age | Land Use Land Cover (LULC) Detection | N | Y | N | Y | N | N |
| 55 | Kaewplang & Srihanu | [55] | 2017 | Thailand | EO-1 Hyperion | High | Local | Uni-temporal | Stand Age | Statistical Model | Y | N | N | N | N | Y |
| 56 | G. Chen et al. | [111] | 2018 | China, Myanmar, Laos | Landsat TM, Landsat 7, Landsat 8 | Medium | Regional | Multi-temporal | Stand Age | Statistical Model | N | Y | N | Y | Y | N |
| 57 | Chen et 1l. | [107] | 2018 | China | Landsat TM, Landsat 7, Landsat 8, PALSAR | Medium | Local | Multi-temporal | Stand Age | Land Use Land Cover (LULC) Detection | Y | Y | N | Y | N | N |
| 58 | Xiao et al. | [118] | 2019 | China | Landsat TM, Landsat 7, Landsat 8 | Medium | Local | Multi-temporal | Stand Age | Land Use Land Cover (LULC) Detection | Y | N | N | Y | Y | N |
| 59 | Somching et al. | [116] | 2020 | Thailand | Landsat TM, Landsat 7, Landsat 8 | Medium | Local | Multi-temporal | Stand Age | Image Classification | N | Y | Y | Y | N | N |
| 60 | Suratman et al. | [49] | 2002 | Malaysia | Landsat TM | Medium | Local | Uni-temporal | Biomass and Carbon | Statistical model | Y | N | N | Y | N | Y |
| 61 | Charoenjit et al. | [127] | 2012 | Thailand | THEOS | Medium | Local | Uni-temporal | Biomass and Carbon | Tree Allometry | Y | N | N | Y | Y | N |
| 62 | Charoenjit et al. | [128] | 2015 | Thailand | THEOS | Medium | Local | Uni-temporal | Biomass and Carbon | Tree Allometry | Y | N | Y | N | N | Y |
| 63 | Yasen & Koedsin | [129] | 2015 | Thailand | Worlview-2 | Very High | Local | Uni-temporal | Biomass and Carbon | Tree Allometry | Y | N | N | N | N | Y |
| 64 | Yang et al. | [106] | 2016 | China | IKONOS, SPOT, RapidEye, Landsat | Medium + High + Very High | Local | Multi-temporal | Biomass and Carbon | Tree Allometry | Y | N | N | N | N | Y |
| 65 | Anurogo et al. | [130] | 2018 | Indonesia | ASTER | Medium | Local | Uni-temporal | Biomass and Carbon | Tree Allometry | Y | N | N | N | N | Y |
| 66 | Anurogo et al. | [131] | 2018 | Indonesia | ASTER | Medium | Local | Uni-temporal | Biomass and Carbon | Tree Allometry | Y | N | N | Y | N | Y |
| 67 | Pratama & Danoedoro | [132] | 2020 | Indonesia | Sentinel-2 | High | Local | Uni-temporal | Biomass and Carbon | Tree Allometry | Y | N | Y | N | N | Y |
| 68 | Chen et al. | [133] | 2020 | China | Landsat 7, Landsat 8, Sentinel-2 | Medium + High | Local | Uni-temporal | Biomass and Carbon | Tree Allometry | Y | N | N | N | N | Y |
| 69 | Kaewplang & Vaiphasa | [56] | 2014 | Thailand | EO-1 Hyperion | Medium | Local | Uni-temporal | Leaf Area Index | Regression model | Y | N | N | N | N | Y |
| 70 | Chen et al. | [33] | 2015 | China | HJ-1, ZY3 | Medium + High | Local | Multi-temporal | Leaf Area Index | Regression model | Y | N | N | N | N | Y |
| 71 | Koedsin & Yasen | [139] | 2016 | Thailand | WorldView-2 | Very High | Local | Uni-temporal | Leaf Area Index | Regression model | Y | N | N | Y | N | Y |
| 72 | Ranganathet al. | [143] | 2004 | India | IRS | Medium | Local | Multi-temporal | Disease | Satellite platform | Y | N | N | Y | N | N |
| 73 | Pradeep et al. | [15] | 2014 | India | IRS, MODIS | Low + Medium | Local | Multi-temporal | Disease | Satellite platform | Y | N | N | Y | N | N |
| 74 | Mohd Ali et al. | [54] | 2018 | Malaysia | Drone | Very High | Local | Uni-temporal | Disease | Unmanned Aerial Vehicle (UAV) | Y | N | N | N | N | N |
References
- Sanjeeva Rao, P.; Saraswathyamma, C.K.; Sethuraj, M.R. Studies on the relationship between yield and meteorological parameters of para rubber tree (Hevea brasiliensis). Agric. For. Meteorol. 1998, 90, 235–245. [Google Scholar] [CrossRef]
- Food and Agriculture Organization of the United Nations (FAO) FAOSTAT Statistical Database 2020. Available online: http://www.fao.org/faostat/en/?#data/QC (accessed on 11 November 2020).
- Van Beilen, J.B.; Poirier, Y. Establishment of new crops for the production of natural rubber. Trends Biotechnol. 2007, 25, 522–529. [Google Scholar] [CrossRef]
- Carr, M.K.V. The water relations of rubber (hevea brasiliensis): A review. Exp. Agric. 2012, 48, 176–193. [Google Scholar] [CrossRef]
- Nath, A.J.; Brahma, B.; Das, A.K. Rubber Plantations and Carbon Management; Apple Academic Press: Palm Bay, FL, USA, 2019; ISBN 9780429659867. [Google Scholar]
- Ahrends, A.; Hollingsworth, P.M.; Ziegler, A.D.; Fox, J.M.; Chen, H.; Su, Y.; Xu, J. Current trends of rubber plantation expansion may threaten biodiversity and livelihoods. Glob. Environ. Chang. 2015, 34, 48–58. [Google Scholar] [CrossRef]
- Fox, J.; Castella, J.C. Expansion of rubber (Hevea brasiliensis) in Mainland Southeast Asia: What are the prospects for smallholders? J. Peasant Stud. 2013, 40, 155–170. [Google Scholar] [CrossRef]
- Promme, P.; Kuwornu, J.K.M.; Jourdain, D.; Shivakoti, G.P.; Soni, P. Factors influencing rubber marketing by smallholder farmers in Thailand. Dev. Pract. 2017, 27, 865–879. [Google Scholar] [CrossRef]
- Barlow, C.; Jayasuriya, S.K. Problems of Investment for Technological Advance: The Case of Indonesian Rubber Smallholders. J. Agric. Econ. 1984, 35, 85–95. [Google Scholar] [CrossRef]
- Douangsavanh, L.; Noble, A.; Thammavong, B. Meeting Regional and Global Demands for Rubber: A Key to Poverty Alleviation in Lao PDR? The Sustainable Mekong Research Network (Sumernet): Bangkok, Thailand, 2008. [Google Scholar]
- Manivong, R.; Cramb, R.A. Economics of Smallholder Rubber Production in Northern Laos. Agrofor. Syst. 2008, 74, 113. [Google Scholar] [CrossRef]
- Viswanathan, P.K. Emerging smallholder rubber farming systems in India and Thailand: A comparative economic analysis. Asian, J. Agric. Dev. 2008, 5, 2. [Google Scholar]
- Konyeha, S.; Imouokhome, F.A. Development of a Web Based Expert System for Rubber Crop Disease Diagnosis and Management. J. Sci. Res. 2018, 10, 239–248. [Google Scholar] [CrossRef] [Green Version]
- Manju, M.J.; Benagi, V.I.; Shankarappa, T.H.; Vinod, K.K.; Kuruvilla Jacob, C.; Jacob, C.K. Major Diseases of Hevea brasiliensis in Rubber Growing Regions of South India. Environ. Ecol. 2015, 33, 1299–1302. [Google Scholar]
- Pradeep, B.; Meti, S.; James, J. Satellite based remote sensing technique as a tool for real time monitoring of leaf retention in natural rubber plantations affected by abnormal leaf fall disease. Int. Arch. Photogramm. Remote Sens. Spat. Inf. Sci. - ISPRS Arch. 2014, XL–8, 885–889. [Google Scholar] [CrossRef] [Green Version]
- Beilen, J.V.; Poirier, Y.; Orts, B. Alternative Sources of Natural Rubber; Outputs from the EPOBIO Project; CPL Press: Berks, UK, 2006; ISBN 9781872691084. [Google Scholar]
- Wastie, R.L. Diseases of rubber and their control. PANS Pest Artic. News Summ. 1975, 21, 268–288. [Google Scholar] [CrossRef]
- Suratman, M.N. Applicability of Landsat TM Data for Inventorying and Monitoring Rubber (Hevea Brasiliensis) Plantations in Selangor, Malaysia: Linkages to Policies. Ph.D. Thesis, The University of British Columbia, Vancouver, BC, Canada, 2003. [Google Scholar]
- Mongkolsawat, C.; Putklang, W. Rubber Tree Expansion in Forest Reserve and Paddy Field Across the Greater Mekong Sub-Region, Northeast Thailand Based on Remotely Sensed Imagery. In Proceedings of the The 33rd Asian Conference on Remote Sensing, Pattaya, Thailand, 26–30 November 2012; Volume 1, pp. 214–219. [Google Scholar]
- Majumder, A.; Datta, S. Do Extensive Rubber Plantation Influences Local Environment? A Case Study from Tripura, Northeast India. Curr. World Environ. 2014, 9, 768–779. [Google Scholar] [CrossRef]
- Mann, C.C. Addicted to Rubber. Science (80-. ) 2009, 325, 564–566. [Google Scholar] [CrossRef]
- Qiu, J. Where the rubber meets the garden. Nature 2009, 457, 246–247. [Google Scholar] [CrossRef] [Green Version]
- Roy, M.M.; Saha, S.; Roy, M.M. ECOLOGICAL IMPACT OF RUBBER PLANTATIONS: TRIPURA PERSPECTIVE RESEARCH ARTICLE ECOLOGICAL IMPACT OF RUBBER PLANTATIONS: TRIPURA PERSPECTIVE. Int. J. Curr. Res. 2014, 6, 10334–10340. [Google Scholar]
- Ziegler, A.D.; Fox, J.M.; Xu, J. The Rubber Juggernaut. Science (80-. ) 2009, 324, 1024–1025. [Google Scholar] [CrossRef]
- Fukatsu, T.; Nanseki, T. Monitoring system for farming operations with wearable devices utilized sensor networks. Sensors 2009, 9, 6171–6184. [Google Scholar] [CrossRef] [PubMed] [Green Version]
- Mdemu, M.; Kissoly, L.; Bjornlund, H.; Kimaro, E.; Christen, E.W.; van Rooyen, A.; Stirzaker, R.; Ramshaw, P. The role of soil water monitoring tools and agricultural innovation platforms in improving food security and income of farmers in smallholder irrigation schemes in Tanzania. Int. J. Water Resour. Dev. 2020, 36, 1–23. [Google Scholar] [CrossRef]
- Nguyen, T.T.; Hoang, T.D.; Pham, M.T.; Vu, T.T.; Nguyen, T.H.; Huynh, Q.T.; Jo, J. Monitoring agriculture areas with satellite images and deep learning. Appl. Soft Comput. J. 2020, 95, 106565. [Google Scholar] [CrossRef]
- Wang, Y. Plantation Monitoring System Based on Internet of Things. In Proceedings of the 2013 IEEE International Conference on Green Computing and Communications and IEEE Internet of Things and IEEE Cyber, Physical and Social Computing, Beijing, China, 20–23 August 2013. [Google Scholar] [CrossRef]
- Dibs, H.; Idrees, M.O.M.O.; Alsalhin, G.B.A.G.B.A.; Bedawi, G.; Alsalhin, A.; Alsalhin, G.B.A.G.B.A. Hierarchical classification approach for mapping rubber tree growth using per-pixel and object-oriented classifiers with SPOT-5 imagery. Egypt. J. Remote Sens. Sp. Sci. 2017, 20, 21–30. [Google Scholar] [CrossRef]
- Perumal, K.; Bhaskaran, R. Supervised Classification Performance of Multispectral Images. J. Comput. 2010, 2, 124–129. [Google Scholar]
- Gao, S.; Liu, X.; Bo, Y.; Shi, Z.; Zhou, H. Rubber identification based on blended high spatio-temporal resolution optical remote sensing data: A case study in Xishuangbanna. Remote Sens. 2019, 11, 496. [Google Scholar] [CrossRef] [Green Version]
- Liu, X.; Feng, Z.; Jiang, L.; Li, P.; Liao, C.; Yang, Y.; You, Z. Rubber plantation and its relationship with topographical factors in the border region of China, Laos and Myanmar. J. Geogr. Sci. 2013, 23, 1019–1040. [Google Scholar] [CrossRef]
- Chen, B.; Wu, Z.; Wang, J.; Dong, J.; Guan, L.; Chen, J.; Yang, K.; Xie, G.; Chen, J.; Chen, B.; et al. Spatio-temporal prediction of leaf area index of rubber plantation using HJ-1A/1B CCD images and recurrent neural network. ISPRS J. Photogramm. Remote Sens. 2015, 102, 148–160. [Google Scholar] [CrossRef]
- Dauwalter, D.C.; Fesenmyer, K.A.; Bjork, R.; Leasure, D.R.; Wenger, S.J. Satellite and Airborne Remote Sensing Applications for Freshwater Fisheries. Fisheries 2017, 42, 526–537. [Google Scholar] [CrossRef]
- Nguyen, M.D.; Baez-Villanueva, O.M.; Bui, D.D.; Nguyen, P.T.; Ribbe, L. Harmonization of landsat and sentinel 2 for crop monitoring in drought prone areas: Case studies of Ninh Thuan (Vietnam) and Bekaa (Lebanon). Remote Sens. 2020, 12, 281. [Google Scholar] [CrossRef]
- Li, Z.; Fox, J.M. Mapping rubber tree growth in mainland Southeast Asia using time-series MODIS 250 m NDVI and statistical data. Appl. Geogr. 2012, 32, 420–432. [Google Scholar] [CrossRef]
- Liu, X.; Zhiming, F.; Luguang, J.; Jinghua, Z. Rubber Plantations in Xishuangbanna: Remote Sensing Identification and Digital Mapping. Resour. Sci. 2014, 34, 1769–1780. [Google Scholar]
- Rao, D.V.N.; Jose, A.I.; Rao, A.V.R.K. Spectral signature and temporal variation in spectral reflectance: Keys to identify rubber vegetation. In Proceedings of the International Symposium on Remote Sensing, Crete, Greece, 22–25 September 2003; Volume 4879, pp. 114–124. [Google Scholar]
- Fan, H.; Fu, X.; Zhang, Z.; Wu, Q. Phenology-based vegetation index differencing for mapping of rubber plantations using landsat OLI data. Remote Sens. 2015, 7, 6041–6058. [Google Scholar] [CrossRef] [Green Version]
- Association of Natural Rubber Producing Countries (ANRPC). Nat. Rubber Trends Stat. 2020, 12, 1–12.
- Liberati, A.; Altman, D.G.; Tetzlaff, J.; Mulrow, C.; Gøtzsche, P.C.; John, P.A. The PRiSMA statement for reporting systematic reviews and meta-analyses of studies that evaluate healthcare interventions: Explanation and elaboration. Res. Methods Report. 2009. [Google Scholar] [CrossRef] [PubMed] [Green Version]
- Koutsos, T.M.; Menexes, G.C.; Dordas, C.A. An efficient framework for conducting systematic literature reviews in agricultural sciences. Sci. Total Environ. 2019, 682, 106–117. [Google Scholar] [CrossRef]
- Moher, D.; Liberati, A.; Tetzlaff, J.; Altman, D. Preferred reporting items for systematic reviews and meta-analyses: The PRISMA statement... Preferred Reporting Items for Systematic reviews and Meta-Analyses. BMJ Br. Med. J. 2012, 8, b2535. [Google Scholar] [CrossRef] [Green Version]
- Pae, C. Why Systematic Review rather than Narrative Review? Korean Neuropsychiatr. Assoc. 2015, 417, 417–419. [Google Scholar] [CrossRef] [Green Version]
- Tricco, A.C.; Lillie, E.; Zarin, W.; O’Brien, K.; Colquhoun, H.; Kastner, M.; Levac, D.; Ng, C.; Sharpe, J.P.; Wilson, K.; et al. A scoping review on the conduct and reporting of scoping reviews. BMC Med. Res. Methodol. 2016, 16, 1–10. [Google Scholar] [CrossRef] [Green Version]
- Mortensen, M.L.; Adam, G.P.; Trikalinos, T.A.; Kraska, T.; Wallace, B.C. An exploration of crowdsourcing citation screening for systematic reviews. Res. Synth. Methods 2017, 8, 366–386. [Google Scholar] [CrossRef] [Green Version]
- Frampton, G.K.; Livoreil, B.; Petrokofsky, G. Eligibility screening in evidence synthesis of environmental management topics. Environ. Evid. 2017, 6, 1–13. [Google Scholar] [CrossRef] [Green Version]
- Choong, M.K.; Galgani, F.; Dunn, A.G.; Tsafnat, G. Automatic evidence retrieval for systematic reviews. J. Med. Internet Res. 2014, 16, e223. [Google Scholar] [CrossRef] [Green Version]
- Suratman, M.N.; Bull, G.Q.; Leckie, D.G.; LeMay, V.; Marshall, P.L. Modelling attributes of Rubberwood (Hevea brasiliensis) stands using spectral radiance recorded by Landsat Thematic Mapper in Malaysia. In Proceedings of the IEEE International Geoscience and Remote Sensing Symposium, Toronto, ON, Canada, 24–28 June 2002; Volume 4, pp. 2087–2090. [Google Scholar]
- Zhu, Z.; Wulder, M.A.; Roy, D.P.; Woodcock, C.E.; Hansen, M.C.; Radeloff, V.C.; Healey, S.P.; Schaaf, C.; Hostert, P.; Strobl, P.; et al. Benefits of the free and open Landsat data policy. Remote Sens. Environ. 2019, 224, 382–385. [Google Scholar] [CrossRef]
- Makkonen, T.; Williams, A.M. Border region studies: The structure of an ‘offbeat’ field of regional studies. Reg. Stud. Reg. Sci. 2016, 3, 355–367. [Google Scholar] [CrossRef] [Green Version]
- Nair, K.P.P. Rubber (Hevea brasiliensis); Elsevier: London, UK, 2010; ISBN 9780123846778. [Google Scholar]
- Xiao, C.; Li, P.; Feng, Z. How did deciduous rubber plantations expand spatially in China’s Xishuangbanna Dai Autonomous Prefecture during 1991–2016? Photogramm. Eng. Remote Sensing 2019, 85, 687–697. [Google Scholar] [CrossRef]
- Mohd Ali, H.; Rasib, A.W.; Abd Hamid, N.R.; Ghani, Z.A.; Mahsuri, I.; Mohd Yusoff, A.R.; Zainon, O.; Idris, K.M.; Dollah, R. Determination of rubber-tree clones leaf diseases spectral using Unmanned Aerial Vehicle compact sensor. IOP Conf. Ser. Earth Environ. Sci. 2018, 169. [Google Scholar] [CrossRef]
- Kaewplang, S.; Srihanu, N. An Evaluation of EO-1 Hyperion Data for Estimating Age of Rubber Plantation. Mahasarakham Int. J. Eng. Technol. 2017, 3, 5–9. [Google Scholar]
- Kaewplang, S.; Vaiphasa, C. An Evaluation of EO-1 Hyperion Data for Estimating Leaf Area Index of Rubber Plantation. Int. J. Geoinformatics 2014, 10(3), 13–21. [Google Scholar]
- Pensuk, A.; Shrestha, R.P. Effect of Paddy Area Conversion to Rubber Plantation on Rural Livelihoods: A Case Study of Phatthalung Watershed, Southern Thailand. GMSARN Int. J. 2008, 2, 185–190. [Google Scholar]
- Han, P.; Chen, J.; Han, Y.; Yi, L.; Zhang, Y.; Jiang, X. Monitoring rubber plantation distribution on Hainan Island using Landsat OLI imagery. Int. J. Remote Sens. 2018, 39, 2189–2206. [Google Scholar] [CrossRef]
- Abd Razak, J.A.M.; Shariff, A.R.; Ahmad, N.; Sameen, M.I. Mapping rubber trees based on phenological analysis of Landsat time series data-sets. Geocarto Int. 2018, 627–650. [Google Scholar] [CrossRef]
- Min, S.; Huang, J.; Waibel, H.; Yang, X.; Cadisch, G. Rubber Boom, Land Use Change and the Implications for Carbon Balances in Xishuangbanna, Southwest China. Ecol. Econ. 2019, 156, 57–67. [Google Scholar] [CrossRef]
- Chen, B.; Xiao, X.; Ye, H.; Ma, J.; Doughty, R.; Li, X.; Zhao, B.; Wu, Z.; Sun, R.; Dong, J.; et al. Mapping Forest and Their Spatial-Temporal Changes from 2007 to 2015 in Tropical Hainan Island by Integrating ALOS/ALOS-2 L-Band SAR and Landsat Optical Images. IEEE J. Sel. Top. Appl. Earth Obs. Remote Sens. 2018, 11, 852–867. [Google Scholar] [CrossRef]
- Sun, Z.; Leinenkugel, P.; Guo, H.; Huang, C.; Kuenzer, C. Extracting distribution and expansion of rubber plantations from Landsat imagery using the C5.0 decision tree method. J. Appl. Remote Sens. 2017. [Google Scholar] [CrossRef] [Green Version]
- Chakraborty, K.; Sudhakar, S.; Sarma, K.K.K.; Raju, P.L.N.N.; Das, A.K.A.K.; Sudhakar, S.; Chakraborty, K.; Sarma, K.K.K.; Sudhakar, S.; Sarma, K.K.K.; et al. Recognizing the rapid expansion of rubber plantation - A threat to native forest in parts of northeast India. Curr. Sci. 2018, 114, 207–213. [Google Scholar] [CrossRef]
- Suratman, M.N.N. Rubber acreage change detection using landsat TM: Linkages to policies. ASPRS Annu. Conf. 2007 Identifying Geospatial Solut. 2007, 2, 698–709. [Google Scholar]
- Meti, S.; Rao, D.V.K.N.; Nair, N.U.U.; Jacob, J. Distribution of natural rubber cultivation in relation to soil and landscape attributes in India. In Proceedings of the 29th Asian Conference on Remote Sensing 2008, ACRS 2008, Colombo, Sri Lanka, 10–14 November 2008; Volume 1, pp. 7–16. [Google Scholar]
- Lillesand, T.M.; Kiefer, R.W.; Jonathan, W.C. Remote Sensing and Image Interpretation, 7th ed.; John Wiley & Sons, Inc.: New York City, NY, USA, 2015; ISBN 9781118919453. [Google Scholar]
- Suratman, M.N.; Lemay, V.M.; Bull, G.Q.; Donald, G.; Walsworth, N.; Marshall, P.L. Logistic regression modelling of thematic mapper data for rubber ( Hevea brasiliensis ) area mapping. Sci. Lett. 2005, 2, 79–85. [Google Scholar]
- Li, Z.; Fox, J.M. Integrating Mahalanobis typicalities with a neural network for rubber distribution mapping. Remote Sens. Lett. 2011, 2, 157–166. [Google Scholar] [CrossRef]
- Shidiq, I.P.A.; Ismail, M.H.; Kamarudin, N. Initial results of the spatial distribution of rubber trees in Peninsular Malaysia using remotely sensed data for biomass estimate. IOP Conf. Ser. Earth Environ. Sci. 2014, 18. [Google Scholar] [CrossRef] [Green Version]
- Shidiq, I.P.A.; Ismail, M.H.; Ramli, M.F.; Kamarudin, N. Combination of ALOS PALSAR and Landsat 5 imagery for rubber tree mapping. Malaysian For. 2017, 80, 55–72. [Google Scholar]
- Zhang, C.; Huang, C.; Li, H.; Liu, Q.; Li, J.; Bridhikitti, A.; Liu, G. Effect of Textural Features in Remote Sensed Data on Rubber Plantation Extraction at Di ff erent Levels of Spatial Resolution. Forests 2020, 11, 399. [Google Scholar] [CrossRef] [Green Version]
- Dong, J.; Xiao, X.; Chen, B.; Torbick, N.; Jin, C.; Zhang, G.; Biradar, C. Mapping deciduous rubber plantations through integration of PALSAR and multi-temporal Landsat imagery. Remote Sens. Environ. 2013, 134, 392–402. [Google Scholar] [CrossRef]
- Dai, S.P.; Luo, H.X.; Fang, J.H.; Cao, J.H.; Li, H.L.; Li, M.F.; Wang, L.L.; Luo, W. Object-oriented classification of rubber plantations from Landsat satellite imagery. In Proceedings of the 2014 The 3rd International Conference on Agro-Geoinformatics, Agro-Geoinformatics, Beijing, China, 11–14 August 2014. [Google Scholar]
- Li, P.; Zhang, J.; Feng, Z. Mapping rubber tree plantations using a Landsat-based phenological algorithm in Xishuangbanna, southwest China. Remote Sens. Lett. 2015, 6, 49–58. [Google Scholar] [CrossRef]
- Pradeep, B.; Jacob, J.; Anand, S.S.S.; Shebin, S.M.M.; Meti, S.; Annamalainathan, K. Inventory of Rubber Plantations and Identification of Potential Areas For Its Cultivation In Assam Using High Resolution IRS Data. In Proceedings of the 38th Asian Conference on Remote Sensing, Asian Association on Remote Sensing (AARS), New Delhi, India, 23–27 October 2017; pp. 1977–1985. [Google Scholar]
- Zhai, D.; Dong, J.; Cadisch, G.; Wang, M.; Kou, W.; Xu, J.; Xiao, X.; Abbas, S. Comparison of pixel- and object-based approaches in phenology-based rubber plantation mapping in fragmented landscapes. Remote Sens. 2018, 10, 44. [Google Scholar] [CrossRef] [Green Version]
- Xiao, C.; Li, P.; Feng, Z. A renormalized modified normalized burn ratio (RMNBR) index for detecting mature rubber plantations with Landsat-8 OLI in Xishuangbanna, China. Remote Sens. Lett. 2019, 10, 214–223. [Google Scholar] [CrossRef]
- Xiao, C.; Li, P.; Feng, Z.; Lin, Y.; You, Z.; Yang, Y. Mapping rubber plantations in Xishuangbanna, southwest China based on the re-normalization of two Landsat-based vegetation–moisture indices and meteorological data. Geocarto Int. 2019, 0, 1–15. [Google Scholar] [CrossRef]
- Mohd Hazir, M.H.; Tuan Muda, T.M. The viability of remote sensing for extracting rubber smallholding information: A case study in Malaysia. Egypt. J. Remote Sens. Sp. Sci. 2020, 23, 35–47. [Google Scholar] [CrossRef]
- Xiao, C.; Li, P.; Feng, Z.; Liu, Y.; Zhang, X. Sentinel-2 red-edge spectral indices (RESI) suitability for mapping rubber boom in Luang Namtha Province, northern Lao PDR. Int. J. Appl. Earth Obs. Geoinf. 2020, 93, 102176. [Google Scholar] [CrossRef]
- Xiao, C.; Li, P.; Feng, Z.; You, Z.; Jiang, L.; Boudmyxay, K. Is the phenology-based algorithm for mapping deciduous rubber plantations applicable in an emerging region of northern Laos? Adv. Space Res. 2020, 65, 446–457. [Google Scholar] [CrossRef]
- Mishra, S.; Shrivastava, P.; Dhurvey, P. Change Detection Techniques in Remote Sensing: A Review. Int. J. Wirel. Mob. Commun. Ind. Syst. 2017, 4, 1–8. [Google Scholar] [CrossRef]
- Al-doski, J.; Mansor, S.; Shafri, H. Change Detection Process and Techniques. Civ. Environ. Res. 2013, 3, 37–46. [Google Scholar]
- Xiao, C.; Li, P.; Feng, Z. Monitoring annual dynamics of mature rubber plantations in Xishuangbanna during 1987-2018 using Landsat time series data: A multiple normalization approach. Int. J. Appl. Earth Obs. Geoinf. 2019, 77, 30–41. [Google Scholar] [CrossRef]
- Chen, H.; Yi, Z.F.; Schmidt-Vogt, D.; Ahrends, A.; Beckschäfer, P.; Kleinn, C.; Ranjitkar, S.; Xu, J. Pushing the limits: The pattern and dynamics of rubber monoculture expansion in Xishuangbanna, SW China. PLoS ONE 2016, 1–15. [Google Scholar] [CrossRef] [PubMed]
- Putklang, W.; Maneechot, S.; Mongkolsawat, C. Assessing Thaichote satellite data in support of mapping rubber tree plantation in Northeast Thailand. In Proceedings of the 33rd Asian Conference on Remote Sensing, Pattaya, Thailand, 26–30 November 2012; Volume 3, pp. 2269–2275. [Google Scholar]
- Grogan, K.; Pflugmacher, D.; Hostert, P.; Mertz, O.; Fensholt, R. Unravelling the link between global rubber price and tropical deforestation in Cambodia. Nat. Plants 2019, 5, 47–53. [Google Scholar] [CrossRef] [PubMed]
- Grogan, K.; Pflugmacher, D.; Hostert, P.; Kennedy, R.; Fensholt, R. Cross-border forest disturbance and the role of natural rubber in mainland Southeast Asia using annual Landsat time series. Remote Sens. Environ. 2015. [Google Scholar] [CrossRef]
- Liu, W.; Hu, H.; Ma, Y.; Li, H. Environmental and Socioeconomic Impacts of Increasing Rubber Plantations in Menglun Township, Southwest China. Mt. Res. Dev. 2006, 26, 245–253. [Google Scholar] [CrossRef] [Green Version]
- Bafouet, B.; Koula, J.; Kouakou Bob, K.; Wandan, E.N. Spatial projection of dynamic modeling system: Exploration of Rubber tree plantation and the consequences of REDD+ for the populations of Toumodi in Côte d’Ivoire. J. Biodivers. Environ. Sci. J. Bio. Env. Sci 2017, 11, 7–20. [Google Scholar]
- Mahmoud, A.; Elbialy, S.; Pradhan, B.; Buchroithner, M. Field-based landcover classification using TerraSAR-X texture analysis. Adv. Space Res. 2011, 48, 799–805. [Google Scholar] [CrossRef] [Green Version]
- Soergel, U. Radar Remote Sensing of Urban Areas; Springer: Berlin, Germany, 2010; Volume 15, ISBN 9789048137503. [Google Scholar]
- Twisa, S.; Buchroithner, M.F. Land-use and land-cover (LULC) change detection in Wami river basin, Tanzania. Land 2019, 8, 136. [Google Scholar] [CrossRef] [Green Version]
- Li, H.; Aide, T.M.; Ma, Y.; Liu, W.; Cao, M. Demand for rubber is causing the loss of high diversity rain forest in SW China. Biodivers. Conserv. 2007, 16, 1731–1745. [Google Scholar] [CrossRef]
- Zhai, D.-L.; Cannon, C.H.C.H.; Slik, J.W.F.F.W.F.; Zhang, C.-P.C.-P.P.; Dai, Z.-C.C.Z.-C.; Cannon, C.H.C.H.; Dai, Z.-C.C.Z.-C.; Slik, J.W.F.F.W.F.; Zhang, C.-P.C.-P.P.; Dai, Z.-C.C.Z.-C. Rubber and pulp plantations represent a double threat to Hainan’s natural tropical forests. J. Environ. Manage. 2012, 96, 64–73. [Google Scholar] [CrossRef]
- Özdoğan, M.; Baird, I.G.I.; Dwyer, M.B.M. The Role of Remote Sensing for Understanding Large-Scale Rubber Concession Expansion in Southern Laos. Land 2018, 7, 55. [Google Scholar] [CrossRef] [Green Version]
- Liu, X.; Jiang, L.; Feng, Z.; Li, P. Rubber plantation expansion related land use change along the Laos-China Border Region. Sustainability 2016, 8, 1011. [Google Scholar] [CrossRef] [Green Version]
- Kou, W.; Dong, J.; Xiao, X.; Hernandez, A.J.; Qin, Y.; Zhang, G.; Chen, B.; Lu, N.; Doughty, R. Expansion dynamics of deciduous rubber plantations in Xishuangbanna, China during 2000–2010. GIScience Remote Sens. 2018, 55, 905–925. [Google Scholar] [CrossRef]
- Ye, S.; Rogan, J.; Sangermano, F. Monitoring rubber plantation expansion using Landsat data time series and a Shapelet-based approach. ISPRS J. Photogramm. Remote Sens. 2018, 136, 134–143. [Google Scholar] [CrossRef]
- Vadjunec, J.M.; Gomes, C.V.A.; Ludewigs, T. Land-use/land-cover change among rubber tappers in the Chico Mendes Extractive Reserve, Acre, Brazil. J. Land Use Sci. 2009, 4, 249–274. [Google Scholar] [CrossRef]
- Ekadinata, A.; Vincent, G. Rubber agroforests in a changing landscape: Analysis of land use/cover trajectories in bungo district, indonesia. For. Trees Livelihoods 2011, 20, 3–14. [Google Scholar] [CrossRef]
- Joshi, L.; Pasha, R. Rubber agroforestry and PES for preservation of biodiversity in Bungo district, Sumatra. In Payments for Ecosystem Services and Food Security; FAO: Rome, Italy, 2011; pp. 114–135. ISBN 978-92-5-106796-3. [Google Scholar]
- Phompila, C.; Lewis, M.; Clarke, K.; Ostendorf, B. Monitoring expansion of plantations in Lao tropical forests using Landsat time series. In Proceedings of the SPIE Asia-Pacific Remote Sensing, Beijing, China, 13–17 October 2014; Volume 9260, pp. 1–11. [Google Scholar]
- Clément-Demange, A.; Garcia, D.; Le Guen, V.; Pujade-Renaud, V.; Montoro, P.; Seguin, M. Rubber Genetics and Breeding at Cirad-France Country Report of Activities from 2007 to 2011 (AGAP Research Unit); IRRDB Breeding Group Workshop: Bahia, Brazil, 2011; Volume 2011. [Google Scholar]
- Cotter, M.; Asch, F.; Hilger, T.; Rajaona, A.; Schappert, A.; Stuerz, S.; Yang, X. Measuring leaf area index in rubber plantations − a challenge. Ecol. Indic. 2017, 82, 357–366. [Google Scholar] [CrossRef]
- Yang, X.; Blagodatsky, S.; Lippe, M.; Liu, F.; Hammond, J.; Xu, J.; Cadisch, G. Land-use change impact on time-averaged carbon balances: Rubber expansion and reforestation in a biosphere reserve, South-West China. For. Ecol. Manage. 2016, 372, 149–163. [Google Scholar] [CrossRef]
- Chen, B.; Xiao, X.; Wu, Z.; Yun, T.; Kou, W.; Ye, H.; Lin, Q.; Doughty, R.; Dong, J.; Ma, J.; et al. Identifying establishment year and pre-conversion land cover of rubber plantations on Hainan Island, China using Landsat data during 1987-2015. Remote Sens. 2018, 10, 240. [Google Scholar] [CrossRef] [Green Version]
- Suratman, M.N.; Bull, G.Q.; Leckie, D.G.; Lemay, V.M.; Marshall, P.L.; Mispan, M.R. Prediction models for estimating the area, volume, and age of rubber (Hevea brasiliensis) plantations in Malaysia using Landsat TM data. Int. For. Rev. 2004, 6, 1–12. [Google Scholar] [CrossRef]
- Shidiq, I.P.A.; Ismail, M.H. Stand age model for mapping spatial distribution of rubber tree using remotely sensed data in Kedah, Malaysia. J. Teknol. 2016, 78, 239–244. [Google Scholar] [CrossRef] [Green Version]
- Chen, B.; Cao, J.; Wang, J.; Wu, Z.; Tao, Z.; Chen, J.; Yang, C.; Xie, G. Estimation of rubber stand age in typhoon and chilling injury afflicted area with Landsat TM data: A case study in Hainan Island, China. For. Ecol. Manage. 2012, 274, 222–230. [Google Scholar] [CrossRef]
- Chen, G.; Thill, J.-C.J.C.; Anantsuksomsri, S.; Tontisirin, N.; Tao, R. Stand age estimation of rubber (Hevea brasiliensis) plantations using an integrated pixel- and object-based tree growth model and annual Landsat time series. ISPRS J. Photogramm. Remote Sens. 2018, 144, 94–104. [Google Scholar] [CrossRef]
- Mongkolsawat, C.; Putklang, W.; Charat, M.; Wasana, P. An approach for estimating area of rubber plantation: Integrating satellite and physical data over the Northeast Thailand. In Proceedings of the 31st Asian Conference on Remote Sensing 2010, ACRS 2010, Hanoi, Vietnam, 1–5 November 2010; Volume 2, pp. 1228–1234. [Google Scholar]
- Li, Z.; Fox, J.M. Rubber Tree Distribution Mapping in Northeast Thailand. Int. J. Geosci. 2011, 02, 573–584. [Google Scholar] [CrossRef]
- Koedsin, W.; Huete, A. Mapping rubber tree stand age using pléiades satellite imagery: A case study in Thalang District, Phuket, Thailand. Eng. J. 2015, 19, 45–56. [Google Scholar] [CrossRef] [Green Version]
- Dibs, H.; Mansor, S. Mapping Rubber Tree Growth by Spectral Angle Mapper Spectral-based and Pixel-based Classification Using SPOT-5 Image. In Proceedings of the 36th Asian Conference on Remote Sensing 2015, ACRS 2015, Manila, Philippines, 19–23 October 2015. [Google Scholar]
- Somching, N.; Wongsai, S.; Wongsai, N.; Koedsin, W. Using machine learning algorithm and landsat time series to identify establishment year of para rubber plantations: A case study in Thalang district, Phuket Island, Thailand. Int. J. Remote Sens. 2020, 41, 9075–9100. [Google Scholar] [CrossRef]
- Beckschäfer, P. Obtaining rubber plantation age information from very dense Landsat TM & ETM + time series data and pixel-based image compositing. Remote Sens. Environ. 2017, 196, 89–100. [Google Scholar] [CrossRef]
- Xiao, C.; Li, P.; Feng, Z.; Liu, X. An updated delineation of stand ages of deciduous rubber plantations during 1987-2018 using Landsat-derived bi-temporal thresholds method in an anti-chronological strategy. Int. J. Appl. Earth Obs. Geoinf. 2019, 76, 40–50. [Google Scholar] [CrossRef]
- Kou, W.; Xiao, X.; Dong, J.; Gan, S.; Zhai, D.; Zhang, G.; Qin, Y.; Li, L. Mapping deciduous rubber plantation areas and stand ages with PALSAR and landsat images. Remote Sens. 2015, 7, 1048–1073. [Google Scholar] [CrossRef] [Green Version]
- Blagodatsky, S.; Xu, J.; Cadisch, G. Carbon balance of rubber (Hevea brasiliensis) plantations: A review of uncertainties at plot, landscape and production level. Agric. Ecosyst. Environ. 2016, 221, 8–19. [Google Scholar] [CrossRef]
- Brahma, B.; Nath, A.J.; Das, A.K. Managing rubber plantations for advancing climate change mitigation strategy. Curr. Sci. 2016, 110, 2015–2019. [Google Scholar] [CrossRef]
- Min, S.; Wang, X.; Jin, S.; Waibel, H.; Huang, J. Climate change and farmers’ perceptions: Impact on rubber farming in the upper Mekong region. Clim. Change 2020. [Google Scholar] [CrossRef]
- Fox, J.; Castella, J.-C.; Ziegler, A.D.; Westley, S.B. Expansion of Rubber Mono-cropping and its Implications for the Resilience of Ecosystems in the Face of Climate Change in Montane Mainland Southeast Asia. Glob. Environ. Res. 2014, 18, 145–150. [Google Scholar]
- Verchot, L.V.; Van Noordwijk, M.; Kandji, S.; Tomich, T.; Ong, C.; Albrecht, A.; Mackensen, J.; Bantilan, C.; Anupama, K.V.; Palm, C. Climate change: Linking adaptation and mitigation through agroforestry. Mitig. Adapt. Strateg. Glob. Chang. 2007, 12, 901–918. [Google Scholar] [CrossRef] [Green Version]
- Shi, L.; Liu, S. Methods of Estimating Forest Biomass: A Review. Biomass Vol. Estim. Valorization Energy 2017. [Google Scholar] [CrossRef] [Green Version]
- Kumar, L.; Mutanga, O. Remote sensing of above-ground biomass. Remote Sens. 2017, 9, 935. [Google Scholar] [CrossRef] [Green Version]
- Charoenjit, K.; Zuddas, P.; Allemand, P. Estimation of carbon storage in Para rubber plantations using THAICHOTE and object based image analysis: Eastern Thailand. In Proceedings of the Asian Conference on Remote Sensing 2012 (ACRS 2012), Pattaya, Thailand, 26–30 November 2012; Volume 3, pp. 2020–2029. [Google Scholar]
- Charoenjit, K.; Zuddas, P.; Allemand, P.; Pattanakiat, S.; Pachana, K.; Pattanakiat, S. Estimation of biomass and carbon stock in Para rubber plantations using object-based classification from Thaichote satellite data in Eastern Thailand. J. Appl. Remote Sens. 2015, 9, 096072. [Google Scholar] [CrossRef] [Green Version]
- Yasen, K.; Koedsin, W. Estimating Aboveground Biomass of Rubber Tree Using Remote Sensing in Phuket Province, Thailand. J. Med. Bioeng. 2015, 4, 451–456. [Google Scholar] [CrossRef]
- Anurogo, W.; Lubis, M.Z.; Mufida, M.K. Modified Soil-Adjusted Vegetation Index In Multispectral Remote Sensing Data for Estimating Tree Canopy Cover Density at Rubber Plantation. J. Geosci. Eng. Environ. Technol. 2018, 3, 15–21. [Google Scholar] [CrossRef] [Green Version]
- Anurogo, W.; Lubis, M.Z.; Sari, L.R.; Mufida, M.K.; Prihantarto, W.J. Satellite-based Estimation of above Ground Carbon Stock Estimation for Rubber Plantation in Tembir Salatiga Central Java. In Proceedings of the 4th International Conference on Science and Technology, ICST 2018, Yogyakarta, Indonesia, 7–8 August 2018. [Google Scholar]
- Pratama, L.D.Y.; Danoedoro, P. Above-ground carbon stock estimates of rubber (hevea brasiliensis) using Sentinel 2A imagery: A case study in rubber plantation of PTPN IX Kebun Getas and Kebun Ngobo, Semarang Regency. IOP Conf. Ser. Earth Environ. Sci. 2020, 500, 1–9. [Google Scholar] [CrossRef]
- Chen, B.; Yun, T.; Ma, J.; Kou, W.; Li, H.; Yang, C.; Xiao, X.; Zhang, X.; Sun, R.; Xie, G.; et al. High-Precision Stand Age Data Facilitate the Estimation of Rubber Plantation Biomass: A Case Study of Hainan Island, China. Remote Sens. 2020, 12, 3853. [Google Scholar] [CrossRef]
- Muukkonen, P.; Heiskanen, J. Estimating biomass for boreal forests using ASTER satellite data combined with standwise forest inventory data. Remote Sens. Environ. 2005, 99, 434–447. [Google Scholar] [CrossRef]
- Xie, Y.; Sha, Z.; Yu, M.; Bai, Y.; Zhang, L. A comparison of two models with Landsat data for estimating above ground grassland biomass in Inner Mongolia, China. Ecol. Model. 2009, 220, 1810–1818. [Google Scholar] [CrossRef]
- Vicente-Serrano, S.M.; Pérez-Cabello, F.; Lasanta, T. Assessment of radiometric correction techniques in analyzing vegetation variability and change using time series of Landsat images. Remote Sens. Environ. 2008, 112, 3916–3934. [Google Scholar] [CrossRef]
- Spanner, M.; Johnson, L.; Miller, J.; Mccreight, R.; Applications, S.E.; May, N.; Gong, P. Remote Sensing of Seasonal Leaf Area Index Across the Oregon Transect Freemantle. Ecol. Appl. 1994, 4, 258–271. Available online: http://www.jstor.org/stable/1941932 (accessed on 27 June 2016). [CrossRef]
- Sprintsin, M.; Cohen, S.; Maseyk, K.; Rotenberg, E.; Grünzweig, J.; Karnieli, A.; Berliner, P.; Yakir, D. Long term and seasonal courses of leaf area index in a semi-arid forest plantation. Agric. For. Meteorol. 2011, 151, 565–574. [Google Scholar] [CrossRef]
- Koedsin, W.; Yasen, K. Estimating Leaf Area Index of Rubber Tree Plantation Using Worldview-2 Imagery. J. Life Sci. Technol. 2016. [Google Scholar] [CrossRef] [Green Version]
- Fang, H.; Baret, F.; Plummer, S.; Schaepman-Strub, G. An Overview of Global Leaf Area Index (LAI): Methods, Products, Validation, and Applications. Rev. Geophys. 2019, 57, 739–799. [Google Scholar] [CrossRef]
- Jain, S.M.; Priyadarshan, P.M. Breeding Plantation Tree Crops: Tropical Species; Springer Science+Business Media: Berlin, Germany, 2009; ISBN 9780387712031. [Google Scholar]
- Priyadarshan, P.M. Biology of Hevea Rubber; Springer International Publishing AG: Berlin, Germany, 2017; ISBN 9783319545066. [Google Scholar]
- Ranganath, B.K.K.; Pradeep, N.; Manjula, V.B.B.; Gowda, B.; Rajanna, M.D.D.; Shettigar, D.; Rao, P.P.N.P.N. Detection of diseased rubber plantations using satellite remote sensing. J. Indian Soc. Remote Sens. 2004, 32, 49–58. [Google Scholar] [CrossRef]
- Verheye, W. Soils, Plant Growth and Crop Production-Volume III. Encycl. Life Support Syst. 2010, 1–20. [Google Scholar] [CrossRef]
- Langenberger, G.; Cadisch, G.; Martin, K.; Min, S.; Waibel, H. Rubber intercropping: A viable concept for the 21st century? Agrofor. Syst. 2016, 577–596. [Google Scholar] [CrossRef]
- Abdulla, I.; Arshad, F.M. Exploring relationships between rubber productivity and R & D in Malaysia. Outlook Agric. 2017. [Google Scholar] [CrossRef]
- Somboonsuke, B.; Shivakoti, G.P. Small holders of rubber-based farming systems in Songkhla Province Thailand: Problems and potential solutions. Kasetsart J. Soc. Sci. 2001, 97, 79–97. [Google Scholar]
- Weiss, M.; Jacob, F.; Duveiller, G. Remote sensing for agricultural applications: A meta-review. Remote Sens. Environ. 2020, 236, 111402. [Google Scholar] [CrossRef]
- Pavlovic, D.; Nikolic, B.; Djurovic, S.; Waisi, H.; Andjelkovic, A.; Marisavljevic, D. Chlorophyll as a measure of plant health: Agroecological aspects. Pestic. i Fitomedicina 2014, 29, 21–34. [Google Scholar] [CrossRef]
- Ghamisi, P.; Rasti, B.; Yokoya, N.; Gloaguen, R.; Wang, Q.; Höfle, B.; Bruzzone, L.; Bovolo, F.; Chi, M.; Anders, K.; et al. Multisource and Multitemporal Data Fusion in Remote Sensing. arXiv 2018, arXiv:1812.08287. [Google Scholar]
- Ranchin, T.; Paris, M. De Data Fusion in Remote Sensing and Improvement of the Spatial Resolution of Satellite Images. In Multisensor Fusion; Springer: Dordrecht, The Netherlands, 2002; pp. 633–656. ISBN 9781402007231. [Google Scholar]
- Zhang, J. Multi-source remote sensing data fusion: Status and trends. Int. J. Image Data Fusion 2010, 1, 5–24. [Google Scholar] [CrossRef] [Green Version]
- Gao, F.; Hilker, T.; Zhu, X.; Anderson, M.; Masek, J.; Wang, P.; Yang, Y. Fusing Landsat and MODIS Data for Vegetation Monitoring. IEEE Geosci. Remote Sens. Mag. 2015, 3, 47–60. [Google Scholar] [CrossRef]
- Jia, D.; Song, C.; Cheng, C.; Shen, S.; Ning, L.; Hui, C. A novel deep learning-based spatiotemporal fusion method for combining satellite images with different resolutions using a two-stream convolutional neural network. Remote Sens. 2020, 12, 698. [Google Scholar] [CrossRef] [Green Version]
- Zhu, X.; Helmer, E.H.; Gao, F.; Liu, D.; Chen, J.; Lefsky, M.A. A flexible spatiotemporal method for fusing satellite images with different resolutions. Remote Sens. Environ. 2016, 172, 165–177. [Google Scholar] [CrossRef]
- Dong, J.; Metternicht, G.; Hostert, P.; Fensholt, R.; Chowdhury, R.R. Remote sensing and geospatial technologies in support of a normative land system science: Status and prospects. Curr. Opin. Environ. Sustain. 2019, 38, 44–52. [Google Scholar] [CrossRef]
- Gorelick, N.; Hancher, M.; Dixon, M.; Ilyushchenko, S.; Thau, D.; Moore, R. Google Earth Engine: Planetary-scale geospatial analysis for everyone. Remote Sens. Environ. 2017, 202, 18–27. [Google Scholar] [CrossRef]
- Moshou, D.; Gravalos, I.; Kateris, D.; Bravo, C.; Oberti, R.; West, J.S.; Ramon, H. Multisensor fusion of remote sensing data for crop disease detection. In Geospatial Techniques for Managing Environmental Resources; Springer Science & Business Media: Berlin, Germany, 2012; ISBN 9789400718586. [Google Scholar]


| Inclusion Criteria | Exclusion Criteria |
|---|---|
|
|
|
|
|
|
|
|
| Database | Terms | Results |
|---|---|---|
| ScienceDirect | “rubber plantation” AND “remote sensing” | 209 |
| Web of Science Core Collection | TOPIC: (rubber plantation*) AND TOPIC: (remote sens*) | 82 |
| Scopus | TITLE-ABS-KEY (rubber AND plantation AND remote AND sens*) | 117 |
| ProQuest | noft 1(rubber plantation*) AND noft(remote sens*) | 47 |
| Google Scholar | with all of the words: “rubber plantation*” with the exact phrase: “remote sens*’ | 474 |
| Validation Methods | Error Matrix | Kappa Coefficients | R2 / RMSE | Total Number of Documents | |||
|---|---|---|---|---|---|---|---|
| Reference Data | with Kappa Coefficients | without Kappa Coefficients | with R2/ RMS Error | ||||
| Ground data Example: Sampling point, field survey, GPS point and geotagged photo | 5 | 7 | 3 | 1 | 8 | 24 | |
| Images Example: Google Earth imagery, aerial orthophoto, Ikonos image | 3 | 3 | 0 | 0 | 0 | 6 | |
| Other data Example: Maps (land-use, topographic, statistical data, etc) | 2 | 0 | 0 | 0 | 2 | 4 | |
| Combination of: | |||||||
| Ground data + images | 15 | 2 | 0 | 0 | 0 | 17 | |
| Ground data + other data | 2 | 4 | 1 | 0 | 2 | 9 | |
| Ground data + images + other data | 3 | 2 | 0 | 0 | 0 | 5 | |
| Images + other data | 2 | 1 | 0 | 0 | 0 | 3 | |
| Total number of documents | 32 | 19 | 4 | 1 | 12 | 68 | |
| Sensor | Classification | Overall Accuracy | Reference |
|---|---|---|---|
| IRS | False colour composite and vegetation indices | n/a | [38] |
| TM | Maximum Likelihood | 97.2% | [18] |
| TM | Maximum Likelihood for logistic regression | 87.0% | [67] |
| LISS III | Maximum Likelihood | 97.0% | [65] |
| ASTER | Mahalanobis with neural network | 99.7–98.7% | [68] |
| MODIS | Mahalanobis typicality | 98.1–98.1% | [36] |
| TM, ETM+, PALSAR | Phenology-based algorithm-using VIs | 92.0% | [72] |
| TM | Maximum Likelihood and Mahalanobis | 91.2% | [69] |
| TM | k-Nearest Neighbour | 90.0% | [73] |
| TM, ETM+, OLI | Phenology-based algorithm-using VIs | 89.9% | [74] |
| OLI | Phenology-based algorithm-using VIs | 92.0–96.0% | [39] |
| TM, ETM+, OLI | Support Vector Machine | 97.1% | [59] |
| SPOT-5 | Mahalanobis distance (MD), k-Nearest Neighbour (k-NN), Support Vector Machine (SVM) and Decision Tree (DT) | 80.8–97.5% | [29] |
| IRS | Visual interpretation and vectorization | 95.2% | [75] |
| TM, PALSAR | Decision Tree | 87.5% | [70] |
| OLI | Decision Tree | 92.2% | [58] |
| MODIS, TM, ETM+, PALSAR | Pixel- and object- based with phenology | 72.7–91.0% | [76] |
| MODIS, TM, ETM+, OLI | Fused time series indices (NDVI, EVI, NDMI, NBR, and TCA) | 89.5% | [31] |
| OLI | Phenology-based algorithm using renormalized modified normalized burn ratio (RMNBR) index | 94.8% | [77] |
| OLI | Phenology-based algorithm using re-normalization of two vegetation moisture indices (NDVI and NDM) | 92.3% | [78] |
| OLI | False Colour Method, Unsupervised Classification, Supervised Classification and Spectral Vegetation Indices (SVIs) | 81.0–83.0% | [79] |
| Sentinel-2 | Phenology-based algorithm using Red-edge Spectral Indices (RESI) | 92.5% | [80] |
| OLI | Phenology-based algorithm using difference Normalized Burn Ratio (NBR) | 93.3% | [81] |
| Sentinel-1, Sentinel-2, GF-1, OLI | Spectral and textural features | 90.36–92.38% | [71] |
| Sensor | Classification | Temporal Period | Previous Land Cover | Accuracy | Reference |
|---|---|---|---|---|---|
| TM, ETM+ | Supervised classification | 1998 to 2003 | Forests, shifting agriculture | OA = >80% | [89] |
| TM | Supervised classification (Maximum Likelihood) | 1989 to 1993 1993 to 1999 | n/a | n/a | [64] |
| MSS, TM, ETM+ | Supervised classification (Maximum Likelihood) | 1976 to 2003 | forest | OA = 90.1% | [94] |
| MSS, TM, ETM+ | Supervised classification (Maximum Likelihood) | 1976 to 1990 1990 to 2006 | Forest and paddy | n/a | [57] |
| TM, ETM+ | Hybrid unsupervised/supervised | 1986 to 2003 | Forest | OA = 85.0% | [100] |
| MSS, TM, ETM+ | Object-based | 1973 to 2005 | Forest | OA = 89.3% | [102] |
| THEOS | Supervised classification | 2002 to 2011 | Forest and paddy | Kappa = 0.87 | [19] |
| MSS, TM, ETM+, MODIS | Newly proposed vegetation indices (Planted density) | 1980 to 2010 1990 to 2010 2000 to 2010 | Forest | OA = 82.3–86.9% | [32] |
| ETM+ | Principal component analysis (PCA) and spectral vegetation index (NDVI) | 2003 to 2006 2006 to 2009 2009 to 2012 | Forest | OA = 87.0% | [103] |
| TM, ETM+, MODIS | Supervised classification (LandTrendr classification) | 2000 to 2012 | Forest | OA = 86.0% | [88] |
| TM, ETM+, RapidEye | Object-based | 1988 to 2002 2002 to 2010 | Forest | OA = 87.5%–88.7% | [85] |
| TM, ETM+ | Supervised classification (Decision Tree) | 2000 to 2010 | Paddy and woodland | OA = 86.59% | [97] |
| TM, ETM+, OLI | Supervised classification (Decision Tree) | 1989 to 2000 2000 to 2013 | Forest | OA = 83.9–86.5% | [62] |
| TM, ETM+, OLI | Supervised classification (shapelet-based) land clearing-establishment of rubber plantation | 1995 to 2015 | Forest and non-forest | OA = 89.0% | [99] |
| LISS III | Visual interpretation | 1997 to 2013 | Forest | n/a | [63] |
| TM, ETM+ | Supervised classification (Decision Tree) | 2004 to 2012 | Forest | OA = 92.0% | [96] |
| TM, ETM+, MODIS, PALSAR | Phenology-based algorithm | 2000 to 2010 | Forest | OA = 95.0% | [98] |
| MODIS, OLI, Sentinel-2 | Random Forest classifier, Breaks For Additive Season and Trend (BFAST), and non-parametric regression | 2001 to 2015 | Forest | OA = 86.0% | [87] |
| TM, ETM+, OLI | Phenology-based algorithm (change rate of the Landsat-derived normalized burn ratio) | 1996 to 2000 2001 to 2005 2006 to 2010 2011 to 2015 | Forest | OA = 92.0–97.0% | [53] |
| TM, ETM+, OLI | Phenology-based multiple normalization | 1987 to 2018 | Forest | OA = 94.7% | [84] |
| Sensor | Approach | Age Resolution | Accuracy | Reference |
|---|---|---|---|---|
| Landsat TM | Statistical Model | - | RMSE = 6.4–8.2 years | [108] |
| Landsat 8 | Statistical Model | 5, 10, 15 and 20 | R2= 0.4335–0.4912 | [109] |
| Landsat TM | Statistical Model | - | RMSE = 5.96 years | [110] |
| EO-1 Hyperion | Statistical Model | 5–25 | R2 = 0.624, RMSE = 2.625 years | [55] |
| Landsat TM, Landsat 7, Landsat 8 | Statistical Model | 3–15 | OA = 87% | [111] |
| SPOT-2, SPOT-4, SPOT-5, THEOS | Image Classification | <5, 5-10 and > 10 | OA = 89.8% | [112] |
| Landsat TM | Image Classification | ≤2, 2–4, >4 | - | [113] |
| THEOS | Image Classification | <5, 5-10 and > 10 | Kappa: 0.627–0.677 | [86] |
| Pléiades | Image Classification | ≤7, 7–15, >15 | OA = 94–97% | [114] |
| SPOT-5 | Image Classification | ≤7, 7–25, >25 | OA = 77–91% | [115] |
| Landsat TM, Landsat 7, Landsat 8 | Image Classification | Annual | OA = 84.4–84.7% | [116] |
| Landsat TM/ETM+, PALSAR | LULCC Detection | ≤5, 6–10, >10 | OA = 85% | [98] |
| Landsat TM, Landsat 7 | LULCC Detection | Annual | RMSE = 2.5 years | [117] |
| TM/ETM+/OLI | LULCC Detection | Annual | R2 = 0.85/0.99, RMSE = 2.34/0.54 years | [107] |
| Landsat TM, Landsat 7, Landsat 8 | LULCC Detection | ≤5, 6–10, 11–15, 16–20, 21–25, 26–30, and ≥31 | OA = 92.8% | [118] |
| Sensor | Allometric Equation | Method | Accuracy | Reference |
|---|---|---|---|---|
| Landsat TM | No | Maximum-likelihood for logistic regression | RMSE = 6.4–8.2 years | [49] |
| THEOS | Yes | Tree growth parameter models (object-based classification) | R2 = 0.36 | [127] |
| THEOS | Yes | Tree growth parameter models (object-based classification) | R2 = 0.531-0.865 RMSE = 0.39–1.93 t/ha RMSE = 0.17–11.97 tC/ha | [128] |
| Worlview-2 | Yes | Supervised- Stepwise Linear regression and Artificial neural network models | Kappa = 0.627–0.677 | [129] |
| IKONOS, SPOT, RapidEye, Landsat | Yes | Rapid Carbon Stock Appraisal (RaCSA) method | R2 = 0.968–0.982 | [106] |
| ASTER | No | Vegetation index (MSAVI) | R2 = 0.709 | [130] |
| ASTER | Yes | Vegetation index model (MSAVI) | R2 = 0.681 | [131] |
| Sentinel-2 | Yes | Vegetation indices model (RVI, NDVI, ARVI, and SARVI) | R2 = 0.473 | [132] |
| Landsat 7, Landsat 8, Sentinel-2 | Yes | Regression and Random Forest model | R2 = 0.82–0.96 RMSE = 4.08–10.59 Mg/ha biomass | [133] |
| Sensor | Method | Accuracy | Reference |
|---|---|---|---|
| EO-1 Hyperion | Regression model based on: Simple Ratio Index | R2 = 0.820, RMSE = 0.170 | [56] |
| Normalized Difference Vegetation Index | R2 = 0.794, RMSE = 0.162 | ||
| Modified Simple Ratio Index | R2 = 0.815, RMSE = 0.166 | ||
| Modified Soil Adjusted Vegetation Index | R2 = 0.775, RMSE = 0.160 | ||
| HJ-1, ZY3 | Stepwise regression model | R2 = 0.43–0.51, RMSE = 0.52–0.82 | [33] |
| Recurrent neural network model | R2 = 0.54–0.58, RMSE = 0.47–0.71 | ||
| WorldView-2 | Stepwise regression model | R2 = 0.59, RMSE = 0.49 | [139] |
| Artificial neural network model | R2 = 0.83, RMSE = 0.31 |
| Sensor | Platform | Method | Leaf Disease | Accuracy | Location | Reference |
|---|---|---|---|---|---|---|
| IRS | Satellite | Image classification (Supervised-Maximum likelihood) | Corynespora Leaf Fall, Gloeosporium Leaf Disease | OA = 82% | Karnataka, India | [143] |
| IRS, MODIS | Satellite | Image classification (Unsupervised-K-means) | Phytophthora Leaf Fall | OA = 82% | Kerala and Kaniyakumari, India | [15] |
| Drone | UAV | Vegetation index | Odium Leaf Disease | - | Johor, Malaysia | [54] |
Publisher’s Note: MDPI stays neutral with regard to jurisdictional claims in published maps and institutional affiliations. |
© 2021 by the authors. Licensee MDPI, Basel, Switzerland. This article is an open access article distributed under the terms and conditions of the Creative Commons Attribution (CC BY) license (http://creativecommons.org/licenses/by/4.0/).
Share and Cite
Azizan, F.A.; Kiloes, A.M.; Astuti, I.S.; Abdul Aziz, A. Application of Optical Remote Sensing in Rubber Plantations: A Systematic Review. Remote Sens. 2021, 13, 429. https://doi.org/10.3390/rs13030429
Azizan FA, Kiloes AM, Astuti IS, Abdul Aziz A. Application of Optical Remote Sensing in Rubber Plantations: A Systematic Review. Remote Sensing. 2021; 13(3):429. https://doi.org/10.3390/rs13030429
Chicago/Turabian StyleAzizan, Fathin Ayuni, Adhitya Marendra Kiloes, Ike Sari Astuti, and Ammar Abdul Aziz. 2021. "Application of Optical Remote Sensing in Rubber Plantations: A Systematic Review" Remote Sensing 13, no. 3: 429. https://doi.org/10.3390/rs13030429