Article

UWB-Printed Rectangular-Based Monopole Antenna for Biological Tissue Analysis

by
Andrea Martínez-Lozano
1,*,
Carolina Blanco-Angulo
1,
Héctor García-Martínez
1,
Roberto Gutiérrez-Mazón
2,
Germán Torregrosa-Penalva
2,
Ernesto Ávila-Navarro
1 and
José María Sabater-Navarro
3
1
Department of Materials Science, Optical and Electronic Technology, University Miguel Hernández of Elche, 03202 Elche, Spain
2
Department of Communications Engineering, University Miguel Hernández of Elche, 03202 Elche, Spain
3
Department of Systems Engineering and Automation, University Miguel Hernández of Elche, 03202 Elche, Spain
*
Author to whom correspondence should be addressed.
Electronics 2021, 10(3), 304; https://doi.org/10.3390/electronics10030304
Submission received: 22 December 2020 / Revised: 15 January 2021 / Accepted: 23 January 2021 / Published: 27 January 2021
(This article belongs to the Special Issue Numerical Methods and Measurements in Antennas and Propagation)

Abstract

:
This paper presents the design of a printed step-type monopole antenna for biological tissue analysis and medical imaging applications in the microwave frequency range. The design starts from a very simple and widely known rectangular monopole antenna, and different modifications to the antenna geometry are made in order to increase the bandwidth. The antenna dimensions are optimized by means of a parametric analysis of each dimension using a 3-D electromagnetic simulator based on the finite element method. The optimized antenna, with final dimensions of 40 × 36 mm2, is manufactured onto a low-cost FR4 (fiber glass epoxy) substrate. The characteristics of the antenna have been measured inside an anechoic chamber, obtaining an omnidirectional radiation pattern and a working frequency range between 2.7 GHz and 11.4 GHz, which covers the UWB frequencies and enables the use of the antenna in medical imaging applications. Finally, the behaviour of four of these antennas located around a realistic breast model, made with biocompatible materials, has been analysed with the electromagnetic simulator, obtaining good results and demonstrating the usefulness of the designed antenna in the proposed application.

1. Introduction

Cancer is one of the diseases with the highest incidence worldwide. This sickness is responsible for one in six deaths globally and accounts for almost 30% of premature deaths. Breast cancer is the second most frequent and the first among women, accounting for 11.6% of diagnosed cases in 2018 [1]. The number of diagnosed cases of breast cancer continues to grow globally, but life expectancy for patients is improving, due in part to the progress of detection systems, which allow diagnosing the disease at earlier stages and, on the other hand, to the improvement in the effectiveness of the treatments.
Currently, there are several medical imaging methods that allow us to detect breast cancer. Among these, the most widely used technique is X-ray mammography. This technique has some disadvantages, such as the use of X-rays, that are ionizing waves and entail certain risks for patients and limits the maximum number of exposures, or the compression of the breast, causing pain and discomfort to the patients. Furthermore, X-ray mammograms have high failure rates, with a high number of false positives and negatives [2,3].
Due to these disadvantages, in recent years, some alternative techniques to traditional methods of detecting breast cancer have been carried out. One of these alternatives is the use of techniques for the analysis of biological tissues and medical imaging based on microwave signals, which have a low manufacturing cost and use non-ionizing waves [4]. These techniques are based on obtaining a diagnosis from the different response to the signals presented by healthy and tumorous breast tissues in the microwave range, mainly due to the different dielectric properties of these tissues [5]. There are two methods of medical imaging based on microwave signals, microwave tomography and radar systems. The microwave tomography technique is based on making images from the different dielectric profiles of the tissues that are inside the breast. Furthermore, the microwave radar technique performs a mapping of the dielectric dispersion of the breast tissues [3,4]. The latter method is more computationally efficient [5].
One of the most important components of a microwave-based medical imaging system is the antenna that is responsible for transmitting and receiving the electromagnetic energy used to generate the images. The useful frequency range for this type of application is between 1 GHz and 10 GHz, where it is possible to achieve good characteristics of both wave penetration into tissue and spatial resolution [6,7]. Therefore, the antennas used in this type of system should cover this frequency band as well as possible and present an appropriate size for the application. Ultra-wideband (UWB) antennas meet this requirement, because they have a relatively small size and cover a large part of the frequency range used in microwave medical imaging systems, since according to the standard they must operate between 3.1 GHz and 10.6 GHz [8,9]. For this reason, many antennas designed for UWB applications have been used for medical imaging systems, such as Vivaldi antennas [10], slot monopole antenna arrays [11], metamaterial antennas [12], flexible antennas [13], printed monopole antennas with coplanar feed [8] or printed monopole antennas with a microstrip feed [14].
Printed antennas, due to the numerous advantages that they present, such as a small size, low cost, and simple design, are the ones usually chosen for this type of application. Printed monopole antennas stand out, offering a high bandwidth compatible with UWB applications with high radiation efficiency, so these antennas are widely used not only in UWB applications but also in high-resolution radar systems, military communications, wireless personal area networks, and medical imaging systems [5,15]. To adapt the bandwidth of the antenna to the application requirements, it is common to employ different modifications of geometry, such as the use of steps in rectangular antennas [16], defects in the ground plane [17], fractal structures [18], and slots of different shapes, such as triangular [19], T-shaped [20], L-shaped [21], E-shaped [22] or Q-shaped [23]. It is also usual to use several techniques at the same time: steps in a rectangular antenna together with slots of different shapes, both in the radiating patch and in the ground plane [24], or slots together with fractal structures [25].
Another aspect to consider in the final design of the antenna is the influence that the biological tissue will have on its response. This is important because in the microwave medical imaging application, the antennas are very close to the biological tissue. This biological material has both a dielectric constant and conductivity that is very high, so the response of the antenna will be significantly modified in terms of its bandwidth and radiation characteristics. For this reason, the designed antenna must be evaluated not only in vacuum but also in near field in the presence of biological tissue.
This work focuses on the design of a broadband printed monopole antenna that meets UWB standards and the requirements of medical imaging systems. As a starting point, a very simple rectangular monopole antenna is used, and a series of modifications in the geometry are made, in order to improve its bandwidth while maintaining a moderately small size, limited by the real application where the antenna will be used. Section 2 describes the design and optimization process carried out to obtain the final antenna. In Section 3, the measured results of the manufactured antenna are shown and compared to those obtained in simulation, and the broadband and time domain response of the antenna are evaluated. In Section 4, the effect of biological tissue on the characteristics of the antenna is analysed. In order to do so, a breast model with three layers of biological tissue is made and four antennas, as designed, have been located around it, and the influence of tissue on both the frequency domain and time domain, has been evaluated. Finally, Section 5 presents the conclusions that can be drawn from the work.

2. Design and Optimization Process of the Antenna

The proposed antenna is based on a printed monopole antenna with microstrip feeding. Different modifications in its geometry have been carried out to obtain the widest possible bandwidth and thus meet the requirements of the medical imaging system where the antenna is going to be used as a radiating element. Figure 1 shows the geometry of the antenna in the different geometries studied. The design of the antenna dimensions is based on a parametric study carried out with simulations. The antenna is simulated for different values of the dimension being optimized, and the results are analysed, selecting the value that offers the best behaviour [26]. Simulations have been performed with EMPro 3D electromagnetic simulation software (2020 version) by Keysight Technologies using the Finite Element Method (FEM). The figures of merit evaluated are that the minimum operating frequency be as low as possible, because of biological tissues being detected more efficiently at lower frequencies, and that the bandwidth be as large as possible to obtain the greatest precision in the measurements and to cover the UWB standard frequencies. Another important point in the design of the antenna is its maximum size, which is imposed by the medical imaging application. The breast model used has a total volume of 1.4 L, and 16 antennas are used in the system, so the maximum size allowed for the antenna is 40 × 40 mm2. The substrate used in the design is FR4 ( ε r = 4.4, t a n   δ = 0.02) with 1.52 mm thickness.
In the following sections, the design process followed will be detailed, starting from a widely known antenna as the rectangular printed monopole (Figure 1a). The first step carried out consists of dividing the rectangular geometry of the antenna into two steps (Figure 1b); later, two strips are inserted in the microstrip feed line (Figure 1c), and finally, two rectangular slots are inserted in the ground plane of the antenna (Figure 1d).

2.1. Starting Geometry of the Antenna

The antenna design starts from a rectangular monopole-printed antenna (Antenna A, Figure 1a). The antenna is fed by a microstrip transmission line with 50 Ω characteristic impedance. The antenna design equations are shown in the following expressions [27]:
L   =   c 2 f r ε r e f f
ε r e f f   =   ε r   +   1 2 + ε r     1 2 [ 1 1 + 12 h W ]
W   =   c 2 f r 2 ε r   +   1
where f r is the design frequency, c is the velocity of the light in a vacuum, ε r is the dielectric constant of the substrate, and h is the substrate thickness.
In the antenna design, the maximum size is limited by the medical imaging application. With these restrictions, and after a brief optimization process where the goal is to have the minimum frequency of the antenna as small as possible, a rectangular patch of 24 × 21 mm2 is reached. The designed central frequency is 4.2 GHz and the final size of the antenna is 36 × 40 mm2.
Once the dimensions of the rectangular patch have been obtained, a parametric analysis of the G variable is carried out, that is, the separation between the ground plane of the microstrip feed line and the radiating patch is analysed. This study is commonly used to improve the response of monopole antennas [28,29,30]. Figure 2 shows the results of the reflection coefficient ( S 11 ) obtained when modifying G . As can be seen, the analysed dimension notably influences the response of the antenna, obtaining the best results for G = 1.5 mm. The rest of the basic antenna dimensions are shown in Table 1. The antenna bandwidth obtained for S 11 < −10 dB is 1.52 GHz, with a minimum frequency of 3.2 GHz. These values are far from the requirements of the desired application for the antenna; therefore, different modifications of the antenna geometry are proposed to increase the bandwidth and decrease, as much as possible, the minimum working frequency.

2.2. Analysis of Two Steps in the Rectangular Patch

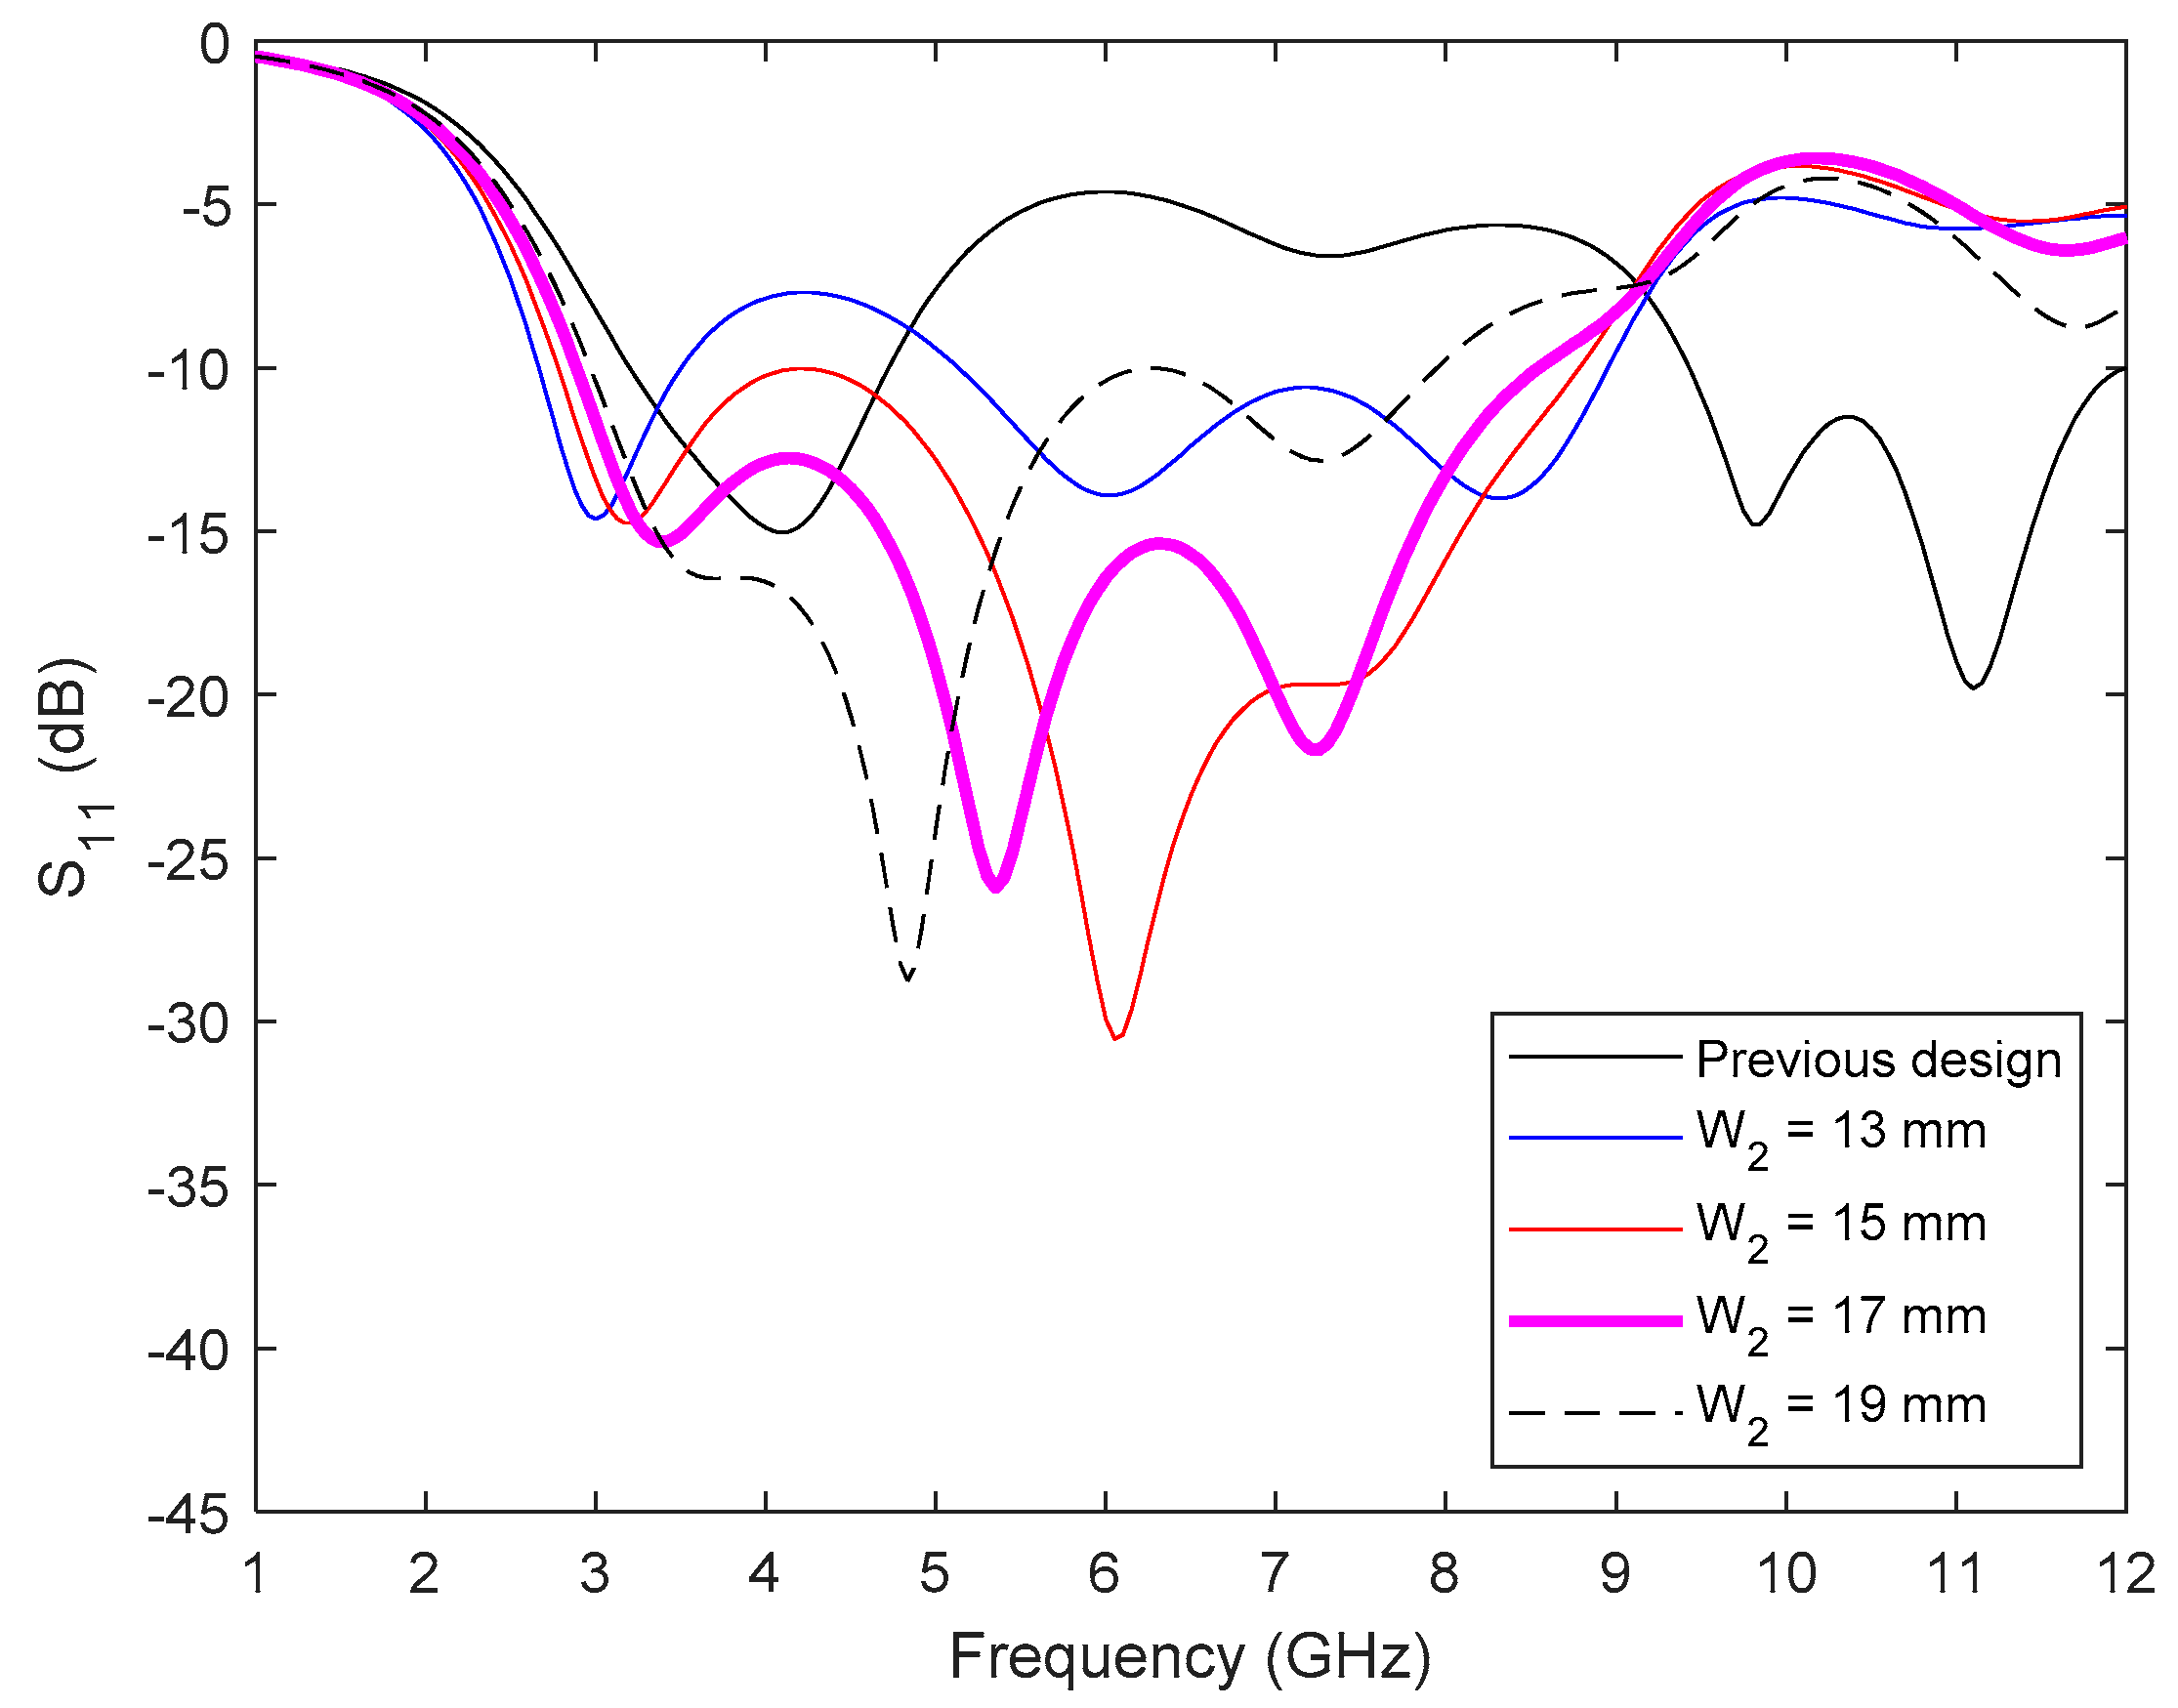
The first modification proposed on the antenna geometry is to insert a step in the rectangular patch, so it is divided into two, as can be seen in Figure 1b (Antenna B). The insertion of this step substantially modifies the response of the antenna and allows a significant increase in the bandwidth [28,31]. To evaluate the influence of the proposed geometry, a parametric analysis of the dimensions of this new step ( W 2 and L 2 ), is carried out, keeping in all cases the size of the antenna at 36 × 40 mm2. After the analysis is performed, it is verified that the width of the new step ( W 2 ) has the most influence on the antenna bandwidth, while the length of the step ( L 2 ) has less impact on the performance, obtaining the best results for L 2 = 7 mm. Figure 3 shows as an example the response of the antenna for the most significant cases evaluated for W 2 , where the strong influence of this variable on the antenna response can be seen. W 2 = 17 mm has been taken as the final value, which provides a bandwidth of 5.7 GHz, which implies a fractional bandwidth of approximately 99%.

2.3. Analysis of Strips in the Microstrip Feeding Line

The next step followed in the design of the antenna is the insertion of two small strips in the microstrip feed line, as shown in Figure 1c (Antenna C). The use of these elements allows improvement of the impedance matching and an increase in the antenna bandwidth [32,33,34]. To evaluate the behaviour of the antenna, a parametric analysis of the strip dimensions was performed, as shown in Figure 1c. The two variables that have the most influence on the antenna response are the length of the strips and their position with respect to the feeding point.
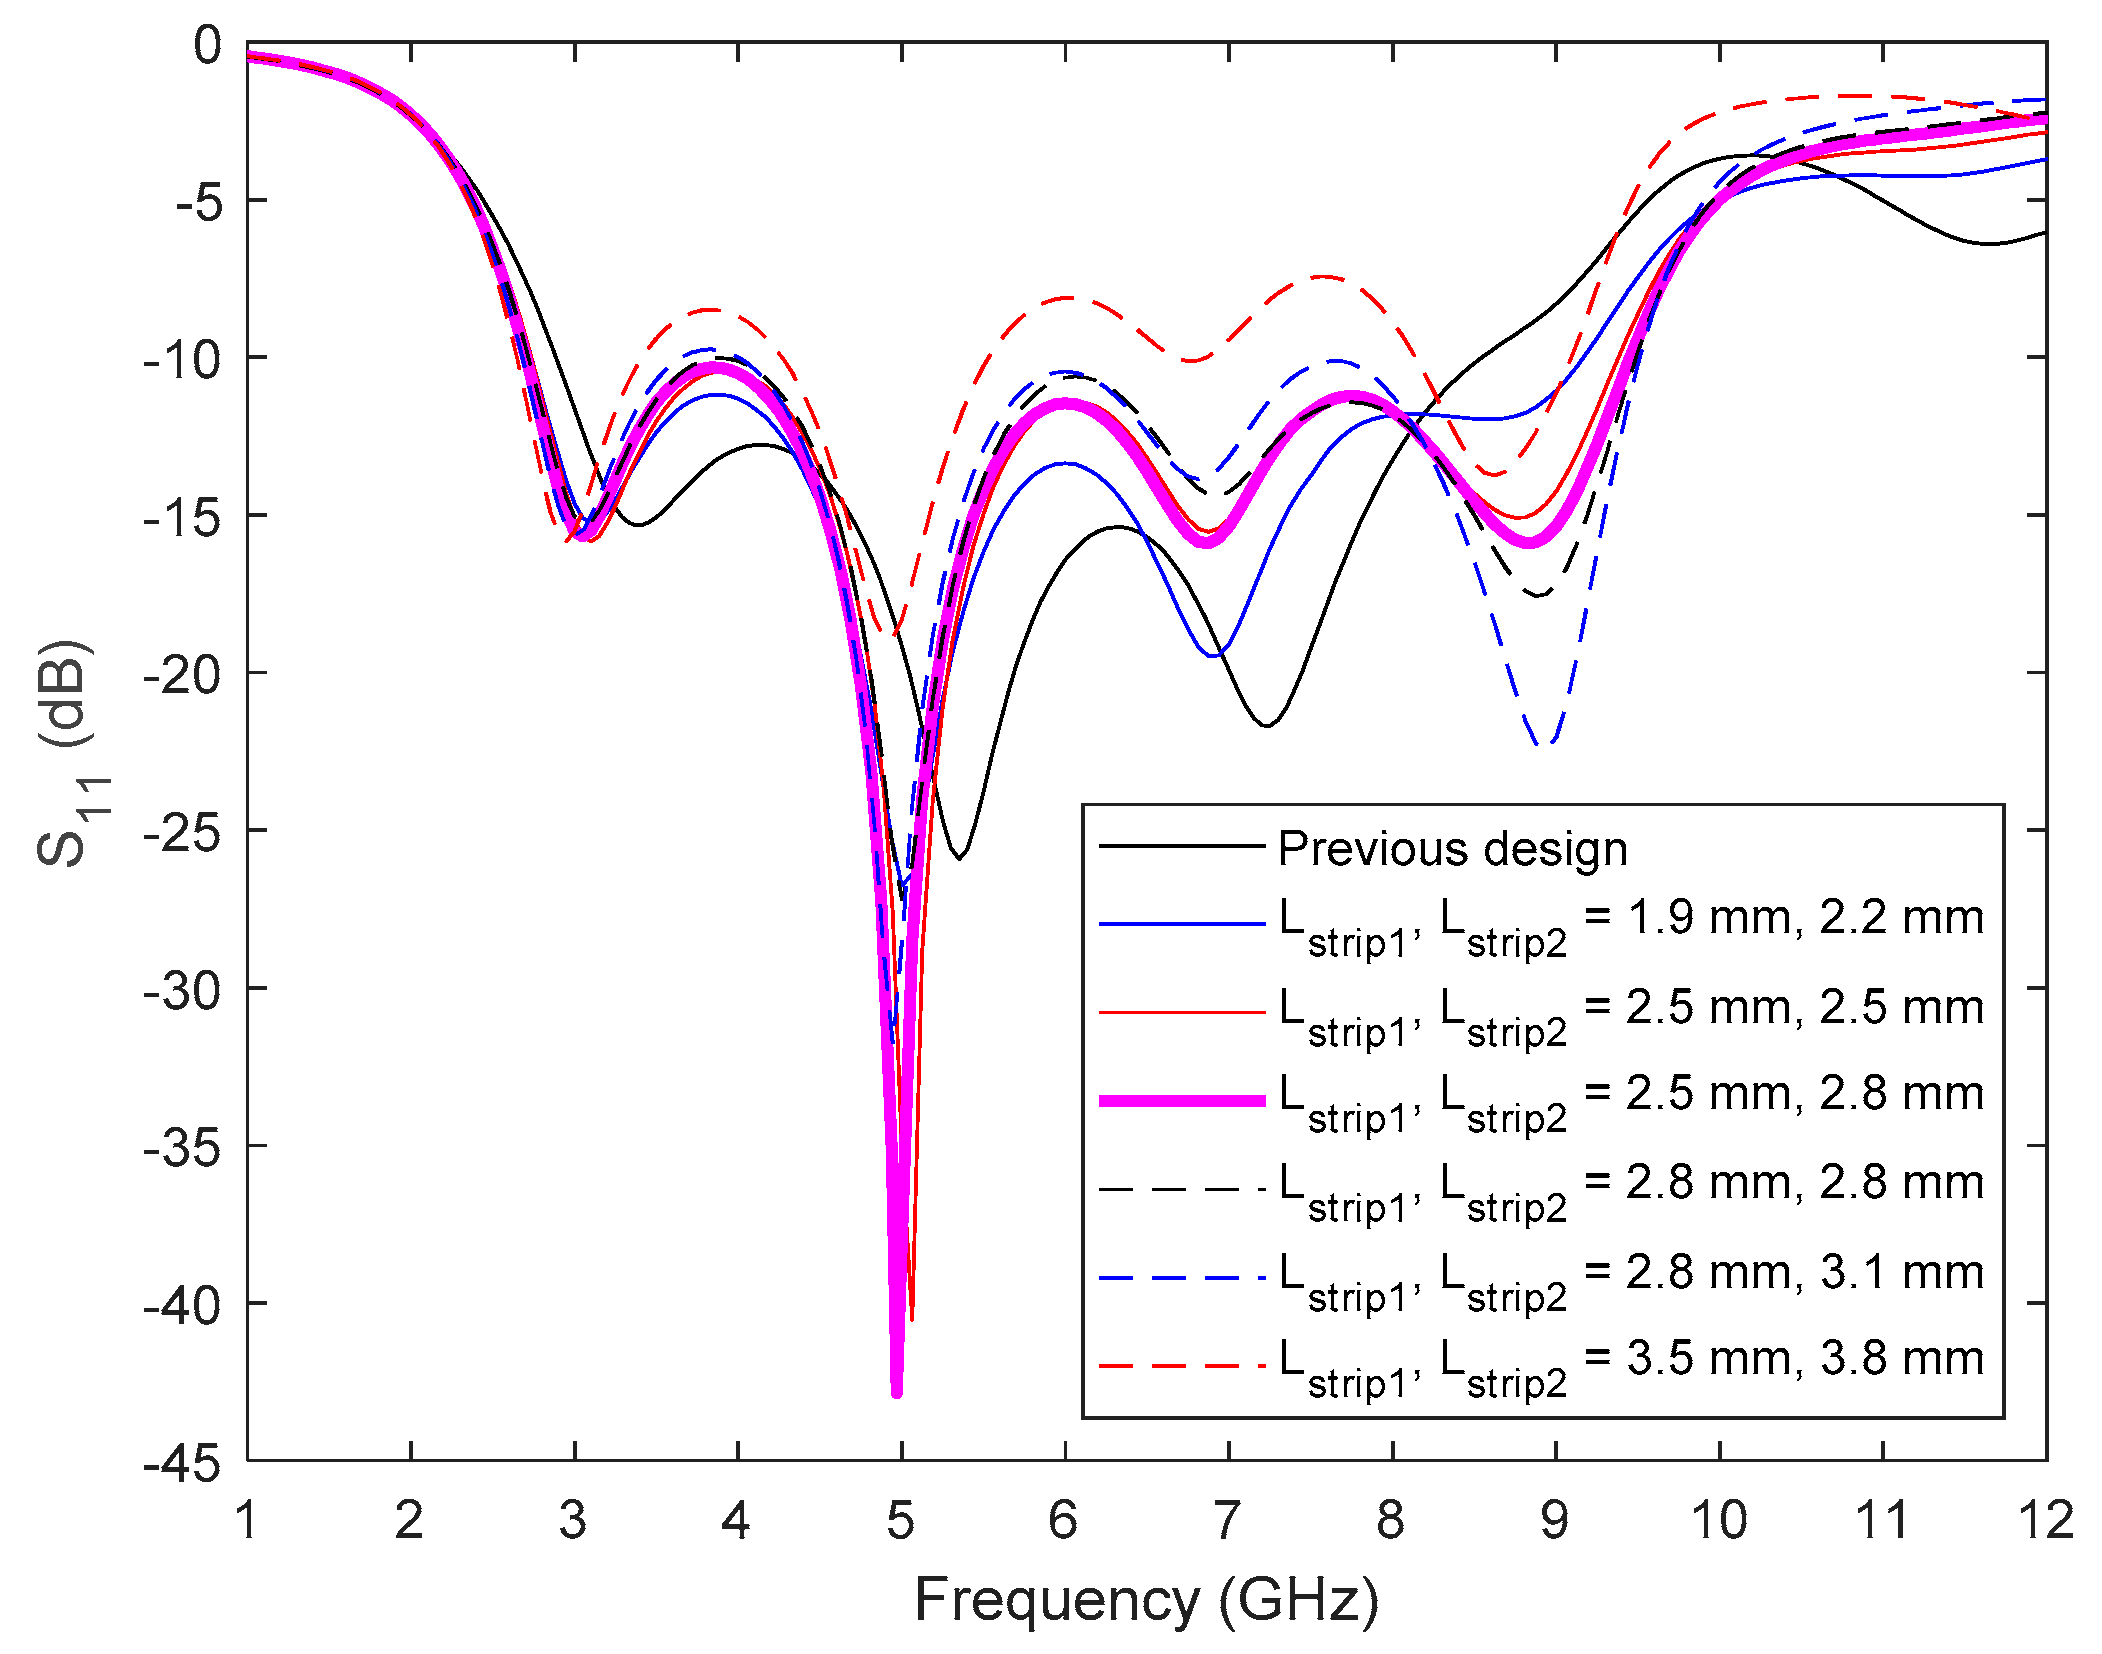
The first dimension that has been analysed is the length of the strips, L s t r i p 1 and L s t r i p 2 . The observed effects on the antenna reflection coefficient are the modification of the antenna matching at low frequencies and the addition of a new resonance frequency at high frequencies, that is directly related to the length of the two strips. Figure 4 shows the S 11 parameter of the antenna for the most representative values of the strip length. It has been verified that when setting the two strips of the same dimension, maintaining the symmetry of the antenna, with a small offset of 0.3 mm between L s t r i p 1 and L s t r i p 2 , the best results are achieved. These results, evaluating both bandwidth and impedance matching, are obtained for L s t r i p 1 = 2.5 mm and L s t r i p 2 = 2.8 mm. In this case, a new resonant frequency is generated around 8.5 GHz, increasing the antenna bandwidth up to 6.75 GHz.
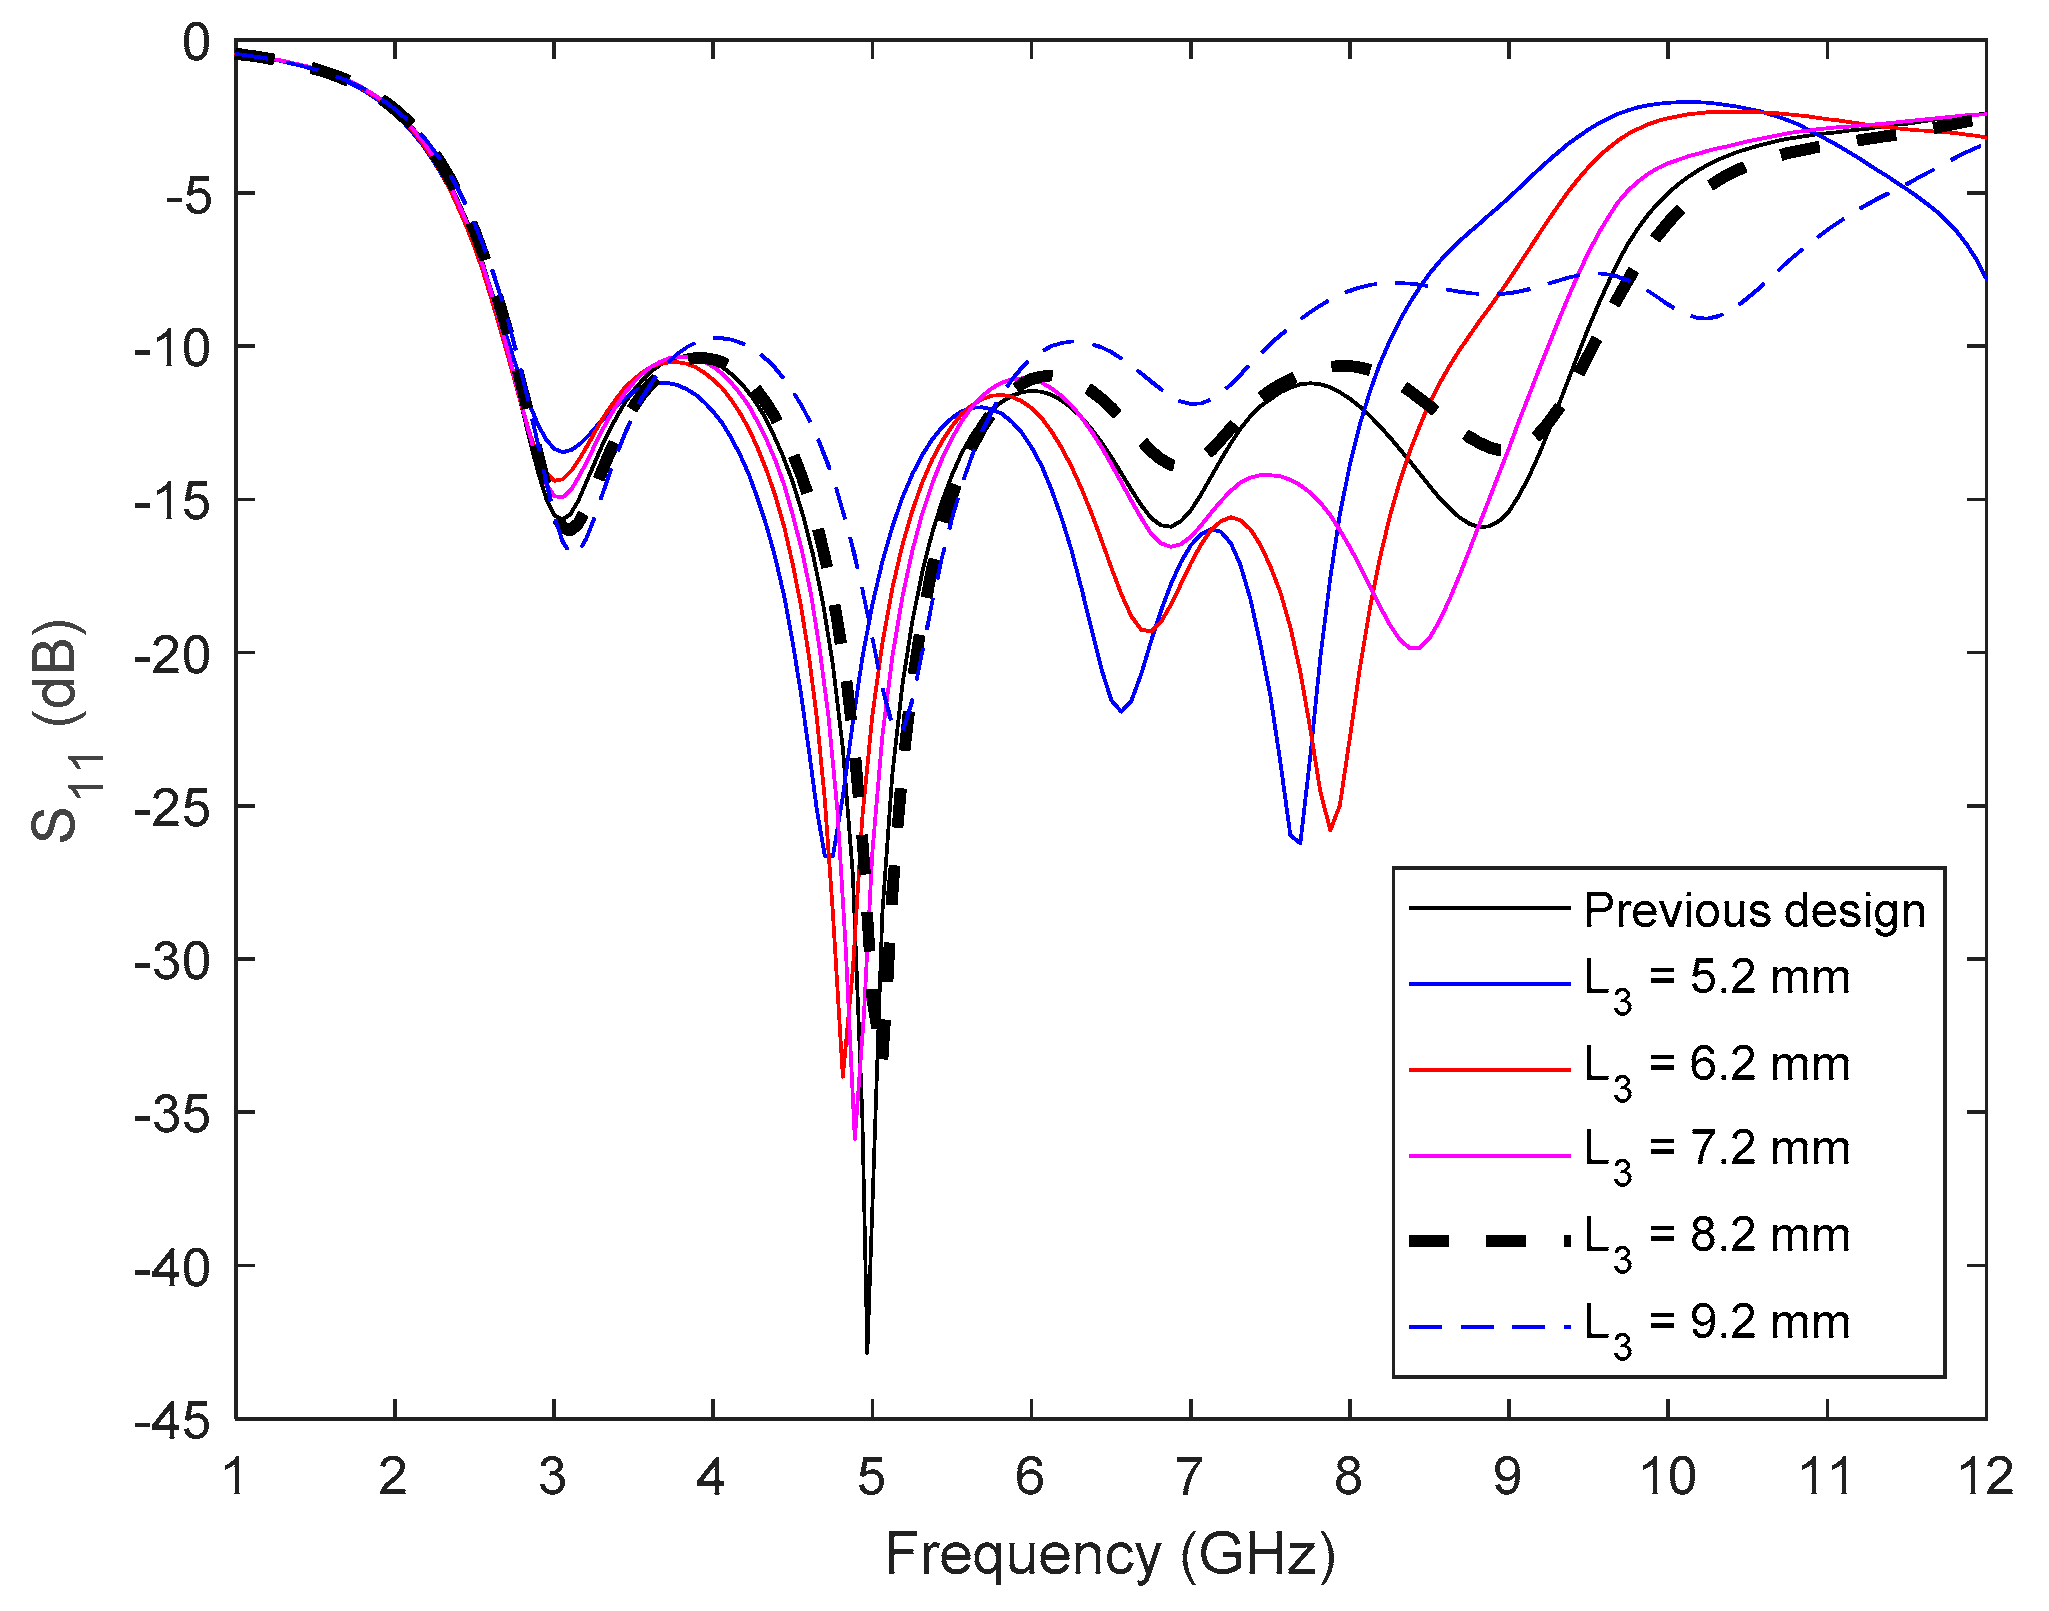
Likewise, a parametric analysis of the variable L 3 was carried out. The obtained results are shown in Figure 5. As can be seen, the distance from the feeding point significantly influences the behaviour of the antenna, modifying the position of the new resonant frequency and allowing a notable increase in the bandwidth. The best results were found for L 3 = 8.2 mm, obtaining an operating frequency range close to 111%.

2.4. Analysis of Slots in the Ground Plane

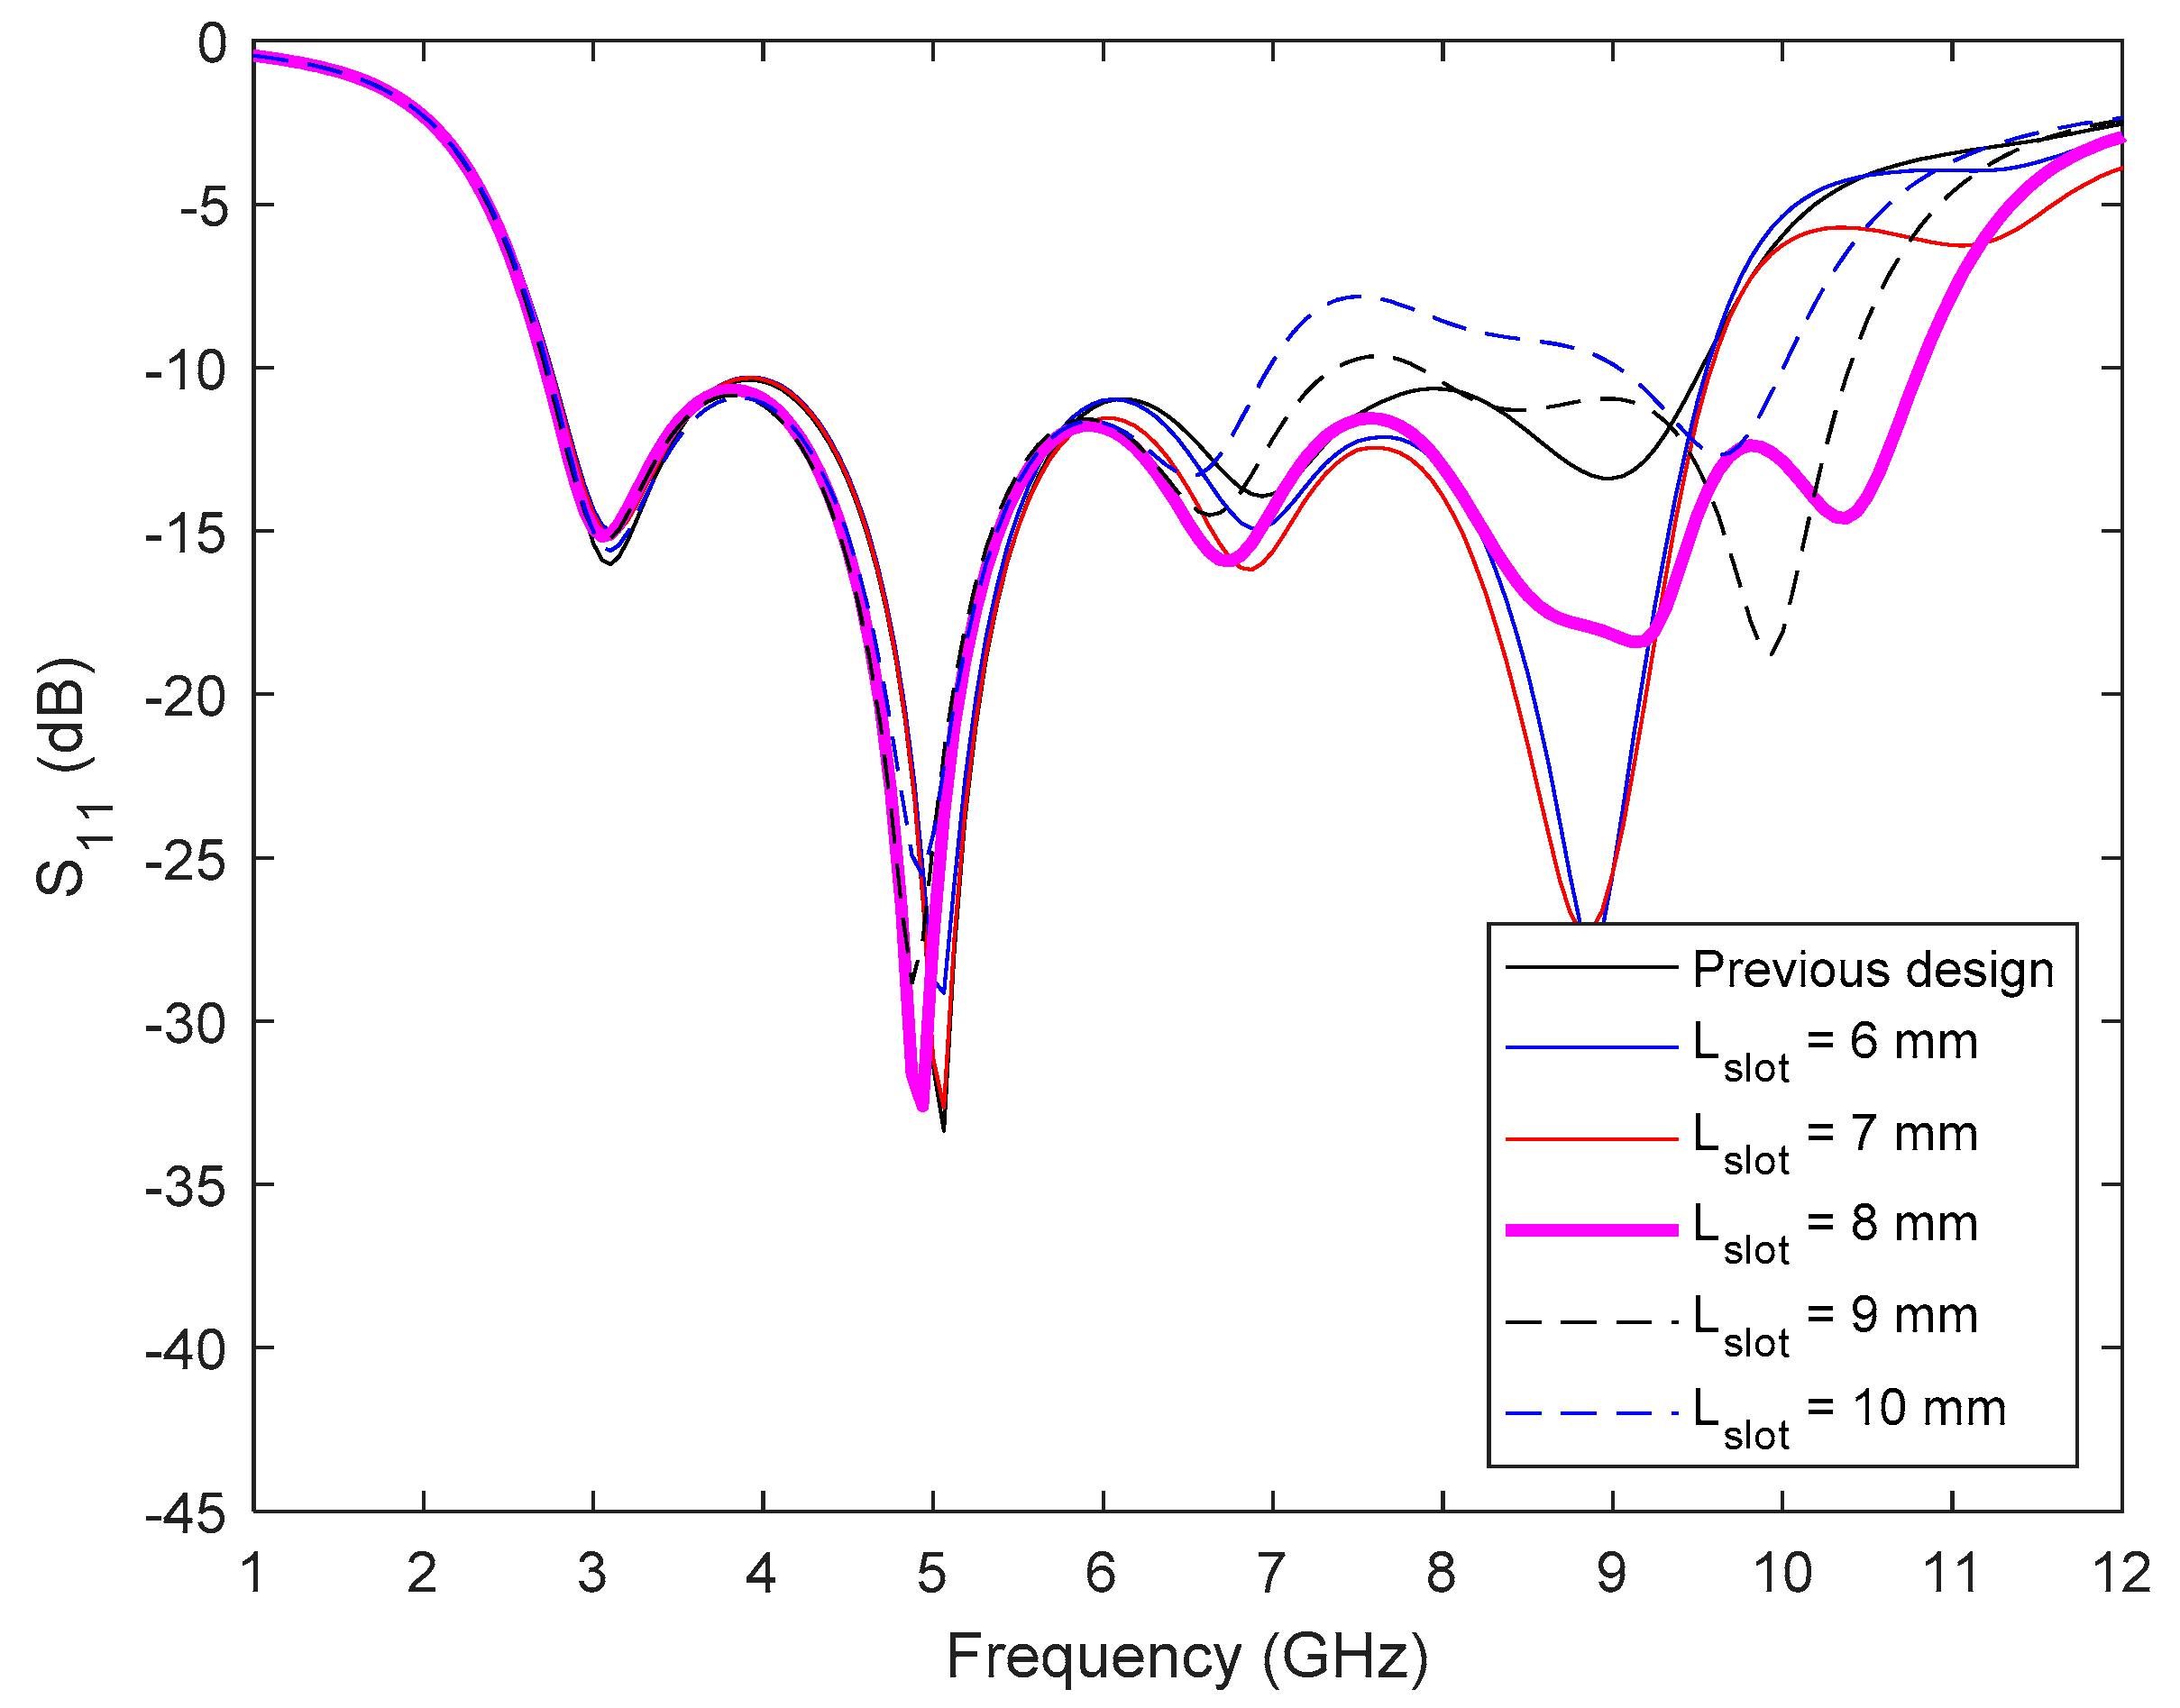
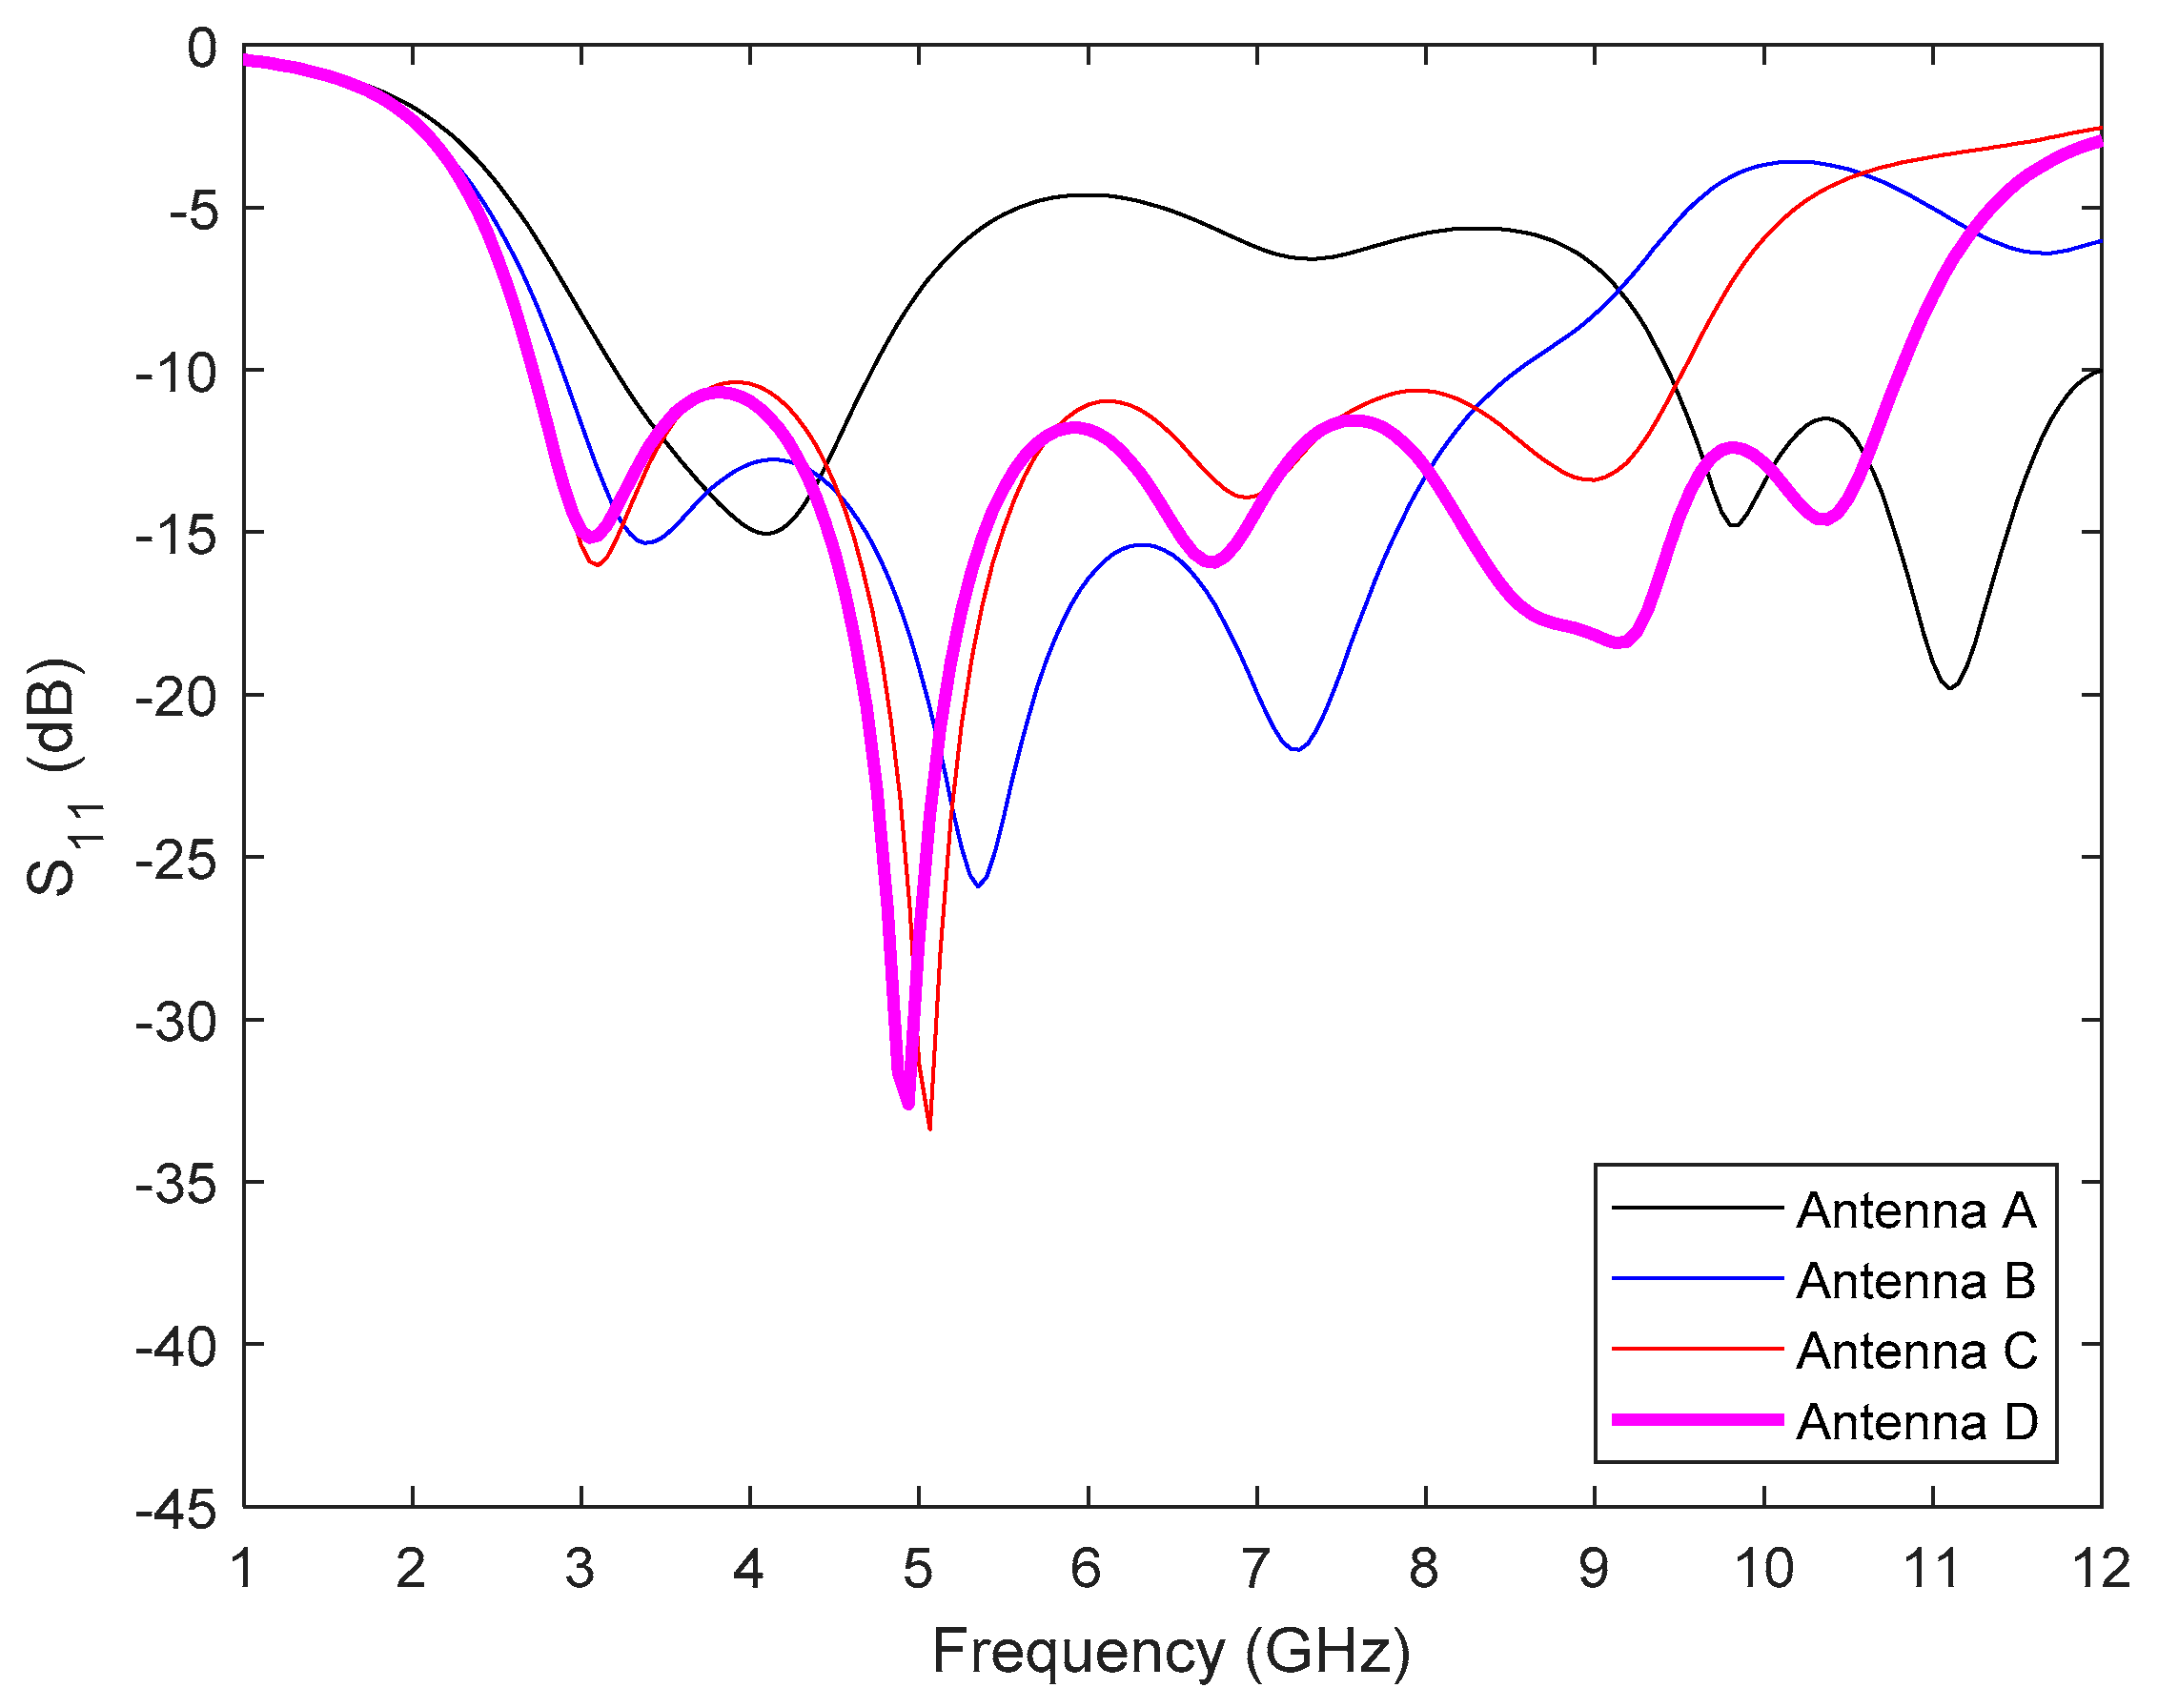
Finally, the last change performed in the antenna geometry in order to increase the frequency range is to insert a couple of rectangular slots in the ground plane of the antenna [35,36]. Figure 1d shows the antenna (Antenna D) with the different variables that define the dimensions of the slots. For the four variables analysed ( L s l o t , W s l o t , W 4 , and L 4 ) the one that has the greatest influence on the antenna behaviour is the length of the slots. Figure 6 shows the antenna response to different L s l o t values. As expected, the effect of the slots is focused on the higher frequencies, due to the small size of the slots. The best performance is obtained for a slot length of 8 mm, showing an operating frequency range of 2.71 GHz to 10.8 GHz, that implies a fractional bandwidth of 120% and covers the requirements of the antenna, both for the microwave medical imaging application and for UWB applications.
Table 1 summarizes the final dimensions of the designed antenna, and Figure 7 shows the response of the antenna in the different phases followed in the design, where the effect of each decision carried out in order to obtain the best antenna performance can be observed.
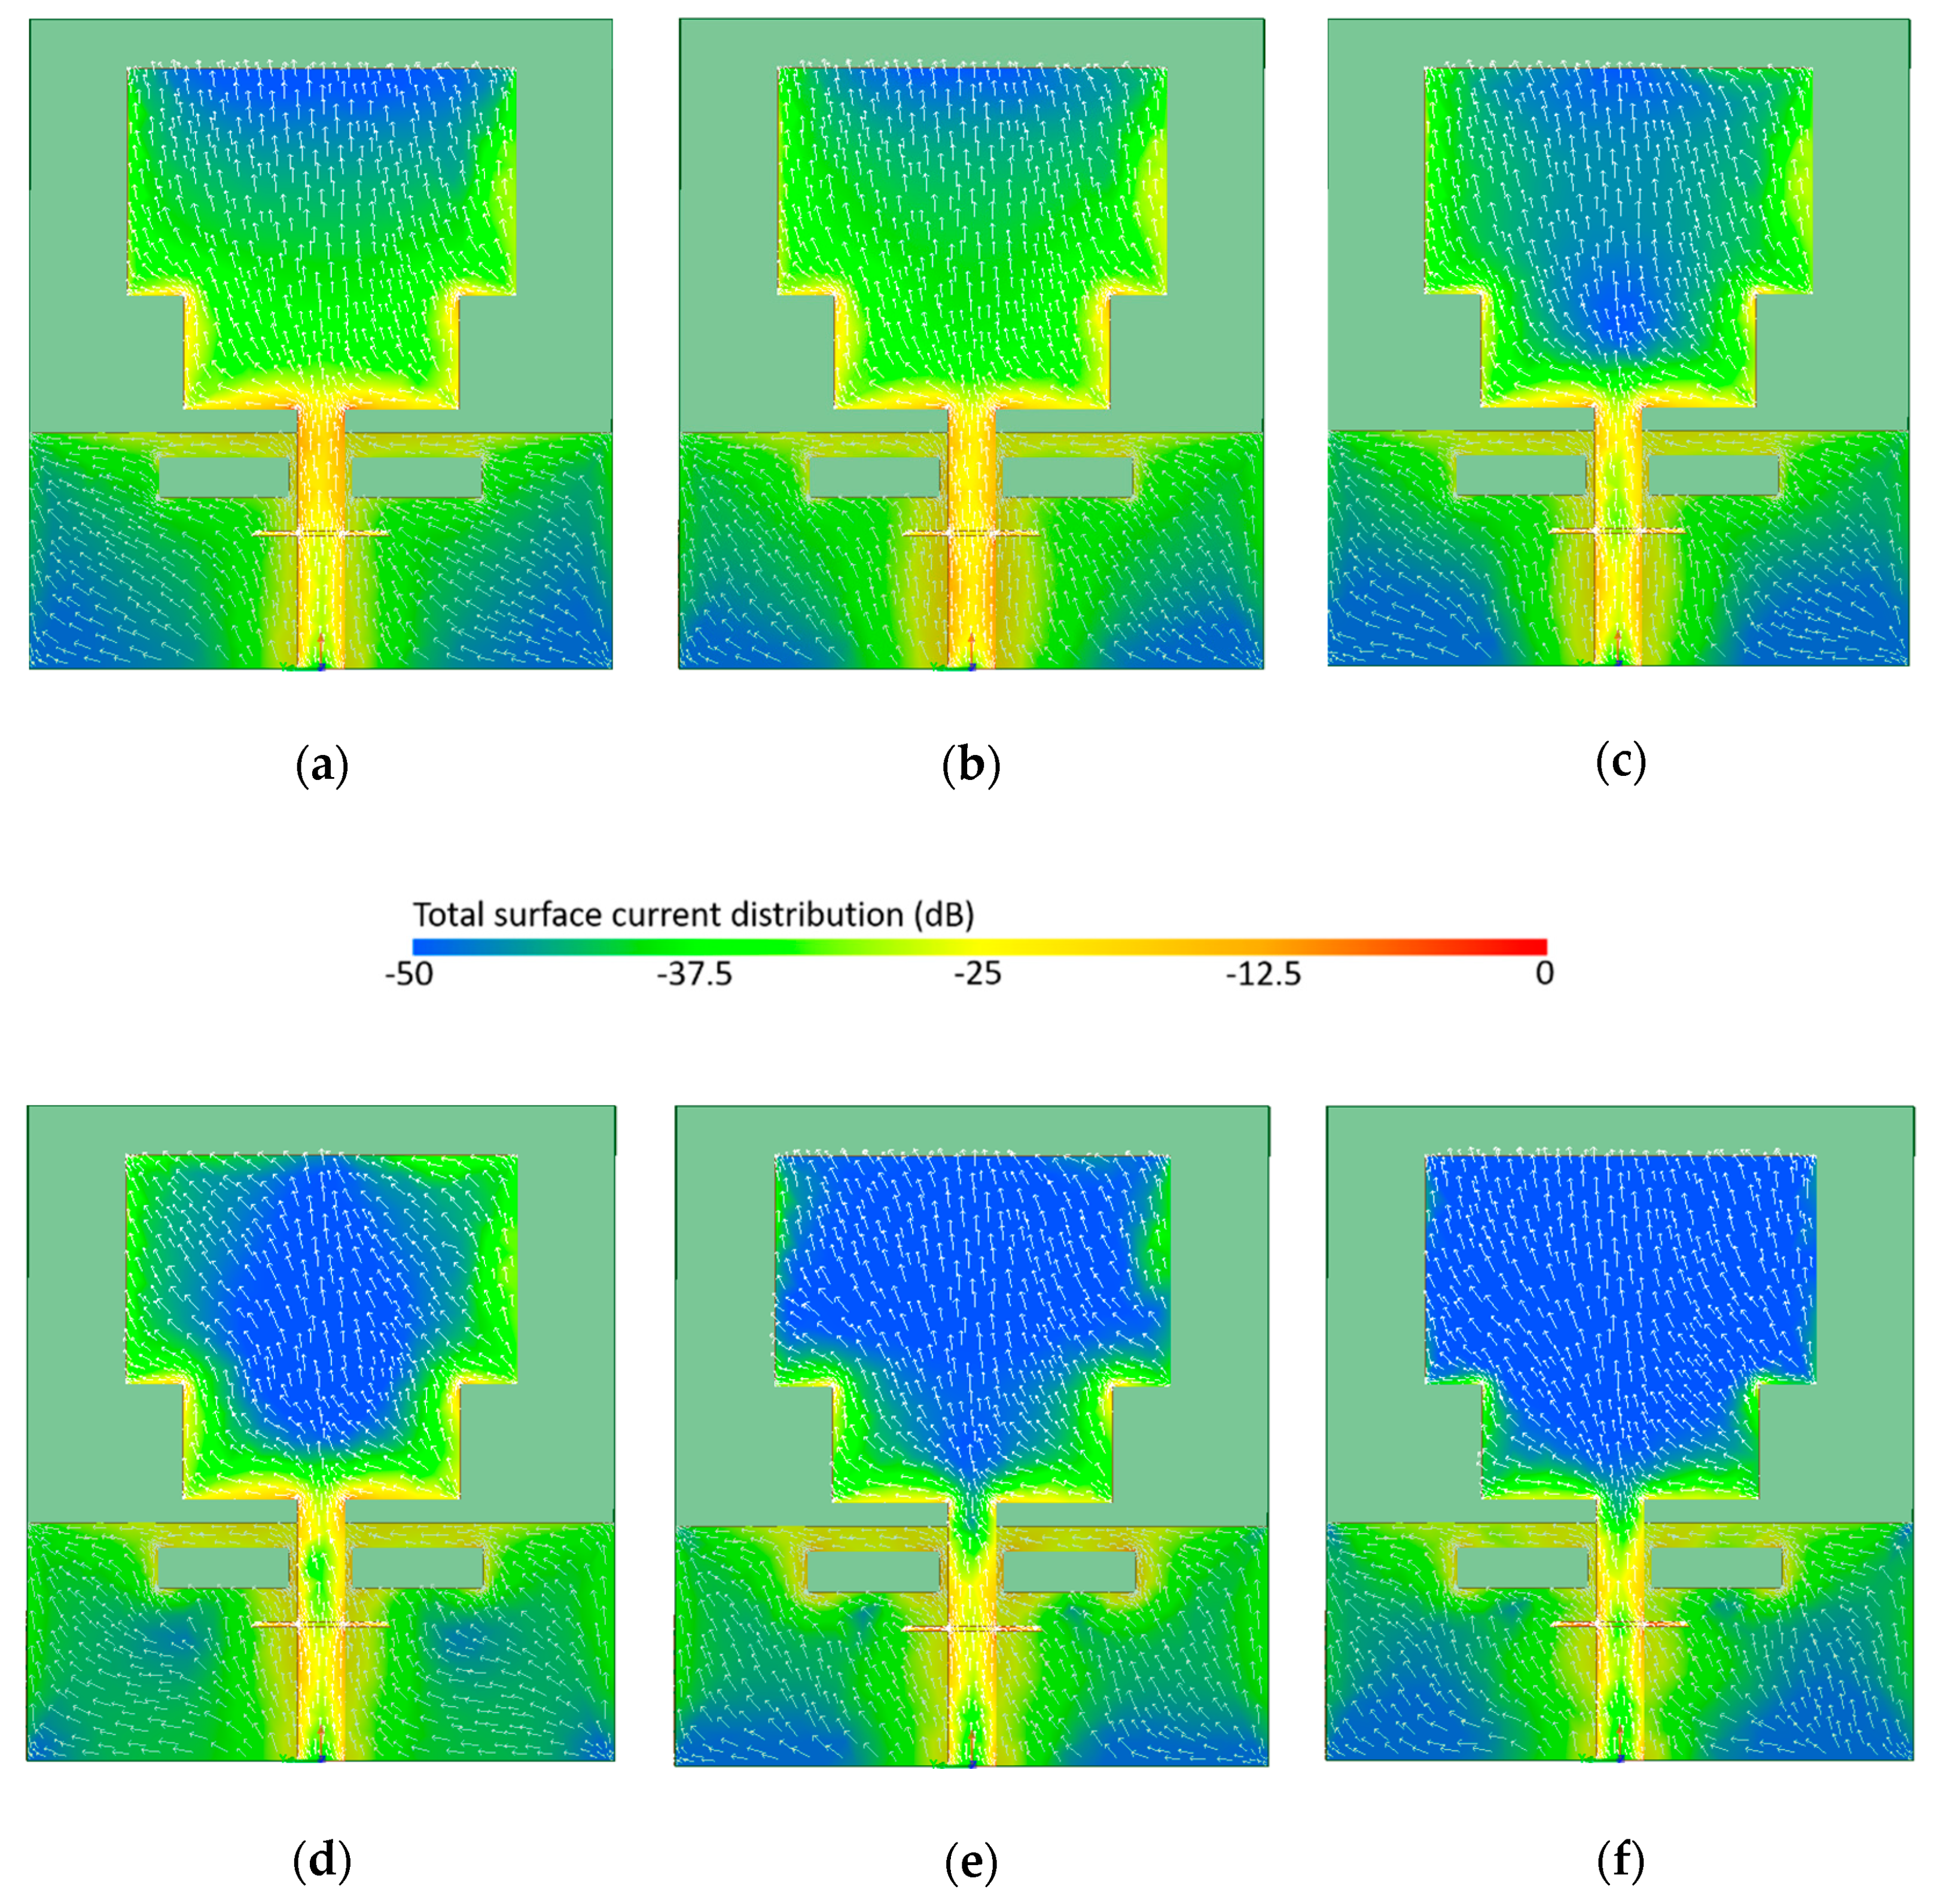
For a better understanding of the antenna working principle, the current density distribution in the antenna conductors was simulated. Figure 8 shows the results obtained for the most significant frequencies within the operating frequency range of the antenna. At low frequencies, a high current concentration can be observed in the rectangular patch of the antenna. For higher frequencies, it is observed how the rectangular patch has less influence and the current density is concentrated in the area around the strips and the slots of the ground plane.

3. Results

Once the antenna was designed, it was manufactured onto a low-cost FR4 substrate following a photolithography and chemical process. Figure 9 shows a photograph of the manufactured prototype. The final size of the antenna is 36 × 40 mm2.
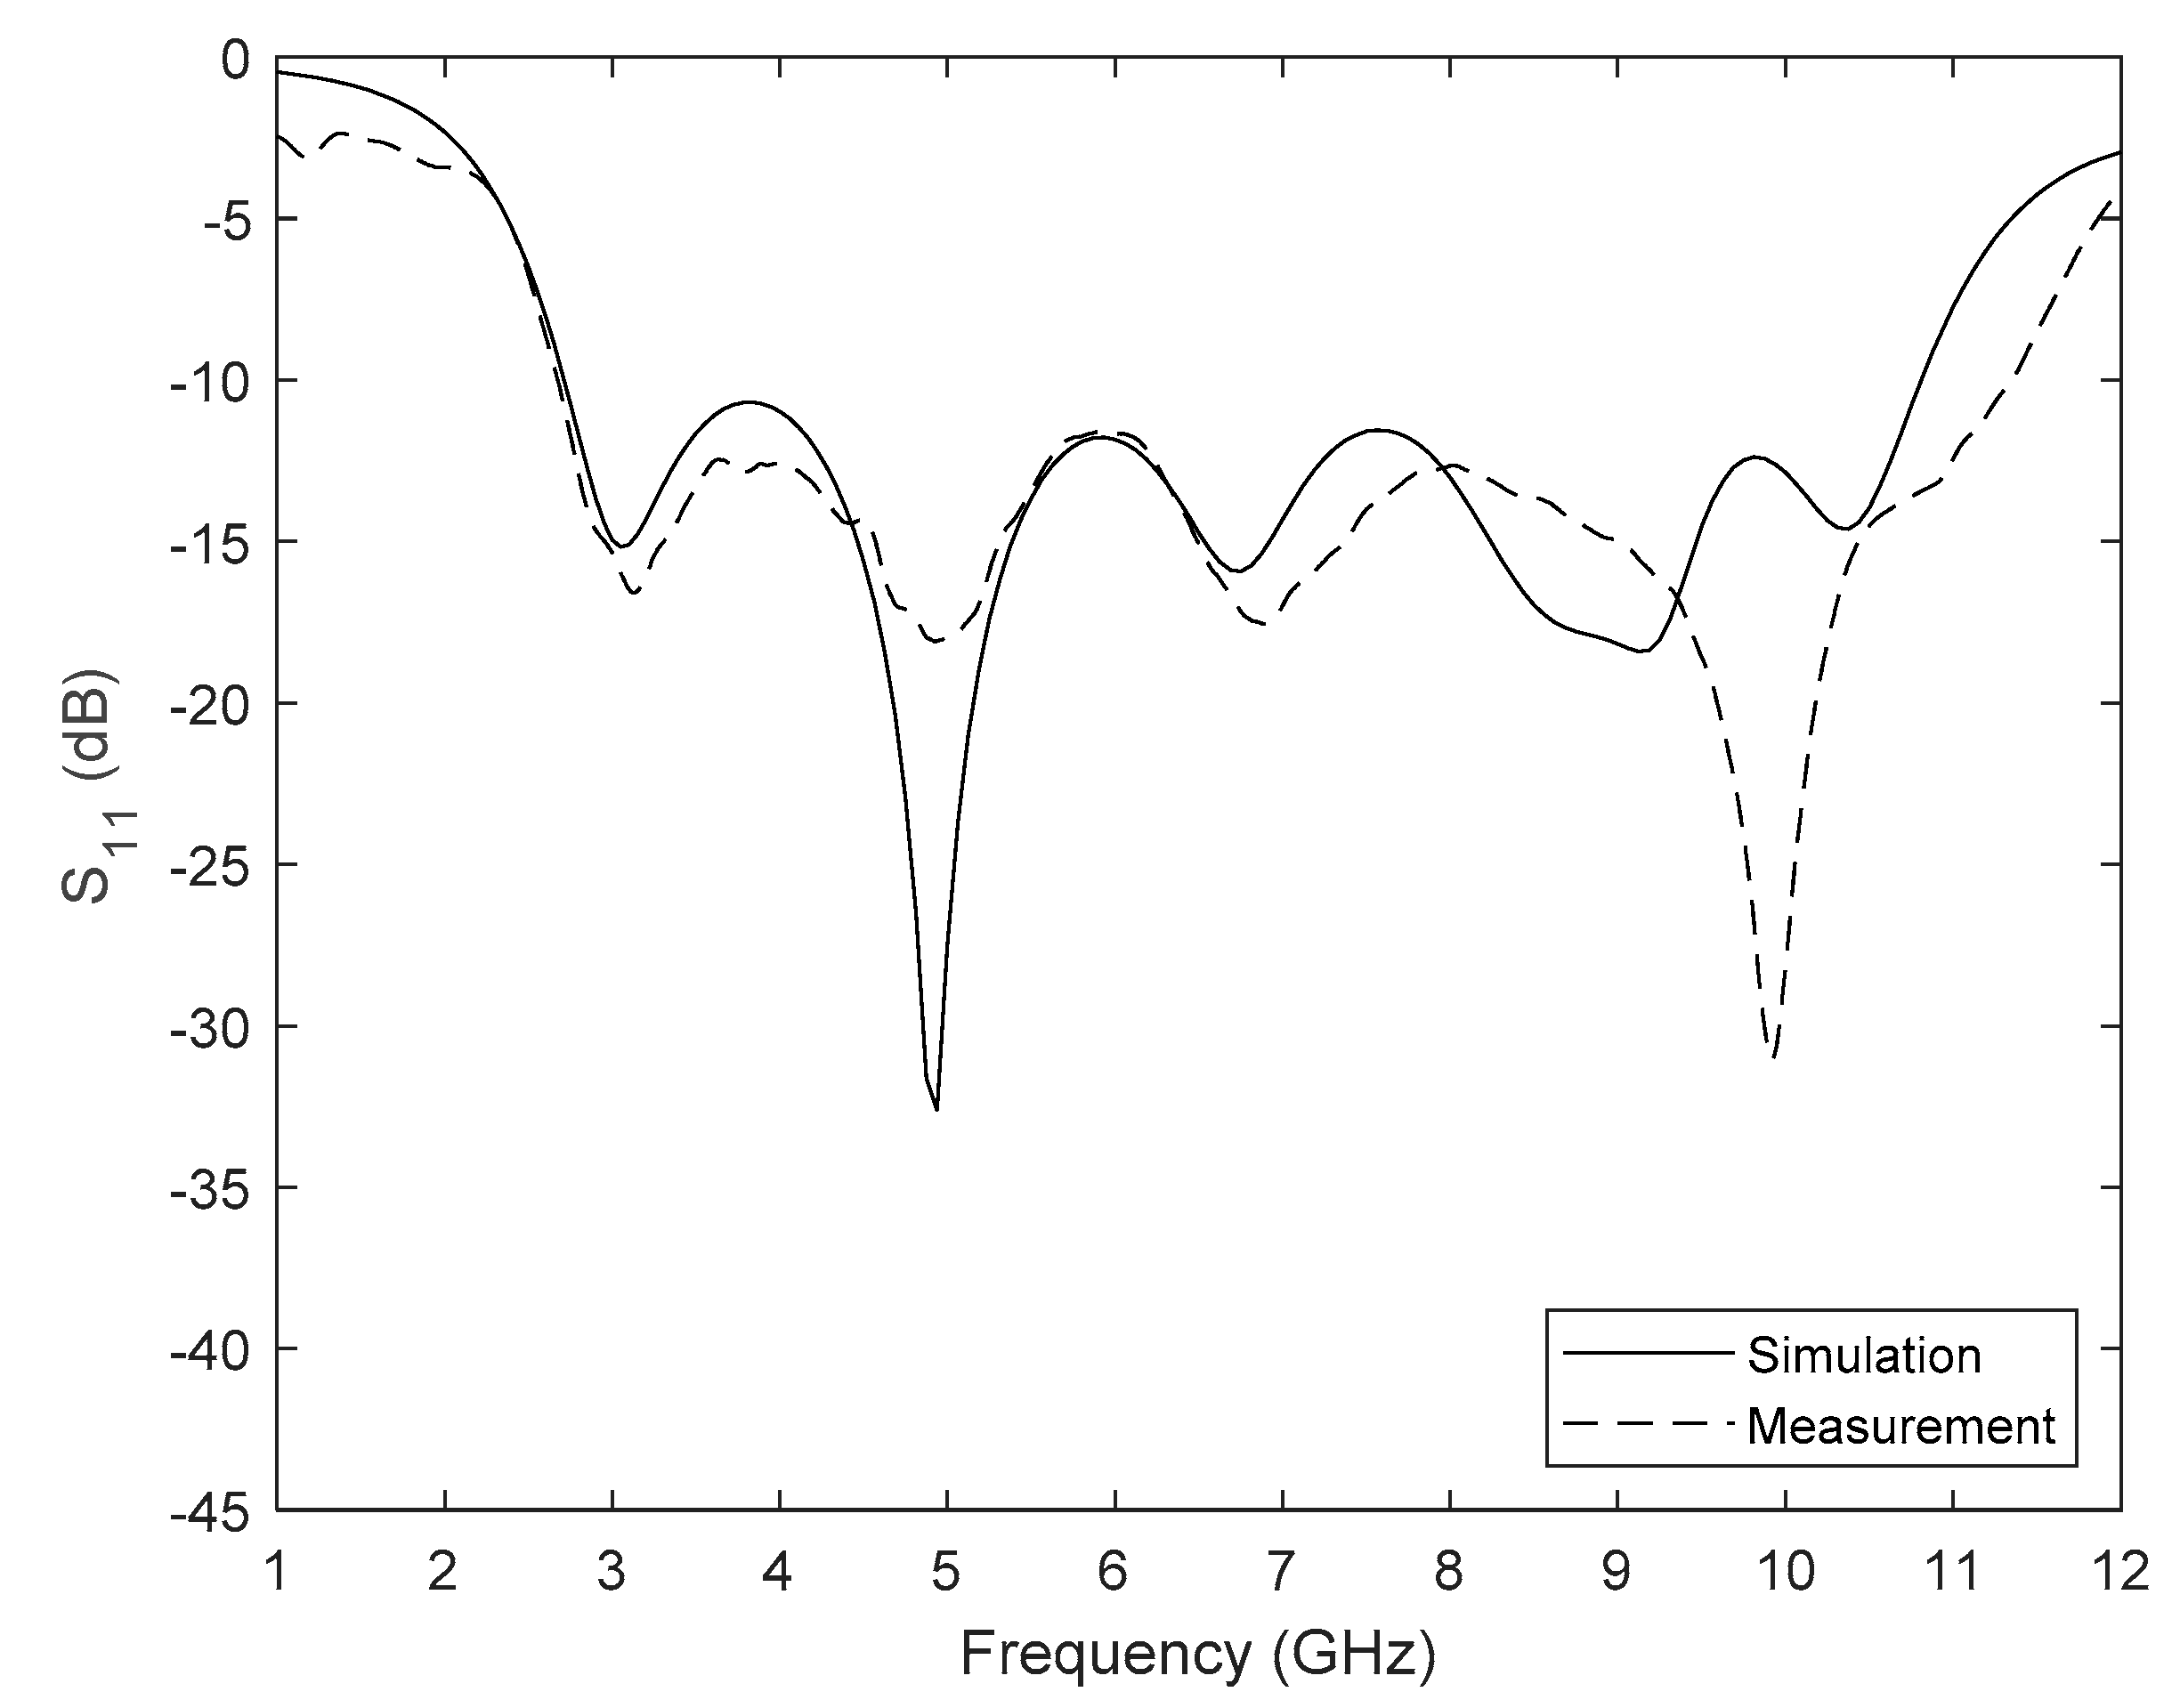
Figure 10 shows the simulated and measured reflection coefficient of the antenna. The measurements were made with a Vector Network Analyzer (E8363B from Agilent Technologies, with a measurement range from 10 MHz to 40 GHz). As can be seen in the results, there is a good agreement between measurement and simulation, especially at low-medium frequencies, which validates the design and optimization process carried out with simulations. The working frequency range of the antenna, measured for S 11 < −10 dB, ranges from 2.68 GHz to 11.36 GHz, which implies a bandwidth of 8.7 GHz (around 124%) and covers the UWB requirements and those of the proposed imaging application.
The antenna radiation patterns were obtained inside an anechoic chamber with a horn antenna as a reference. Figure 11 shows the measured results obtained with the VNA for the two main planes of the antenna, E and H. For a better visualization of the results and to improve the understanding of the diagrams, they have been divided into two graphs and are presented at the most important frequencies of the antenna. As can be seen, the antenna diagrams show omnidirectional behaviour, typical for this type of monopole antennas. The cross-polar component was calculated, obtaining a relation between the polar and cross-polar components higher than 20 dB for frequencies below 8 GHz and higher than 10 dB for frequencies between 8 GHz and 10 GHz. Simulated diagrams present a similar response to the measured diagrams shown.
Finally, Figure 12 shows the results obtained for the antenna gain. The simulated results were calculated every 200 MHz (represented with crosses in the figure), and the measured ones were obtained every 0.5 GHz (represented with black dots) within the bandwidth of the antenna. As can be seen, the results are similar, with a measured gain ranging between 1.3 dBi and 6.6 dBi.

Time Domain Analysis

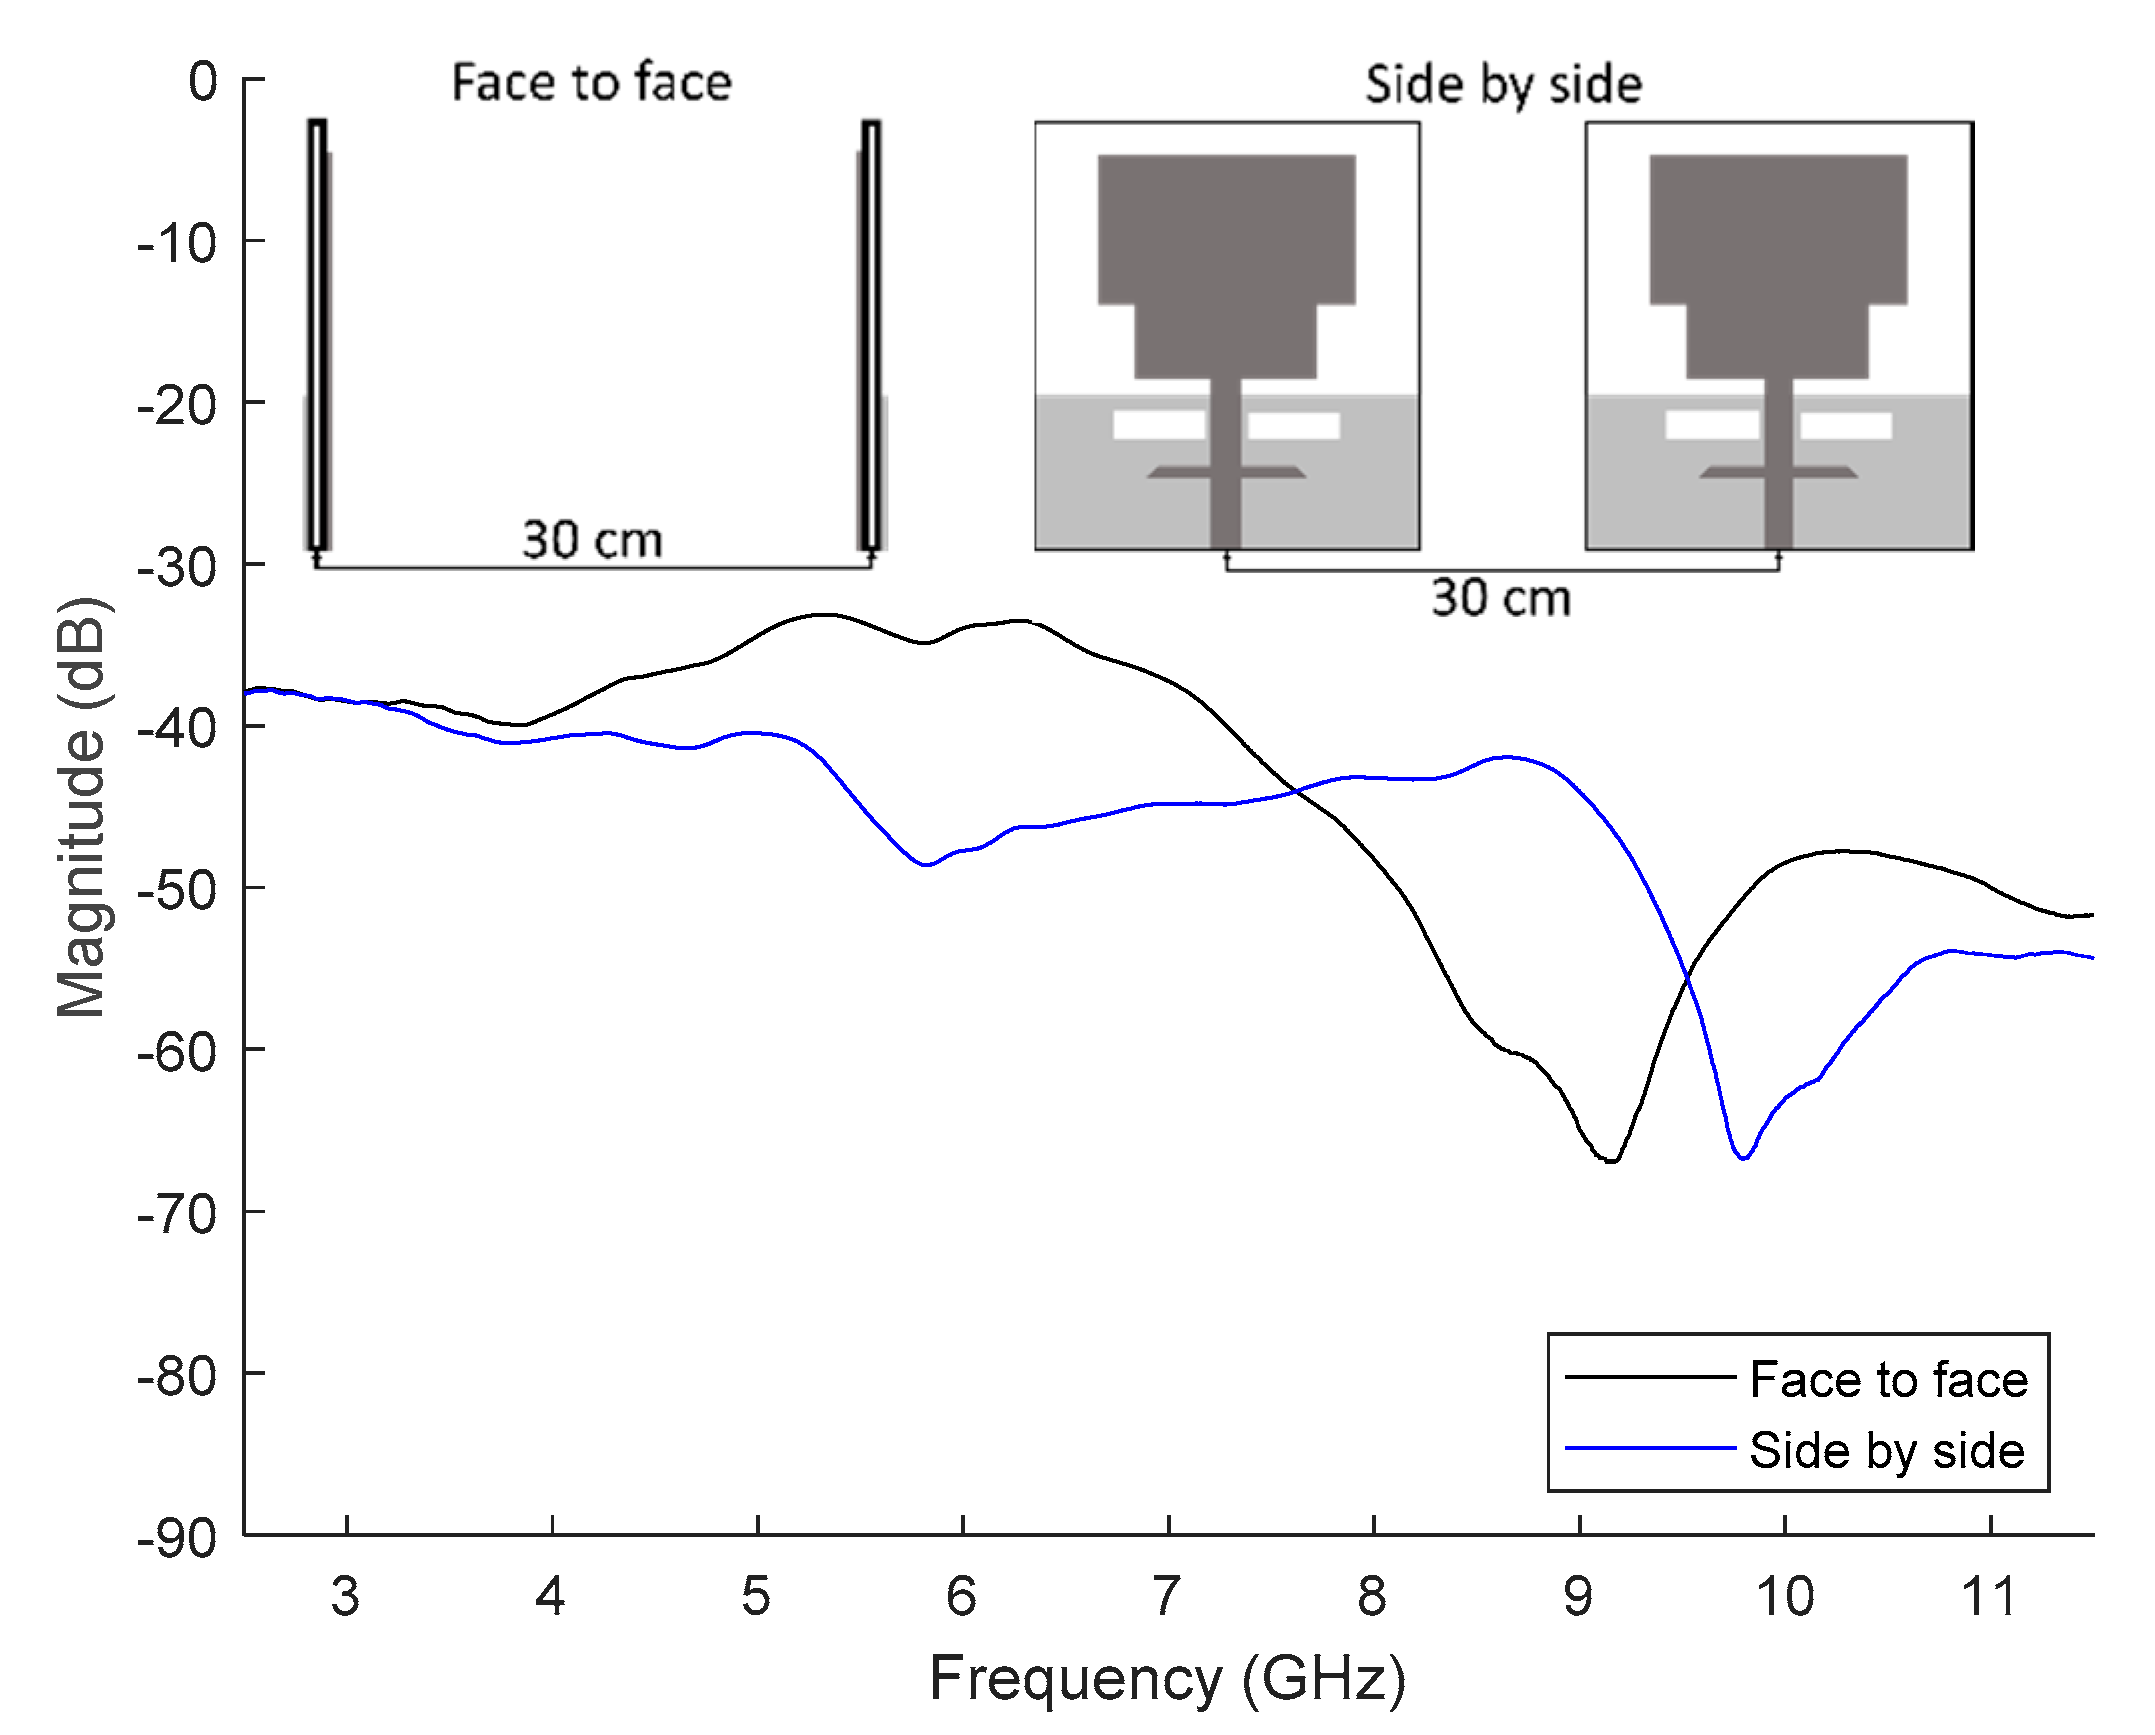
To evaluate the characteristics of the designed antenna as a UWB or broadband antenna, a series of transmission tests were carried out with two identical antennas. The setup used for these measurements consists of two antennas located inside an anechoic chamber and separated by a distance of 30 cm, enough to ensure far field transmission. Under these conditions, the transmission parameter, S 21 , was measured with the VNA for the two antennas located vertically (face-to-face) and horizontally (side-by-side). Figure 13 shows the results obtained for the transmission parameter (module of the S 21 in dB), as well as a diagram of the antenna configuration in both cases analysed. As can be seen in the figure, the transmission between the two antennas in both configurations is similar, obtaining a higher level in the face-to-face configuration. There is also a minimum in the received signal in both cases around 8 GHz –10 GHz, which agrees with the measured radiation patterns and antenna gain at these frequencies.
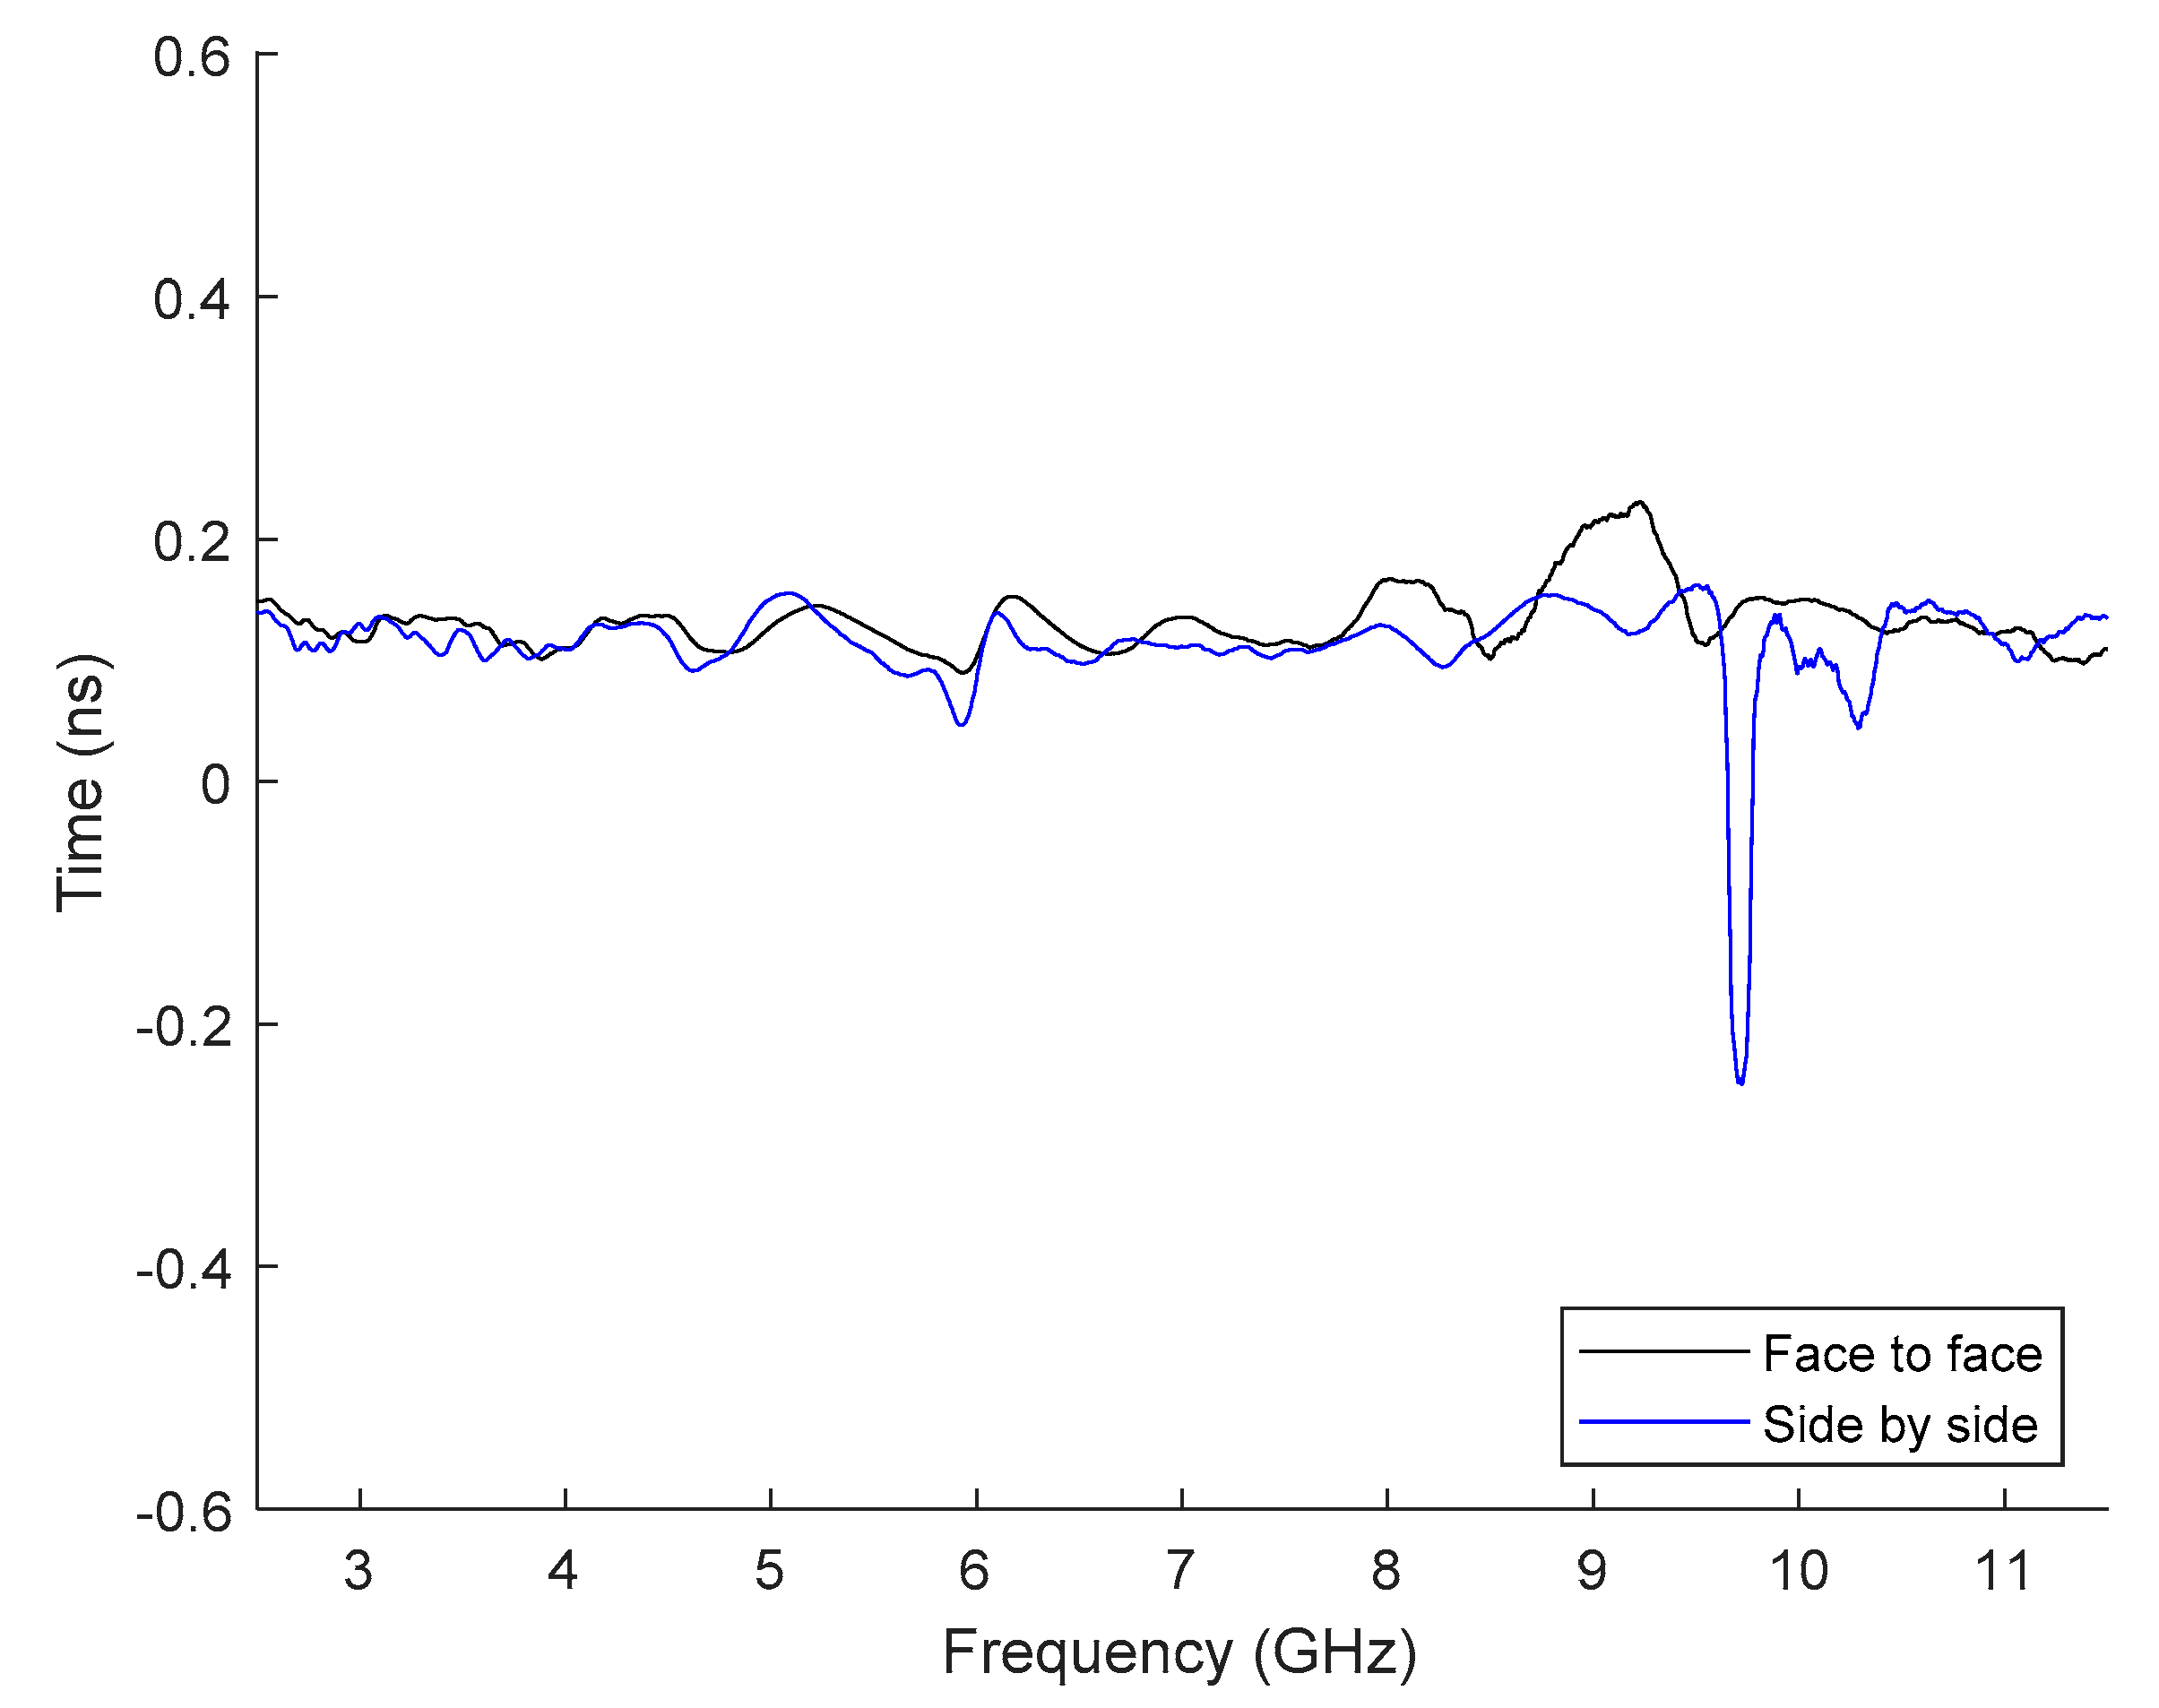
From the phase of the S 21 parameter, the group delay of the system can be calculated. Figure 14 shows the results obtained for the group delay in the two configurations analysed. As can be seen, the group delay remains fairly stable, with less than 1 ns variation within the antenna operating frequency band, ensuring the transmission of broadband pulses without distortion [37].
To check the characteristics of the antenna with broadband signals, such as those used in UWB communications or in medical imaging systems, the transmission of a broadband pulse was analysed in the two configurations previously studied, face-to-face and side-by-side. The pulse used is based on a Gaussian pulse. The Gaussian pulse is defined in (4), where σ is the pulse width at half power [38].
G ( t )   =   1 2 π σ · e ( t 2 2 σ 2 )
The broadband pulse used in this work is the seventh derivative of the Gaussian pulse, whose expression is the following:
G 7 ( t )   =   d 7 G d t 7   =   ( 1 ) 7 · 1 ( 2 σ ) 2 · H 7 ( t 2 σ ) · G ( t )
where H 7 ( t ) is the 7 t h -order Hermite polynomial, defined in the following expression:
H 7 ( t )   =   128 t 7 1344 t 5 + 3360 t 3 1680 t
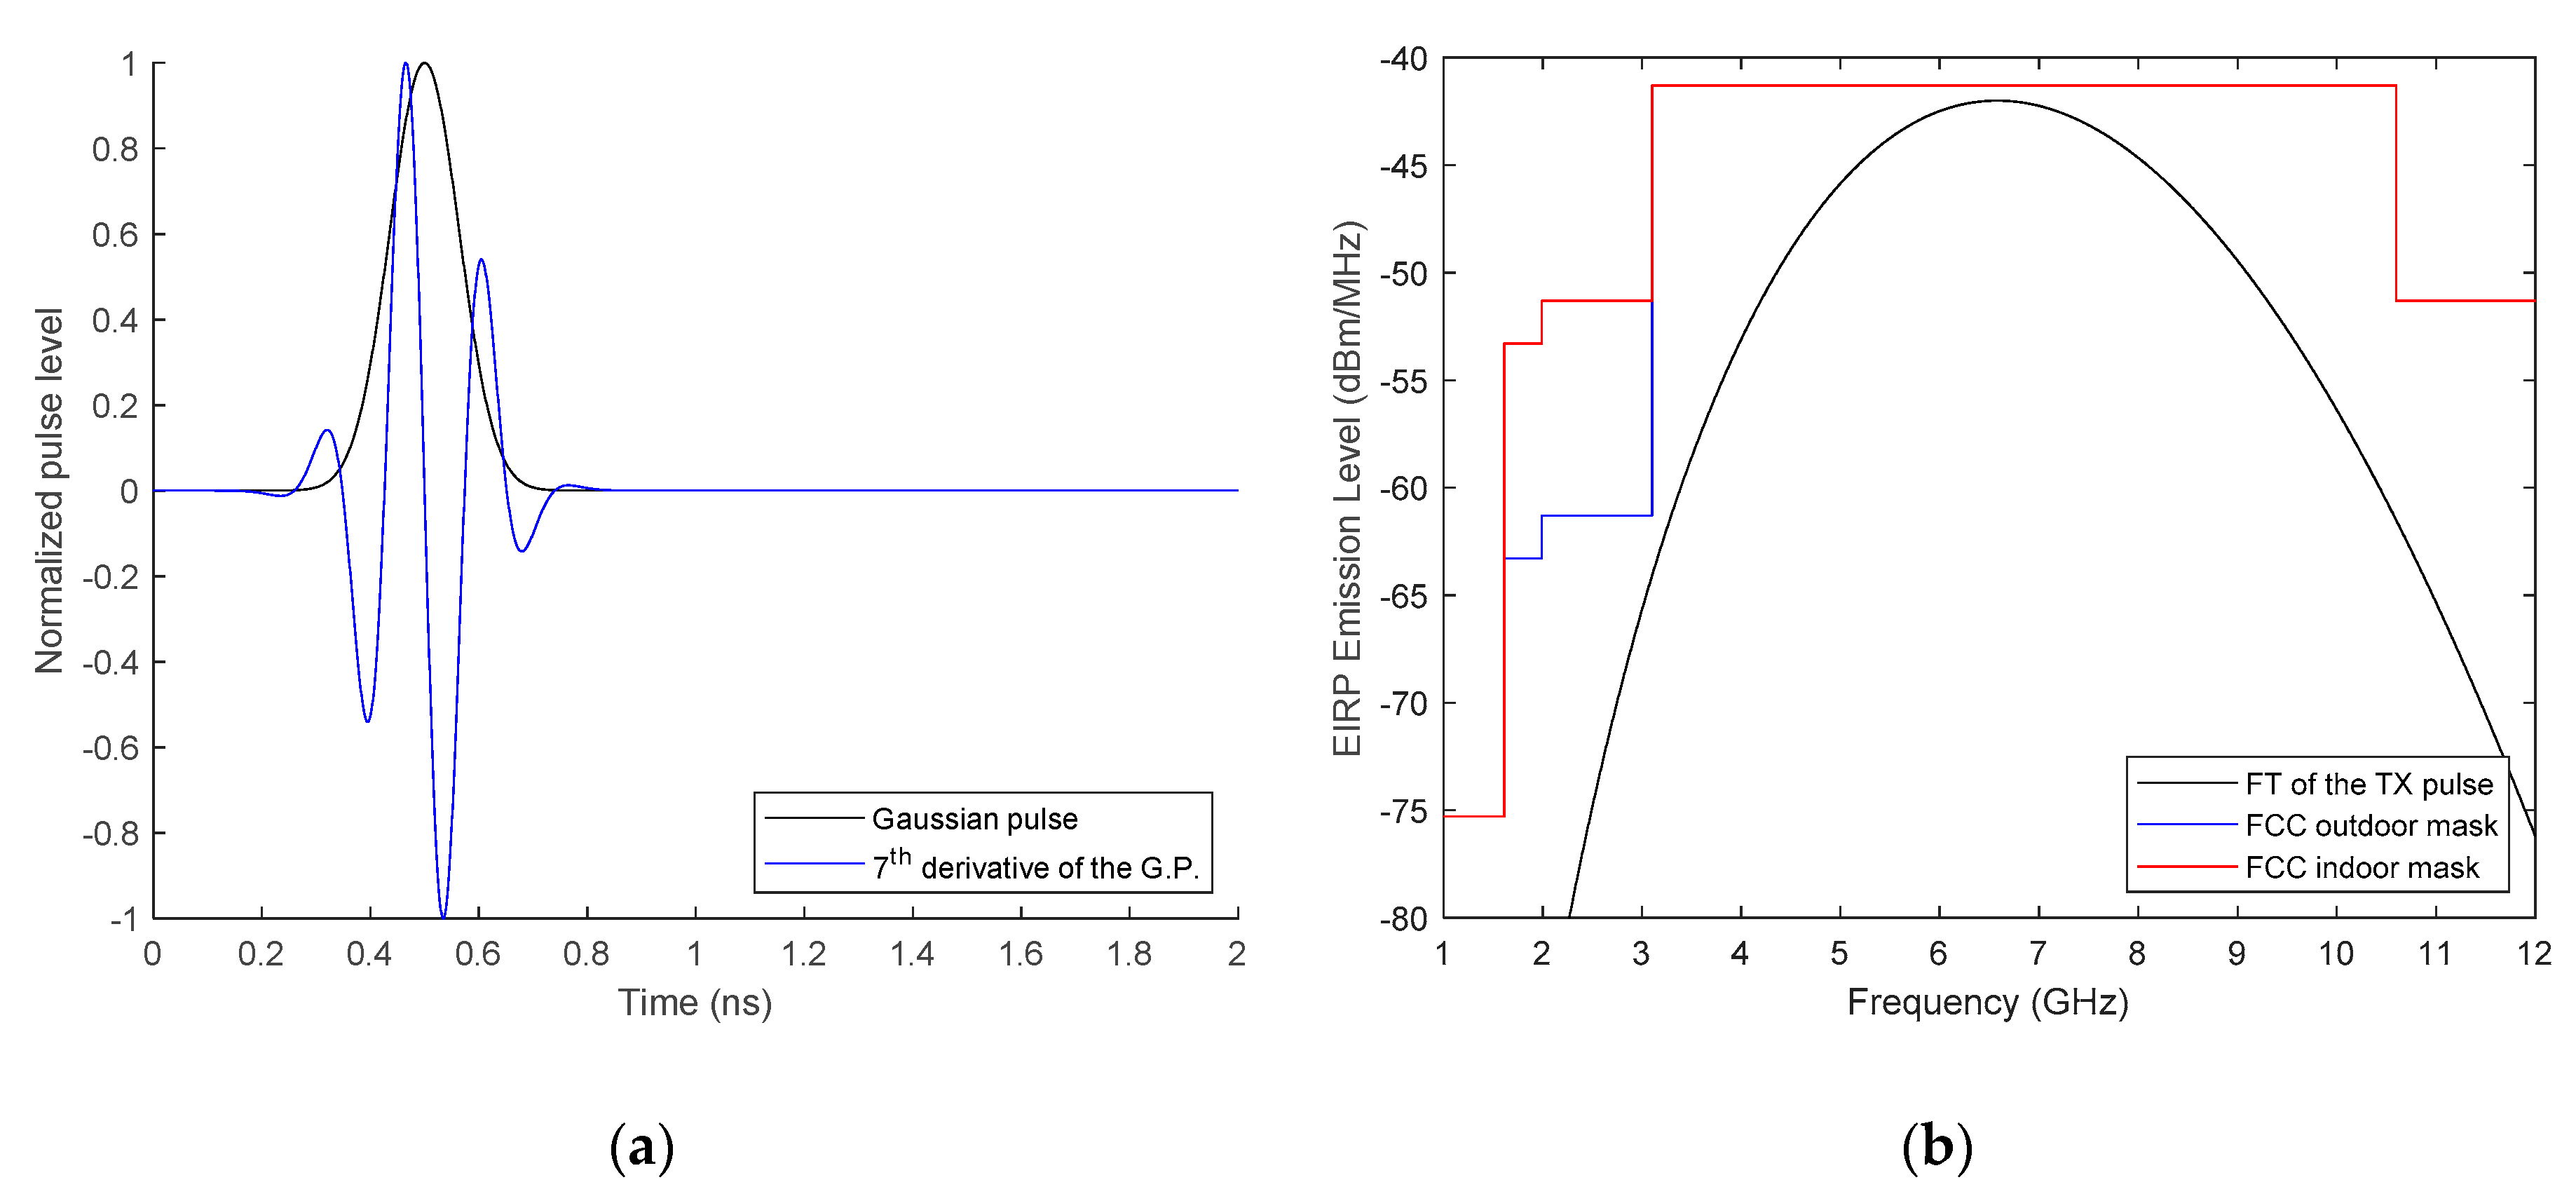
The seventh derivative of the Gaussian pulse, G 7 ( t ) , is used because its spectrum fits the frequency mask imposed by the Federal Communication Commission, FCC, for the UWB standard, both for indoor and outdoor communications. Figure 15 shows the time and frequency response of the pulse used, as well as the frequency masks used in the UWB standard.
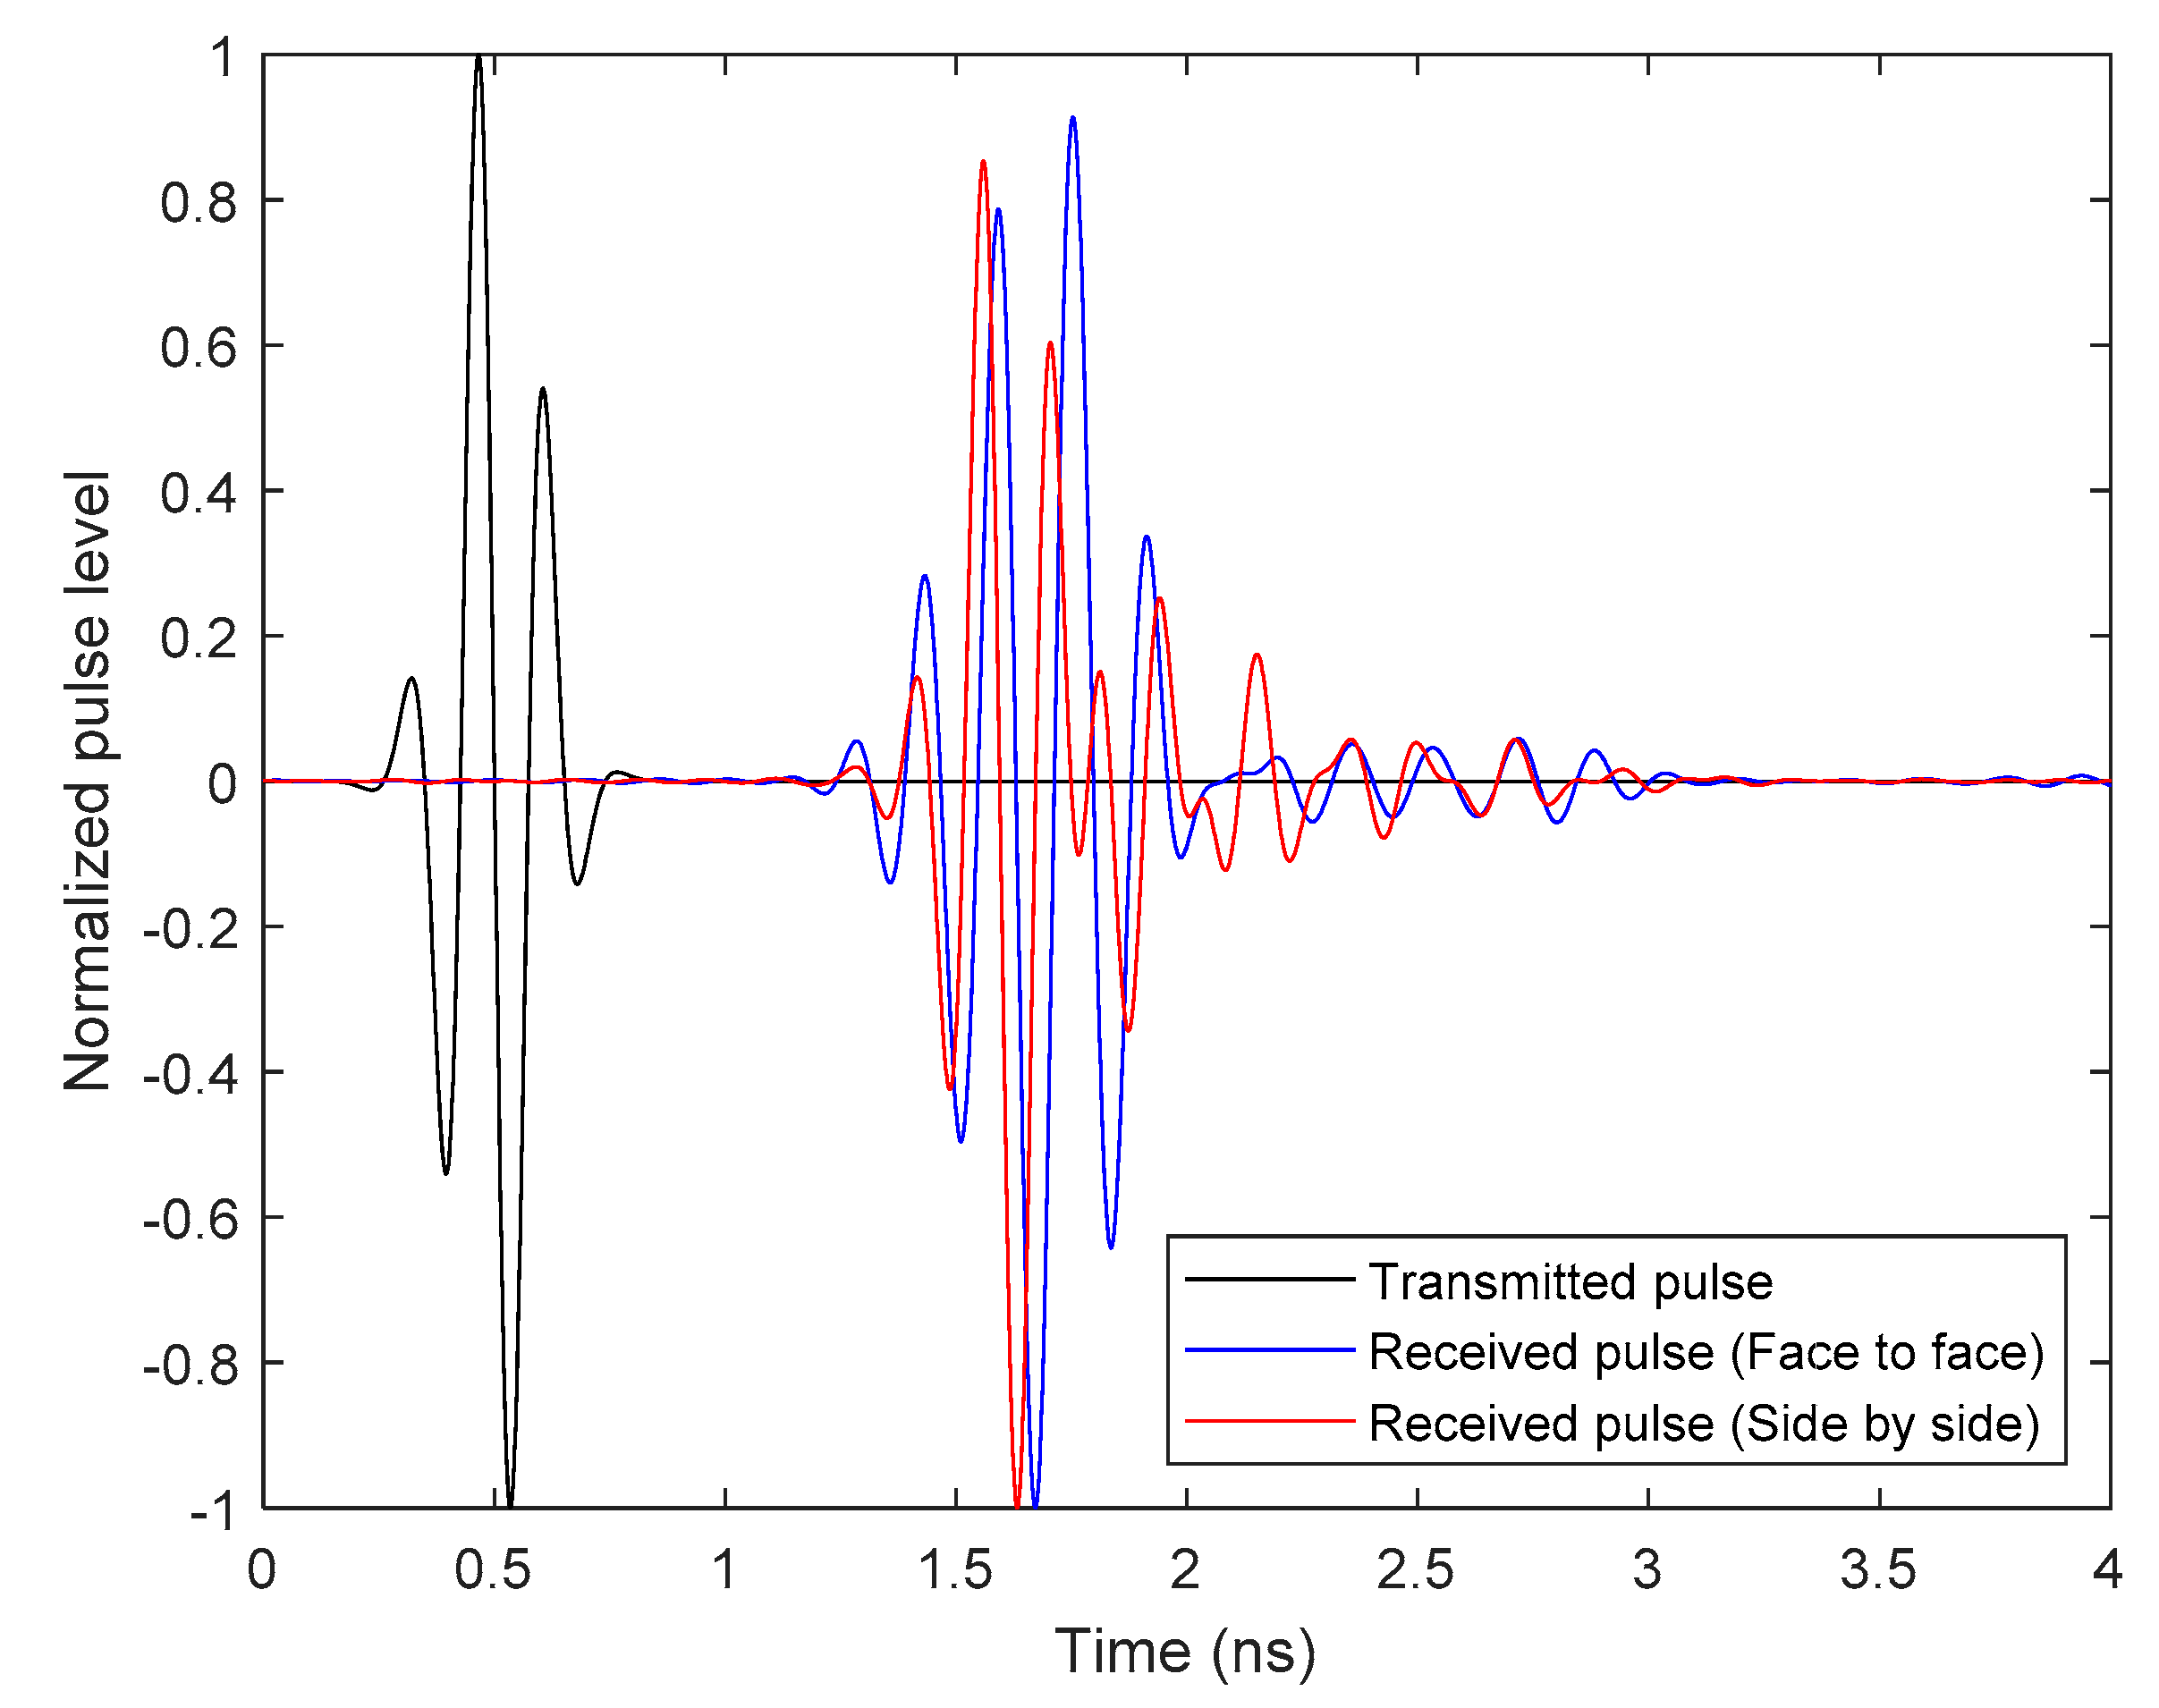
Once the broadband pulse used for the evaluation of the time domain antenna characteristics has been selected, the pulse is transmitted in the two configurations studied, and the received pulse is analysed. In Figure 16, the time domain-received pulses are shown, together with the transmitted one. As can be seen, the pulses received in both configurations are very similar to each other and to the transmitted pulse.
To numerically evaluate the similarity between the transmitted and received pulses, the System Fidelity Factor, SFF, is obtained. This factor calculates the relationship between the energy of the convolution between the transmitted and received pulse and the energy of each pulse separately [39]. The expression for the calculation of the SFF is:
S F F   =   m a x n | + T s ( t ) R s ( t + τ ) d τ + | T s ( t ) | 2 d t · + | R s ( t ) | 2 d t |
where T s is the transmitted pulse and R s is the received pulse.
The SFF was calculated for the two configurations analysed, obtaining quite high values, shown in Table 2, that shows that the received pulse is very similar to the transmitted one, ensuring the integrity of the transmitted signal by the antennas.
Finally, once the antenna characterization process was finished, the designed antenna was compared with other antennas, designed for similar applications in the literature. As can be seen in Table 3, the proposed antenna has a reduced size in relation to the minimum operating frequency, a very high bandwidth, and a gain with medium values, with a variation in the operating frequency range around 5 dB. It is also outlined the high fidelity factor of the proposed antenna and the simplicity of the design.

4. Study of the Influence of Biological Tissue

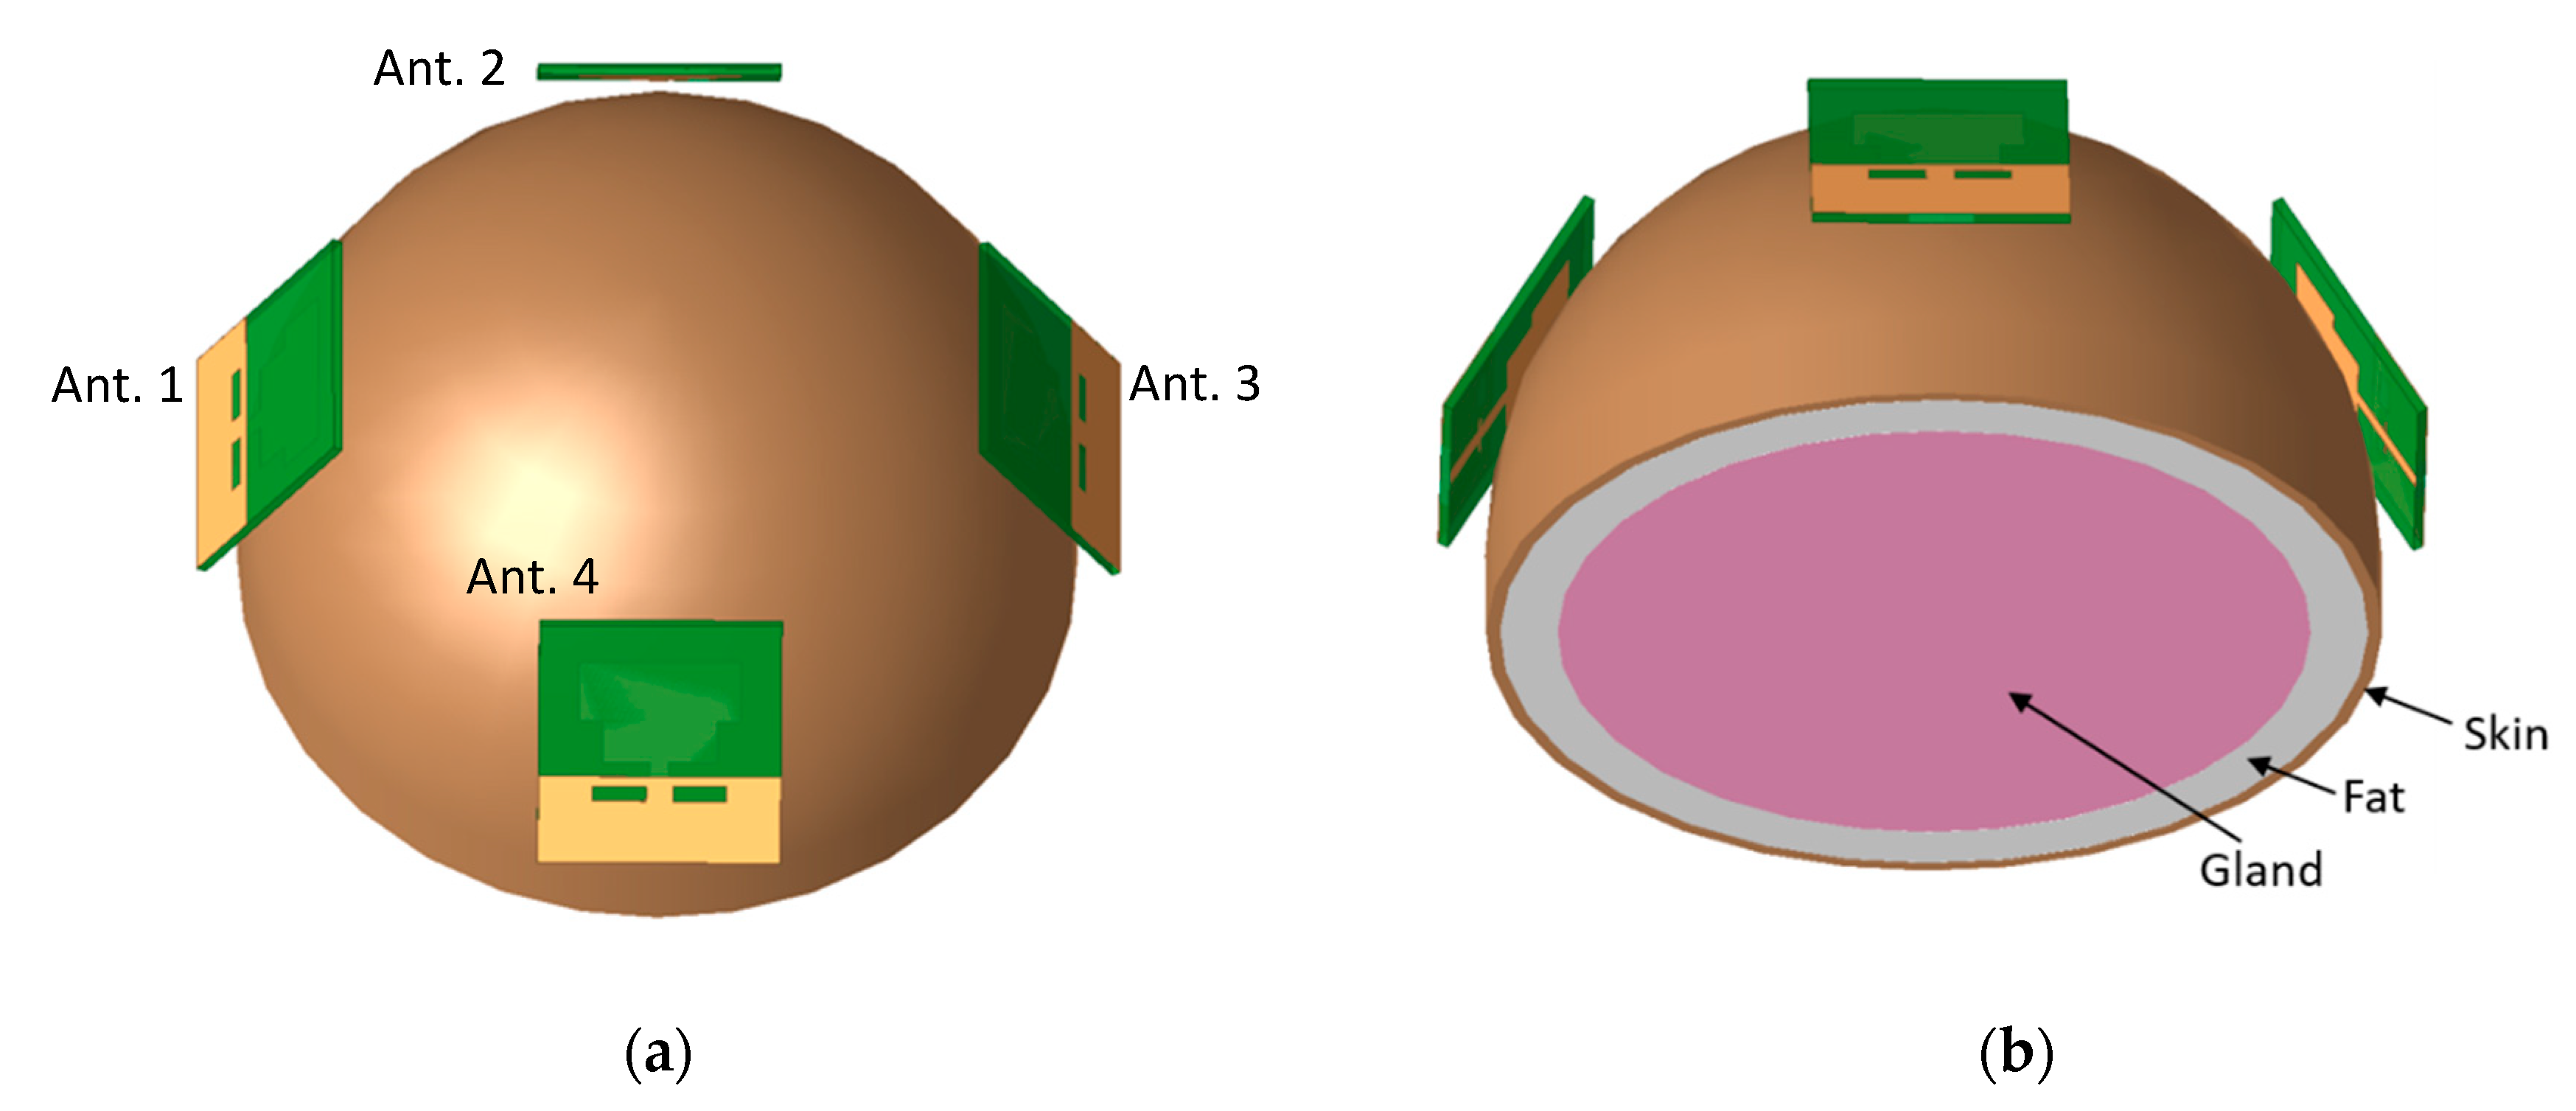
The designed antenna is planned to be used as a radiating element in a medical imaging system in the microwave range. As a proof of concept, to evaluate the antenna behaviour in the imaging system, a simple set-up of four antennas around a realistic breast model with three layers of biological material was constructed. Figure 17 shows the position of the antennas and the designed breast model.
The breast model and the antennas were designed with Autodesk Inventor software to provide greater precision to the model and to place the antennas around the breast more accurately. The antennas were located concentrically to the breast model and were separated by 2 mm. Once the model was made, it was exported to the EMPro electromagnetic simulator software and both the properties of the defined materials and the simulation options were adjusted. To give the model more realism, the breast model was designed with three layers of biological material with size and dielectric properties compatible with skin, fat, and breast glands. For the dielectric properties, a dispersive model that follows the Debye equation was used. The Debye approach is widely used to model the frequency dispersion of the dielectric properties in biological tissues [40,41]. The expression is as follows:
ε   =   ε i n f +   ε 0   ε i n f 1 + j ω τ
where ε 0 is the dielectric constant at zero frequency, ε i n f is the dielectric constant at very high frequencies (in infinite), and τ is the relaxation constant, expressed in seconds.
Table 4 summarizes the dielectric properties used in the breast model, obtained from [42]. The anatomical details of the breast model are realistic and were extracted from [8].

Signal Processing of the Breast Model Results

The medical imaging application performs a calibration of the complete system by carrying out an empty measurement (only the antennas, without the breast model) that will be used in the data processing as a reference signal. Figure 18 shows the simulated reflection coefficient for the four antennas used in the model. Both the results of the reference signal and the results of the complete model are represented. As can be seen, the S 11 parameter of the antennas significantly varies in proximity to biological tissue, decreasing the minimum working frequency of the antennas and modifying the return losses throughout the operating frequency range. This behaviour is expected and is not a great inconvenience for the medical imaging application, but it must be taken into account in the subsequent signal processing.
The transmission parameter between the antennas was calculated with and without the breast model for both the opposite and adjacent antenna configurations. The obtained results are shown in Figure 19. As it can be observed, the channel transmission losses are higher when the breast model is included, especially when opposite antennas are evaluated, because the signal has to go through the breast model. Additionally, it can be observed that losses increase with frequency, due to the increase in the absorption in the biological tissue.
The field distribution inside the breast model for some significant frequencies is shown in Figure 20. In this case, only Antenna 1 transmits energy. Clearly shown are the three layers of the breast that have different losses, as well as the absorption increase in the biological tissues with the frequency and how the field is concentrated near the antenna for higher frequencies.
Once the effect of biological material in the frequency domain was analysed, the same effect in the time domain was studied. For this, Inverse Fourier Transform was performed on the frequency signals obtained from the S 11 parameter, both for the reference signal and for the complete system signal, including the three-layer breast model. The time domain signals are the different reflections obtained in the antennas from the transmitted signal due to the discontinuities. Figure 21 shows the time domain response of the separated antenna compared to the response of Antenna 1 (as an example) surrounded by the other antennas without the breast model and the time domain response of Antenna 1 with the complete breast model shown in Figure 17. As can be seen, there is no significant difference between the response when the breast model is not used, but the difference is very important when it is, due to the reflections in the biological tissue.
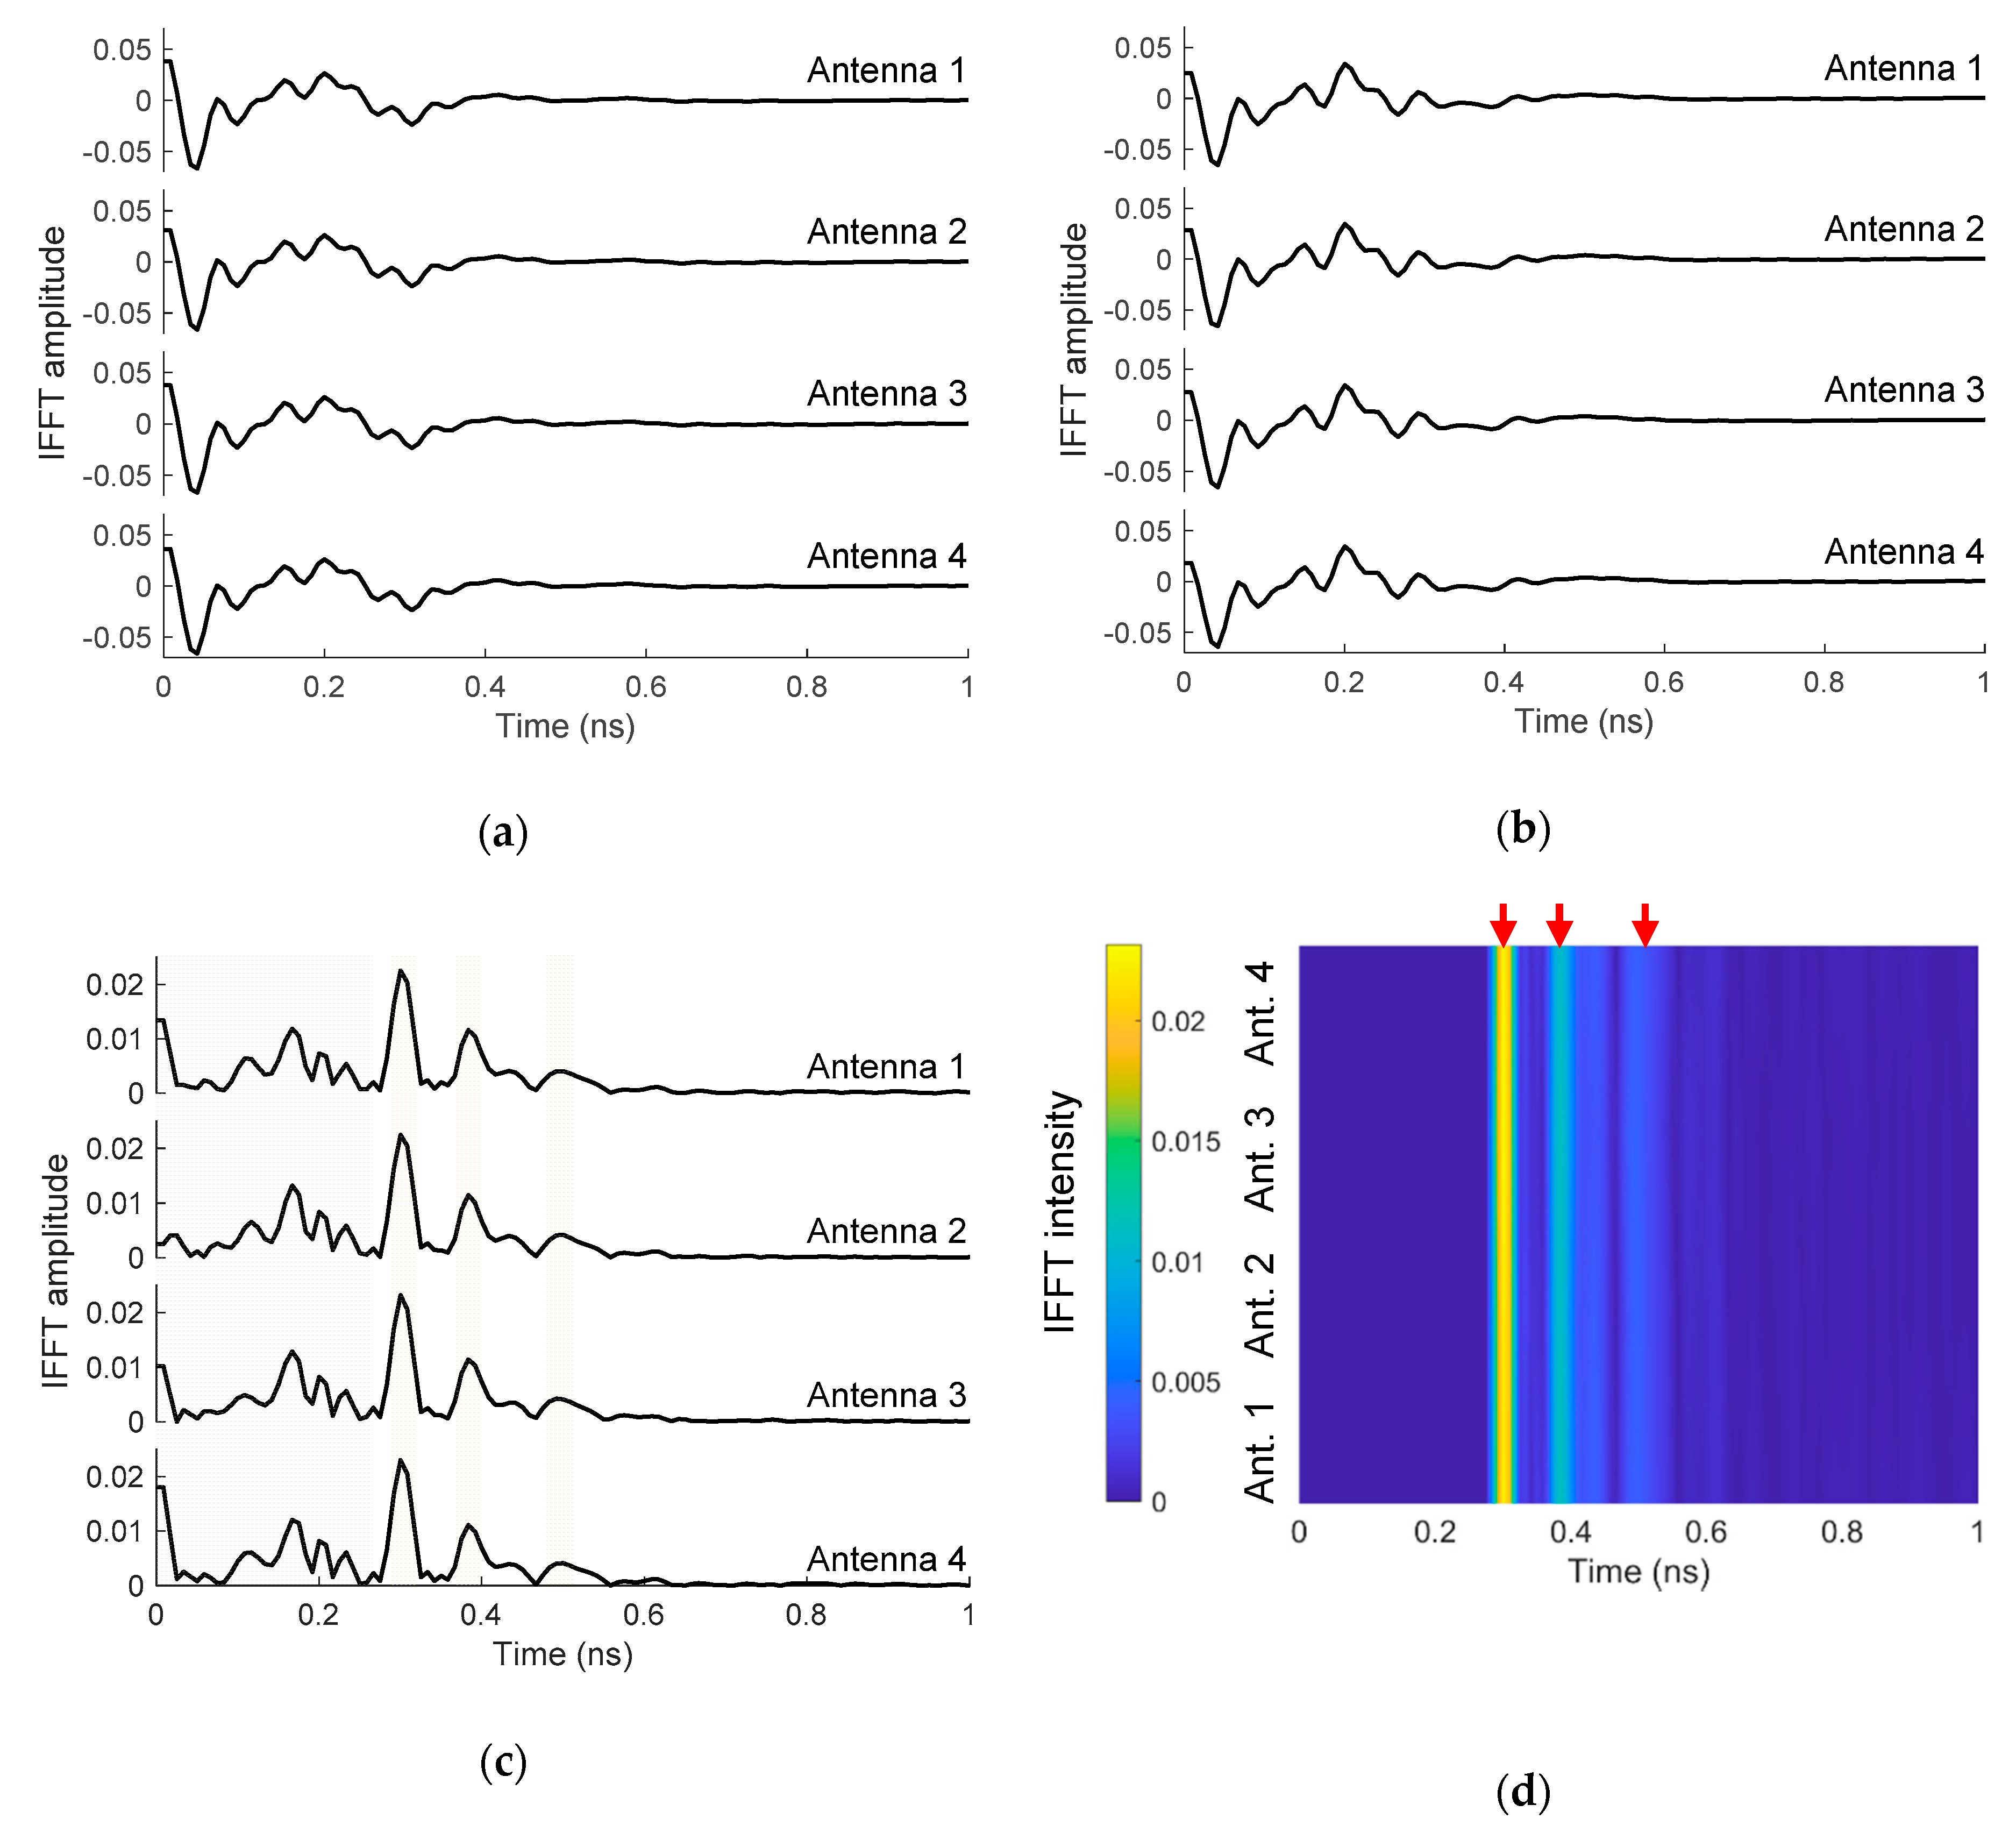
Figure 22a shows the time domain response of the reference signals obtained from the antennas without the breast model. The signals are represented up to 1 ns, enough time to show all the reflections. The response of the complete system, with the breast model, is shown in Figure 22b. As can be seen, there are small differences between the two responses, which are due to the reflections caused by the breast model.
To better visualize the differences in the reflections, Figure 22c shows the difference between the response of the complete model and the reference for each antenna. Reflections due to the antenna are highlighted in gray, between 0 ns and 0.26 ns, that agree with a distance in air ( ε r   = 1) of approximately 4 cm, that is, the size of the antenna. From this time, the reflections are due to the breast model, finding three maximums that match with the reflection caused by the interface in each layer of the breast model. These maximums have been marked in yellow to highlight their position. It should be noted that the distance traveled by the signal inside the breast model is affected by the phase velocity, which depends on the dielectric constant of the material, being in this case significantly less than the velocity in air. Therefore, the time difference of the maximums shown in Figure 22c corresponds to very small distances, in concordance with the thickness assigned to the different layers of the breast model. Finally, Figure 22d shows a representation of the intensity in the difference signal for each antenna, where the reflections due to the antenna have been eliminated. The time position of the reflections due to the layers of the breast model is marked with a red arrow.

5. Conclusions

This paper presents a simple, printed monopole antenna for microwave material detection and medical imaging applications. The antenna is based on a rectangular antenna of small dimensions, imposed by the final application, and a simple design method is proposed. To increase the bandwidth, different modifications in the antenna geometry have been made, such as the use of steps in the rectangular radiating patch, the insertion of strips in the feed line, and the use of slots in the ground plane. In the design procedure, a parametric optimization based on simulations has been used to achieve the greatest bandwidth and the lowest possible working frequency.
To validate the design, a prototype of the antenna was manufactured onto a FR4 substrate and its characteristics measured. The results obtained are in agreement with the simulated ones, obtaining a bandwidth between 2.7 GHz and 11.4 GHz, that makes it possible to use the antenna in UWB applications. The radiation patterns are almost omnidirectional, with a moderate gain ranging from 1 dBi to 6.5 dBi. The Fidelity Factor of the antenna was calculated for two antenna configurations, obtaining values higher than 0.88.
Finally, the behaviour of the antenna was verified when it was placed close to biological tissue in an application for the detection and characterization of biological material in breast cancer. A breast model with three layers of material with realistic dielectric properties was developed and four antennas such as the one designed were placed around it. The influence of the biological material on the characteristics of the antennas was analysed, both in the frequency and time domains, obtaining good results and demonstrating the validity of the designed antenna for use in characterization of biological tissue and medical imaging applications in the microwave frequency range.

Author Contributions

Conceptualization, A.M.-L., C.B.-A. and E.Á.-N.; methodology, A.M.-L. and C.B.-A.; software, C.B.-A., R.G.-M. and A.M.-L.; validation, H.G.-M. and G.T.-P.; formal analysis, A.M.-L. and G.T.-P.; investigation, C.B.-A. and A.M.-L.; resources, J.M.S.-N. and R.G.-M.; data curation, H.G.-M. and R.G.-M.; writing—original draft preparation, A.M.-L. and C.B.-A.; writing—review and editing, G.T.-P. and E.Á.-N.; visualization, J.M.S.-N.; supervision, E.Á.-N. and J.M.S.-N.; project administration, E.Á.-N. and J.M.S.-N.; funding acquisition, E.Á.-N. and J.M.S.-N. All authors have read and agreed to the published version of the manuscript.

Funding

This research was partially funded by a grant (No. DPI2016-80391-C3-2-R [AEI/FEDER, UE]) from the Agencia Estatal de Investigación (AEI) and from the EU through the Fondo Europeo de Desarrollo Regional—FEDER—“A way to build Europe” and by grants (No. APOTIP/2019/018, No. ACIF/2020/147 and No. AICO/2020/218) from the Consellería de Innovación, Universidades, Ciencia y Sociedad Digital.

Conflicts of Interest

The authors declare no conflict of interest.

References

  1. World Health Organization. WHO Report on Cancer: Setting Priorities, Investing Wisely and Providing Care for All. 2020. Available online: https://apps.who.int/iris/handle/10665/330745.License:CCBY-NC-SA3.0IGO (accessed on 22 December 2020).
  2. Khuda, I.E. Feasibility of the Detection of Breast Cancer Using Ultra-Wide Band (UWB) Technology in Comparison with Other Screening Techniques. In UWB Technology and Its Applications; Kocur, D., Ed.; IntechOpen: London, UK, 2018. [Google Scholar]
  3. Porter, E.; Coates, M.; Popović, M. An Early Clinical Study of Time-Domain Microwave Radar for Breast Health Monitoring. IEEE Trans. Biomed. Eng. 2016, 63, 530–539. [Google Scholar] [CrossRef]
  4. Khalesi, B.; Sohani, B.; Ghavami, N.; Ghavami, M.; Dudley, S.; Tiberi, G. A Phantom Investigation to Quantify Huygens Principle Based Microwave Imaging for Bone Lesion Detection. Electronics 2019, 8, 1505. [Google Scholar] [CrossRef] [Green Version]
  5. Borja, B.; Tirado, J.A.; Jardón, H. An Overview of UWB Antennas for Microwave Imaging Systems for Cancer Detection Purposes. Prog. Electromagn. Res. B 2018, 80, 173–198. [Google Scholar] [CrossRef] [Green Version]
  6. Bourqui, J.; Sill, J.M.; Fear, E.C. A Prototype System for Measuring Microwave Frequency Reflections from the Breast. Int. J. Biomed. Imaging 2012, 2012. [Google Scholar] [CrossRef]
  7. Islam, M.T.; Islam, M.M.; Samsuzzaman, M.; Faruque, M.R.I.; Misran, N. A Negative Index Metamaterial-Inspired UWB Antenna with an Integration of Complementary SRR and CLS Unit Cells for Microwave Imaging Sensor Applications. Sensors 2015, 15, 11601–11627. [Google Scholar] [CrossRef] [PubMed] [Green Version]
  8. Bahramiabarghouei, H.; Porter, E.; Santorelli, A.; Gosselin, B.; Popović, M.; Rusch, L.A. Flexible 16 Antenna Array for Microwave Breast Cancer Detection. IEEE Trans. Biomed. Eng. 2015, 62, 2516–2525. [Google Scholar] [CrossRef]
  9. Federal Communications Commission. First Report and Order, Revision of Part 15 of the Commission’s Rules Regarding Ultra Wide Band Transmission Systems; Federal Communications Commission: Washington, DC, USA, 2002. Available online: https://www.fcc.gov/document/revision-part-15-commissions-rules-regarding-ultra-wideband (accessed on 22 December 2020).
  10. Samsuzzaman, M.; Islam, M.T.; Islam, M.T.; Shovon, A.A.; Faruque, R.I.; Misran, N. A 16-modified antipodal Vivaldi antenna array for microwave-based breast tumor imaging applications. Microw. Opt. Technol. Lett. 2019, 61, 2110–2118. [Google Scholar] [CrossRef]
  11. Foroutan, F.; Nikolova, N.K. Active Sensor for Microwave Tissue Imaging with Bias-Switched Arrays. Sensors 2018, 18, 1447. [Google Scholar] [CrossRef] [Green Version]
  12. Islam, M.M.; Islam, M.T.; Faruque, M.R.I.; Samsuzzaman, M.; Misran, N.; Arshad, H. Microwave Imaging Sensor Using Compact Metamaterial UWB Antenna with a High Correlation Factor. Materials 2015, 8, 4631–4651. [Google Scholar] [CrossRef] [Green Version]
  13. Saied, I.M.; Arslan, T. Noninvasive Wearable RF Device Towards Monitoring Brain Atrophy and Lateral Ventricle Enlargement. IEEE J. Electromagn. RF Microw. Med. Biol. 2020, 4, 61–68. [Google Scholar] [CrossRef] [Green Version]
  14. Mahmud, M.Z.; Islam, M.T.; Almutairi, A.F.; Samsuzzaman, M.; Acharjee, U.K.; Islam, M.T. A Parasitic Resonator-Based Diamond-Shaped Microstrip Antenna for Microwave Imaging Applications. Electronics 2019, 8, 434. [Google Scholar] [CrossRef] [Green Version]
  15. Ullah, S.; Ruan, C.; Sadiq, M.S.; Haq, T.U.; He, W. High Efficient and Ultra Wide Band Monopole Antenna for Microwave Imaging and Communication Applications. Sensors 2020, 20, 115. [Google Scholar] [CrossRef] [PubMed] [Green Version]
  16. Jose, S.M.; Lethakumary, B. CPW-fed step-shaped microstrip antenna for UWB applications. Microw. Opt. Technol. Lett. 2015, 57, 589–591. [Google Scholar] [CrossRef]
  17. Hanapi, K.M.; Abdul Rahim, S.K.; Saad, B.M.; Abdul Rani, M.S.; Abd Aziz, M.Z. An elliptically planar UWB monopole antenna with step slots defective ground structure. Microw. Opt. Technol. Lett. 2014, 56, 2084–2088. [Google Scholar] [CrossRef]
  18. Aissaoui, D.; Abdelghani, L.M.; Boukli-Hacen, N.; Denidni, T.A. CPW-fed UWB hexagonal shaped antenna with additional fractal elements. Microw. Opt. Technol. Lett. 2016, 58, 2370–2374. [Google Scholar] [CrossRef]
  19. Bithikh, M.; Aksas, R.; Kimouche, H.; Azrar, A. New UWB antenna design for wireless communications. Microw. Opt. Technol. Lett. 2012, 54, 692–697. [Google Scholar] [CrossRef]
  20. Karli, R.; Ammor, H.; Virdee, B.S. Early detection of breast tumors using UWB microstrip antenna imaging. Microw. Opt. Technol. Lett. 2016, 58, 2101–2106. [Google Scholar] [CrossRef]
  21. Ojaroudi, N. Compact UWB monopole antenna with enhanced bandwidth using rotated L-shaped slots and parasitic structures. Microw. Opt. Technol. Lett. 2014, 56, 175–178. [Google Scholar] [CrossRef]
  22. Ojaroudi, N.; Ghadimi, N. Omnidirectional microstrip monopole antenna design for use in microwave imaging systems. Microw. Opt. Technol. Lett. 2015, 57, 395–401. [Google Scholar] [CrossRef]
  23. Yeboah-Akowuah, B.; Kosmas, P.; Chen, Y. A Q-Slot Monopole for UWB Body-Centric Wireless Communications. IEEE Trans. Antennas Propag. 2017, 65, 5069–5075. [Google Scholar] [CrossRef] [Green Version]
  24. Boutejdar, A.; Abd Ellatif, W. A novel compact UWB monopole antenna with enhanced bandwidth using triangular defected microstrip structure and stepped cut technique. Microw. Opt. Technol. Lett. 2016, 58, 1514–1519. [Google Scholar] [CrossRef]
  25. Jalali, M.; Sedghi, T. Very compact UWB CPW-fed fractal antenna using modified ground plane and unit cells. Microw. Opt. Technol. Lett. 2014, 56, 851–854. [Google Scholar] [CrossRef]
  26. Navarro, E.A.; Sangary, N.T.; Wu, C.; Litva, J. Analysis of a coupled patch antenna with application in personal communications. IEE Proc.-Microw. Antennas Propag. 1995, 142, 495–497. [Google Scholar] [CrossRef]
  27. Balanis, C.A. Antenna Theory: Analysis and Design, 3rd ed.; John Wiley & Sons, Inc.: Hoboken, NJ, USA, 2005. [Google Scholar]
  28. Mustaqim, M.; Khawaja, B.A.; Chattha, H.T.; Shafique, K.; Zafar, M.J.; Jamil, M. Ultra-wideband antenna for wearable Internet of Things devices and wireless body area network applications. Int. J. Numer. Model. 2019, 32, e2590. [Google Scholar] [CrossRef]
  29. Yadav, S.; Gautam, A.K.; Kanaujia, B.K. Design of miniaturized single band-notch micro strip antenna with enhanced UWB performance. Microw. Opt. Technol. Lett. 2016, 58, 1494–1499. [Google Scholar] [CrossRef]
  30. Moosazadeh, M.; Ghobadi, C.; Esmati, Z. Monopole antenna based on wrench-shaped slot on circular disc patch for UWB application. Microw. Opt. Technol. Lett. 2011, 53, 1927–1931. [Google Scholar] [CrossRef]
  31. Kimouche, H.; Abed, D.; Atrouz, B.; Aksas, R. Bandwidth enhancement of rectangular monopole antenna using modified semi-elliptical ground plane and slots. Microw. Opt. Technol. Lett. 2010, 52, 54–58. [Google Scholar] [CrossRef]
  32. Singhal, S.; Singh, A.K. Flower-shaped ultra-wideband fractal antenna. Int. J. RF Microw. Comput. Aided Eng. 2019, 29, e21885. [Google Scholar] [CrossRef]
  33. Chiang, K.H.; Tam, K.W. Microstrip Monopole Antenna with Enhanced Bandwidth Using Defected Ground Structure. IEEE Antennas Wirel. Propag. Lett. 2008, 7, 532–535. [Google Scholar] [CrossRef]
  34. Lee, C.H.; Wu, J.H.; Hsu, C.I.G.; Chan, H.L.; Chen, H.H. Balanced Band-Notched UWB Filtering Circular Patch Antenna with Common-Mode Suppression. IEEE Antennas Wirel. Propag. Lett. 2017, 16, 2812–2815. [Google Scholar] [CrossRef]
  35. Prombutr, N.; Kirawanich, P.; Akkaraekthalin, P. Bandwidth Enhancement of UWB Microstrip Antenna with a Modified Ground Plane. Int. J. Micro. Sci. Tec. 2009, 2009. [Google Scholar] [CrossRef] [Green Version]
  36. Singhal, S.; Singh, A.K. Beveled monopole antenna with slot loaded semicircular like ground plane for UWB applications. Microw. Opt. Technol. Lett. 2015, 57, 1289–1296. [Google Scholar] [CrossRef]
  37. Jeong, W.; Tak, J.; Choi, J. A Low-Profile IR-UWB Antenna with Ring Patch for WBAN Applications. IEEE Trans. Antennas Propag. 2015, 14, 1447–1450. [Google Scholar] [CrossRef]
  38. Mighani, M.; Akbari, M. New UWB Monopole Planer Antenna with Dual Band Notched. Prog. Electromagn. Res. C 2014, 52, 153–162. [Google Scholar] [CrossRef] [Green Version]
  39. Quintero, G.; Zurcher, J.-F.; Skrivervik, A.K. System Fidelity Factor: A New Method for Comparing UWB Antennas. IEEE Trans. Antennas Propag. 2011, 59, 2502–2512. [Google Scholar] [CrossRef]
  40. Lazebnik, M.; Okoniewski, M.; Booske, J.H.; Hagness, S.C. Highly Accurate Debye Models for Normal and Malignant Breast Tissue Dielectric Properties at Microwave Frequencies. IEEE Microw. Wirel. Compon. Lett. 2007, 17, 822–824. [Google Scholar] [CrossRef]
  41. Li, X.; Hagness, S.C. A confocal microwave imaging algorithm for breast cancer detection. IEEE Microw. Wirel. Compon. Lett. 2001, 11, 130–132. [Google Scholar] [CrossRef] [Green Version]
  42. Foundation for Research on Information Technologies in Society (IT’IS). Study about Dielectric Properties for Biological Tissues. Available online: https://itis.swiss/virtual-population/tissue-properties/database/dielectric-properties/ (accessed on 22 December 2020).
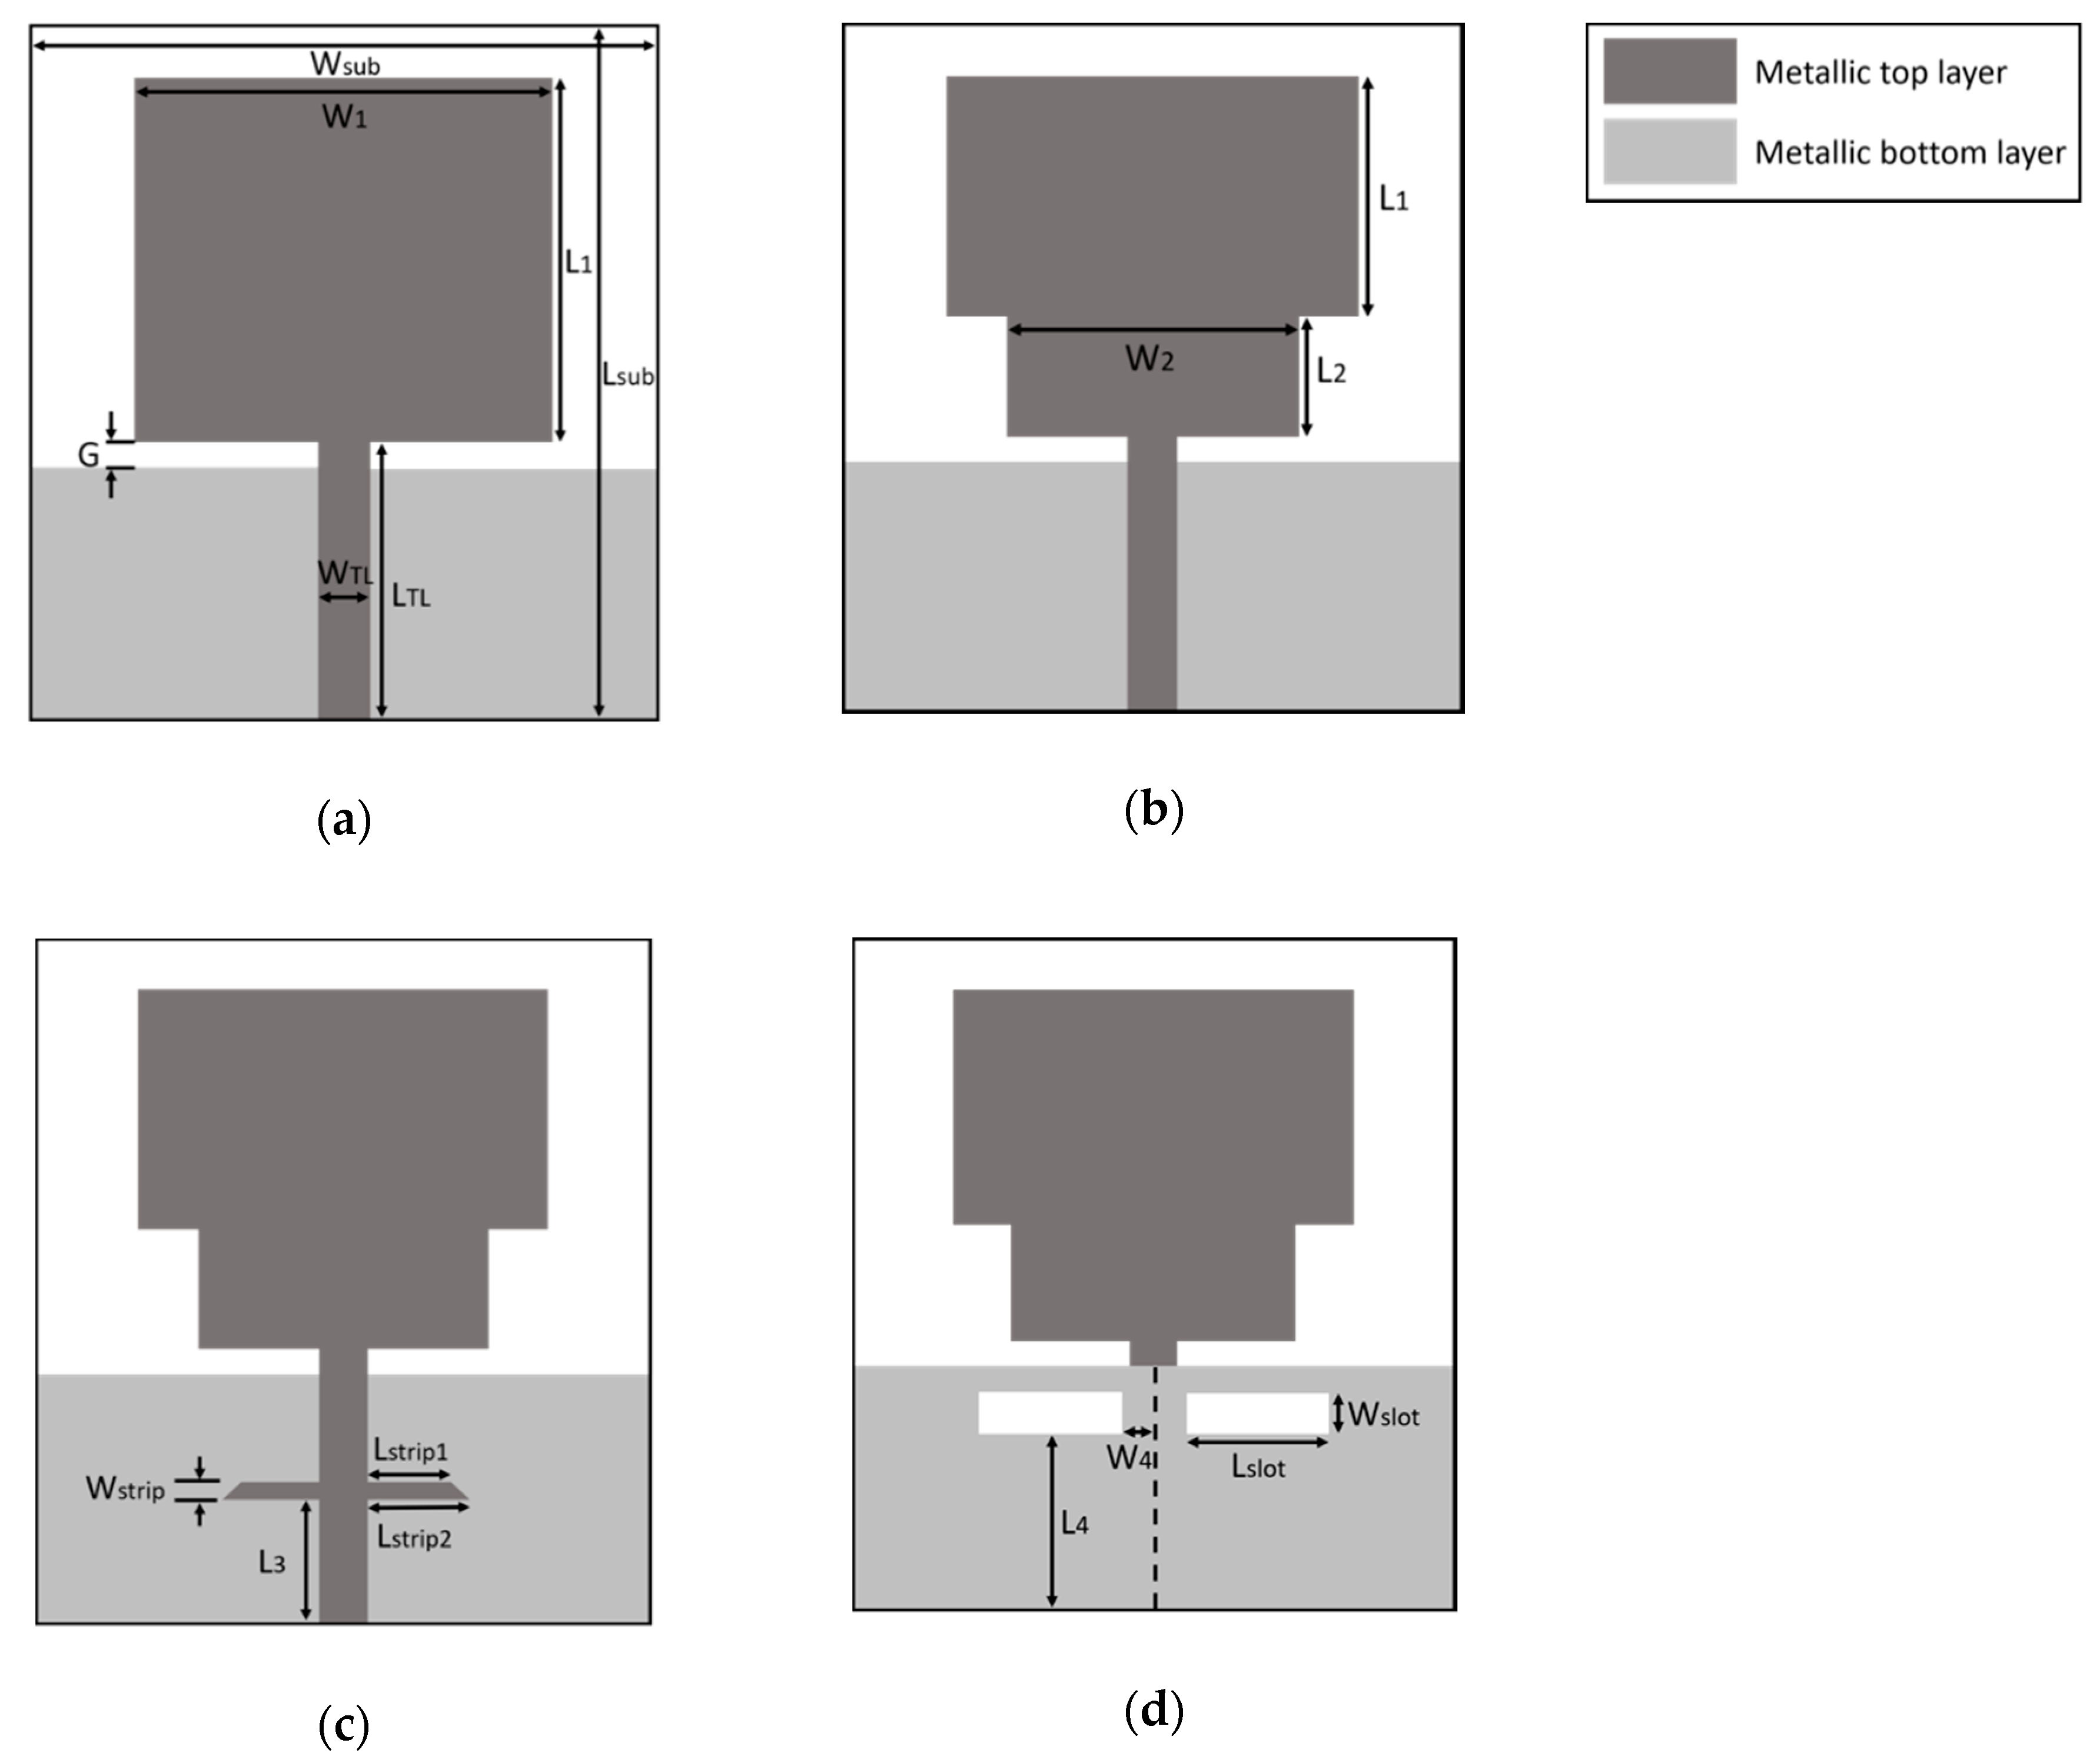
Figure 1. Antenna geometry: (a) Printed monopole antenna used as a starting point; (b) Antenna with two rectangular steps; (c) Antenna with strips; (d) Final antenna design.
Electronics 10 00304 g001
Figure 2. Reflection coefficient for the rectangular monopole antenna for different values of G .
Electronics 10 00304 g002
Figure 3. Antenna results for different values of W 2 .
Electronics 10 00304 g003
Figure 4. Antenna reflection coefficient for different values of L s t r i p 1 and L s t r i p 2 .
Electronics 10 00304 g004
Figure 5. Antenna reflection coefficient for different values of L 3 .
Electronics 10 00304 g005
Figure 6. Antenna reflection coefficient for different slot lengths ( L s l o t ).
Electronics 10 00304 g006
Figure 7. Results for the different phases followed in the antenna design.
Electronics 10 00304 g007
Figure 8. Simulated current density distribution in the antenna conductors at the most significant frequencies for the proposed antenna: (a) 3 GHz; (b) 4 GHz; (c) 6 GHz; (d) 8 GHz; (e) 10 GHz; (f) 11 GHz.
Electronics 10 00304 g008
Figure 9. Photograph of the manufactured antenna: (a) Top layer; (b) Bottom layer.
Electronics 10 00304 g009
Figure 10. Measured and simulated reflection coefficients for the proposed antenna.
Electronics 10 00304 g010
Figure 11. Measured diagram patterns for the proposed antenna: (a) E and H plane for 3 to 6 GHz frequency range; (b) E and H plane for 7 to 10 GHz frequency range.
Electronics 10 00304 g011
Figure 12. Measured and simulated gain for the proposed antenna.
Electronics 10 00304 g012
Figure 13. Results of the transmission parameter for face-to-face and side-by-side setup configurations.
Electronics 10 00304 g013
Figure 14. Group delay for the face-to-face and side-by-side setup configuration.
Electronics 10 00304 g014
Figure 15. Response of the 7 t h -derivative of the Gaussian pulse: (a) Time domain response and comparison with the Gaussian pulse; (b) Frequency response and FCC mask.
Electronics 10 00304 g015
Figure 16. Transmitted and received broadband pulse for both configurations, face-to-face (blue line) and side-by-side (red line).
Electronics 10 00304 g016
Figure 17. Breast model with four antennas designed to analyse the influence of biological tissue in the antenna response: (a) Top view; (b) Bottom view.
Electronics 10 00304 g017
Figure 18. Antenna reflection coefficient with and without the breast model.
Electronics 10 00304 g018
Figure 19. Transmission parameter between adjacent and opposite antennas with and without the breast model.
Electronics 10 00304 g019
Figure 20. Field distribution inside the breast model for different frequencies when Antenna 1 is transmitting: (a) Evaluated model; (b) 3 GHz; (c) 5 GHz; (d) 7 GHz; (e) 9 GHz; (f) 11 GHz.
Electronics 10 00304 g020
Figure 21. Time domain response of the separated antenna compared to the antenna surrounded by other antennas with and without the breast model.
Electronics 10 00304 g021
Figure 22. Time domain signals for the antenna response: (a) Reference signal without the breast model; (b) Antenna response with the breast model; (c) Difference signal; (d) Intensity of the reflections of the difference signals.
Electronics 10 00304 g022
Table 1. Dimensions of the Designed Antenna.
ParameterValue (mm)ParameterValue (mm)
W s u b 36.00 L s t r i p 1 2.50
L s u b 40.00 L s t r i p 2 2.80
W 1 24.00 W s t r i p 0.30
L 1 14.00 L 3 8.20
W T L 2.90 L s l o t 8.00
L T L 16.00 W s l o t 2.50
G 1.50 W 4 1.95
W 2 17.00 L 4 10.50
L 2 7.00
Table 2. Calculated Fidelity Factor for Side-by-Side and Face-to-Face Configurations.
ConfigurationFidelity Factor (%)
Face-to-face88
Side-by-side93
Table 3. Comparative Study of the Antenna Behaviour (N.R. Means Not Reported by Authors).
ReferenceSize (mm2)Bandwidth (GHz)BW (%)Gain (dBi)Fidelity Factor (%)Feed TopologyComplexity
[7]19.4 × 27.73.1–15.0131.51.2–6.684–91MicrostripHigh
[8]20.0 × 20.02.0–4.066.7N.R.67–94CPWLow
[11]13.1 × 11.04.9–7.541.9N.R.N.R.CPWHigh
[14]25.0 × 30.02.7–10.3116.91.0–4.5N.R.MicrostripHigh
[16]30.0 × 25.04.4–11.085.7−11–4.8N.R.CPWLow
[18]39.0 × 36.53.1–13.7125.7N.R.N.R.CPWMedium
[20]16.0 × 25.03.9–11.397.42.0–4.5N.R.MicrostripMedium
[32]11.4 × 15.74.6–16.7113.61.0–3.975–84CPWHigh
Our proposal36.0 × 40.02.7–11.4123.41.3–6.688–93MicrostripLow
Table 4. Dielectric Properties of the Breast Model.
Material ε 0 ε i n f τ Thickness (mm)
Skin32.04.07.232
Breast fat3.02.517.688
Breast glands55.04.07.97105 (diameter)
Publisher’s Note: MDPI stays neutral with regard to jurisdictional claims in published maps and institutional affiliations.