
A Two-Phase Approach for Predicting Highway Passenger Volume


Abstract
:1. Introduction
- (1)
- A total of 69 impact factors of urban attributes were collected from 280 administrative districts in China, which provides a macroscopic dataset for the prediction of highway passenger volume and overcomes the limitations of traditional travel surveys and questionnaires that only focus on a single city or single transportation corridor;
- (2)
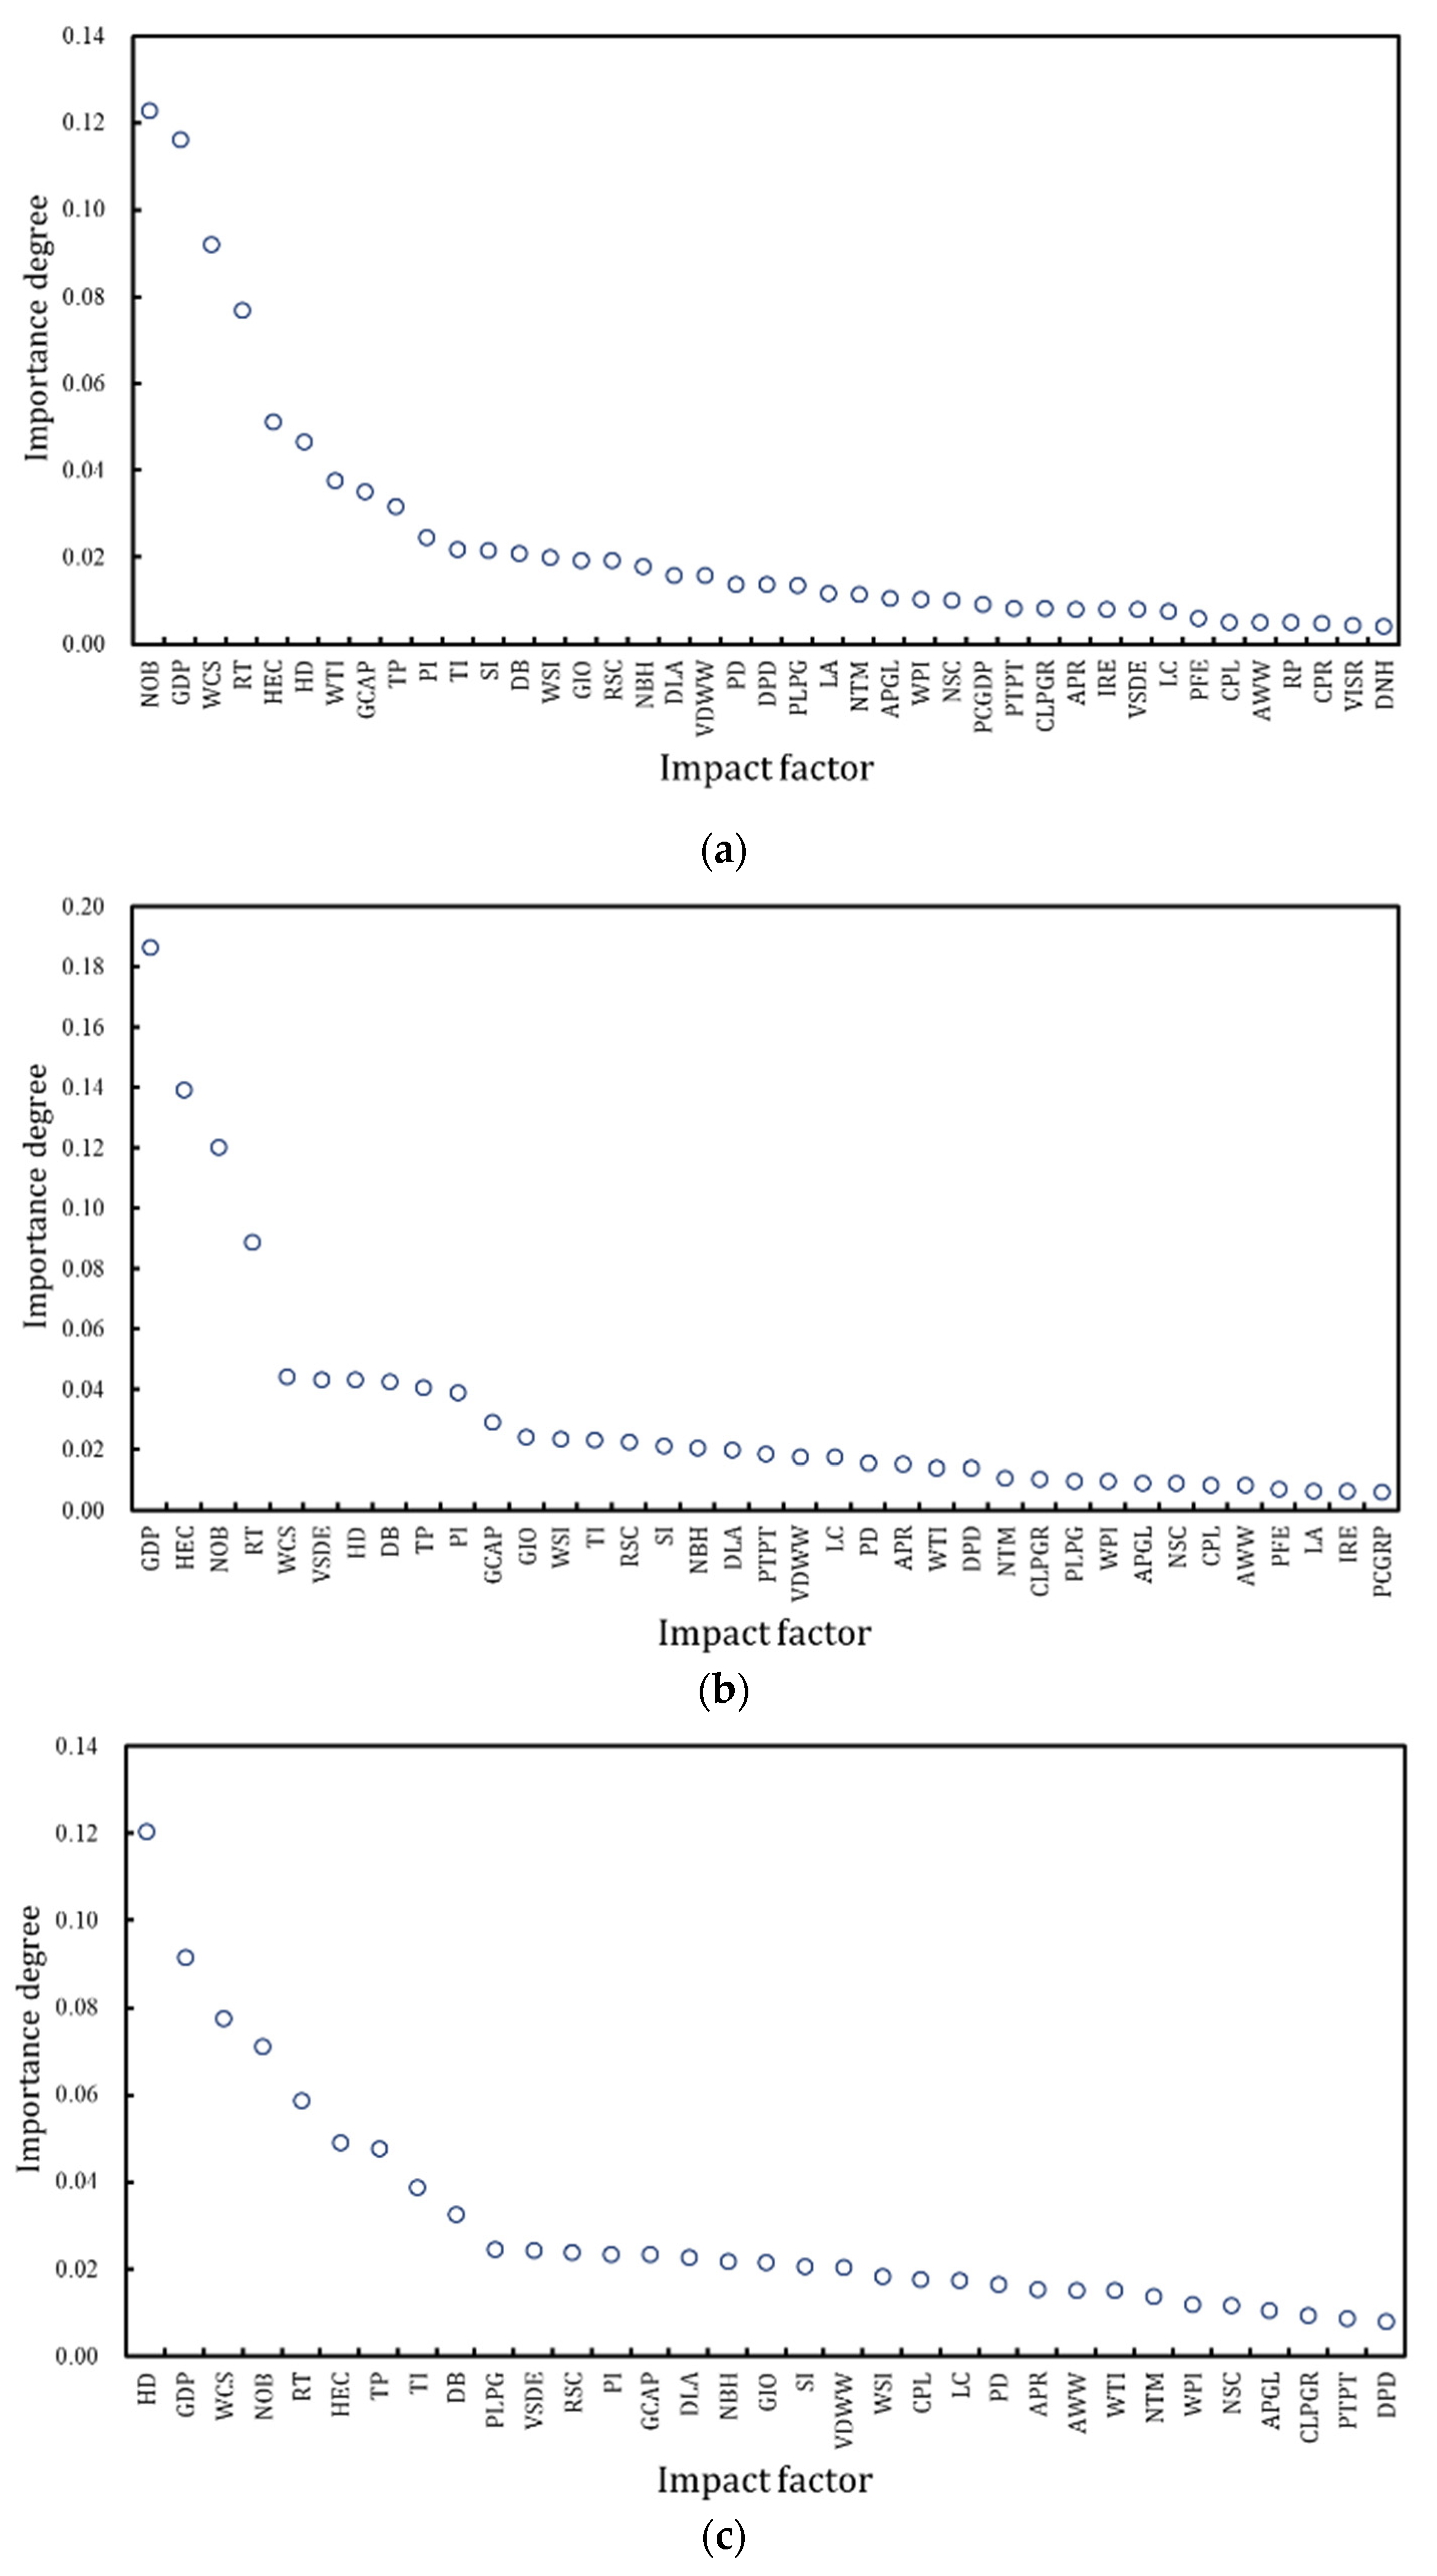
- Multiple urban attributes, including urban economy, population, industry, income and consumption, and resource and environment, were modeled together. Furthermore, A total of 30 significant impact factors of highway passenger volume were extracted by the RF algorithm, which improves the traditional process based on subjective experience and avoids the omission of significant factors;
- (3)
- A deep learning method, DFNN, was developed to predict highway passenger volume, which proved to be more accurate than the SVM and multiple regression methods and can provide more reliable information for optimizing traffic structure and reducing waste of traffic resources.
2. Literature Review
- (1)
- Due to the restrictions of the research data, most existing research predicted intercity passenger volume from a single city or transportation corridor. As a result, the current achievements are difficult to apply to intercity transportation between all kinds of cities.
- (2)
- Existing research only focuses on common urban attributes such as the population or the economy. However, more urban attributes related to the quality of residents’ lives, resources, and environment were neglected for lacking the available data and quantitative indicators, causing the inaccurate prediction of intercity passenger volume, especially in some tourism-driven cities and resource-driven cities. Moreover, the selection process of significant attributes also received less attention.
- (3)
- Microcosmic datasets collected from traffic surveys have been widely used for studying the choice of transportation mode in intercity trips but is not practical to predict intercity passenger volume. In contrast, the macroscopic datasets of urban attributes provided a novel approach to predict the intercity passenger volume, but have rarely been used in the existing literature.
3. Data Source
4. Methodology
4.1. Random Forest Algorithm
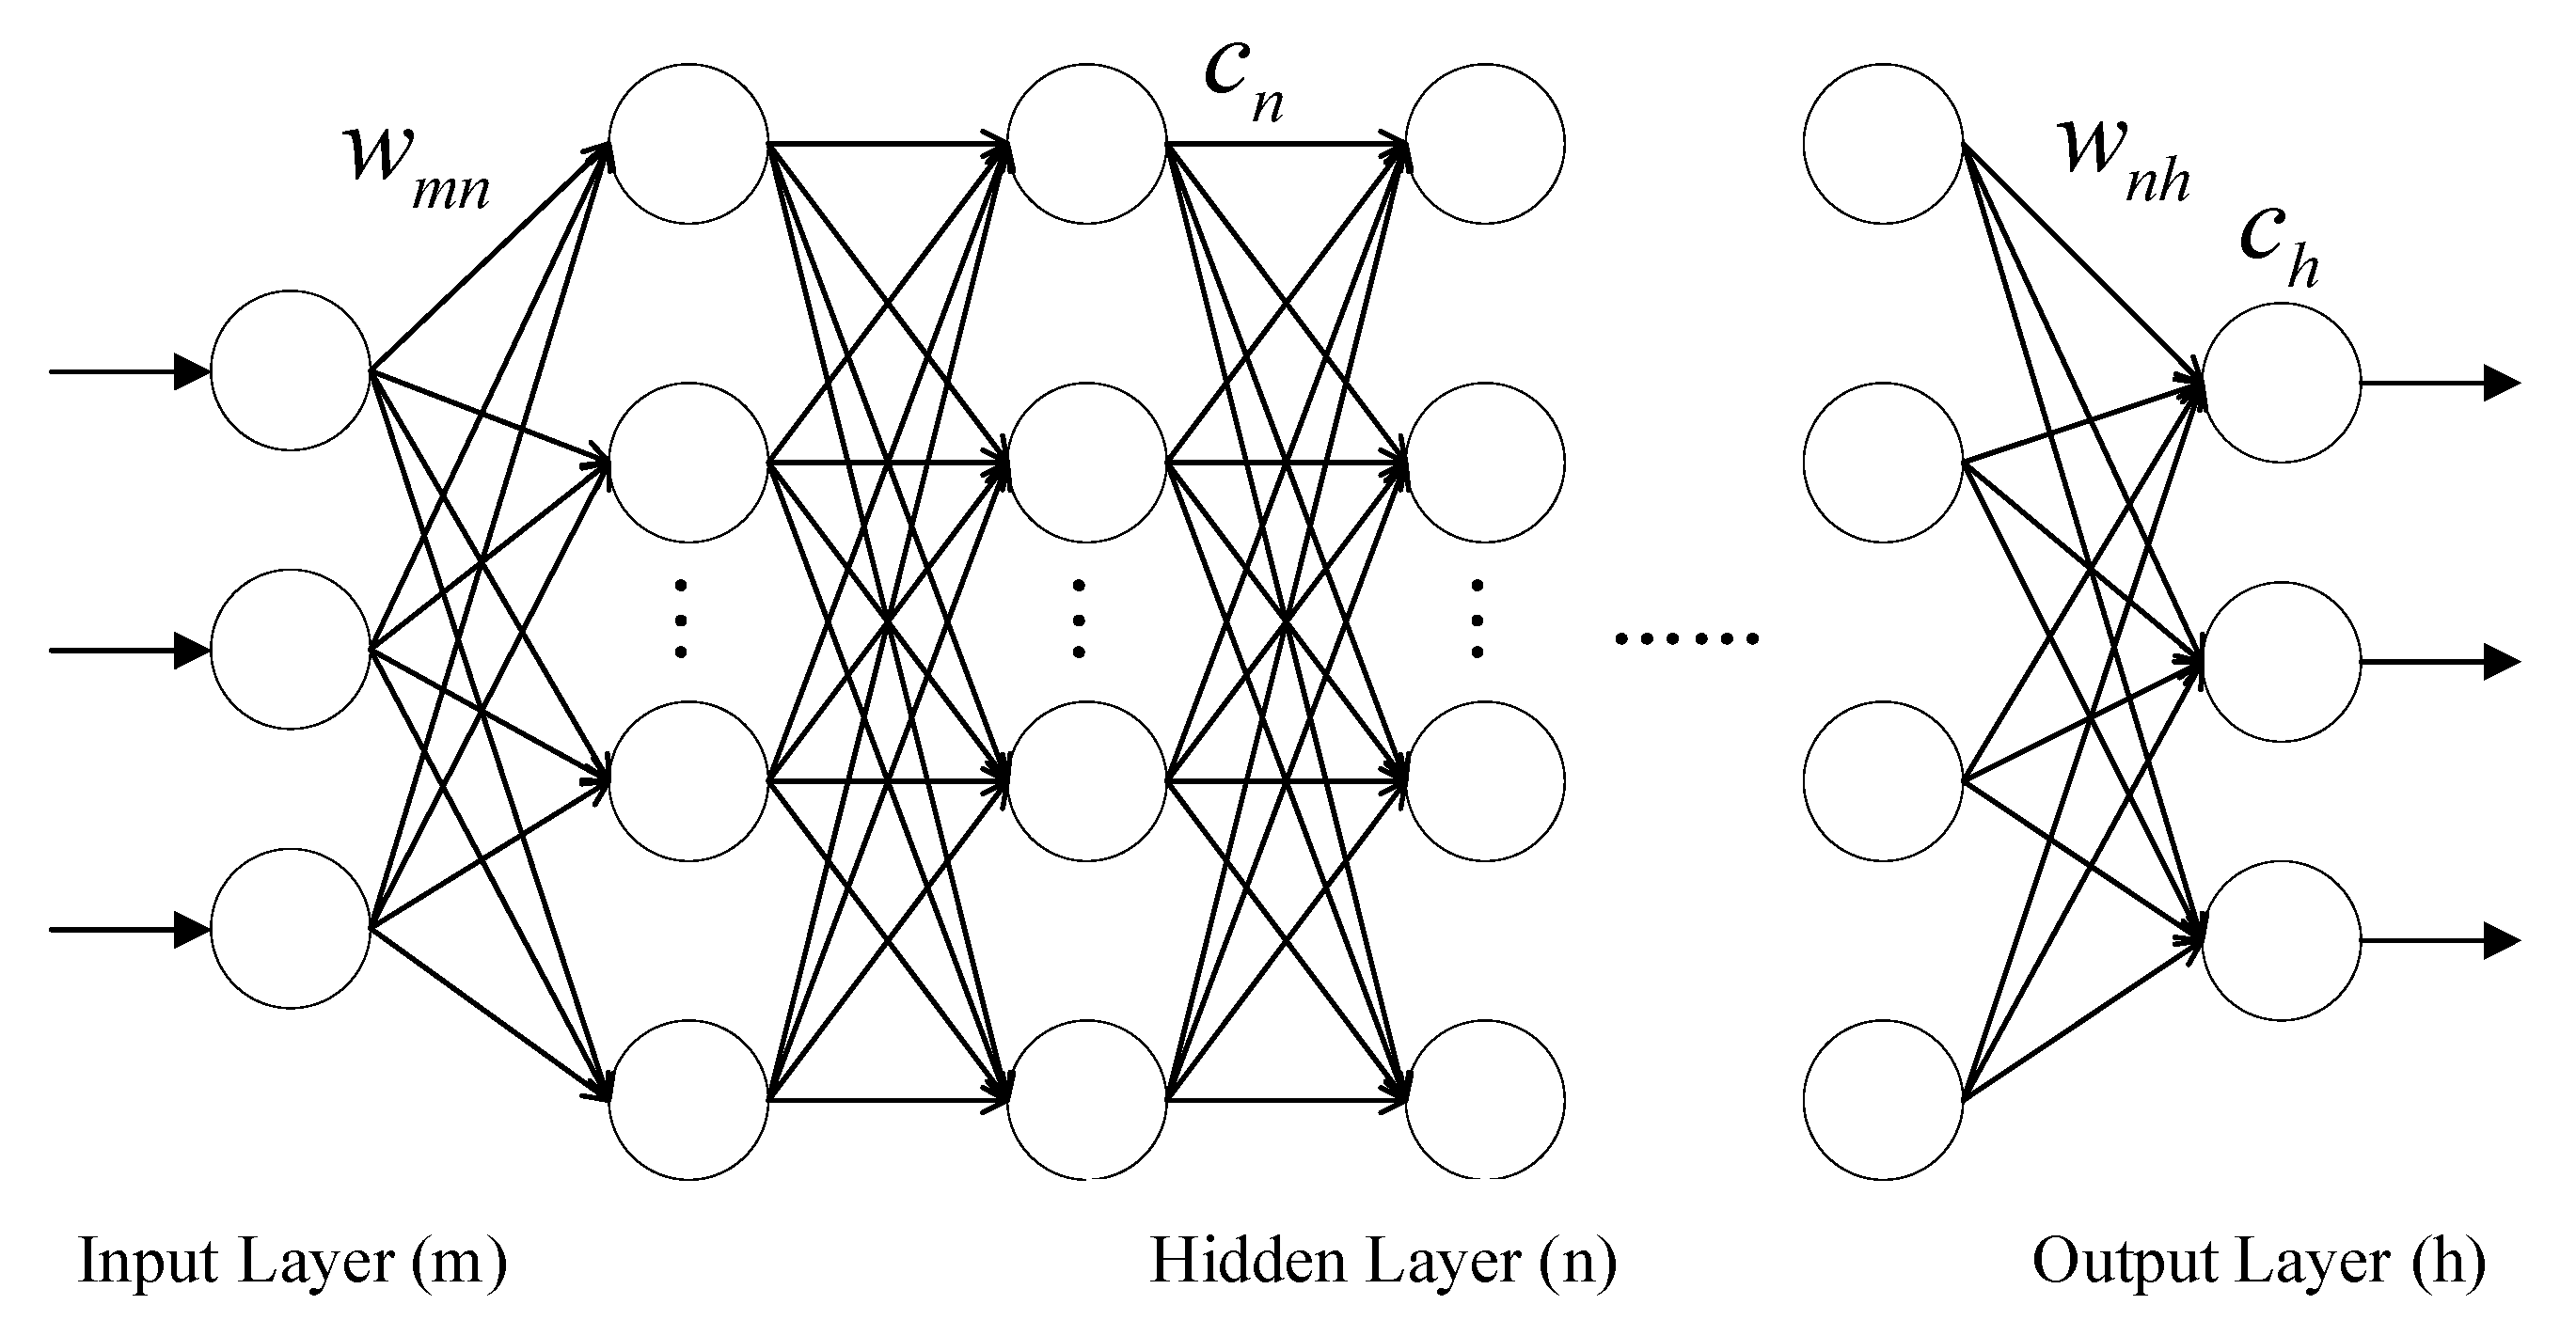
4.2. Deep Feedforward Neural Network
4.3. Evaluating Indicators
5. Phase I: Extraction of Significant Factors

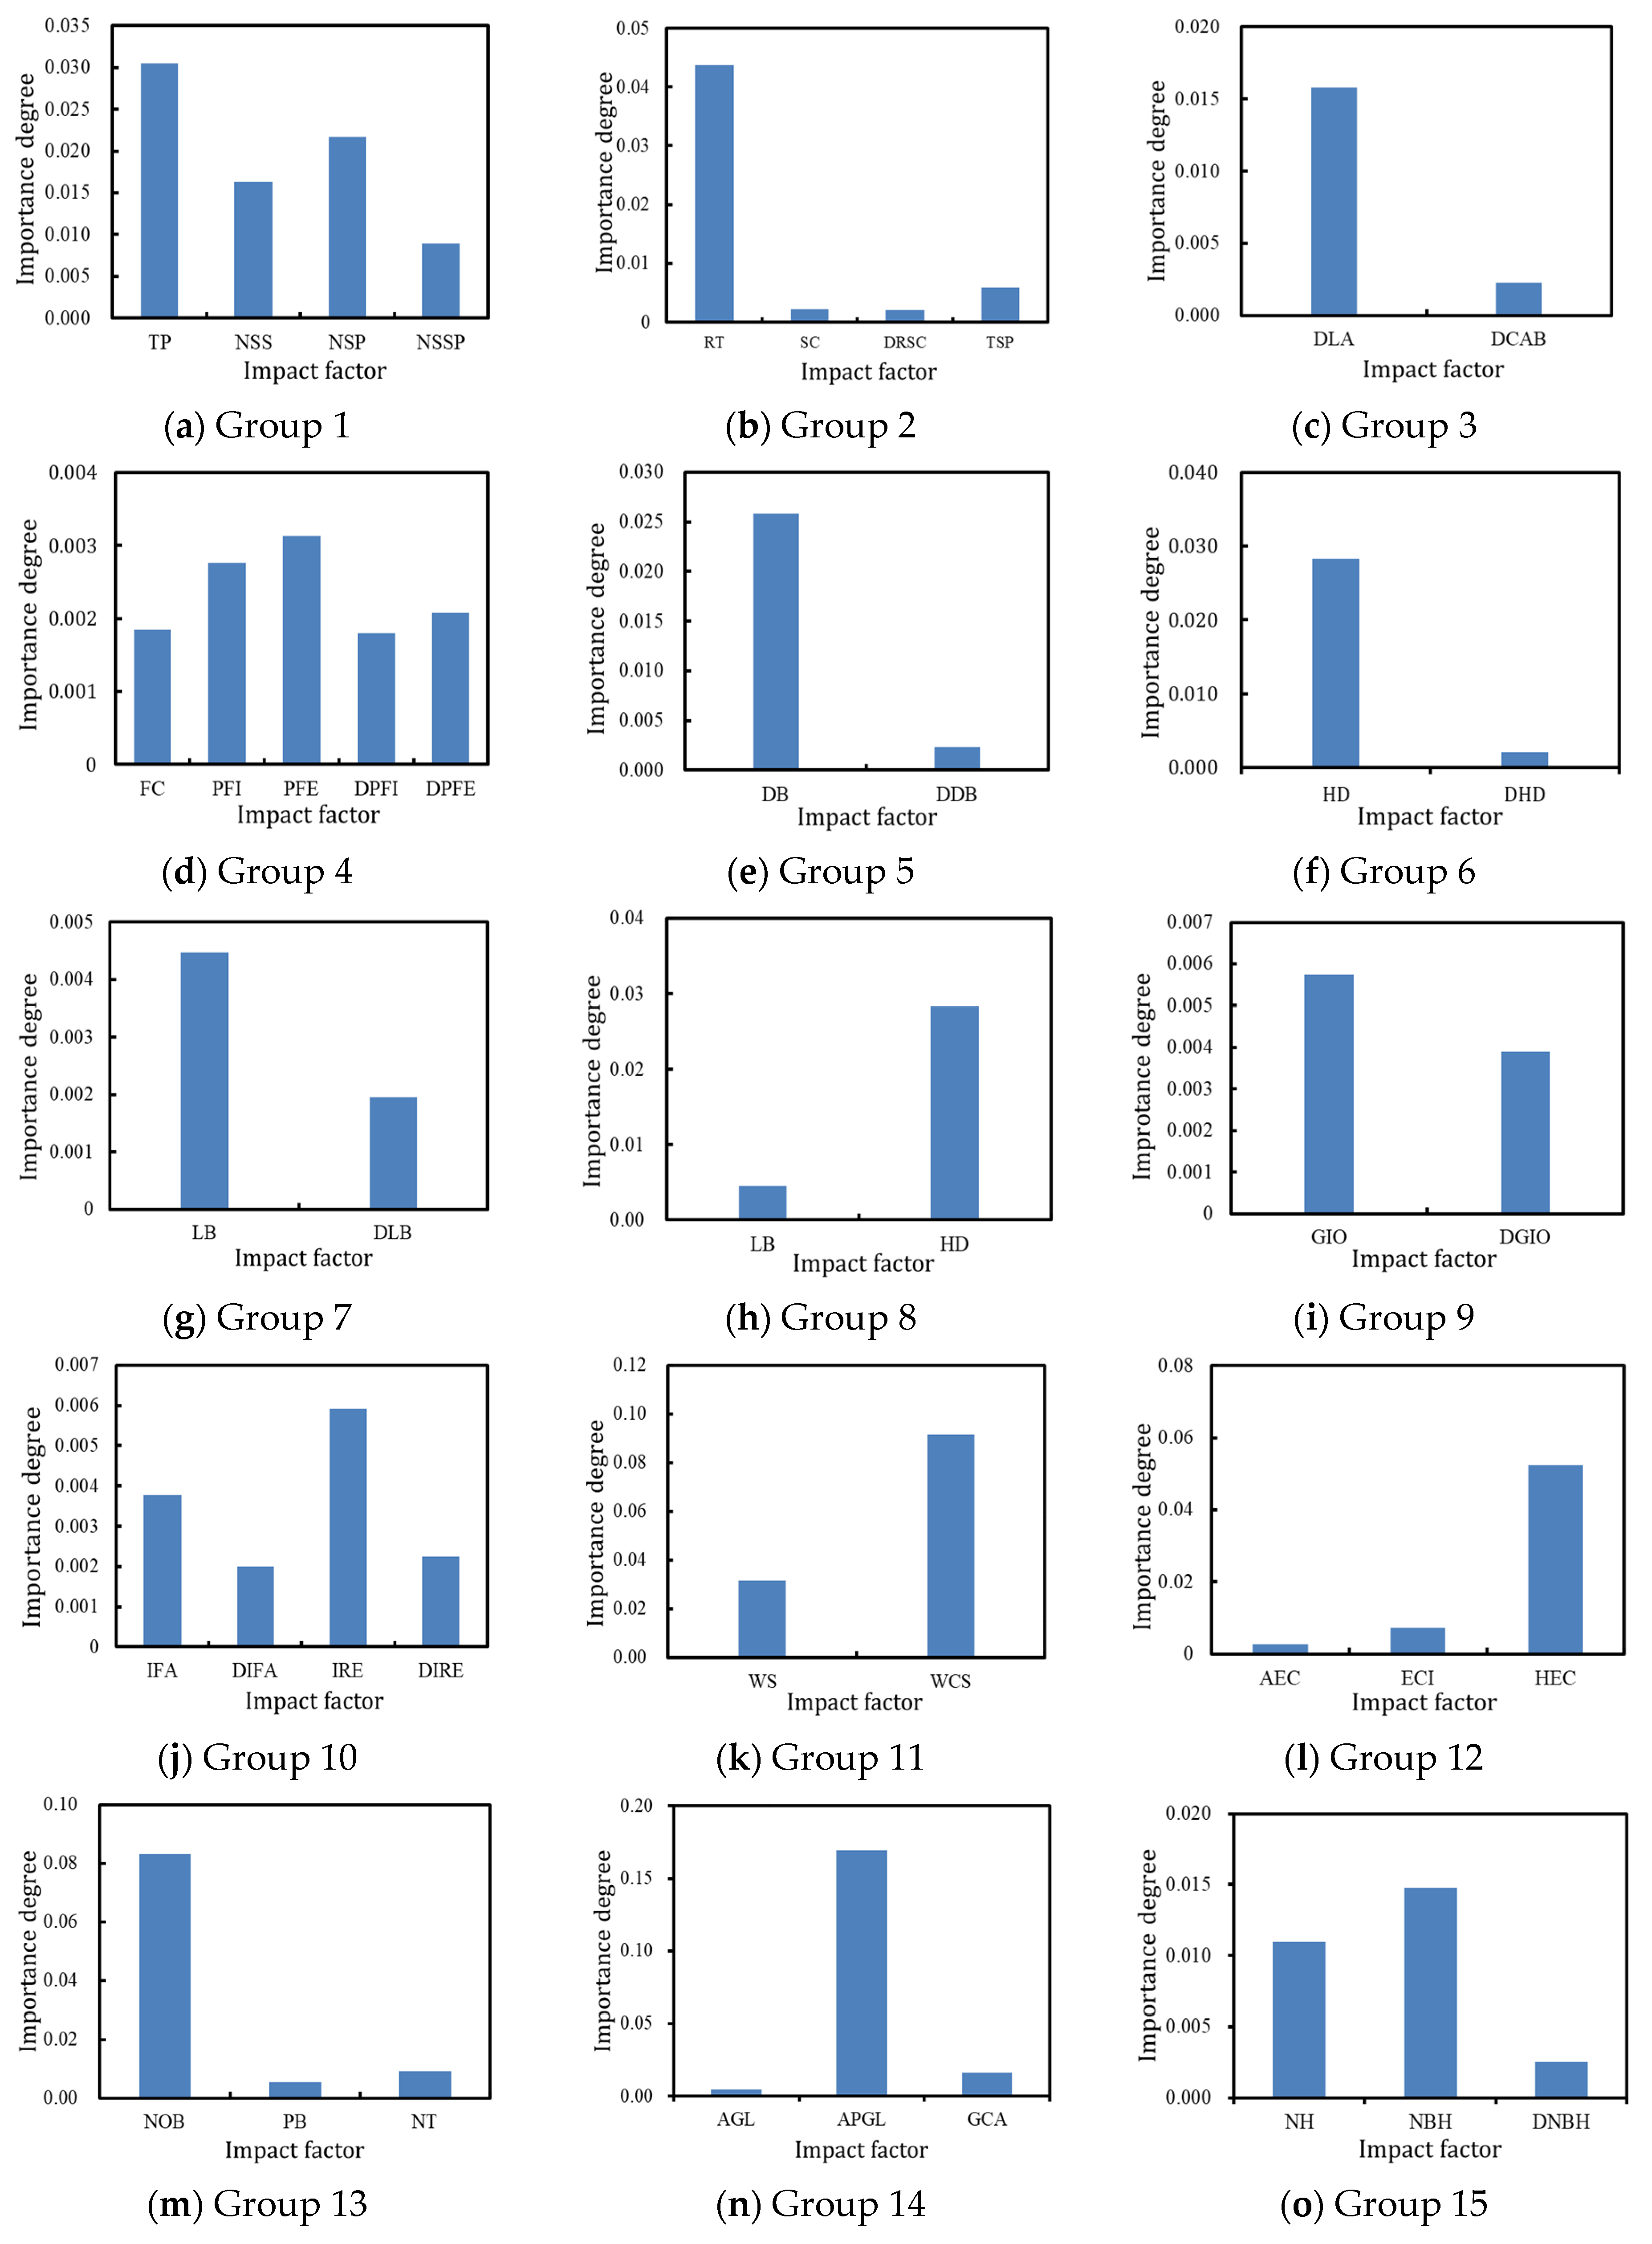
| Group | Highly Correlated Impact Factors | Group | Highly Correlated Impact Factors |
|---|---|---|---|
| 1 | NSS, NSP, NSSP, TP | 8 | DLB, HD |
| 2 | RT, SC, DRSC, TSP | 9 | GIO, DGIO |
| 10 | IFA, DIFA, IRE, DIRE | ||
| 3 | DLA, DCAB | 11 | WS, WCS |
| 4 | FC, PFI, PFE, DPFI, DPFE | 12 | AEC, ECI, HEC |
| 5 | DB, DDB | 13 | NOB, PB, NT |
| 6 | HD, DHD | 14 | AGL, APGL, GCA |
| 7 | LB, DLB | 15 | NH, NBH, DNBH |
6. Phase II: Model Prediction and Evaluation
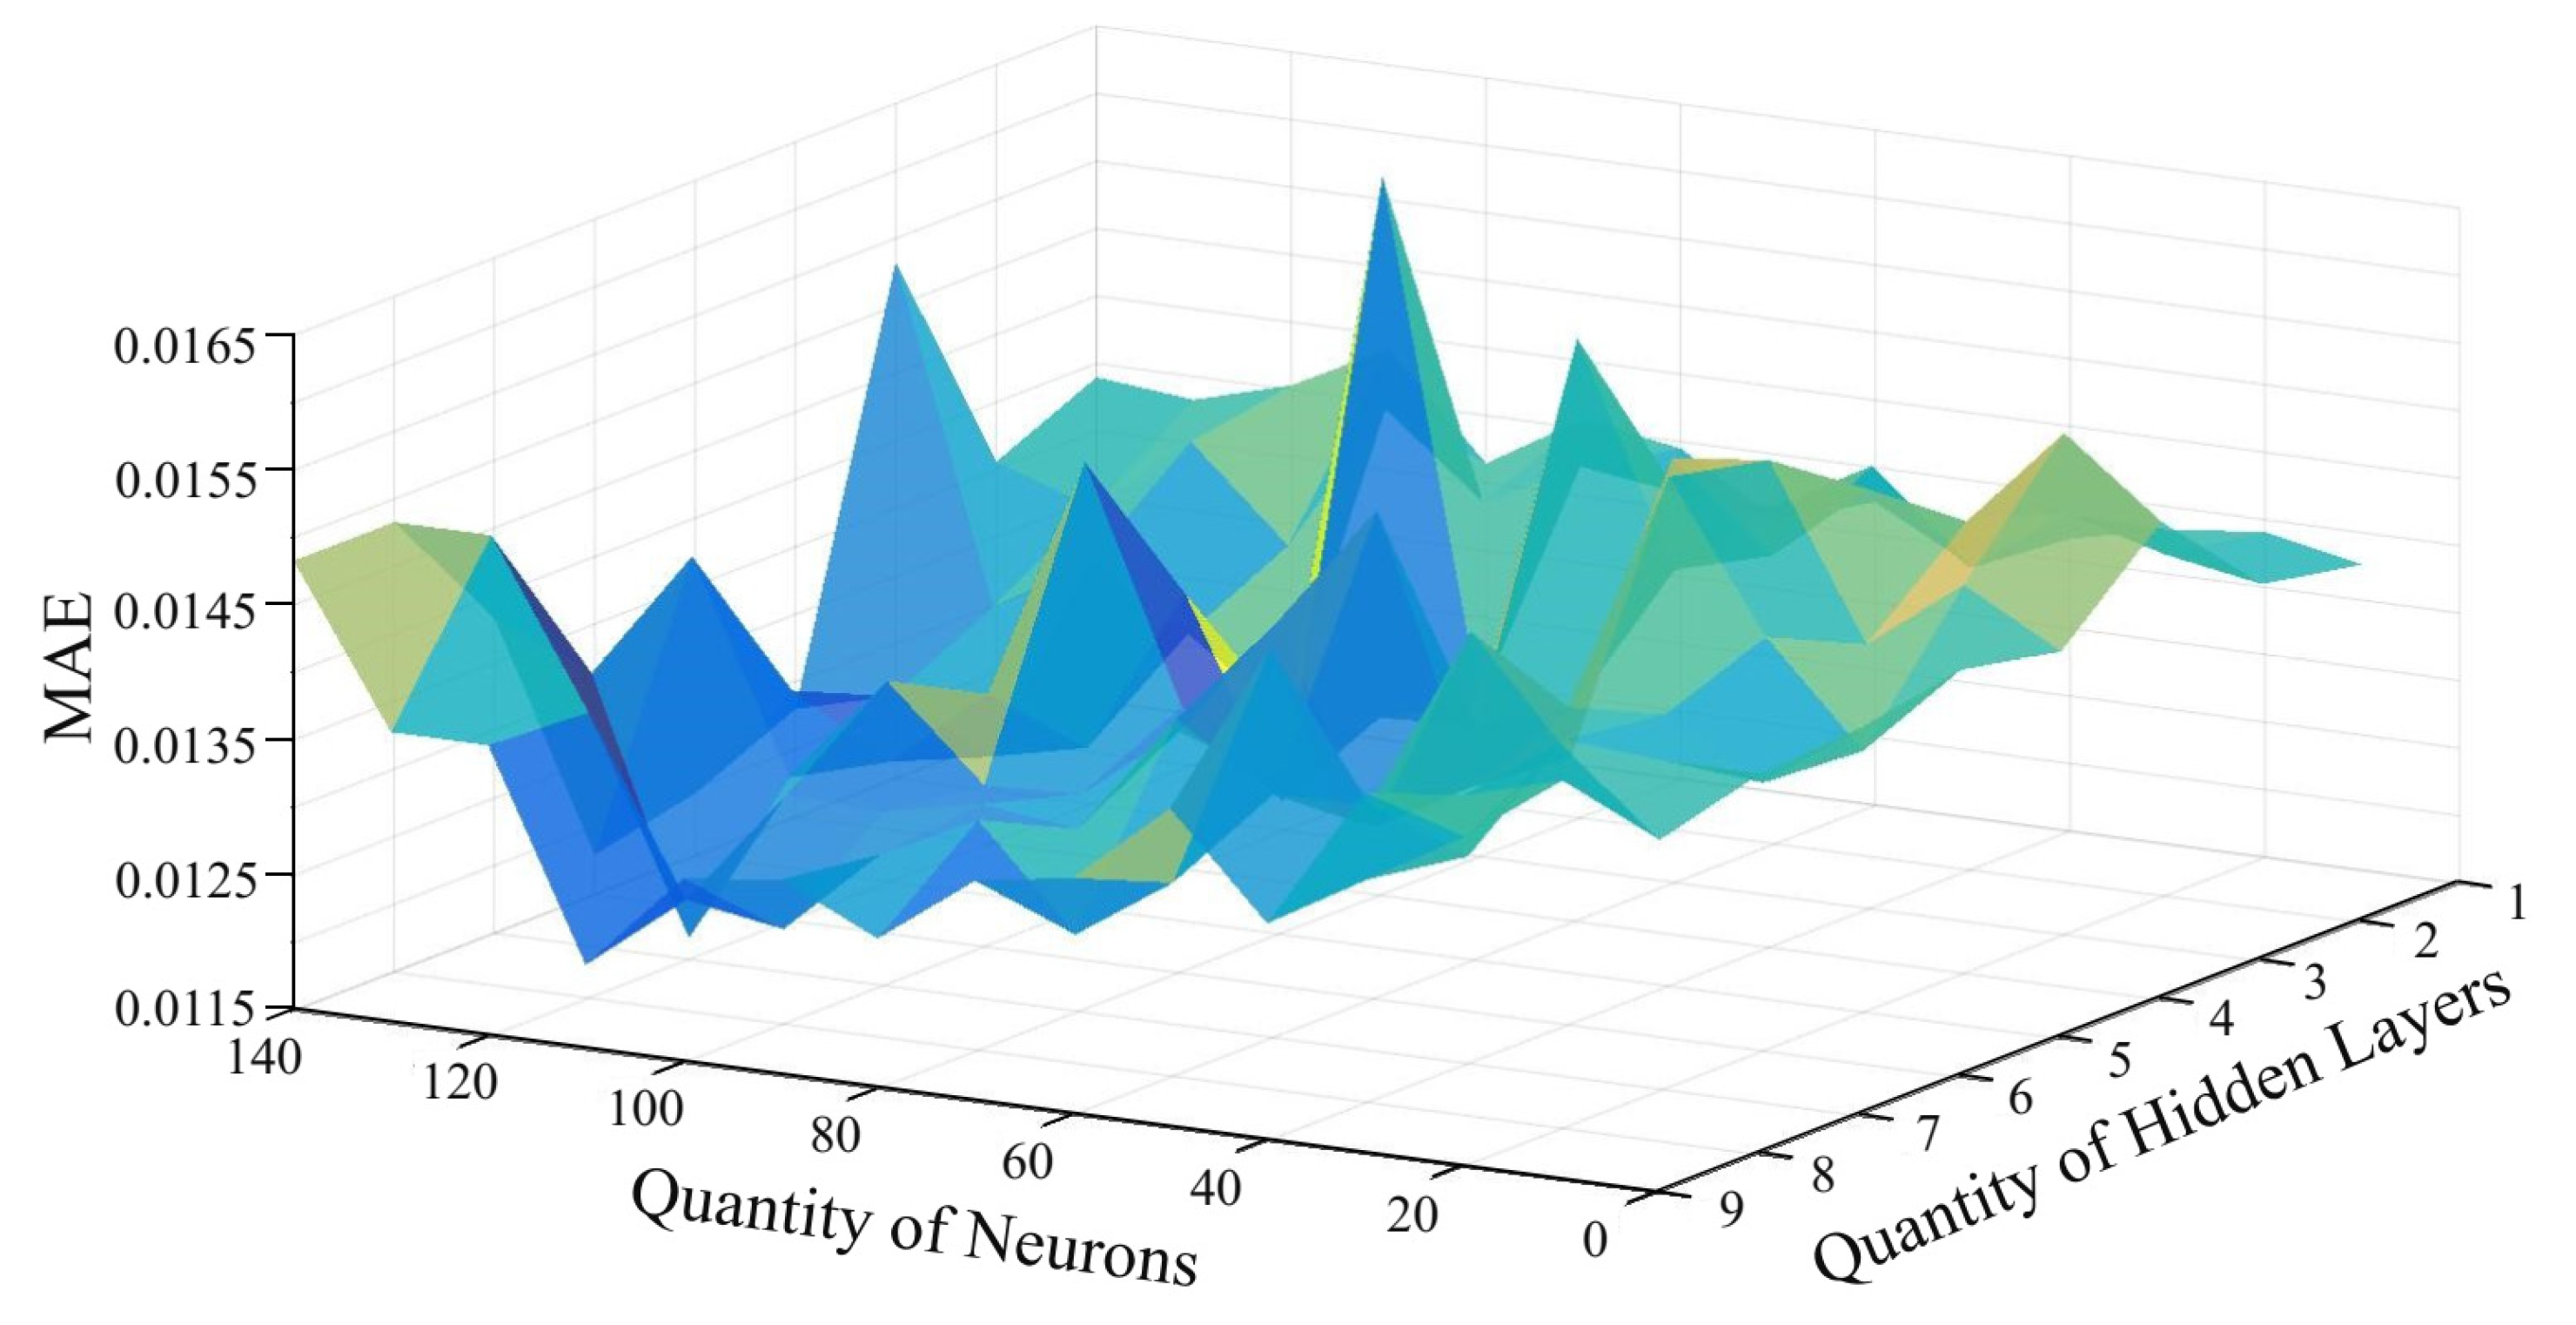
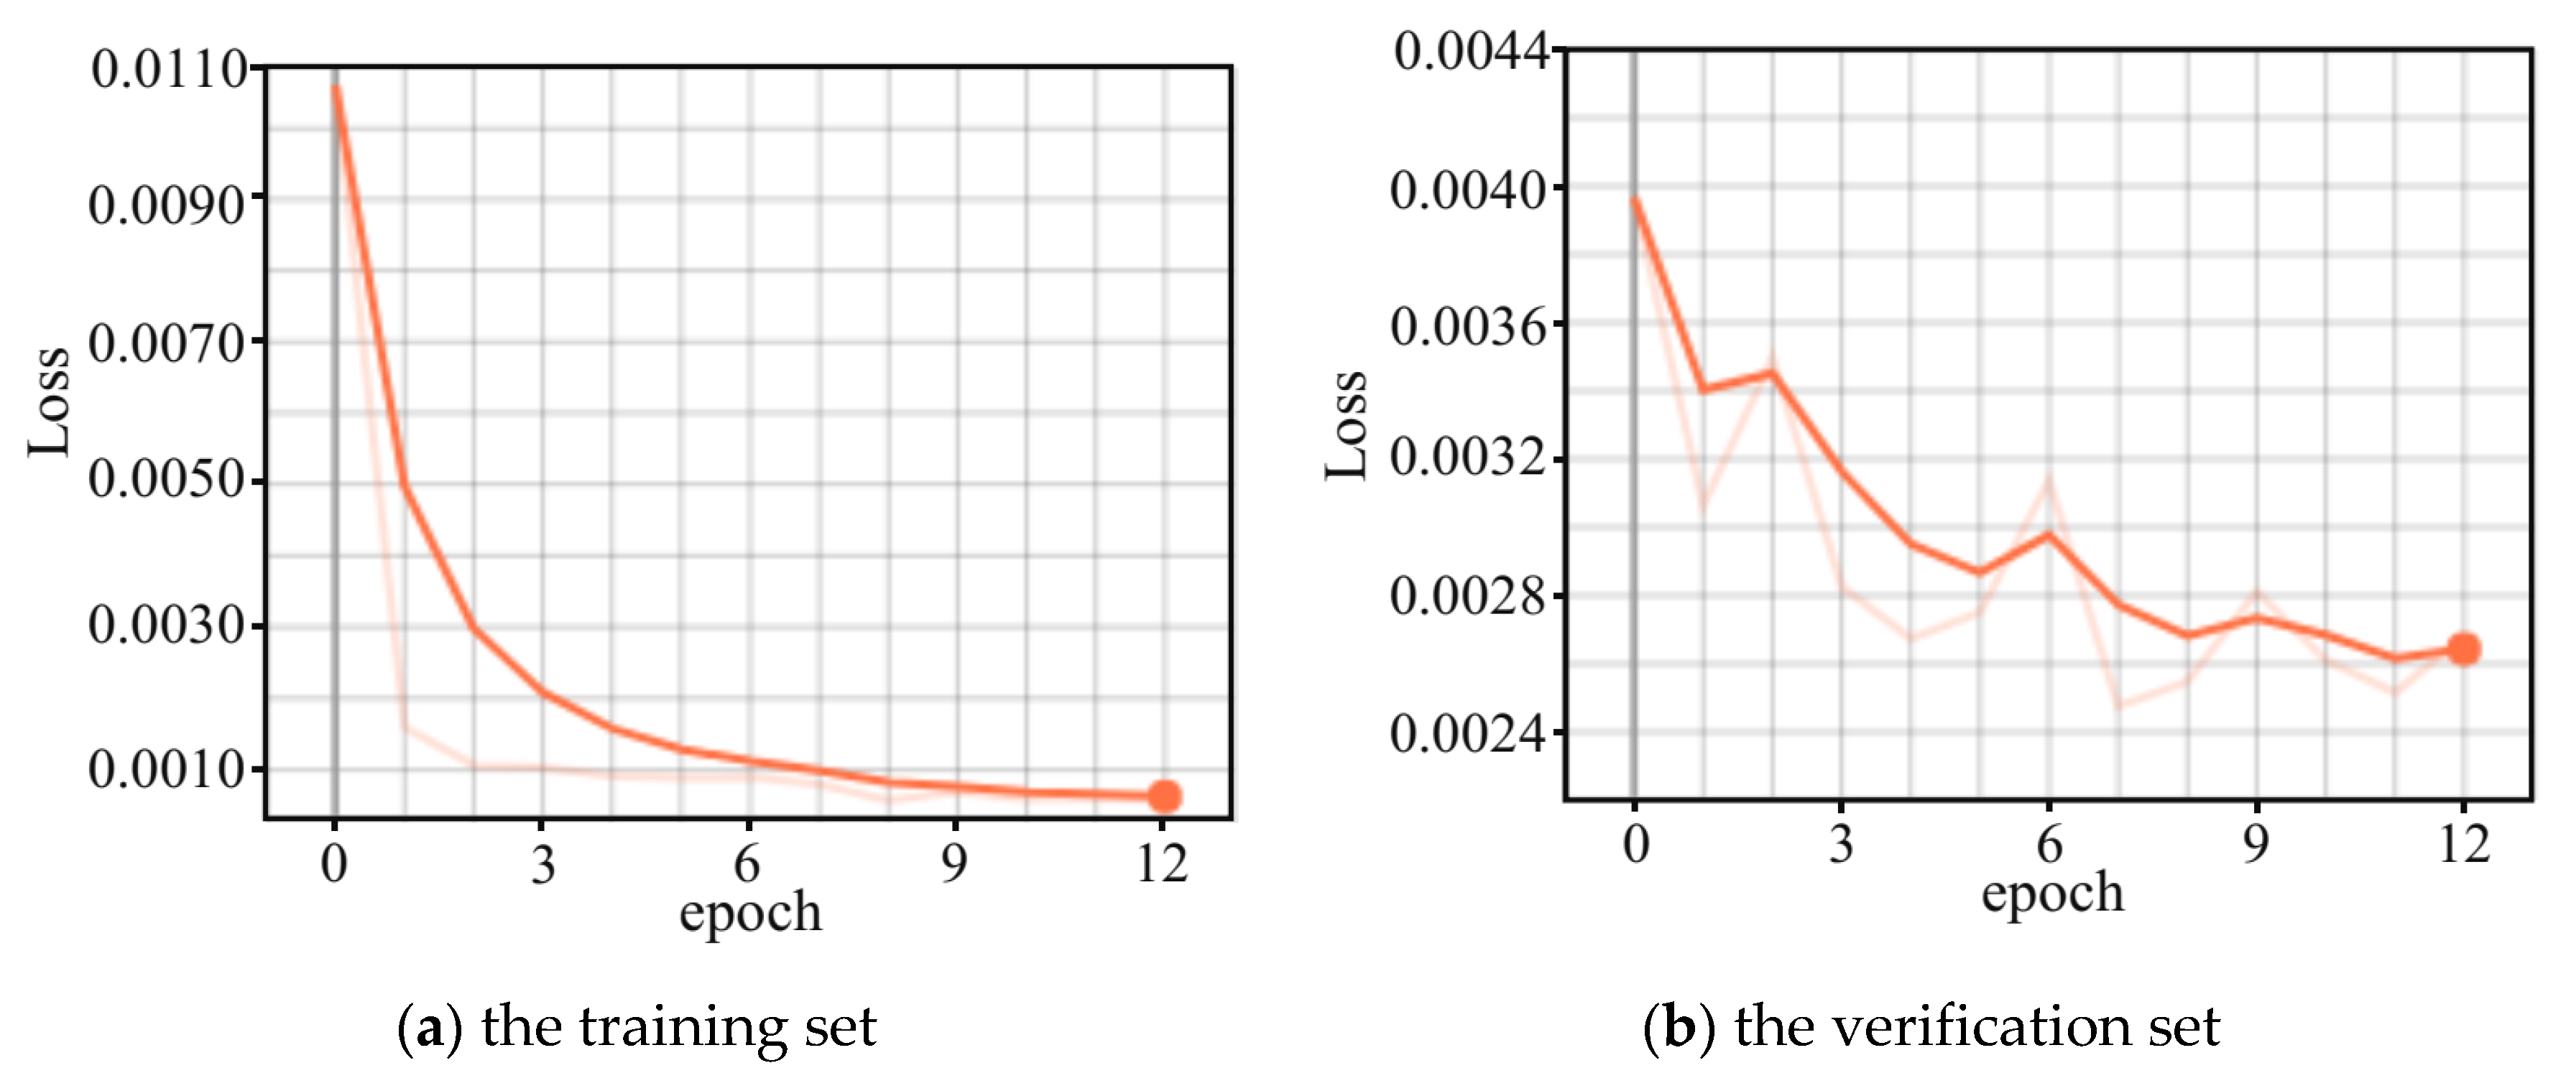
6.1. Model Prediction
6.2. Model Evaluation
7. Conclusions
- (1)
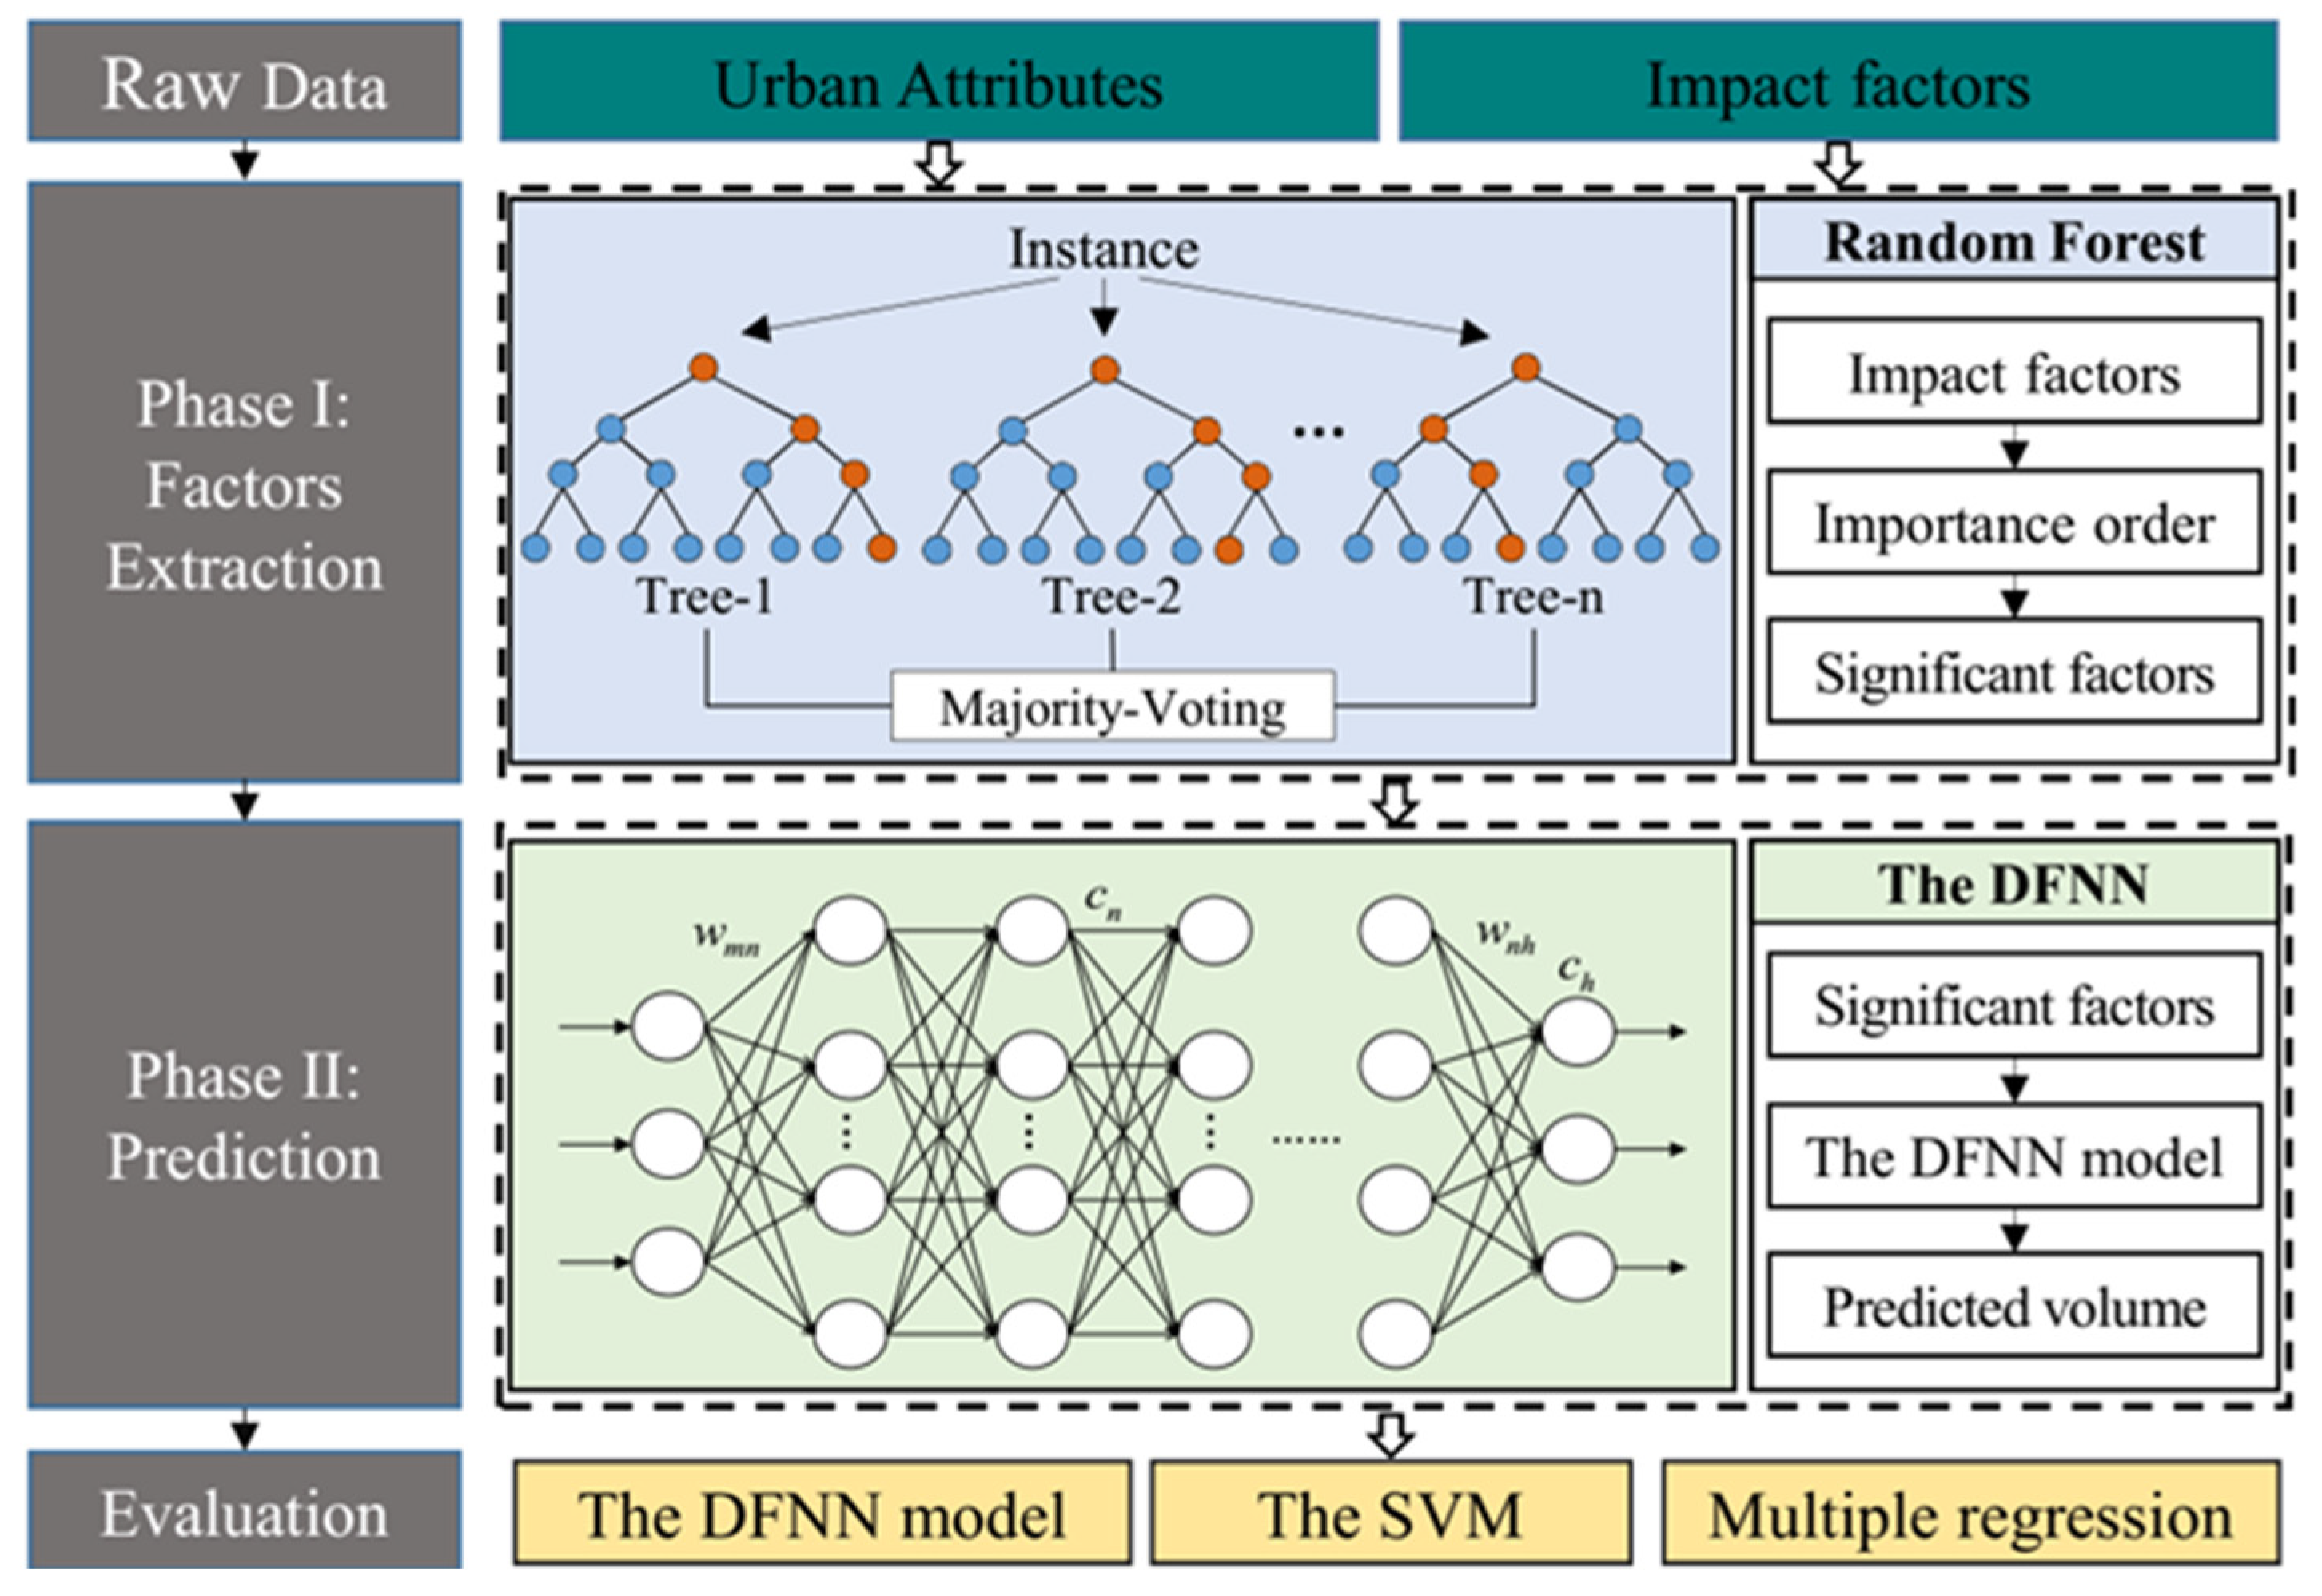
- A two-phase approach, in which Phase I extracts the significant impact factors and Phase II develops a deep learning model to achieve the prediction, was proposed to predict the highway passenger volume with the dataset of multiple urban attributes;
- (2)
- Phase I extracted a dataset with 30 significant factors reflecting urban economic level, urban population size and structure, per-capita income and consumption, urban industrial structure, and resource and environments with the RF algorithm and proved that they have a significant impact on highway passenger volume.
- (3)
- Phase II developed the deep learning method, DFNN, to predict the highway passenger volume with a mean absolute error of 2066.31 persons per day, improving the predicted accuracy by 8.49% compared to the multiple regression and 2.20% compared to the SVM algorithm.
Author Contributions
Funding
Institutional Review Board Statement
Informed Consent Statement
Data Availability Statement
Acknowledgments
Conflicts of Interest
Appendix A
| Category | Impact Factors | Symbol | Units |
|---|---|---|---|
| Urban Economic Level | Regional Gross Domestic Product | GDP | yuan |
| Per-capita Regional Gross Domestic Product | PCGDP | yuan | |
| Total Sales of Retail Commodities | SC | yuan | |
| Total Retail Sales of Consumer Goods of the City | RSC | yuan | |
| Total Retail Sales of Consumer Goods of the Districts | DRSC | yuan | |
| Public Financial Income of the City | PFI | yuan | |
| Public Financial Expenditure of the City | PFE | yuan | |
| Public Financial Income of the Districts | DPFI | yuan | |
| Public Financial Expenditure of the Districts | DPFE | yuan | |
| Foreign Capital Used in the Year | FC | dollar | |
| Investment in Fixed Assets of the City | IFA | yuan | |
| Investment in Fixed Assets of the Districts | DIFA | yuan | |
| Investment in Real Estate of the City | IRE | yuan | |
| Investment in Real Estate of the Districts | DIRE | yuan | |
| Revenue of Postal Business | RP | yuan | |
| Revenue of Telecommunication Business | RT | yuan | |
| Gross Industrial Output Value of the City | GIO | yuan | |
| Gross Industrial Output Value of the Districts | DGIO | yuan | |
| Electricity Consumption of Industry | ECI | KW⋅h | |
| Urban Population Size and Structure | Total Population of the City | TP | -- |
| Number of Students in the Colleges or Universities | NSC | -- | |
| Number of Students in the Secondary School | NSS | -- | |
| Number of Students in the Primary School | NSP | -- | |
| Number of Students in the Primary–Secondary School | NSSP | -- | |
| Number of Workers in the Primary Industry | WPI | -- | |
| Number of Workers in the Secondary Industry | WSI | -- | |
| Number of Workers in the Third Industry | WTI | -- | |
| Number of Workers in the Transportation, Storage and Postal Services | TSP | -- | |
| Population Density of the City | PD | /Km2 | |
| Population Density of the Districts | DPD | /Km2 | |
| Population Using Liquefied Petroleum Gas | PLPG | -- | |
| Per-capita income and Consumption | Average Wage of Workers | AWW | yuan |
| Deposit Balance of Financial Institutions of the City | DB | yuan | |
| Deposit Balance of Financial Institutions of the Districts | DDB | yuan | |
| Deposit Balance of Household of the City | HD | yuan | |
| Deposit Balance of Household of the Districts | DHD | yuan | |
| Loan Balance of Financial Institutions of the City | LB | yuan | |
| Loan Balance of Financial Institutions of the Districts | DLB | yuan | |
| Water Consumption of Society | WCS | ton | |
| Electricity Consumption of Household | HEC | KWh | |
| Consumption of Liquefied Petroleum Gas for Resident | CLPGR | ton | |
| Total Water Supply | WS | ton | |
| All the Electricity Consumption of the Society | AEC | KWh | |
| Urban Industrial Structure | The proportion of Primary Industry | PI | % |
| The proportion of Secondary Industry | SI | % | |
| The proportion of Third Industry | TI | % | |
| Resource and Environment | Administrative Land Area of the City | LA | Km2 |
| Administrative Land Area of the Districts | DLA | Km2 | |
| Construction Area of Buildings of the Districts | DCAB | Km2 | |
| Land Area for Construction | LC | Km2 | |
| Actual Urban Road Area | CPR | m2 | |
| Number of Operating Public Buses | NOB | veh | |
| Total Passenger Volume of Public Buses in the Year | PB | -- | |
| Number of Operating Taxis | NT | veh | |
| Number of Buses for Ten Thousand People | PTPT | veh | |
| Average Per-capita Road | APR | m2 | |
| All the Green Land Area | AGL | Km2 | |
| All the Green Land Area of Parks | APGL | Km2 | |
| Green Land Area of Construction Area | GCA | Km2 | |
| The Proportion of Green Land of Construction Area | GCAP | % | |
| Number of Hospitals of the City | NH | -- | |
| Number of Hospitals of the Districts | DNH | -- | |
| Number of Hospital Beds of the City | NBH | -- | |
| Number of Hospital Beds of the Districts | DNBH | -- | |
| Number of Theatres and Movie Theatres | NTM | -- | |
| Total Collection of Books in Public Libraries | CPL | -- | |
| Industrial Discharge of Waste Water | VDWW | ton | |
| Industrial Sulfur Dioxide Emission | VSDE | ton | |
| Removal Amount of Industrial Smoke and Dust | VISR | ton |
References
- Lin, L.; Hao, Z.; Post, C.J.; Mikhailova, E.A.; Yu, K.; Yang, L.; Liu, J. Monitoring Land Cover Change on a Rapidly Urbanizing Island Using Google Earth Engine. Appl. Sci. 2020, 10, 7336. [Google Scholar] [CrossRef]
- Bong, A.; Premaratne, G. Regional Integration and Economic Growth in Southeast Asia. Glob. Bus. Rev. 2018, 19, 1403–1415. [Google Scholar] [CrossRef]
- Liu, J.; Wu, N.; Qiao, Y.; Li, Z. A scientometric review of research on traffic forecasting in transportation. IET Intell. Transp. Syst. 2021, 15, 1–16. [Google Scholar] [CrossRef]
- Chen, J.; Li, D.; Zhang, G.; Zhang, X. Localized Space-Time Autoregressive Parameters Estimation for Traffic Flow Prediction in Urban Road Networks. Appl. Sci. 2018, 8, 277. [Google Scholar] [CrossRef] [Green Version]
- Xiang, Y.; Xu, C.; Yu, W.; Wang, S.; Hua, X.; Wang, W. Investigating Dominant Trip Distance for Intercity Passenger Transport Mode Using Large-Scale Location-Based Service Data. Sustainability 2019, 11, 5325. [Google Scholar] [CrossRef] [Green Version]
- Li, X.; Tang, J.; Hu, X.; Wang, W. Assessing intercity multimodal choice behavior in a Touristy City: A factor analysis. J. Transp. Geogr. 2020, 86, 102776. [Google Scholar] [CrossRef]
- Soltani, A.; Allan, A. Analyzing the Impacts of Microscale Urban Attributes on Travel: Evidence from Suburban Adelaide, Australia. J. Urban Plan. Dev. 2006, 132, 132–137. [Google Scholar] [CrossRef]
- Miao, D.; Wang, W.; Xiang, Y.; Hua, X.; Yu, W. Analysis on the Influencing Factors of Traffic Mode Choice Behavior for Regional Travel in China. In CICTP 2020; American Society of Civil Engineers (ASCE): Virginia, VA, USA, 2020; pp. 3969–3980. [Google Scholar]
- Nikravesh, A.Y.; Ajila, S.A.; Lung, C.-H.; Ding, W. Mobile Network Traffic Prediction Using MLP, MLPWD, and SVM. In Proceedings of the 2016 IEEE International Congress on Big Data (BigData Congress), Washington, DC, USA, 5–8 December 2016; Institute of Electrical and Electronics Engineers (IEEE): San Francisco, CA, USA, 2016; pp. 402–409. [Google Scholar]
- Gu, Y.; Lu, W.; Xu, X.; Qin, L.; Shao, Z.; Zhang, H. An improved Bayesian combination model for short-term traffic prediction with deep learning. IEEE Trans. Intell. Transp. Syst. 2019, 21, 1332–1342. [Google Scholar] [CrossRef]
- Lin, L.; Handley, J.; Gu, Y.; Zhu, L.; Wen, X.; Sadek, A.W. Quantifying uncertainty in short-term traffic prediction and its application to optimal staffing plan development. Transp. Res. Part C Emerg. Technol. 2018, 92, 323–348. [Google Scholar] [CrossRef]
- Brueckner, J.K. Airline Traffic and Urban Economic Development. Urban Stud. 2003, 40, 1455–1469. [Google Scholar] [CrossRef]
- Caceres, N.; Romero, L.M.; Morales, F.J.; Reyes, A.; Benitez, F.G. Estimating traffic volumes on intercity road locations using roadway attributes, socioeconomic features and other work-related activity characteristics. Transportation 2018, 45, 1449–1473. [Google Scholar] [CrossRef]
- Chen, W.; Liu, W.; Ke, W.; Wang, N. Understanding spatial structures and organizational patterns of city networks in China: A highway passenger flow perspective. J. Geogr. Sci. 2018, 28, 477–494. [Google Scholar] [CrossRef] [Green Version]
- Antipova, A.; Wang, F.; Wilmot, C. Urban land uses, socio-demographic attributes and commuting: A multilevel modeling approach. Appl. Geogr. 2011, 31, 1010–1018. [Google Scholar] [CrossRef]
- Low, J.M.; Lee, B.K. A Data-Driven Analysis on the Impact of High-Speed Rails on Land Prices in Taiwan. Appl. Sci. 2020, 10, 3357. [Google Scholar] [CrossRef]
- Limtanakool, N.; Dijst, M.; Schwanen, T. The influence of socioeconomic characteristics, land use and travel time considera-tions on mode choice for medium- and longer-distance trips. J. Transp. Geogr. 2006, 14, 327–341. [Google Scholar] [CrossRef]
- De Witte, A.; Hollevoet, J.; Dobruszkes, F.; Hubert, M.; Macharis, C. Linking modal choice to motility: A comprehensive review. Transp. Res. Part A Policy Pract. 2013, 49, 329–341. [Google Scholar] [CrossRef]
- Tian, Y.; Yao, X. Urban form, traffic volume, and air quality: A spatiotemporal stratified approach. Environ. Plan. B Urban Anal. City Sci. 2021, 2399808321995822. [Google Scholar] [CrossRef]
- Li, Z.; Wang, Y.; Zhao, S. Study of Intercity Travel Characteristics in Chinese Urban Agglomeration. Int. Rev. Spat. Plan. Sustain. Dev. 2015, 3, 75–85. [Google Scholar] [CrossRef] [Green Version]
- Lee, D.; Derrible, S.; Pereira, F.C. Comparison of Four Types of Artificial Neural Network and a Multinomial Logit Model for Travel Mode Choice Modeling. Transp. Res. Rec. J. Transp. Res. Board 2018, 2672, 101–112. [Google Scholar] [CrossRef] [Green Version]
- Bhatta, B.P.; Larsen, O.I. Errors in variables in multinomial choice modeling: A simulation study applied to a multinomial logit model of travel mode choice. Transp. Policy 2011, 18, 326–335. [Google Scholar] [CrossRef] [Green Version]
- Huang, B.; Fioreze, T.; Thomas, T.; Van Berkum, E. Multinomial logit analysis of the effects of five different app-based incentives to encourage cycling to work. IET Intell. Transp. Syst. 2018, 12, 1421–1432. [Google Scholar] [CrossRef]
- Jourquin, B. Mode choice in strategic freight transportation models: A constrained Box–Cox meta-heuristic for multivariate utility functions. Transp. A Transp. Sci. 2021, 1–21. [Google Scholar] [CrossRef]
- Elmorssy, M.; Onur, T.H. Modelling Departure Time, Destination and Travel Mode Choices by Using Generalized Nested Logit Model: Discretionary Trips. Int. J. Eng. 2020, 33, 186–197. [Google Scholar] [CrossRef]
- Rahmat, O.K. Modeling of intercity transport mode choice behavior in Libya: A binary logit model for business trips by private car and intercity bus. Aust. J. Basic Appl. Sci. 2013, 7, 302–311. [Google Scholar]
- Wang, R.; Zhang, T.; Liu, S.; Zhang, Z. Prediction of Passenger Traffic Volume Sharing Rate Based on Logit Model. In Proceedings of the 3rd International Conference on Information Technology and Intelligent Transportation Systems (ITITS 2018), Xi’an, China, 15–16 September 2018; p. 296. [Google Scholar]
- Harker, P.T.; Friesz, T.L. Prediction of intercity freight flows, I: Theory. Transp. Res. Part B Methodol. 1986, 20, 139–153. [Google Scholar] [CrossRef]
- Li, H.-L.; Lin, M.-K.; Wang, Q.-C. Passenger Flow Prediction Model of Intercity Railway Based on G-BP Network. In Lecture Notes in Electrical Engineering; Springer Science and Business Media LLC: Berlin/Heidelberg, Germany, 2020; pp. 859–870. [Google Scholar]
- Xie, B.; Sun, Y.; Huang, X.; Yu, L.; Xu, G. Travel Characteristics Analysis and Passenger Flow Prediction of Intercity Shuttles in the Pearl River Delta on Holidays. Sustainability 2020, 12, 7249. [Google Scholar] [CrossRef]
- Lv, Y.; Duan, Y.; Kang, W.; Li, Z.; Wang, F.-Y. Traffic Flow Prediction With Big Data: A Deep Learning Approach. IEEE Trans. Intell. Transp. Syst. 2014, 16, 1–9. [Google Scholar] [CrossRef]
- Moreira-Matias, L.; Gama, J.; Ferreira, M.; Mendes-Moreira, J.; Damas, L. Predicting Taxi–Passenger Demand Using Streaming Data. IEEE Trans. Intell. Transp. Syst. 2013, 14, 1393–1402. [Google Scholar] [CrossRef] [Green Version]
- Yin, X.; Wu, G.; Wei, J.; Shen, Y.; Qi, H.; Yin, B. Deep Learning on Traffic Prediction: Methods, Analysis and Future Directions; IEEE: New York City, NY, USA, 2021. [Google Scholar]
- Tortum, A.; Yayla, N.; Gökdağ, M. The modeling of mode choices of intercity freight transportation with the artificial neural networks and adaptive neuro-fuzzy inference system. Expert Syst. Appl. 2009, 36, 6199–6217. [Google Scholar] [CrossRef]
- Allard, R.F.; Moura, F. The Incorporation of Passenger Connectivity and Intermodal Considerations in Intercity Transport Planning. Transp. Rev. 2016, 36, 251–277. [Google Scholar] [CrossRef]
- Le, H.T.; West, A.; Quinn, F.; Hankey, S. Advancing cycling among women: An exploratory study of North American cyclists. J. Transp. Land Use 2019, 12, 355–374. [Google Scholar] [CrossRef] [Green Version]
- Pal, M. Random forest classifier for remote sensing classification. Int. J. Remote. Sens. 2005, 26, 217–222. [Google Scholar] [CrossRef]
- Sun, J.; Sun, J. Real-time crash prediction on urban expressways: Identification of key variables and a hybrid support vector machine model. IET Intell. Transp. Syst. 2016, 10, 331–337. [Google Scholar] [CrossRef]
- Xu, C.; Ji, J.; Liu, P. The station-free sharing bike demand forecasting with a deep learning approach and large-scale datasets. Transp. Res. Part C Emerg. Technol. 2018, 95, 47–60. [Google Scholar] [CrossRef]
- Xie, Z.; Zhu, J.; Wang, F.; Li, W.; Wang, T. Long short-term memory based anomaly detection: A case study of China railway passen-ger ticketing system. IET Intell. Transp. Syst. 2020. [Google Scholar] [CrossRef]
- Liu, P.; Zhang, Y.; Kong, D.; Yin, B. Improved Spatio-Temporal Residual Networks for Bus Traffic Flow Prediction. Appl. Sci. 2019, 9, 615. [Google Scholar] [CrossRef] [Green Version]
- Oliveira, T.P.; Barbar, J.S.; Soares, A.S. Computer network traffic prediction: A comparison between traditional and deep learning neural networks. Int. J. Big Data Intell. 2016, 3, 28. [Google Scholar] [CrossRef]
- Glorot, X.; Bengio, Y. Understanding the difficulty of training deep feedforward neural networks. In Proceedings of the Thirteenth International Conference on Artificial Intelligence and Statistics, Chia Laguna Resort, Sardinia, Italy, 13–15 May 2010; pp. 249–256. [Google Scholar]
- Gupta, T.K.; Raza, K. Optimizing Deep Feedforward Neural Network Architecture: A Tabu Search Based Approach. Neural Process. Lett. 2020, 51, 2855–2870. [Google Scholar] [CrossRef]
- Loiseau, P.; Boultifat, C.N.E.; Chevrel, P.; Claveau, F.; Espié, S.; Mars, F. Rider model identification: Neural networks and quasi-LPV models. IET Intell. Transp. Syst. 2020, 14, 1259–1264. [Google Scholar] [CrossRef]
- Agarap, A.F. Deep learning using rectified linear units (relu). arXiv 2018, arXiv:1803.08375. [Google Scholar]
- Eckle, K.; Schmidt-Hieber, J. A comparison of deep networks with ReLU activation function and linear spline-type methods. Neural Netw. 2019, 110, 232–242. [Google Scholar] [CrossRef] [PubMed]


| Category | Included Impact Factors |
|---|---|
| Urban economic level | GDP, RSC, RT, GIO |
| Urban population size and structure | TP, NSC, WPI, WSI, WTI, PD, PLPG |
| Per-capita income and consumption | AWW, DB, HD, WCS, HEC |
| Urban industrial structure | PI, SI, TI |
| Resource and environment | DLA, LC, NOB, APR, APGL, GCAP, NBH, NTM, CPL, VDWW, VSDE |
| Kernel Function | Set of Penalty Coefficients |
| RBF | [0.001, 0.01, 0.1, 1, 10, 100, 1000] |
| Linear Function | [0.001, 0.01, 0.1, 1, 10, 100, 1000] |
| Kernel Function | Set of Gamma Coefficients |
| RBF | [0.0001, 0.001, 0.1, 1, 10, 100, 1000] |
| Linear Function | -- |
| Model | MAE | RMSE |
|---|---|---|
| Multiple regression | 2258.05 | 4270.29 |
| SVM algorithm | 2128.03 | 4225.06 |
| DFNN | 2066.31 | 4176.37 |
Publisher’s Note: MDPI stays neutral with regard to jurisdictional claims in published maps and institutional affiliations. |
© 2021 by the authors. Licensee MDPI, Basel, Switzerland. This article is an open access article distributed under the terms and conditions of the Creative Commons Attribution (CC BY) license (https://creativecommons.org/licenses/by/4.0/).
Share and Cite
Xiang, Y.; Chen, J.; Yu, W.; Wu, R.; Liu, B.; Wang, B.; Li, Z. A Two-Phase Approach for Predicting Highway Passenger Volume. Appl. Sci. 2021, 11, 6248. https://doi.org/10.3390/app11146248
Xiang Y, Chen J, Yu W, Wu R, Liu B, Wang B, Li Z. A Two-Phase Approach for Predicting Highway Passenger Volume. Applied Sciences. 2021; 11(14):6248. https://doi.org/10.3390/app11146248
Chicago/Turabian StyleXiang, Yun, Jingxu Chen, Weijie Yu, Rui Wu, Bing Liu, Baojie Wang, and Zhibin Li. 2021. "A Two-Phase Approach for Predicting Highway Passenger Volume" Applied Sciences 11, no. 14: 6248. https://doi.org/10.3390/app11146248
APA StyleXiang, Y., Chen, J., Yu, W., Wu, R., Liu, B., Wang, B., & Li, Z. (2021). A Two-Phase Approach for Predicting Highway Passenger Volume. Applied Sciences, 11(14), 6248. https://doi.org/10.3390/app11146248