Article

Calibration of a Low-Cost 8×8 Active Phased Array Antenna

by
Xiaoliang Sun
1,
Jorge Calatayud-Maeso
1,
Alfonso-Tomás Muriel-Barrado
2,
José-Manuel Fernández-González
1 and
Manuel Sierra-Castañer
1,*
1
Radiation Group, Signal, Systems and Radiocommunications Department, E.T.S.I. Telecommunicación Universidad Politécnica de Madrid, 28040 Madrid, Spain
2
Group of Radiofrequency: Circuits, Antennas and Systems (RFCAS), Escuela Politécnica Superior, Universidad Autónoma de Madrid, 28049 Madrid, Spain
*
Author to whom correspondence should be addressed.
Appl. Sci. 2025, 15(7), 4066; https://doi.org/10.3390/app15074066
Submission received: 25 February 2025 / Revised: 26 March 2025 / Accepted: 2 April 2025 / Published: 7 April 2025
(This article belongs to the Special Issue Multi-Band/Broadband Antenna Design, Optimization and Measurement)

Abstract

:
This paper presents the calibration process involved in a planar active phased array antenna operating in the K-band (17.7–20.2 GHz). The array consists of eight columns, each containing a 1 × 8 subarray of patch antennas. To enhance the antenna bandwidth, a double-stacked patch structure is employed. We analyze the challenges encountered when measuring active antennas. Additionally, we discuss the solutions and calibration techniques used to improve the array performance. Finally, we present the results of the optimal calibration approach, comparing simulated and measured data, both with and without calibration, to evaluate the improvements achieved.

1. Introduction

The new requirement for 5G satellite communications for future mobile communications encourages the investigation of new technologies to meet market demand for latency reduction, higher speed of communications and flexibility [1]. The revolution is in development in markets such as automotive, energy, entertainment and defense that want to benefit from the capabilities of 5G technology to fulfill the demands of businesses and consumers [1,2,3]. The main advantage of 5G satellite communication is its non-geographic dependency; it is capable of providing connectivity anywhere, by sea or air, for mobile devices, planes, ships and high-speed trains [1,4,5].
The use of a millimeter band and phased array antenna is the key to fulfilling these requirements in the future [5,6,7]. The millimeter band provides a wider bandwidth to offer a higher transmission speed; planar phased array antenna is the most efficient solution for compensating high free space losses, canceling interference and correcting beam-steering electronically without the need for a mechanical motor, highlighting its ease of integration in any type of surface, vehicle or IoT device [6,7,8,9].
In order to electronically steer the antenna, the key factor is the beamformer. Depending on the application, the beamformer can be analog, hybrid or fully digital. One of the solutions can be an integrated circuit (IC) which includes all elements of the beamforming circuit: an amplifier, phase shifter, switch, filter, analog to digital converter (ADC) or digital to analog converter (DAC) [6,10,11,12,13,14]. The integrated circuit (IC), depending on the technology, can be GaAs, CMOS, BiCMOS [6]. The advantage of the integrated circuit is that it carries all the elements mentioned previously, but the disadvantage is that, depending on the architecture of the integrated circuit, the errors in each response can be critical for further integration with the antenna.
To correct for array beamformer errors, antenna manufacturing errors, temperature variation, connector integration and wiring errors, an array calibration is necessary to minimize all the previously mentioned errors to obtain an accurate array response [14].
There are different antenna calibration procedures. As mentioned in [14], they can be divided into four subgroups: the near-field or far-field probing method, the peripheral-fixed probe method, the mutual coupling method and the built-in network method [13,14]. The different methods can also be divided depending on the calibration approach, which can be offline, on-site or online [14]. To make an on-site or online calibration, extra radiating elements are necessary to make these calibrations, which increases the size of the antenna. The offline calibration is the most accurate method for calibrating the antenna, but an extra facility, as well as additional measurement equipment, is required [13,14,15,16,17,18,19,20,21,22]. In [16], the comparison of three offline calibration methods is presented for a 4 × 8 rectangular array; the amplitude-only method yields the worst results in the calibration. In contrast, the rotating-element electric-field vector (REV) and the complex amplitude calibration method demonstrate considerable accuracy.
After the previous analysis, a 64-element lineal polarized phased array antenna divided into eight subcolumns is used to analyze the different calibration methods mentioned in [14,16]. The radiating elements are manufactured separately to analyze possible manufacturing errors. The chosen beamformer is an 8 channels commercial IC provided by Chengdu Xphased Technology Co., Ltd. (Chengdu, China). The passive antenna and the beamformer are connected by RF cables to test different methods of offline calibration.
The structure of this paper is divided into four sections. In Section 2, the architecture of the phased array antenna is explained; the passive antenna, the IC structure and the measurement facilities are also detailed in this section. In Section 3, the S parameter measurement of the passive antenna is presented and the unbalanced amplitude and phase error, due to manufacturing errors, is presented. Finally, the measurement of the integration of the passive antenna and beamformer for different methods of calibration is compared in this section. In Section 4, the comparison between measurement and simulation is presented. Finally, conclusions and future works are presented in Section 5.

2. Architecture of the Active Phased Array Antenna
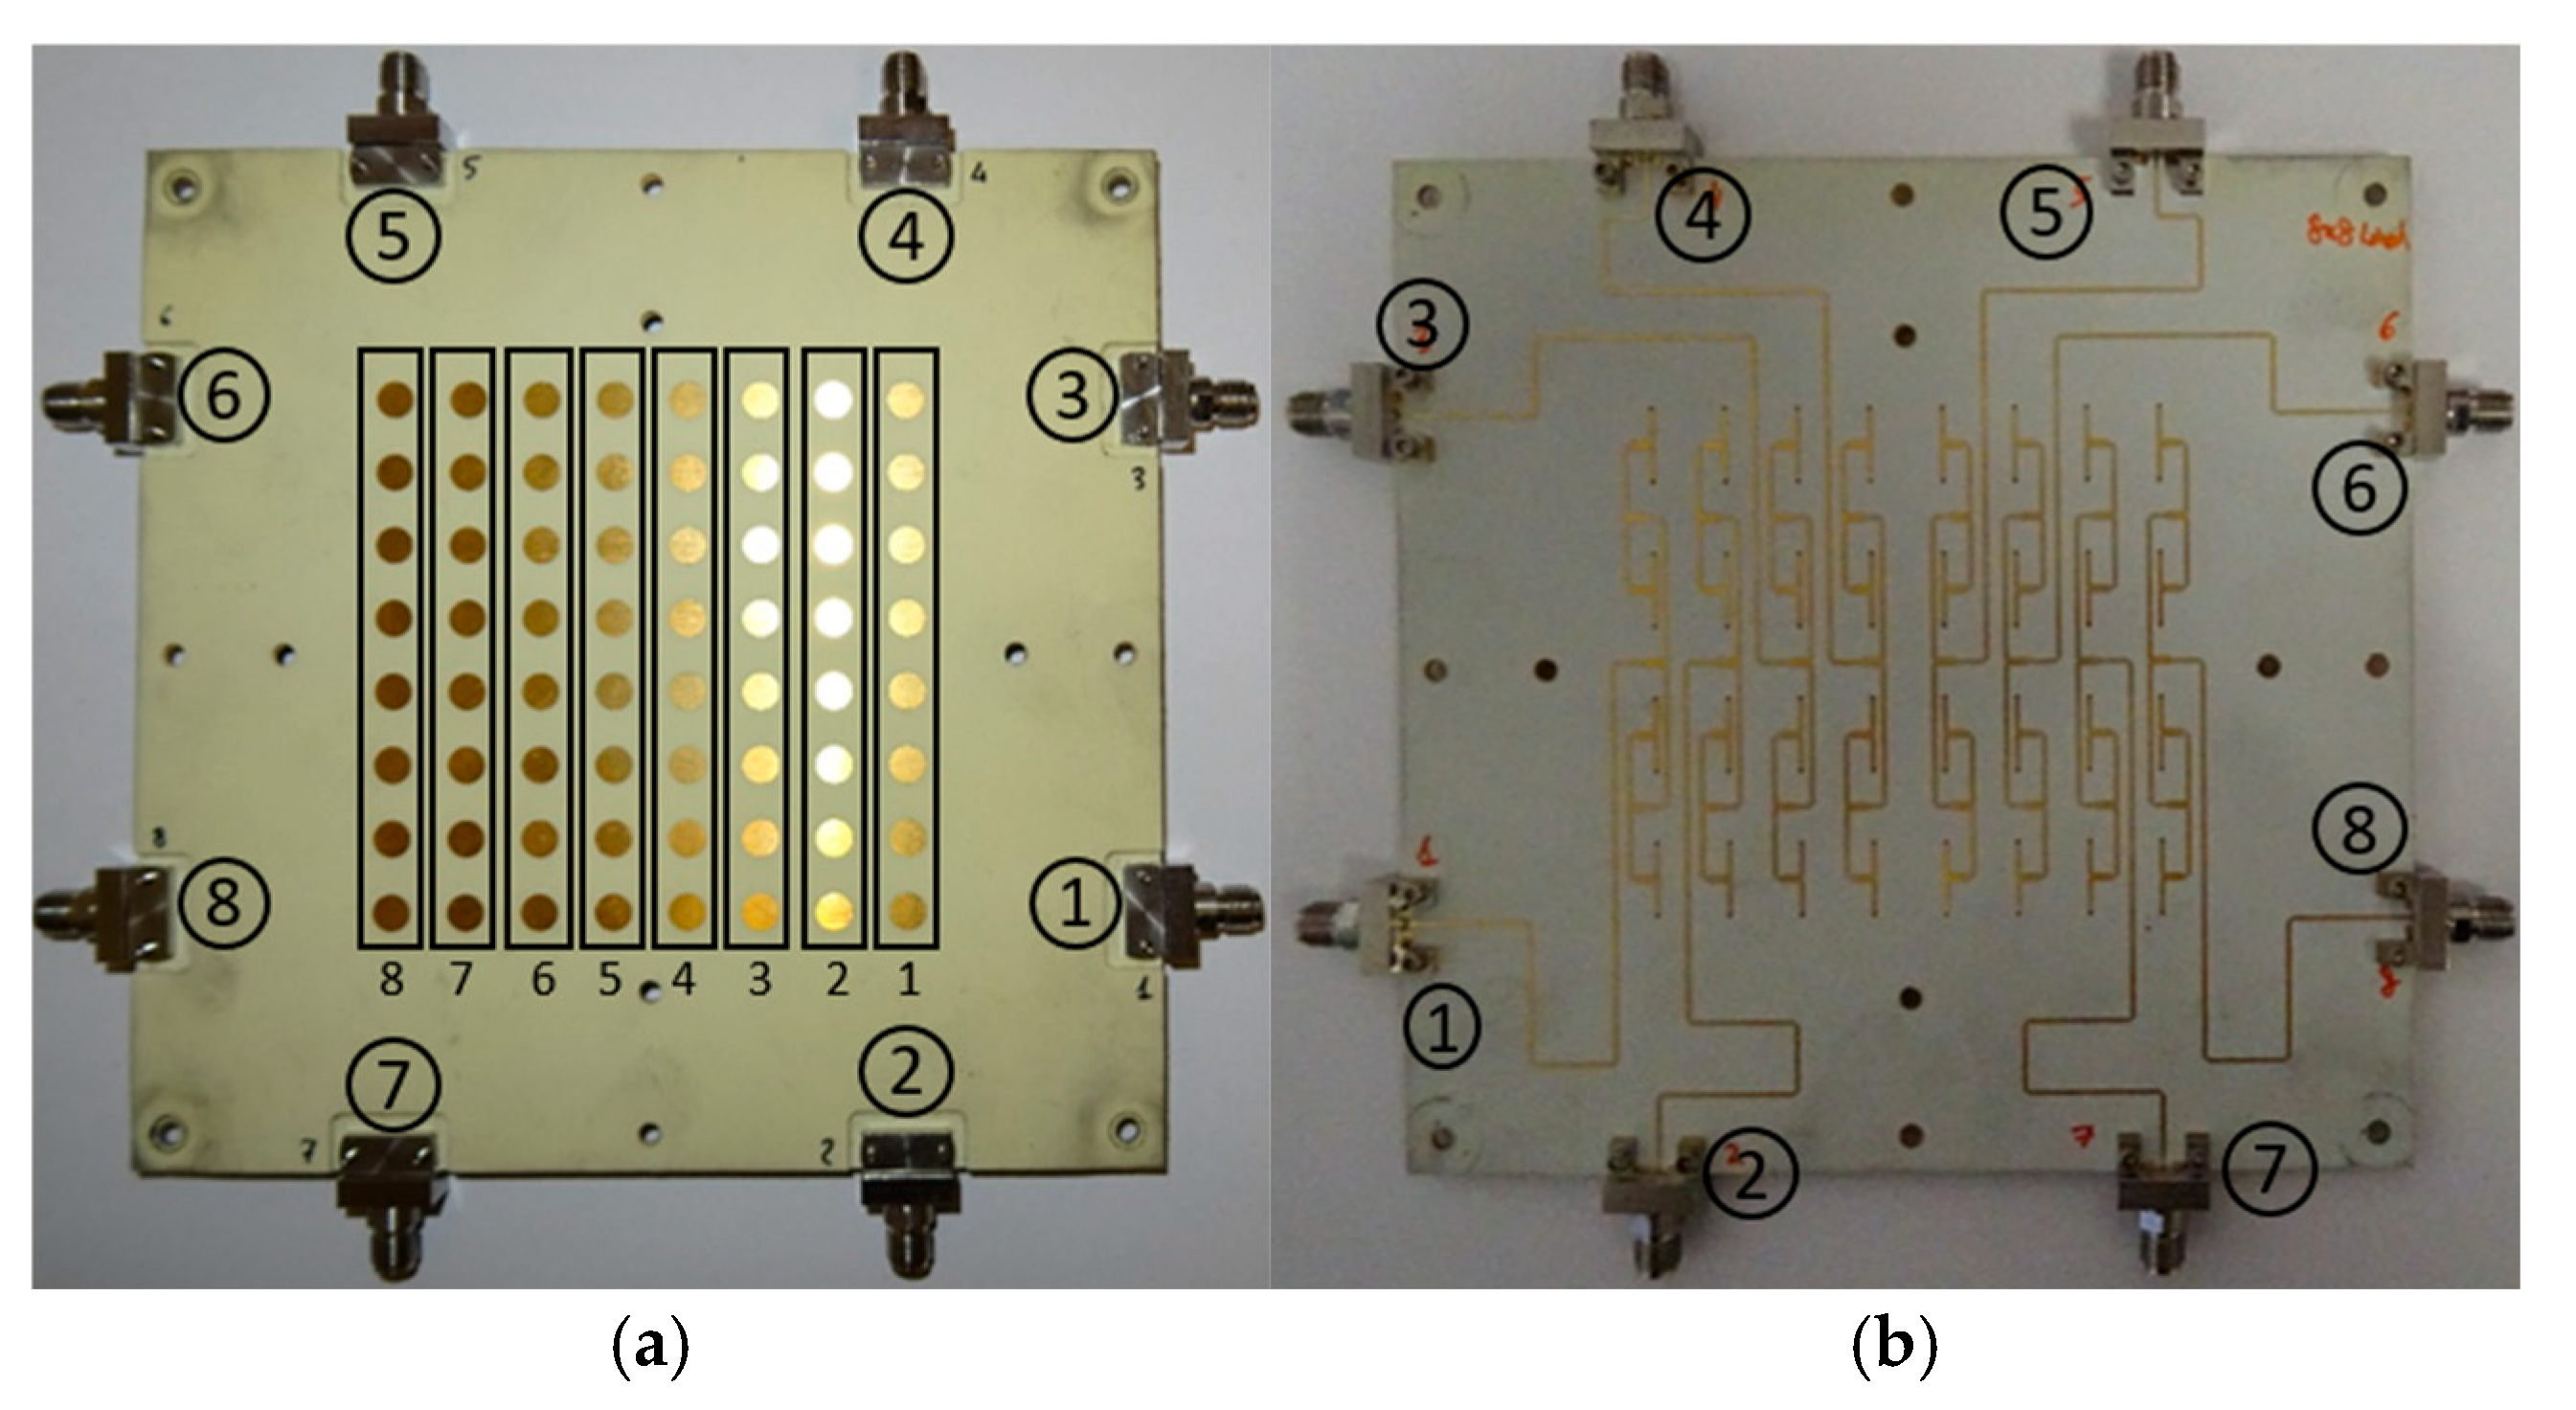
Figure 1 presents the architecture of the proposed phased array antenna. In order to evaluate each of the components individually before their total integration within the antenna, the complete system was divided into several parts: antenna, beamformer, control circuit and power supply circuit, as can be seen in Figure 1. In this figure, the antenna is connected to the beamformer board by 8 matched cables; the control and power circuit are behind the beamformer, as shown in Figure 2. Each part is explained in more detail in the following sections.

2.1. Antenna Design

The proposed antenna is an 8 by 8 subarray of double-stacked patch radiating elements working from 17.7 GHz to 20.2 GHz. The reason for using this structure is to increase the bandwidth of the antenna by stacking patches. Figure 3 presents the 8 × 8 simulation model and the stack up of the structure. The passive antenna is simulated by the commercial software CST Studio Suite 2024; the following figure presents the stack-up of the multilayer antenna and the simulation model of the passive 8 × 8 antenna with all the components, including the commercial connector Southwest End Launch (Tempe, AZ, USA). All substrates used in the design of the antenna are from the company from the company Rogers Corporation (Chandler, AZ, USA).The substrates are Rogers RO4350B, with a dissipation factor tan δ of 0.0037 @10 GHz and a relative permittivity ε r of 3.48. The 1 to 8 power divider is formed on a substrate whose thickness is 0.254 mm thick at the bottom, and metallic vias connect the feed network to the lower patch, as shown in Figure 3. The substrate on which the lower patch is printed is 0.504 mm thick. In order to prevent misalignment errors, this structure is adhered to using a 0.101 mm thin prepreg Rogers 2929, whose relative permittivity ε r is 2.94 and dissipation factor tan δ is 0.003 @10 GHz. The element spacing is 0.6 λ0 at the center frequency (18.95 GHz). The size of the top patch is 5.05 mm in diameter and the bottom patch is 4.4 mm in diameter. The feed network and the upper parasitic patch have been printed at the bottom layer of the substrate Rogers RO4350B, and a foam of 1 mm of height with a permittivity of 1.07 is slipped in between layers to control the separation between active and parasitic patches.
Figure 4 shows the prototype of the array; the front of the antenna is shown in Figure 4a, while Figure 4b illustrates the reverse side of the antenna. As can be seen on the rear side of the antenna, the feed lines from the edge to the antennas are optimized in order to avoid phase difference between the different columns of the antenna subarray. As shown in Figure 4 The connector model used is the Southwest End Launch model (Tempe, AZ, USA). As the connectors are considerably large with respect to the antenna patches, the size of the ground plane has been increased to ensure that the connectors do not influence the radiation pattern of the array. The increased simulation model of passive antenna size is 142 mm × 142 mm, as shown in Figure 3. The columns have been enumerated as illustrated in Figure 4.

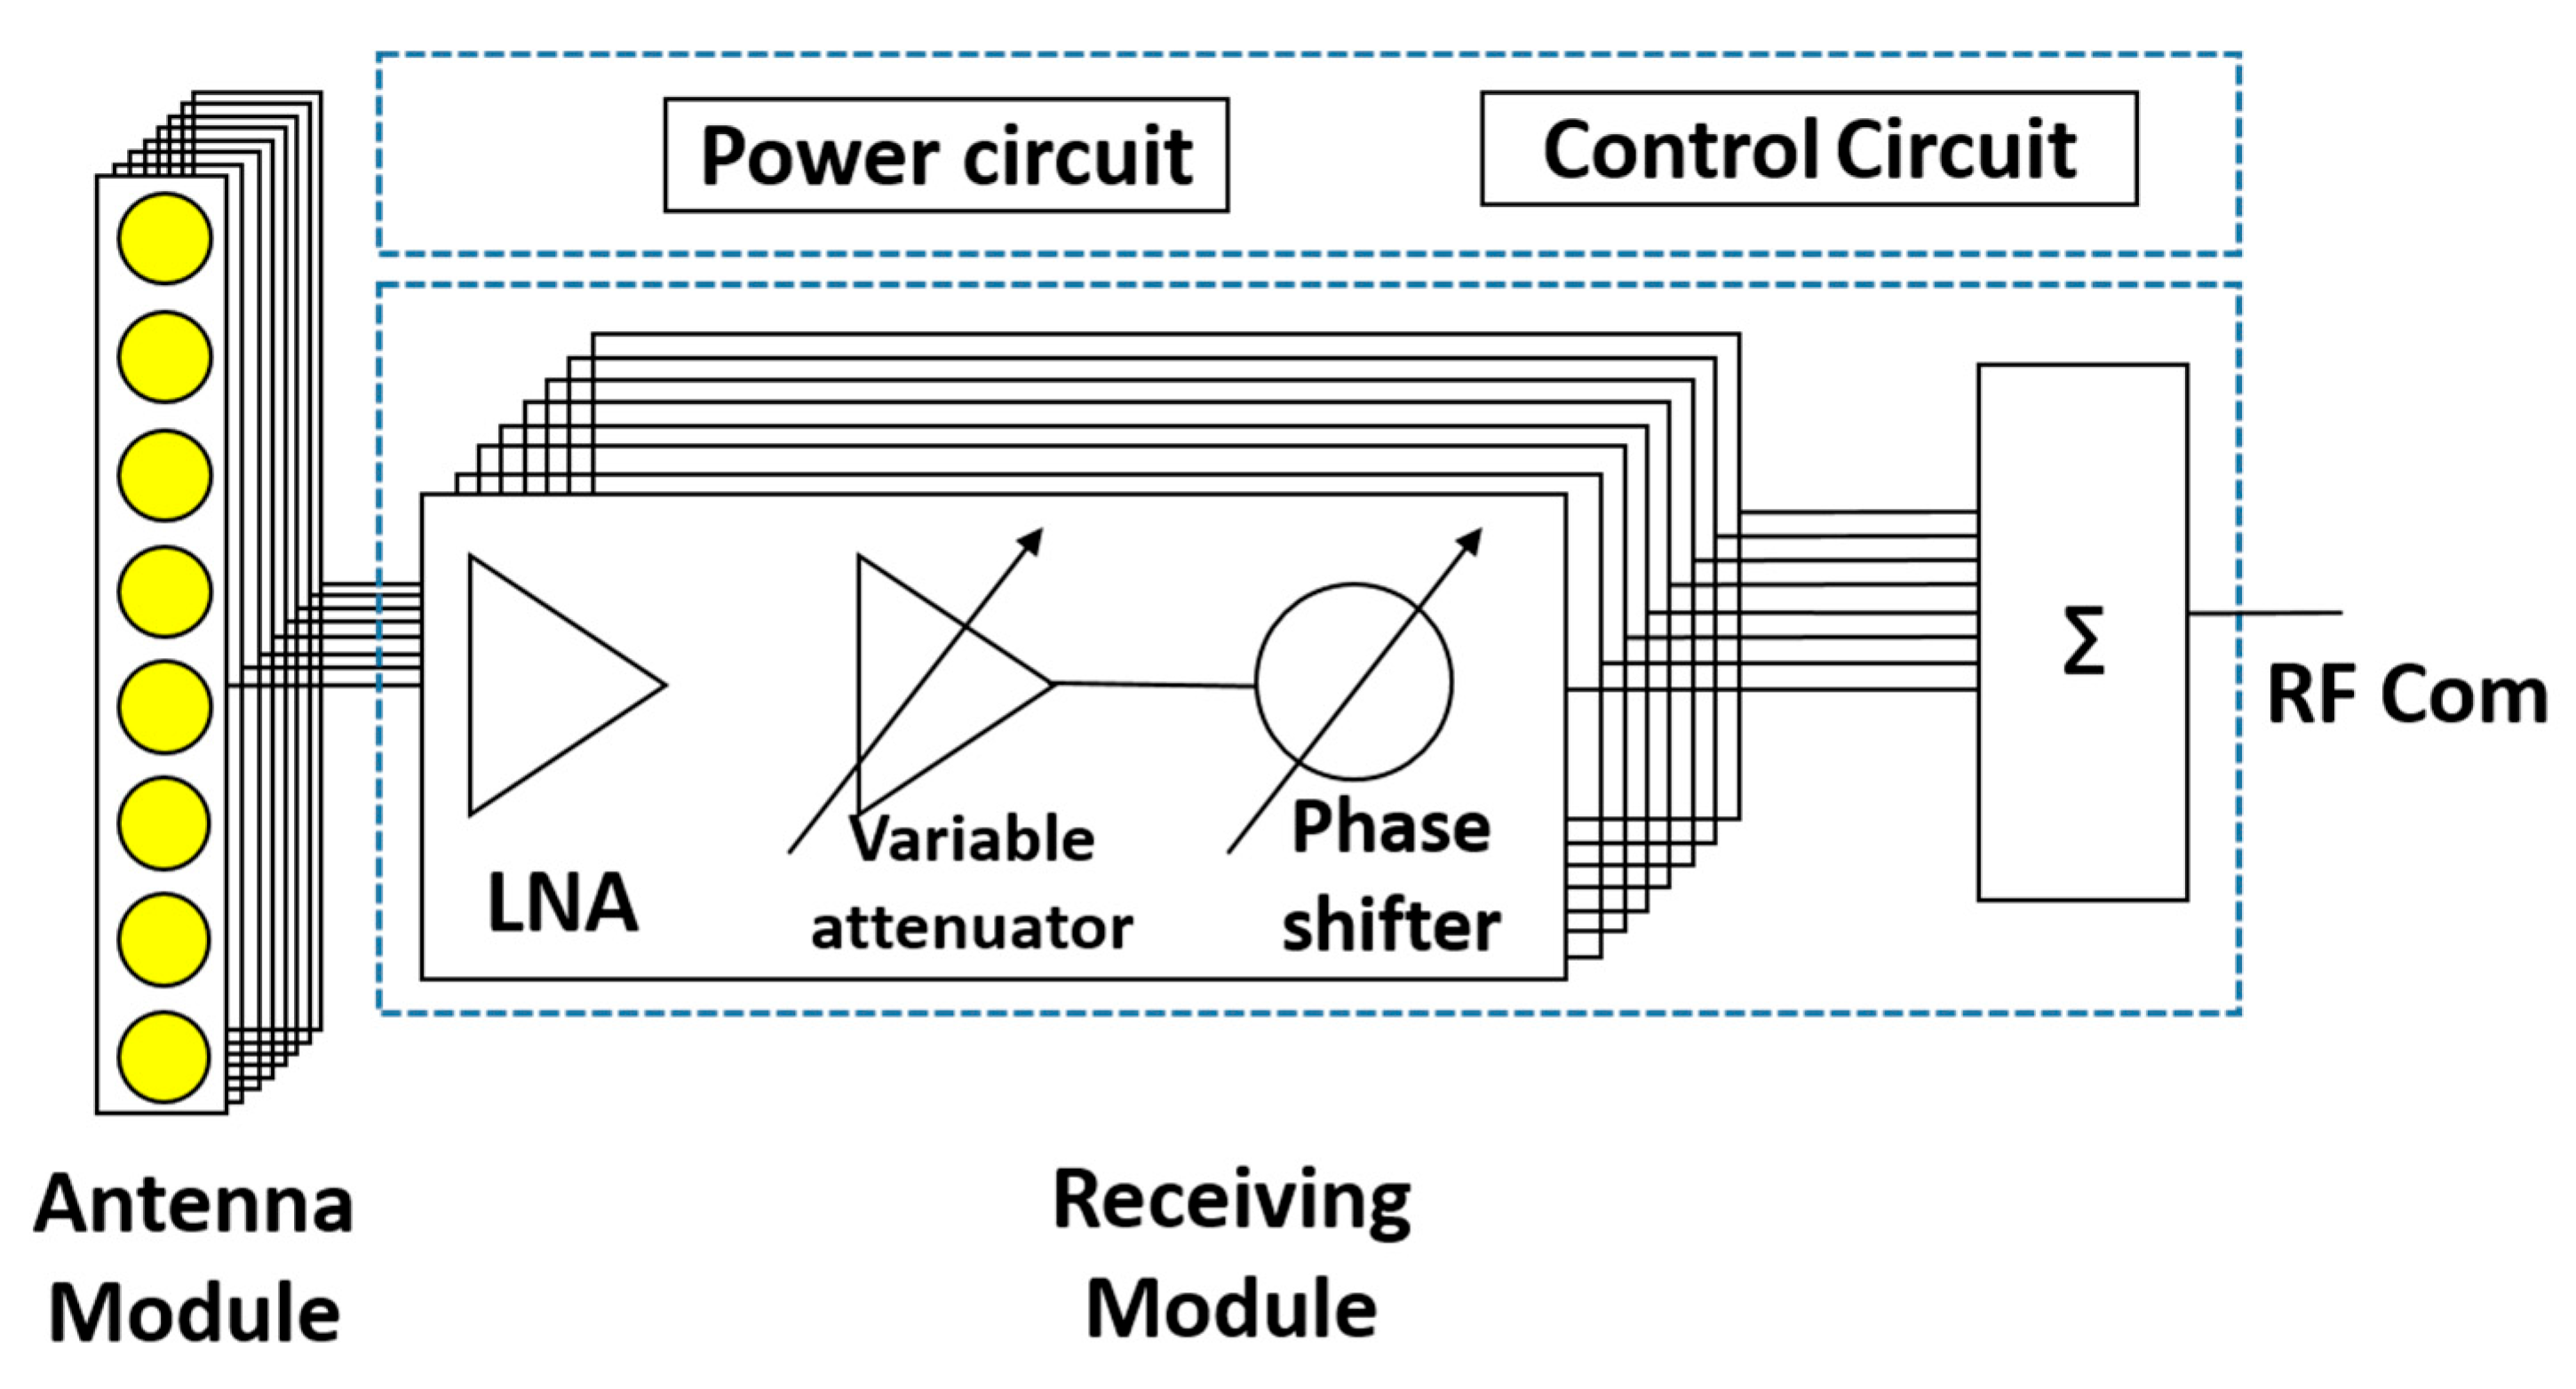
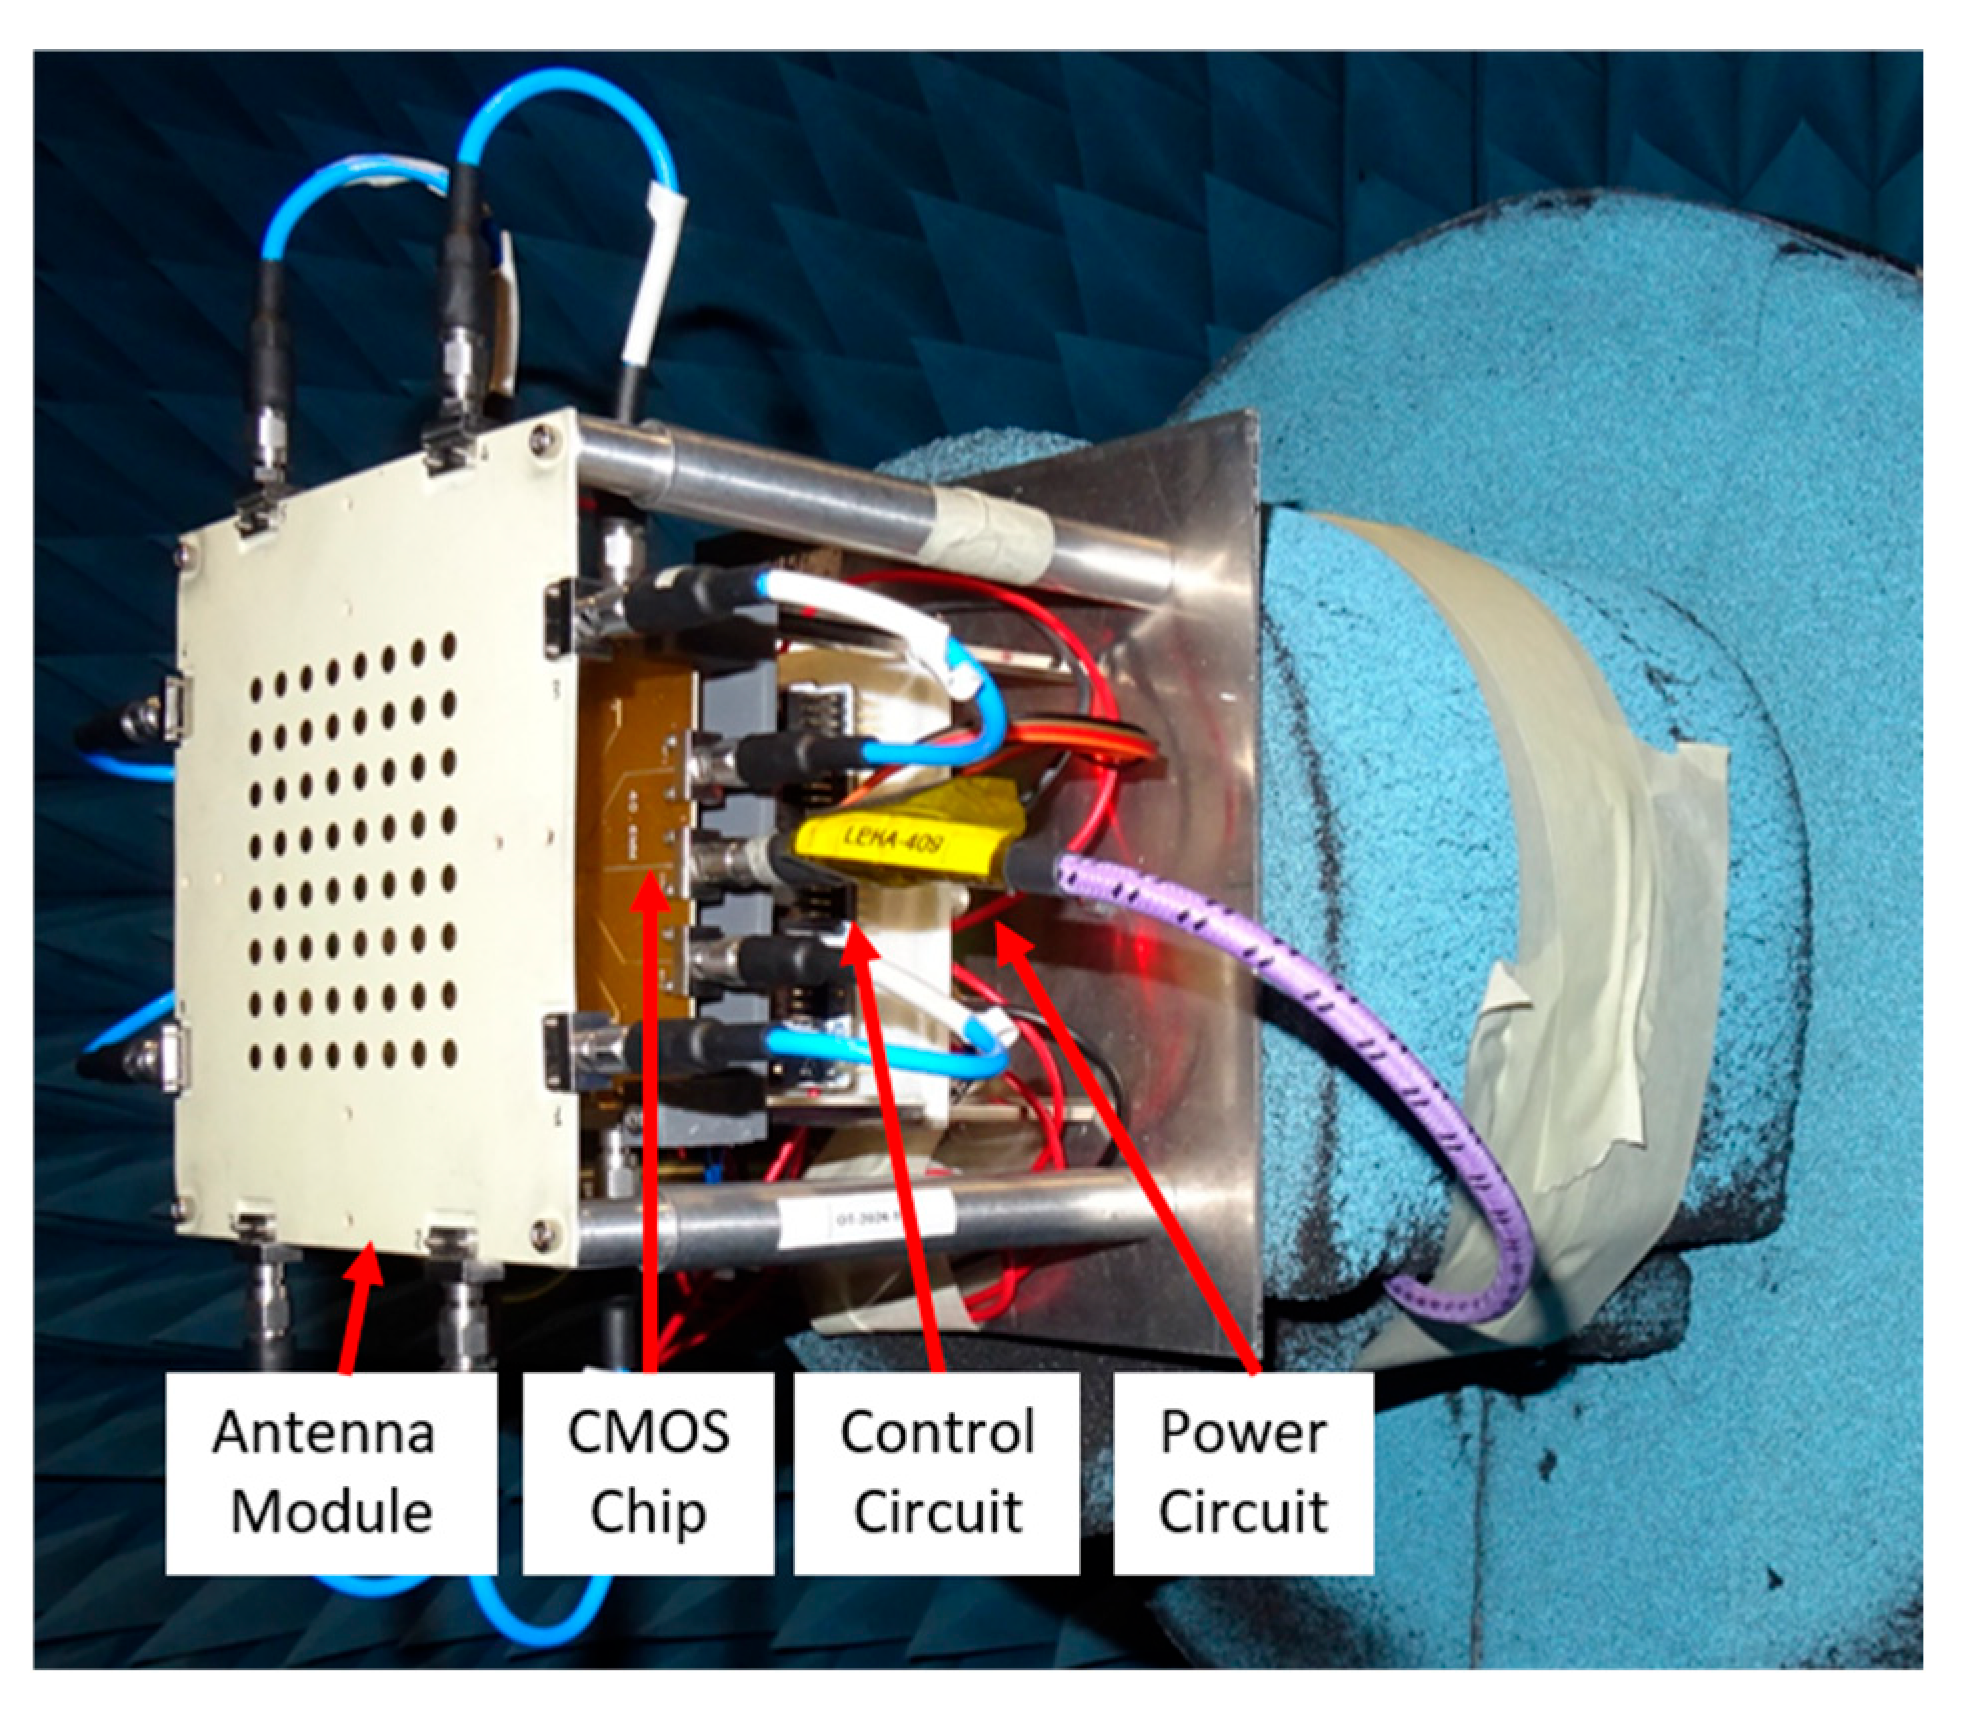
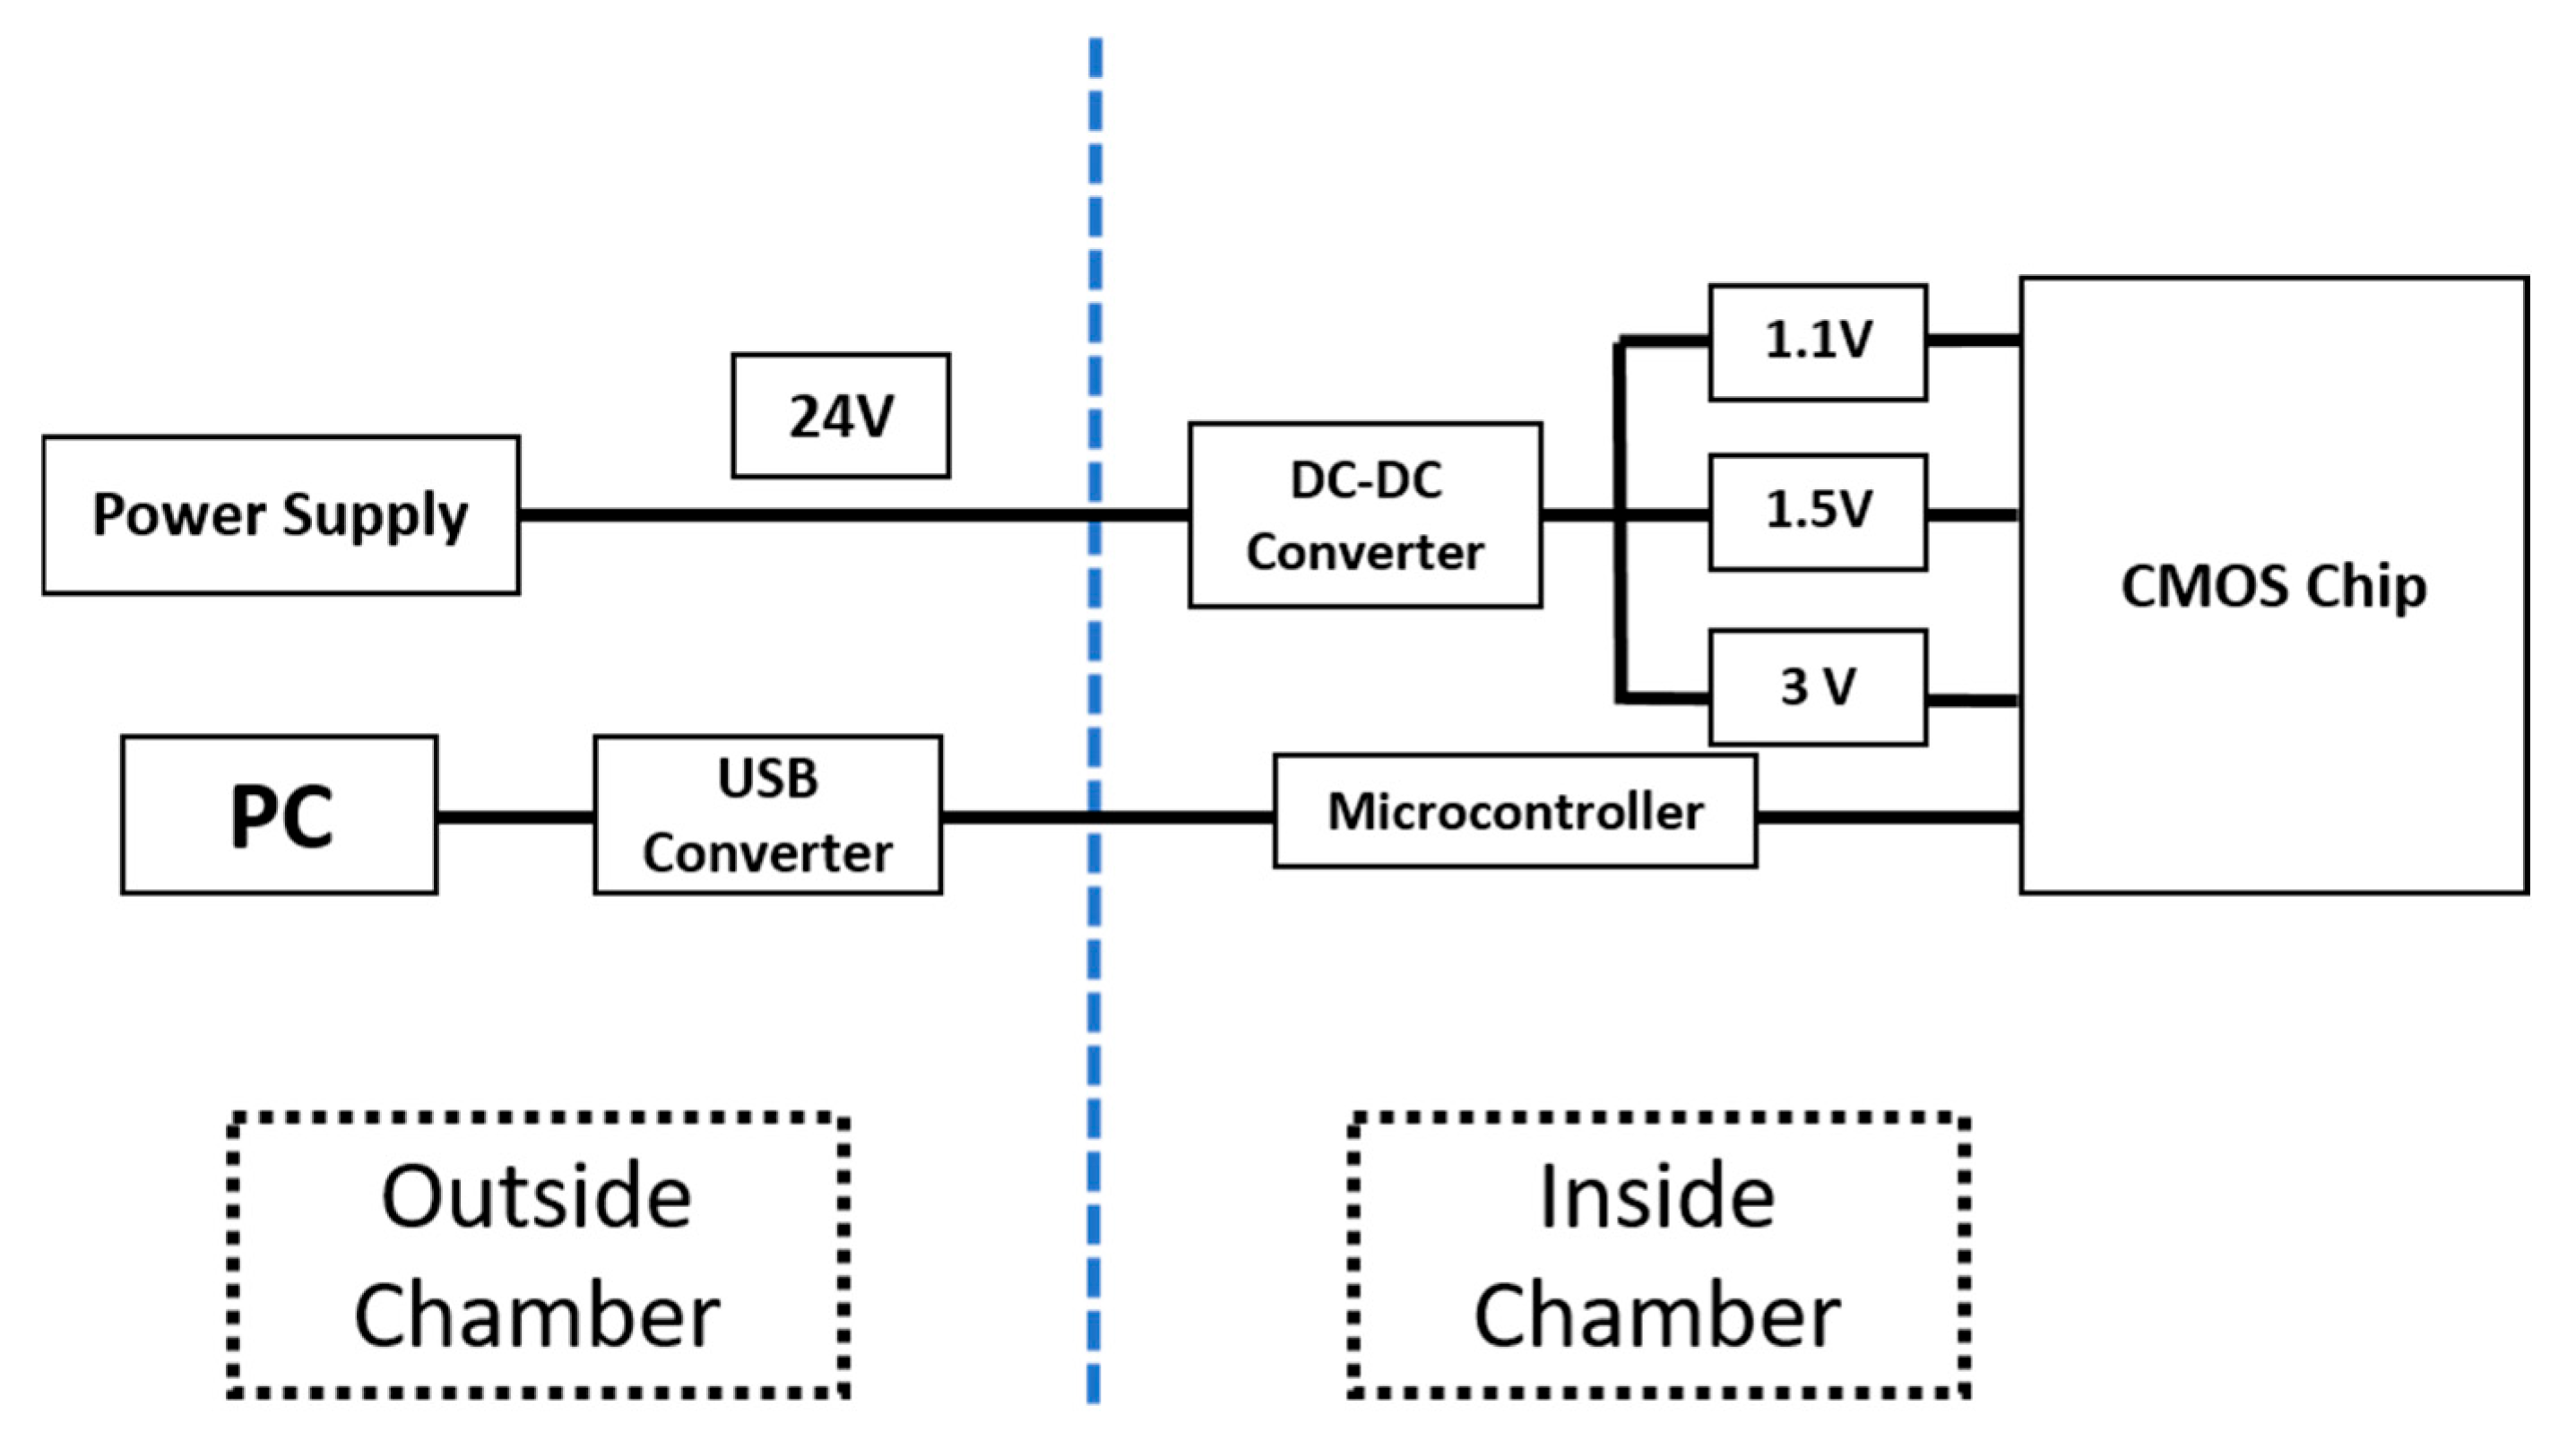
2.2. Antenna Power and Control Systems

Figure 5 presents the schematic circuit of the beamformer and power control. The CMOS Beamformer is controlled by a microcontroller STM32f072 from the company STMicroelectronics NV (Geneva, Switzerland), which is behind the Beamformer, as shown in Figure 2. To communicate with the control board from outside the anechoic chamber to the inside, a USB to RS232 converter from the company Waveshare Electronics (Shenzhen, China) is used to send the SPI commands from a computer to the beamformer. The commercial beamformer is provided by Chengdu Xphased Technology Co., Ltd. (Chengdu, China). The Beamformer TRHJ-4011-F has eight channels with 6-bit control in both amplitude and phase, as shown in Figure 1. The step of amplitude is 0.5 dB and 5.625° in the phase. Since the current consumption of the beamformer is high, it cannot be directly powered from outside of the chamber, as the inductance of the cables creates stability problems with the beamformer. This voltage regulator from the company ASHATHA Shenzhen, China) guarantees a stable current distribution to the beamformer IC as it protects the beamformer from any transitory induced by the long connecting power cables. The blue dashed line in Figure 5 separate the transmitting part of the control signal outside of the chamber and the receiving part of the control signal inside.

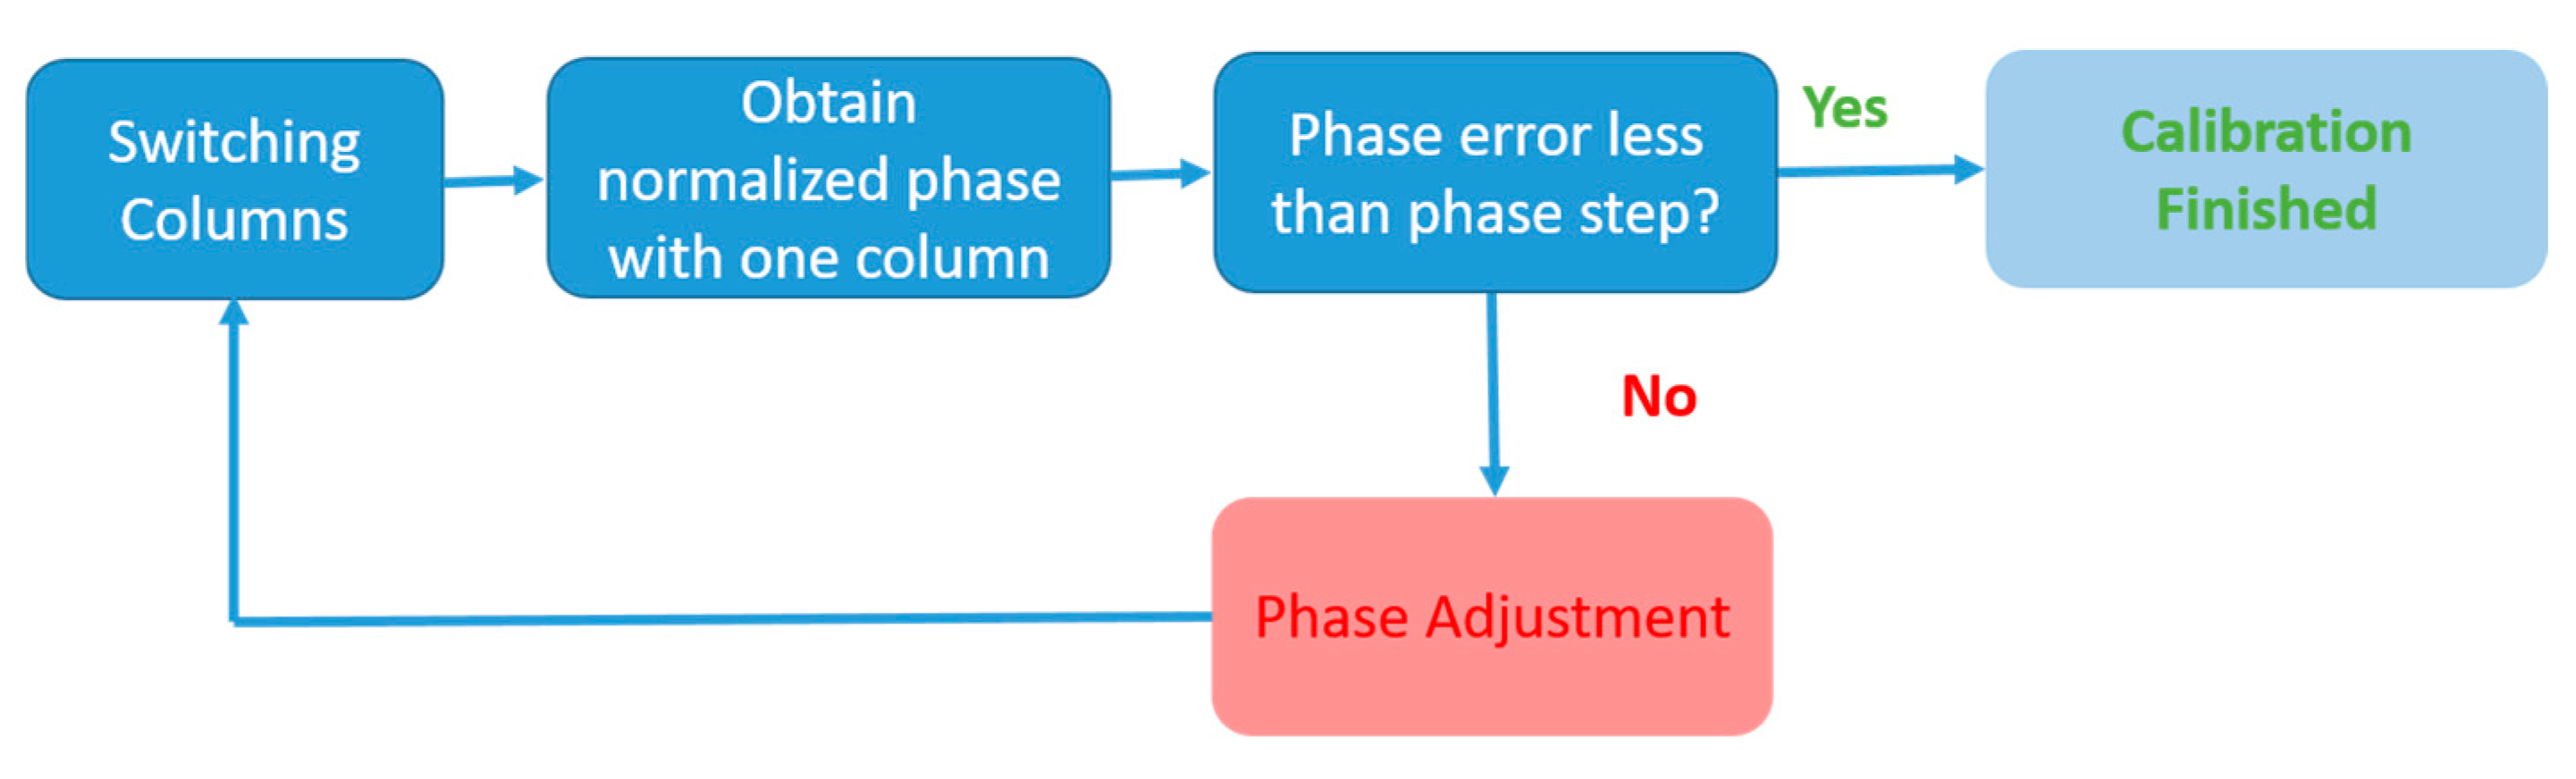
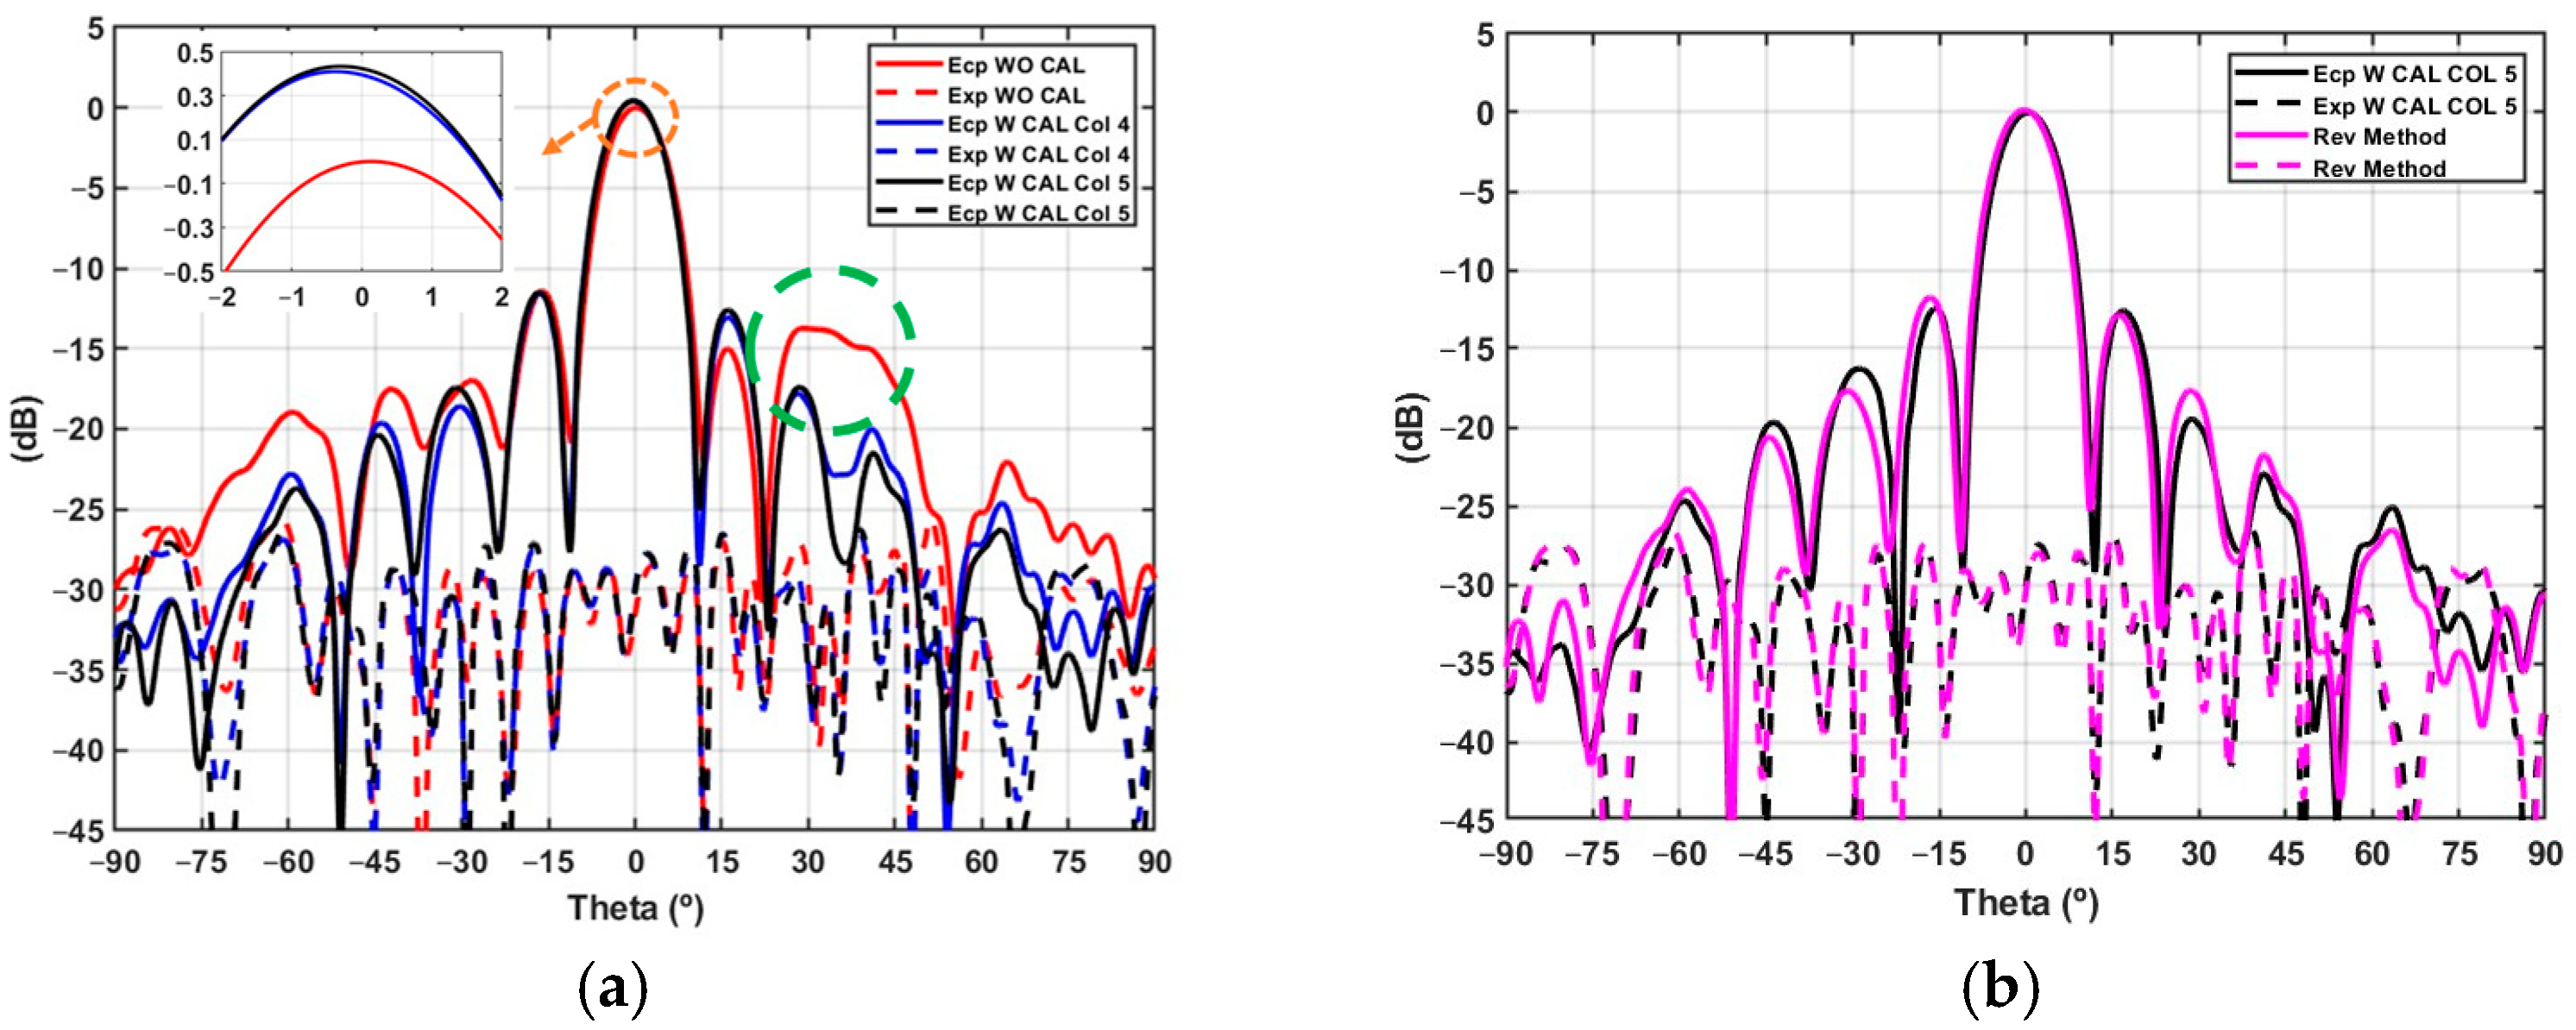
3. Active Phased Array Calibration

The comparison of the S parameters between simulation and measurement is presented in this section. The passive unbalanced amplitude and phase of the passive antenna is presented. Finally, the performance of different methods of calibration is presented with the whole phased array, along with the comparison between simulation and measurement.

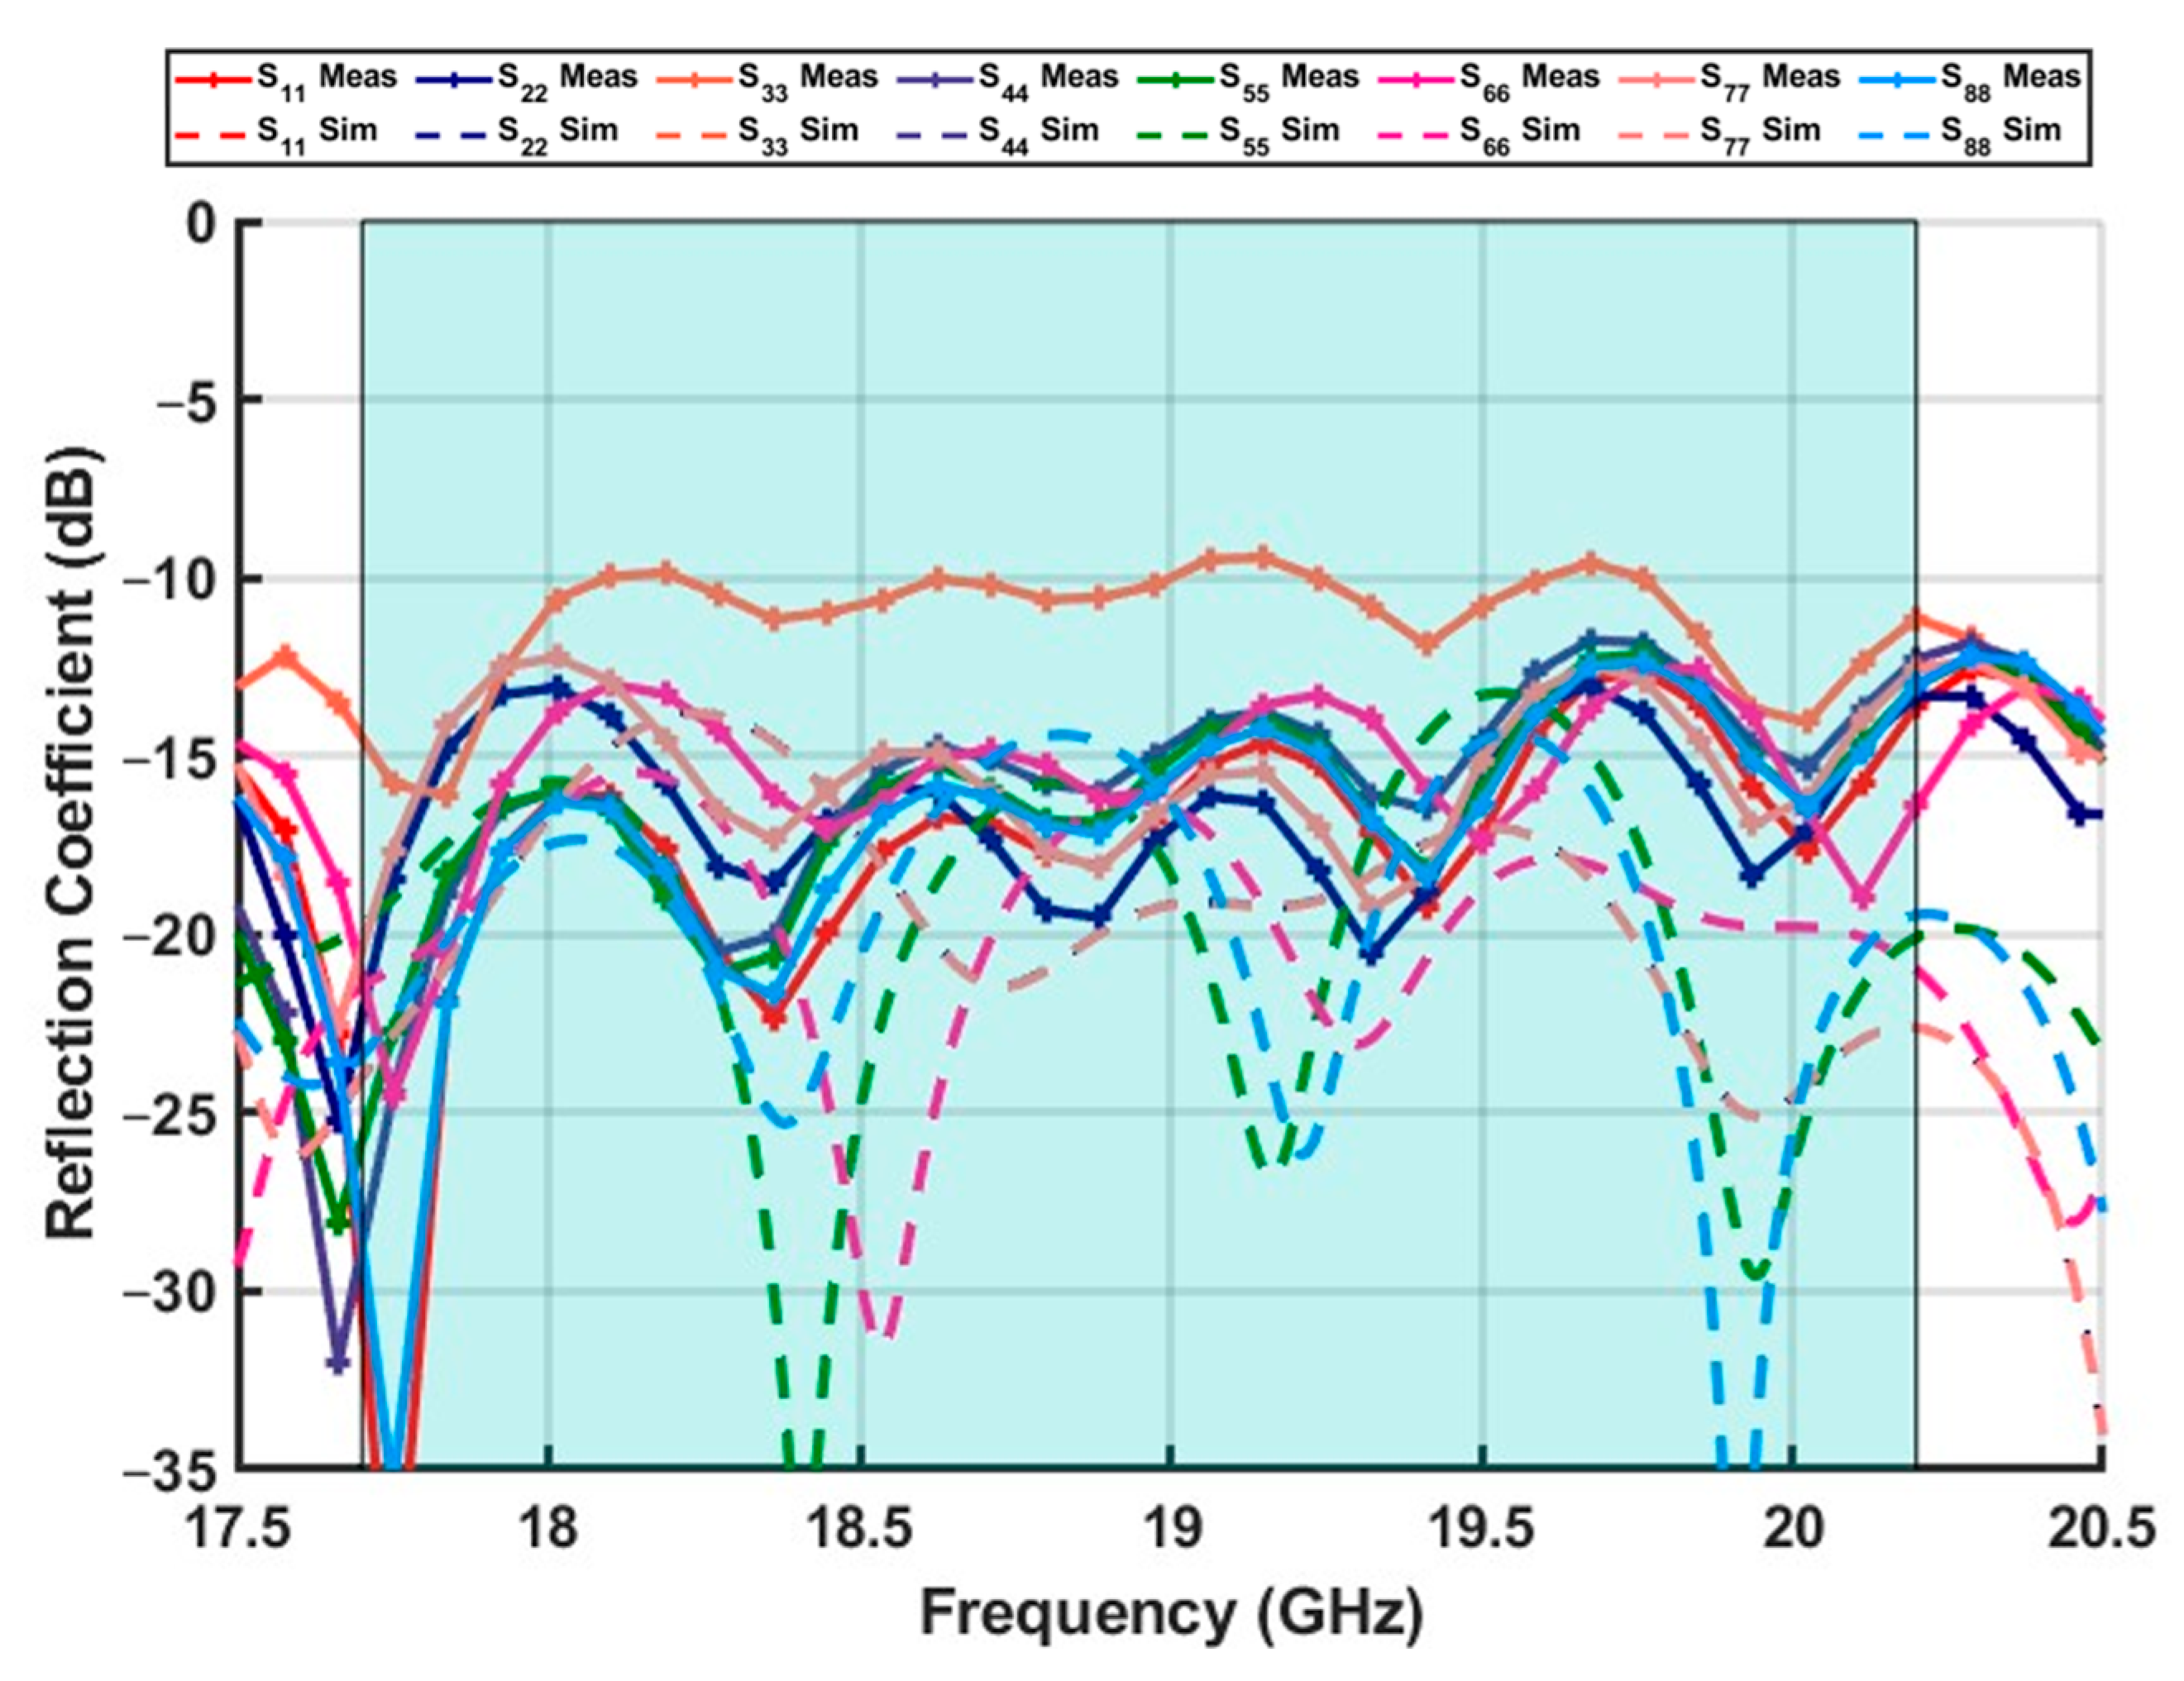
3.1. Passive Antenna Measurement

The comparison between simulated and measured reflection coefficients of each column are presented in Figure 6. The simulated reflection coefficients are below −14 dB for all the columns; however, column 3 of the prototype is not as well manufactured as the rest of the columns, resulting in a worse reflection coefficient. But, in our working band, it is below −10 dB. The difference between simulation results and measurement results may be due to the following reasons:
A.
Since the connector has a certain bend, it may be that the End Launch connector is not directly in the center of the feeding microstrip line of the columns.
B.
In the process of adhesive bonding of the PCBs, the alignment is not very precise and, when pressing the PCBs, the heights of the prepreg and foam were affected, differing from the height of the simulation.
To evaluate the unbalanced amplitude and phase between columns, the parameter S21 for each column is measured in the UPM Spherical Near Field System using a standard gain horn (SGH) as transmitter. Column 5 is selected as reference and the rest of the columns are normalized with respect to the reference. In Figure 7, the normalized unbalanced amplitude of the passive subarray is ±1.5 dB in band. Regarding the phase difference between columns is ±30°. These discrepancies are caused by the manufacturing process. Since the prepreg bonding of the PCB may not adhered precisely, this could be one of the explanations for the encountered discrepancies (a line with an extra of 1 mm results in an extra of 11.37° in the transmission phase). Therefore, in the process of integrating the beamformer and the passive antenna, we have to compensate for the errors in the manufacturing of the passive antenna.

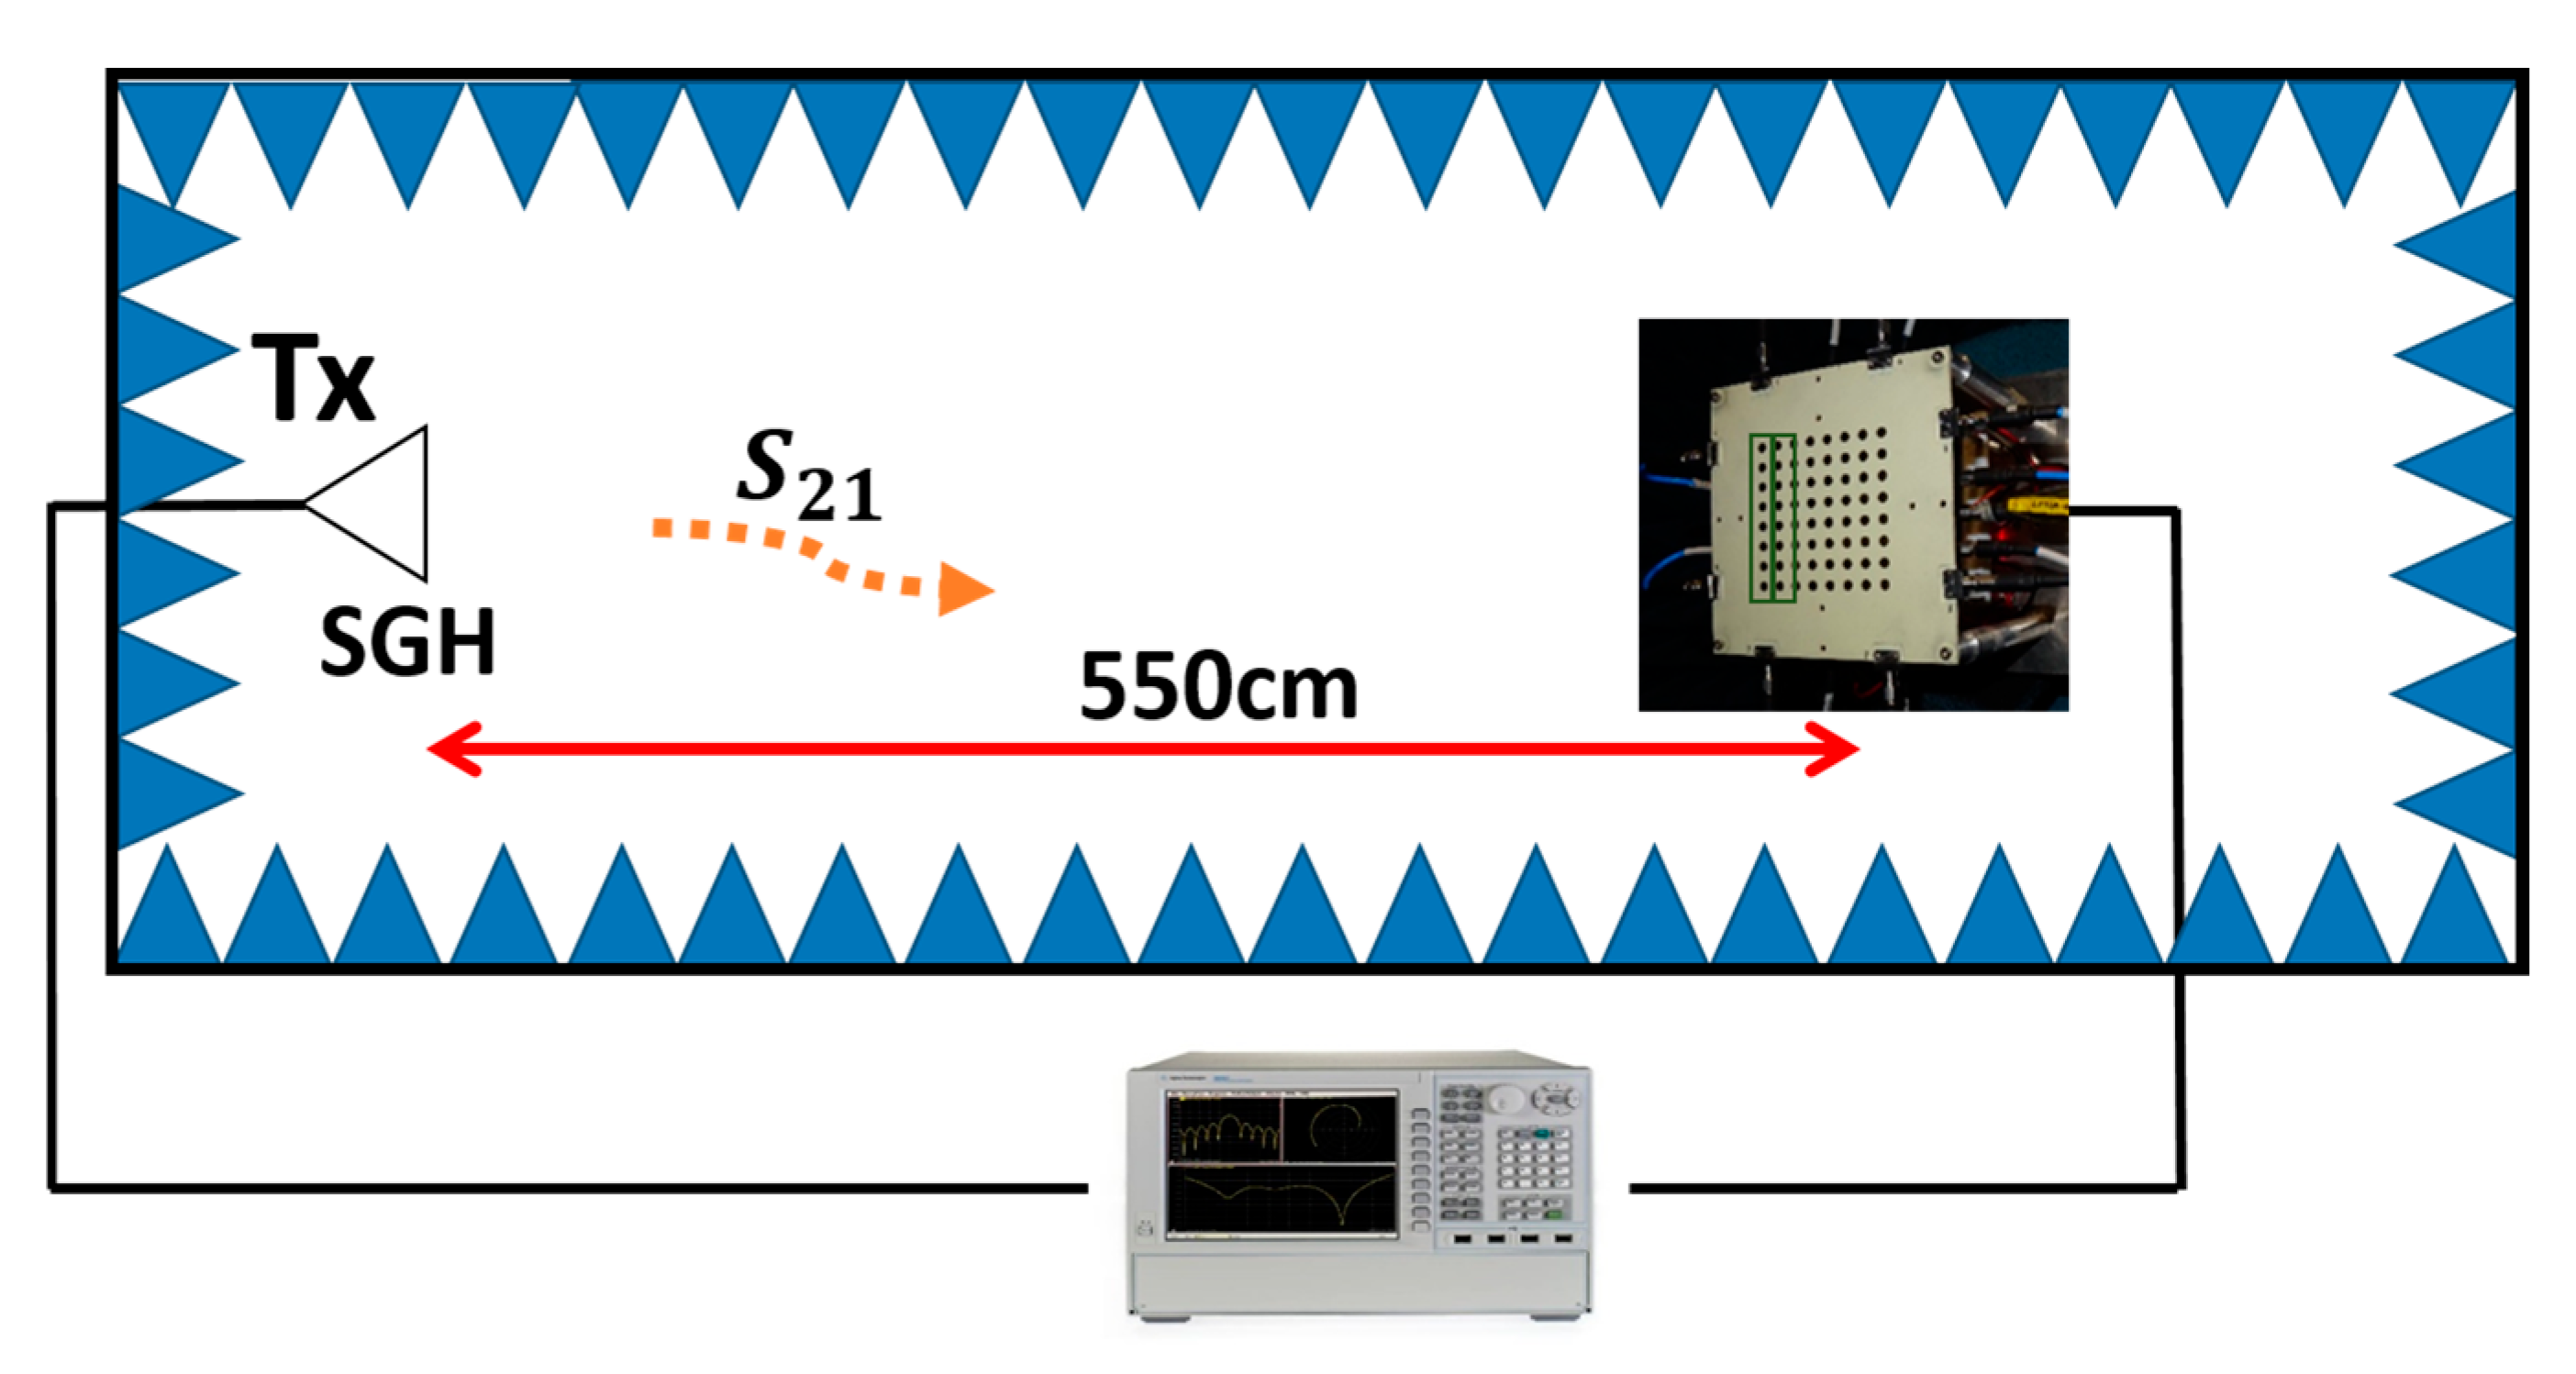
3.2. Active Antenna Measurement

As mentioned in the previous section, the prototype antenna manufactured does not exhibit the same behavior for each of the columns. The calibration of the phased array antenna is performed using the methods explained in [16]. In [16], three different calibration methods are proposed and analyzed: the REV method, Fast Amplitude-Only Method and Complex Amplitude Calibration Method. The REV method [18,23] is a phased array element excitation extraction method that is able to retrieve the excitation coefficient of each phased array element in its operation state. Therefore, this method takes into account the degradation induced by the phased array element’s mutual coupling. However, in some antenna structures, the significance of this interaction can be disregarded in favor of more simple phased array excitation extraction techniques.
The REV technique can retrieve each element individual excitation by sweeping that element phase shifter. Since the programmed phase shift for a given amplitude measurement is known a priori, through the mathematical procedure describe in [18] the initial element excitation is calculated [18,23]. The proposed phased calibration need 2 × N measurements. The measured set up is shown in Figure 8: a standard gain horn antenna (SGH) is used as a probe in the far-field conditions (550 cm) to obtain the S21 parameter for each of the columns, deactivating the rest of the columns using the beamformer control. During the calibration process, the temperature of the facility is controlled (22 °C) and there is no temperature dependence for the calibration. In the proposed method, the phase is considered to be a calibration variable, so that the amplitude variation, when changing phase state (PM-AM performance), is not affected in the calibration process, thereby reducing the number of calibration measurements and iterations.
The proposed calibration flow diagram is shown in Figure 9. The process is detailed as follows:
  • The amplitude and phase control of the column under test are programmed to behave with maximum gain state and zero-state for the phase.
  • The rest of the channels are disabled with the amplitude control set to maximum attenuation state (30 dB).
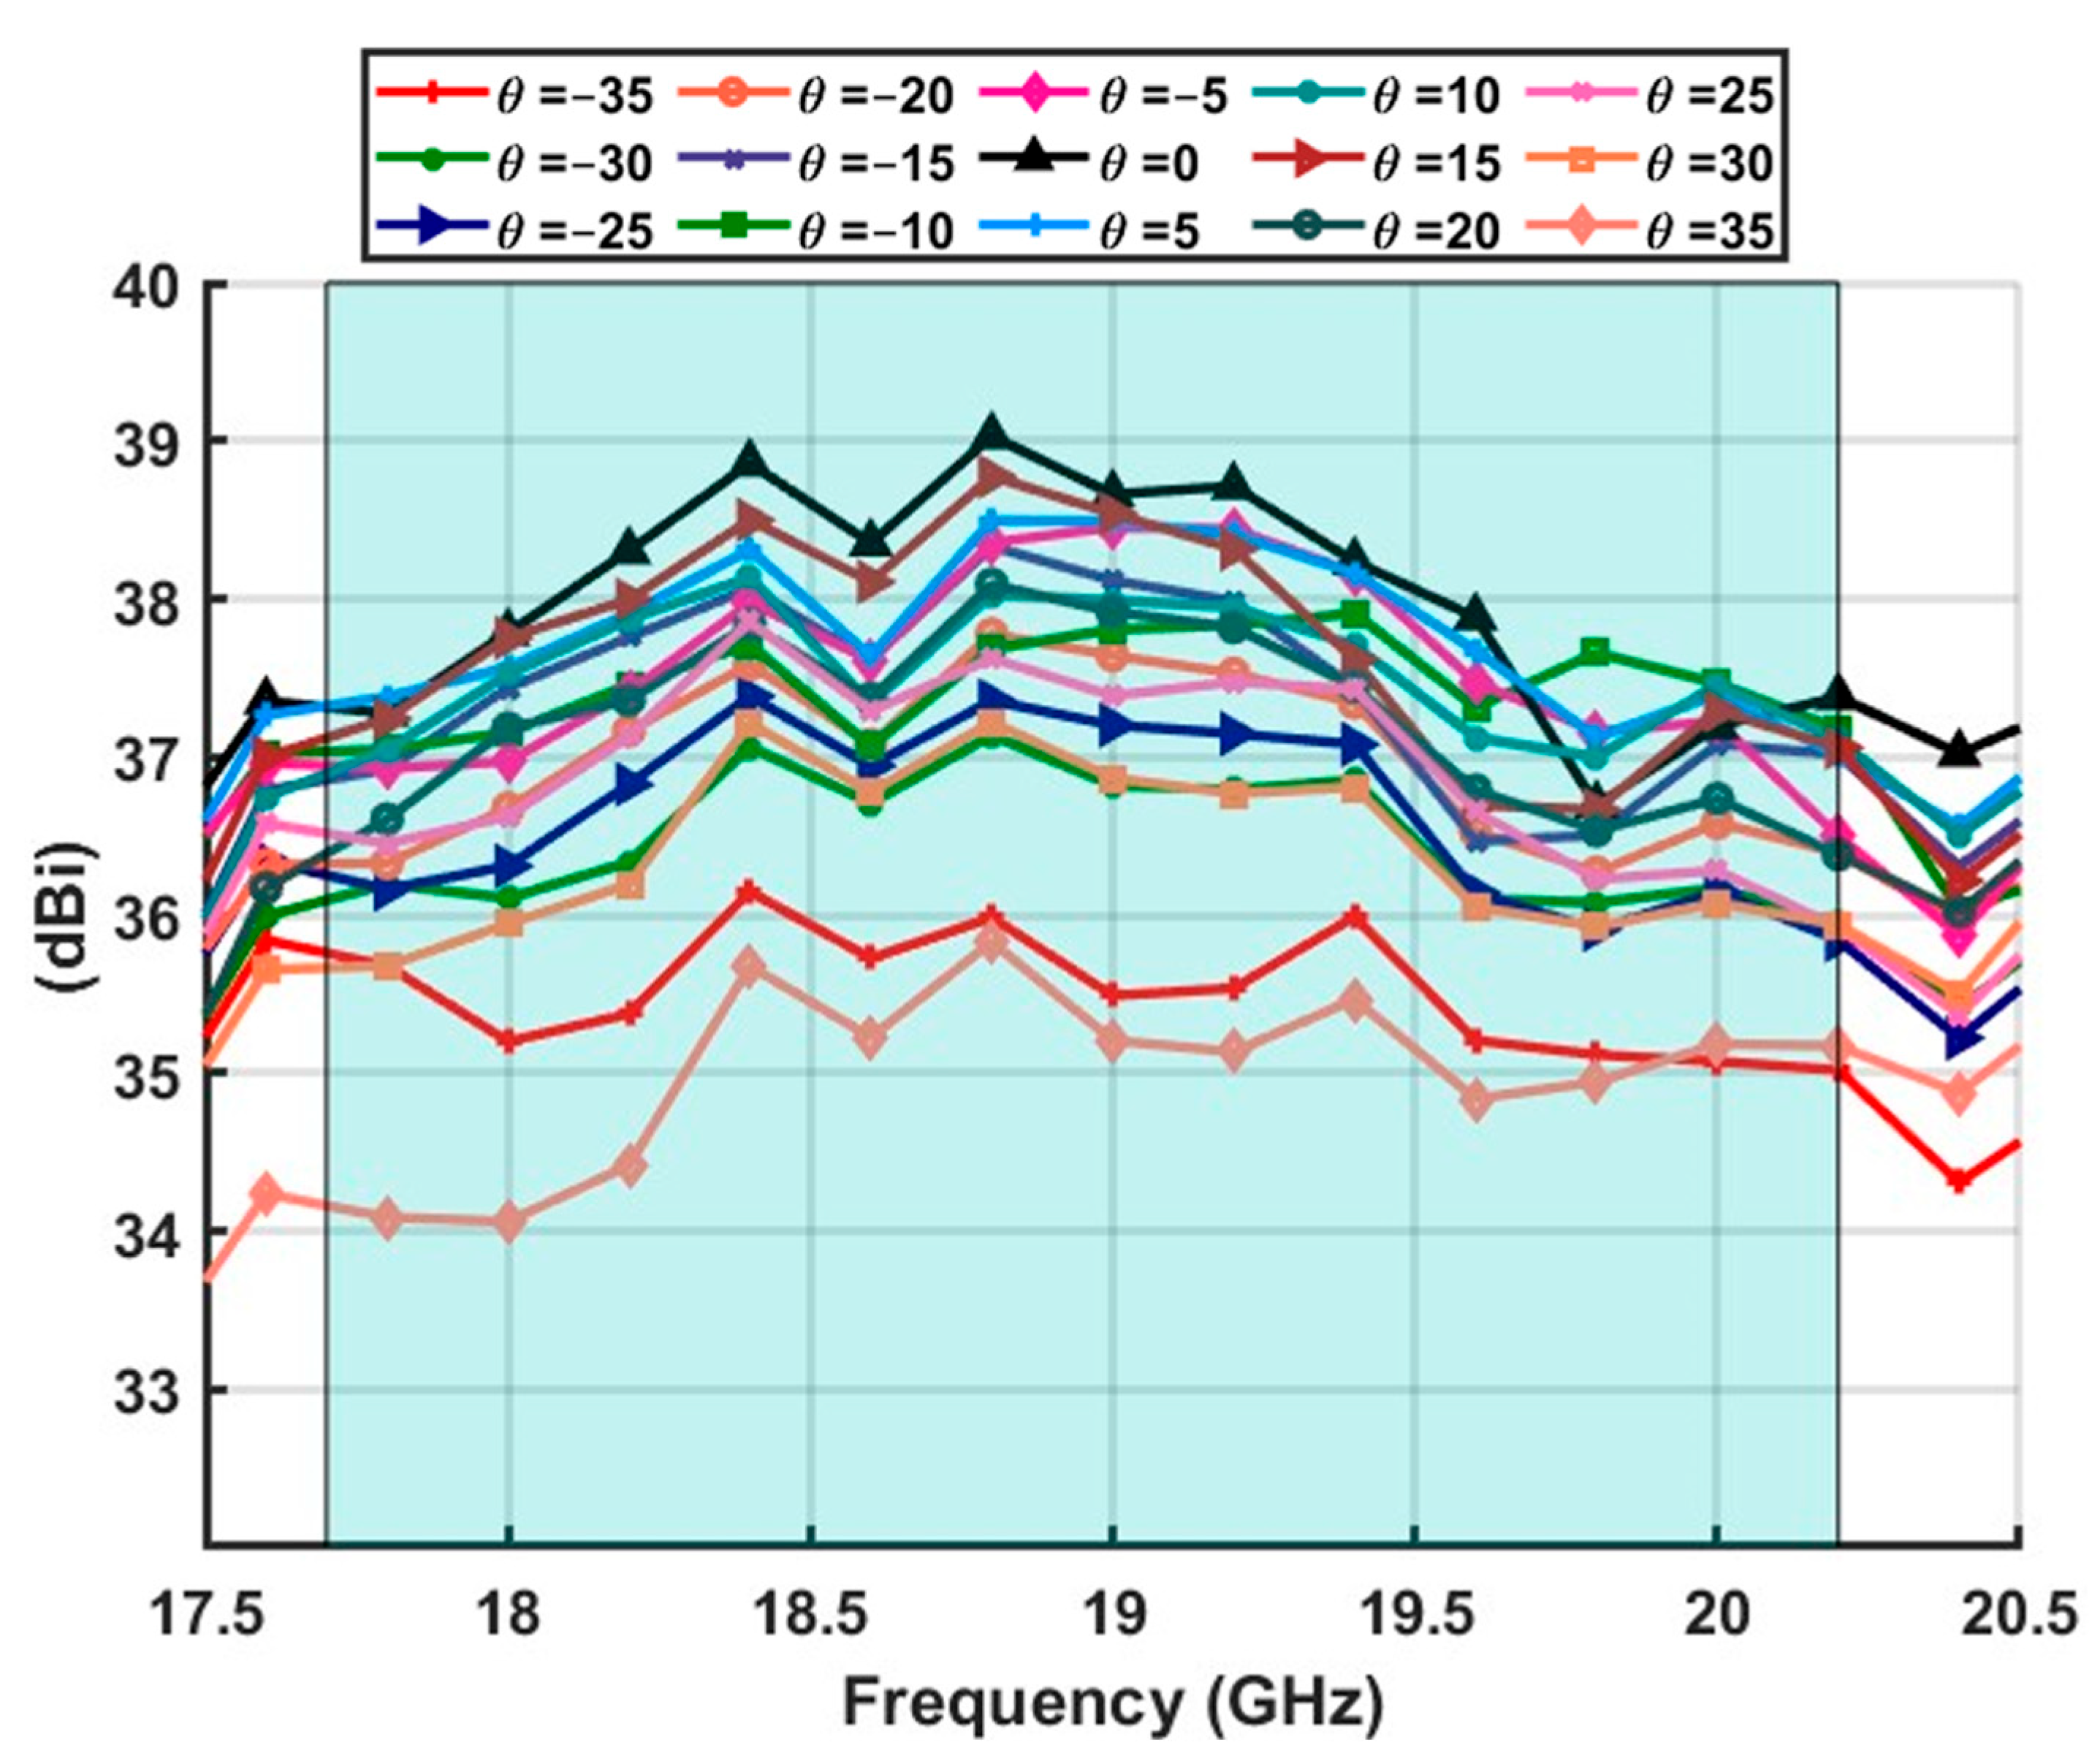
  • The S21 parameter between the SGH and the column under test is measured. For each measurement, a frequency sweep for 17.7 GHz to 20.2 GHz is measured for each column.
In the first iteration after N measurements, select an arbitrary column and normalize the phases with respect to the chosen column and obtain the phase difference between columns. In the second iteration, using the phase differences obtained in the iteration one, compensate the phase difference by changing the phase shifter state of the beamformer for each column to reach the same phase.
The obtained initial phase stage result is shown in Figure 10a. Again, the phase unbalance is normalized to column 5, and it can be observed that the unbalanced phase differs from the passive antenna, indicating that the beamformer and the cables also introduce additional phase errors. In order for the columns to exist in the same phase state, the center frequency 18.95 GHz is used as the calibration frequency. By varying the states of the beamformer phase shifters, the S21 phase states depicted in Figure 10b can be obtained. It can be seen that the phase error has been significantly reduced; while it cannot be zero, the phase error is smaller than the phase step of the beamformer.
The calibration frequency and the selected reference column are arbitrary; any frequency and any column can be selected as reference, as we can see in Figure 11a. The comparison of the horizontal cut of the phased array radiation pattern at the center frequency of 18.95 GHz with and without calibration is shown in Figure 11a for two different reference columns. As can be observed, the radiation pattern without any calibration stage shows a diffraction lobe in the green circle, which causes a loss in the maximum directivity of the array. By selecting an arbitrary column for calibration, Figure 11a presents two calibrations that use different columns as references. A 0.5 dB improvement in the maximum value of the radiation pattern can be observed, with increased power in the main lobe and an improvement in the secondary lobes (including the diffraction lobe present in Figure 11a, with deeper nulls in both cases). Figure 11b presents the comparison of the radiation pattern using the phase calibration and REV method. The obtained results are similar, and the improvement using the REV method is insignificant, with respect to the phase calibration method proposed.

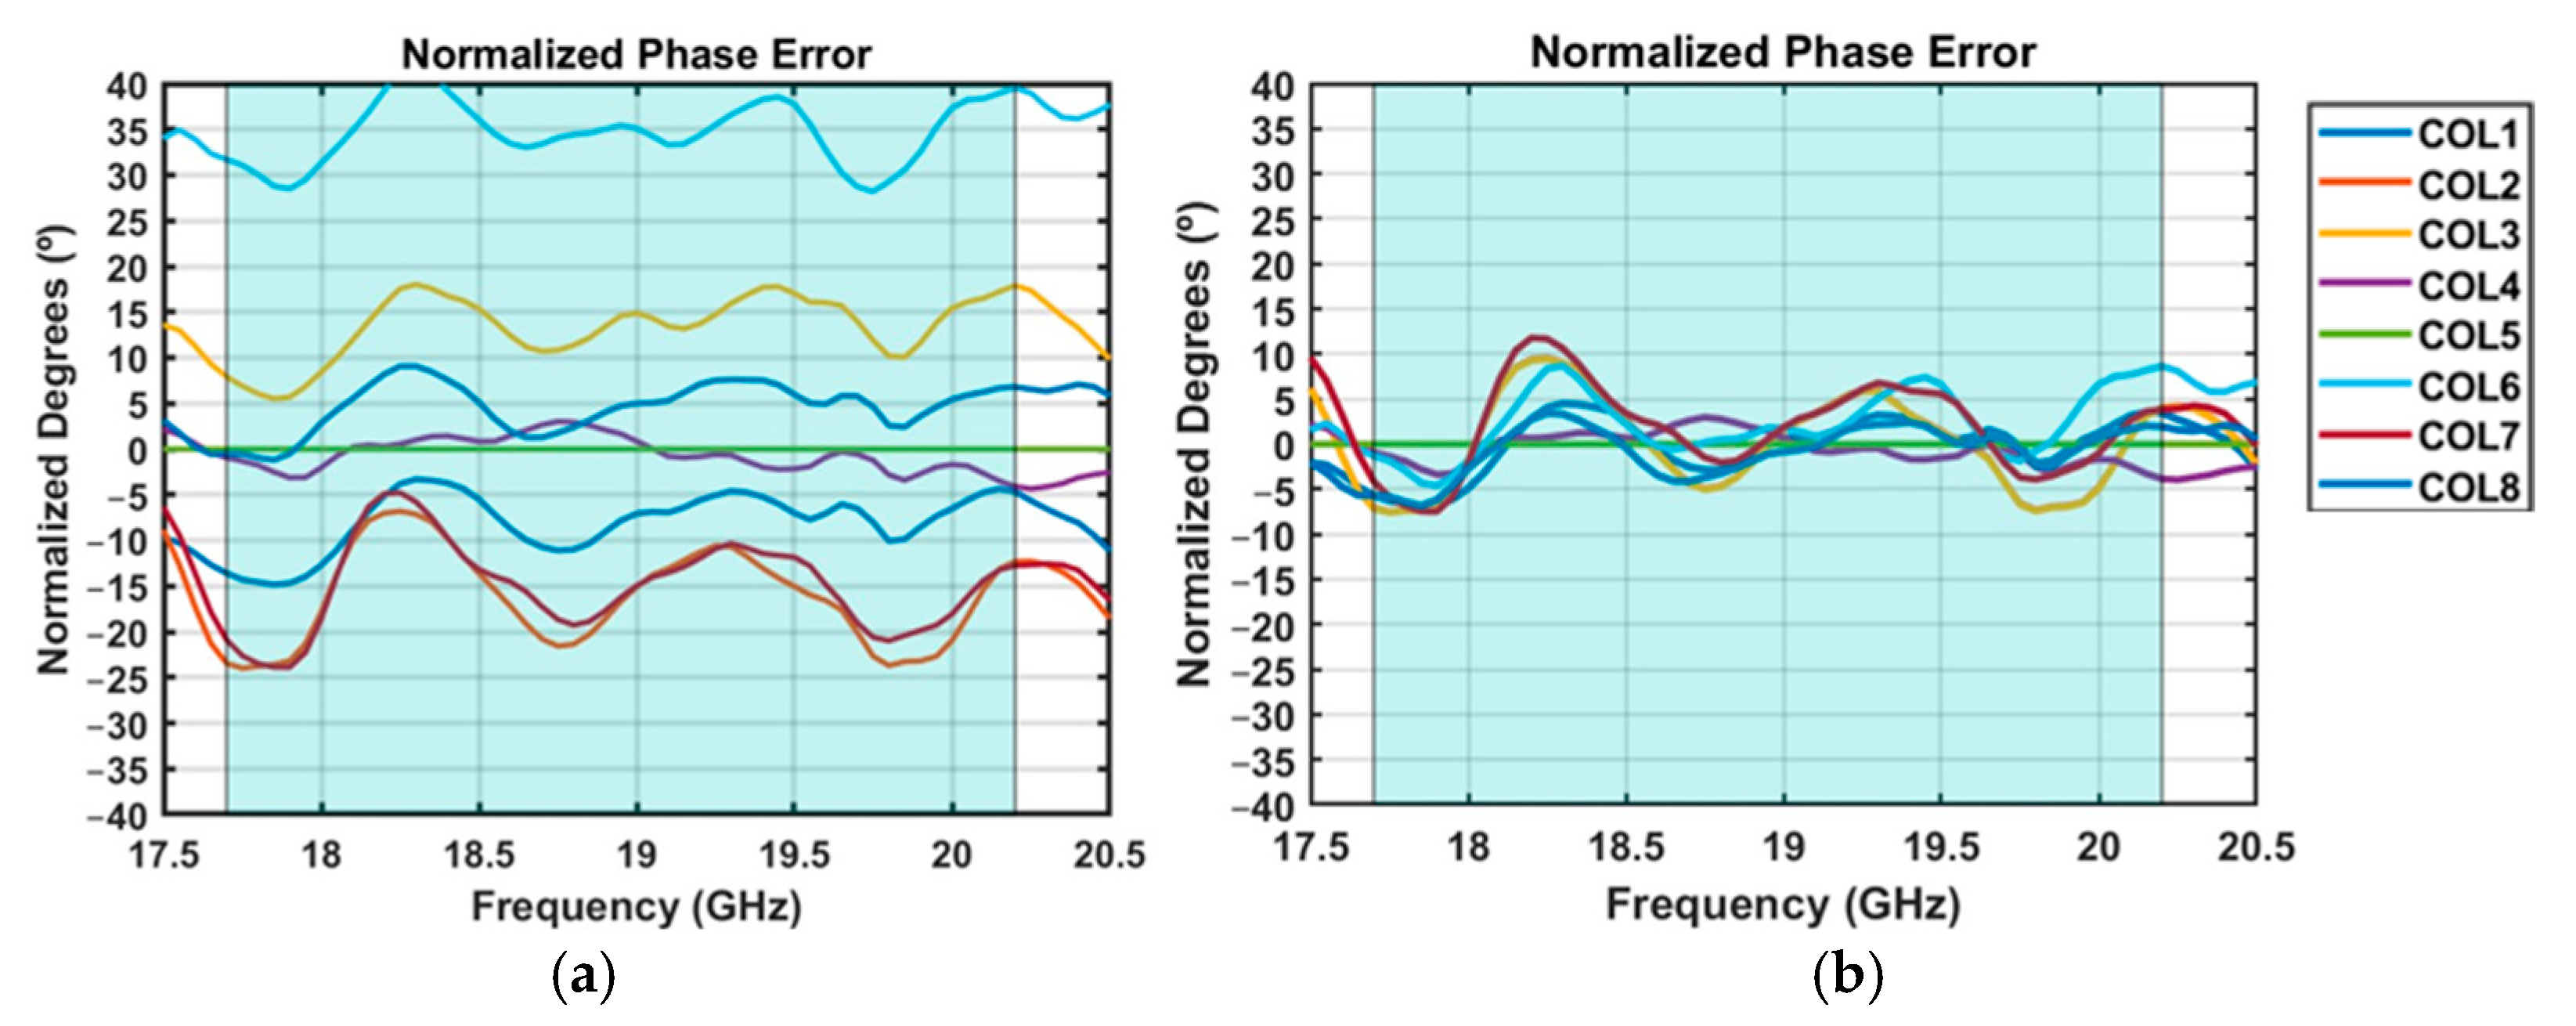
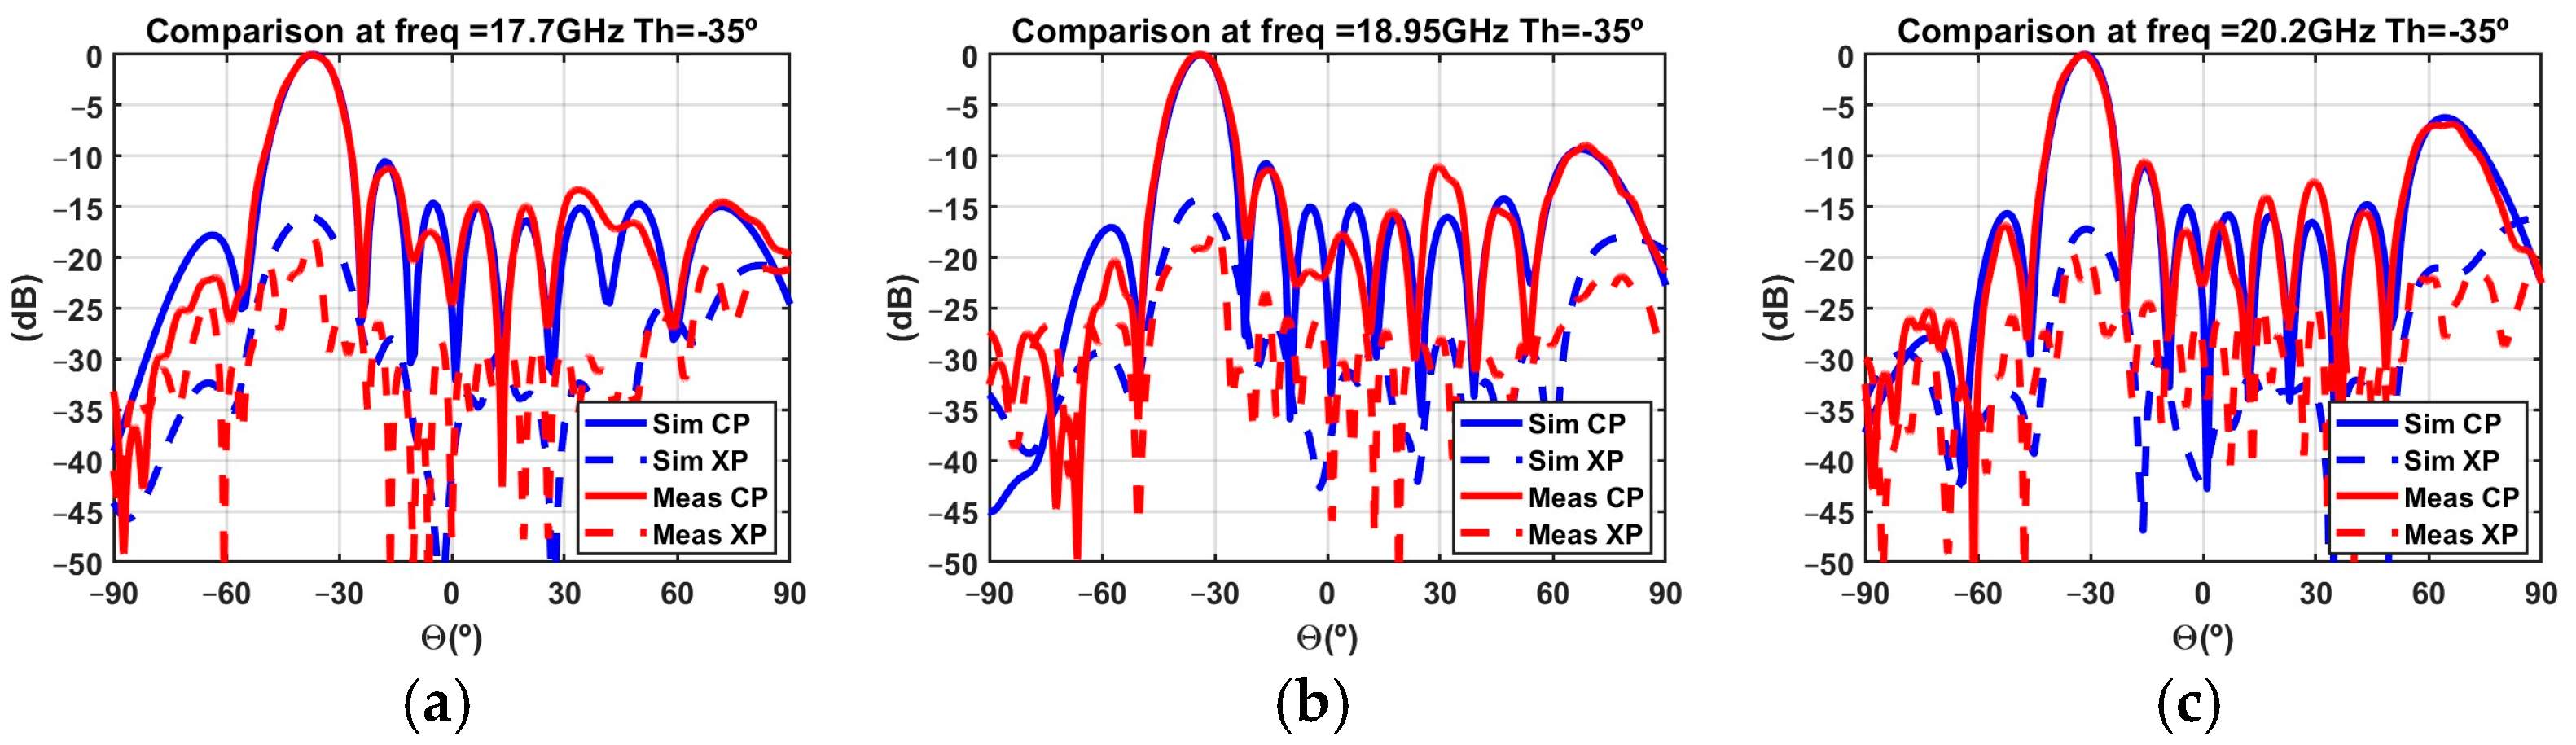
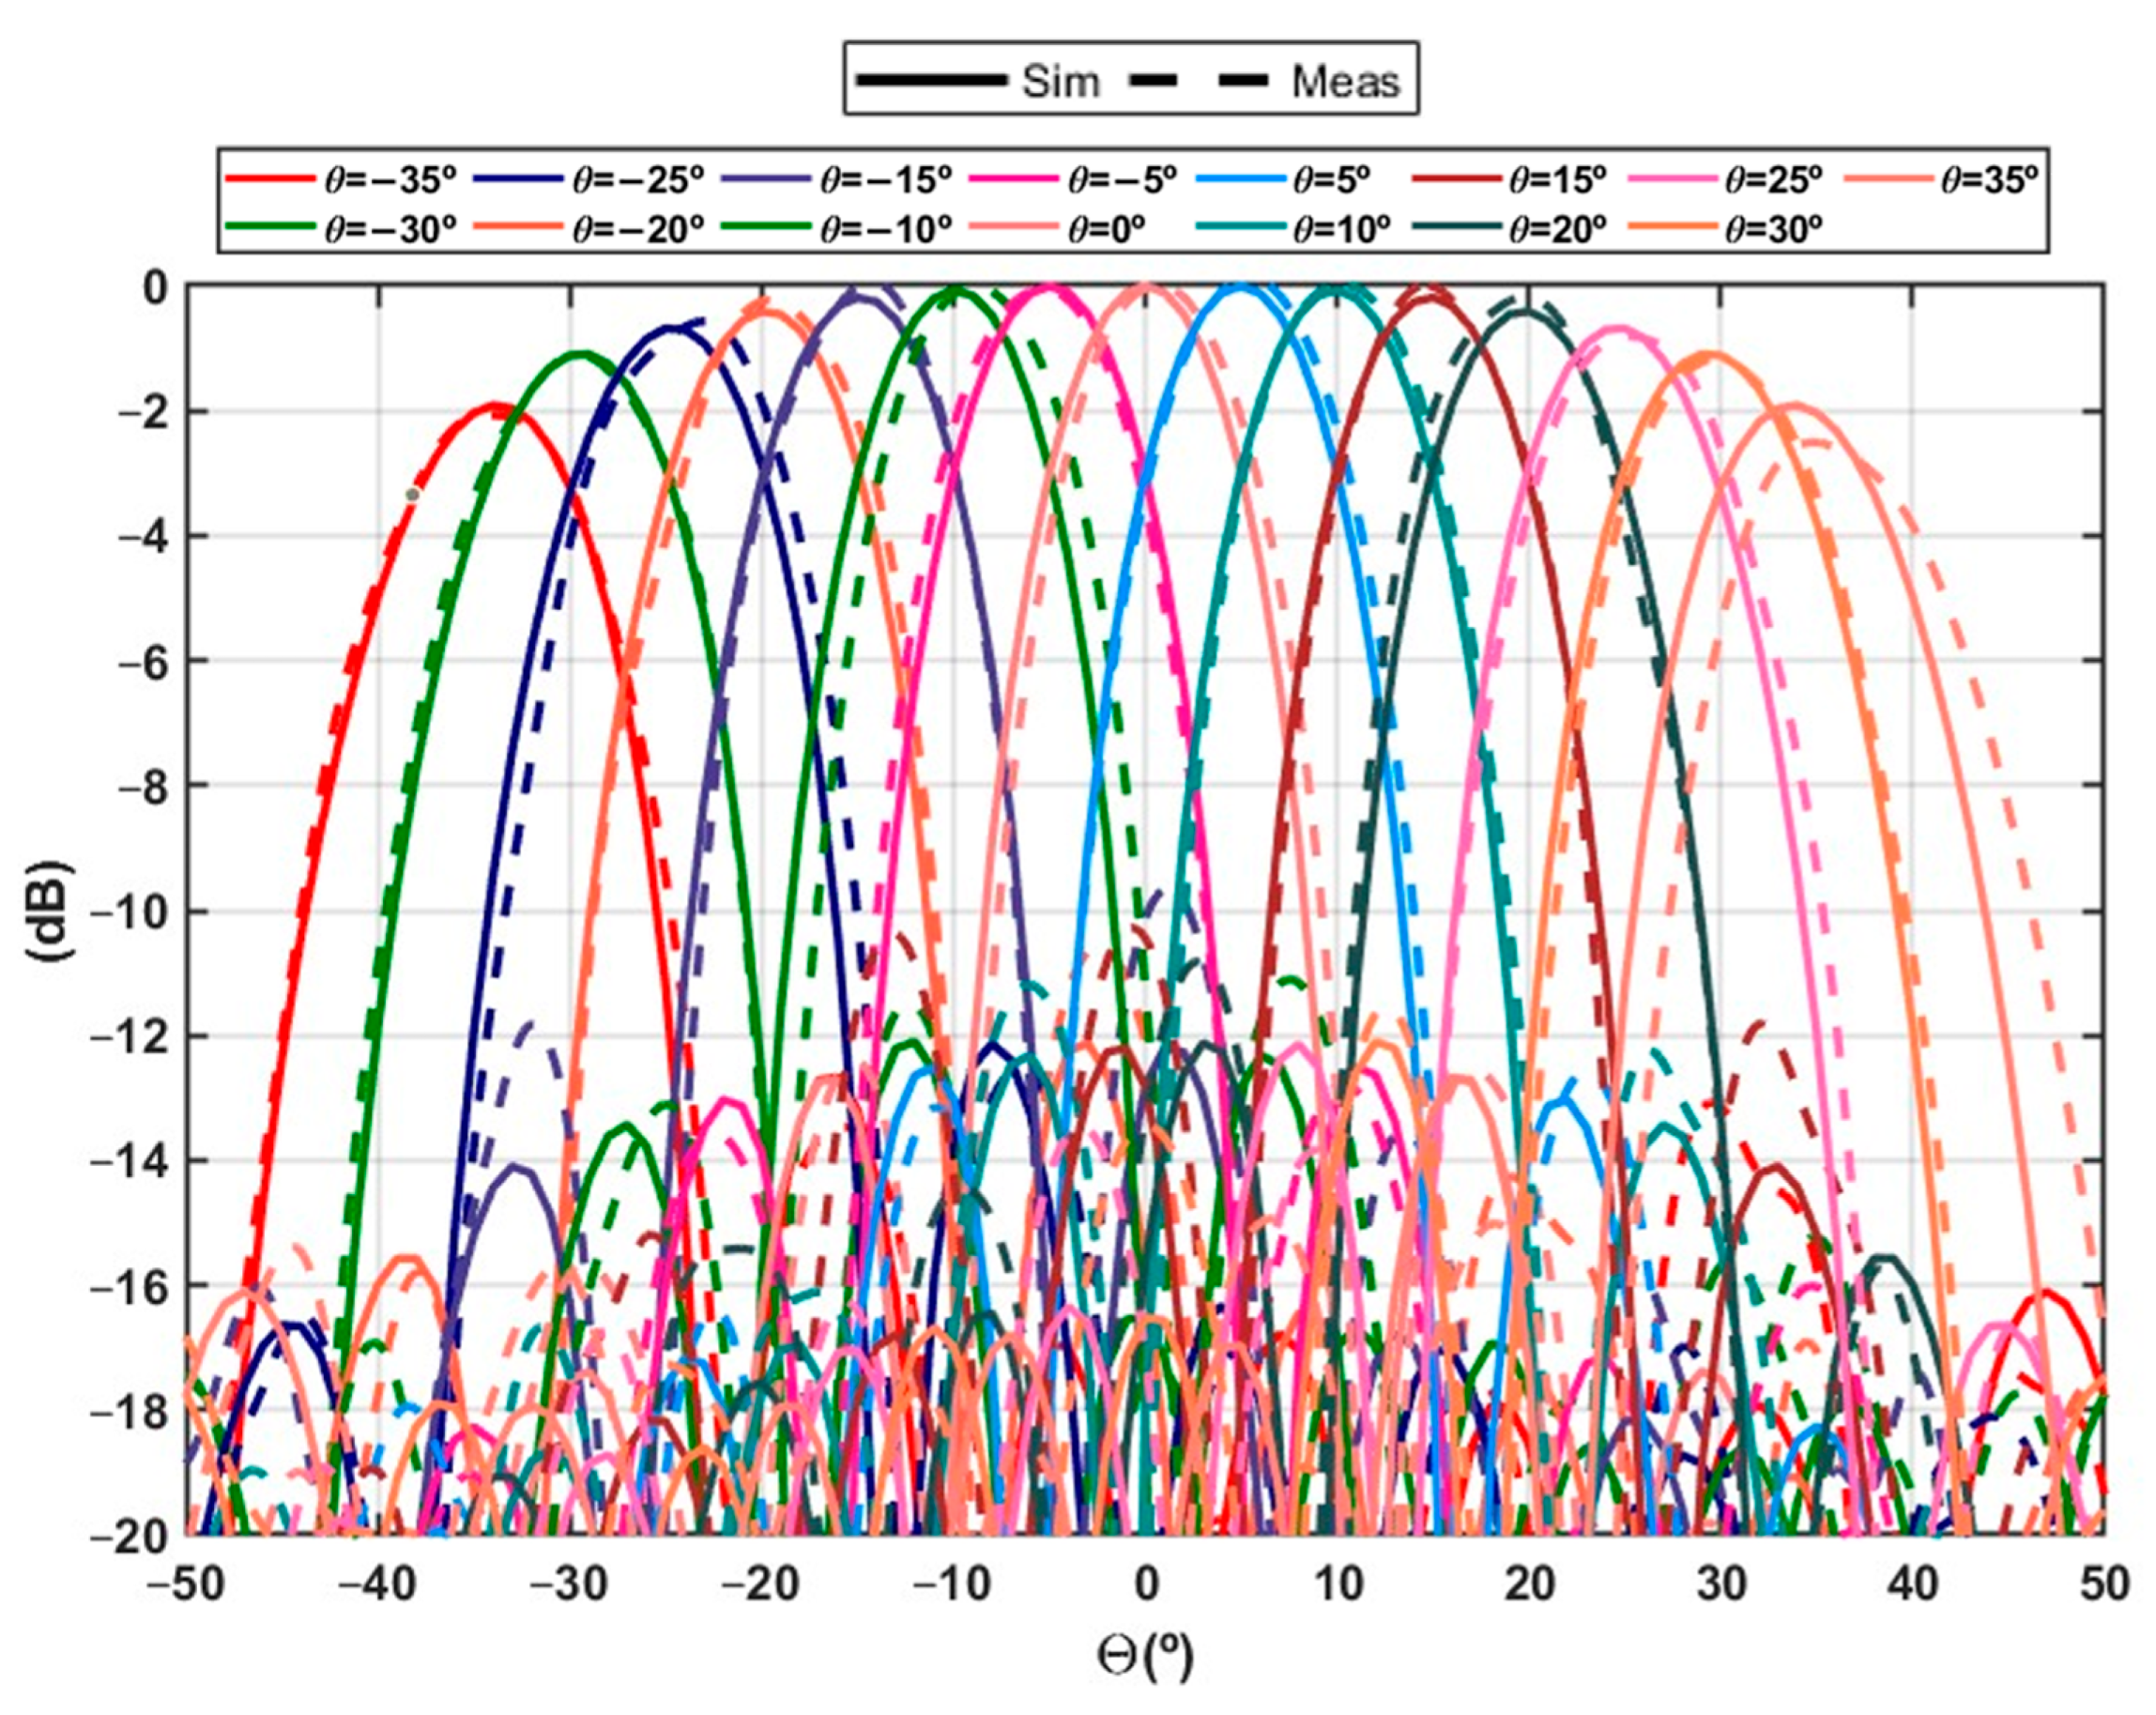
4. Measurement Comparison

After the calibration, shown in the previous section, the measured and simulated radiation pattern results are compared in this section. As described in the previous section, with phase calibration, the obtained result is similar to the obtained result using the REV calibration method; therefore, the radiation patterns simulated and measured within this section only take into account the phase calibration method.
Figure 12 presents the comparison of the normalized radiation patterns (simulation vs. measurement) of the radiation pattern of the horizontal plane at the lower, center and upper frequency. The calibration at the center frequency also has excellent in-band performance for the lower and upper frequencies despite amplitude imbalance between the elements. The measured cross polar level is higher than the simulation because of the manufacturing misalignment. Figure 13 presents the radiation pattern at the lower, center and upper frequency of the extreme beam steering direction (−35°). For this beam direction, the progressive phases of lineal array for this steering are applied to each column by adding the calibration states from the broadside steering. This figure shows that the calibration for broadside direction is valid for the extreme beam steering angle in the band.
Once the calibration has been demonstrated to work for broadside in the entire working band, progressive phase shifting is applied to steer the beam from −35 degrees to 35 degrees for the phased array. Since the discrete phase step of the beamformer is 5.625 degrees, there are certain states in which the closest phase state (previous or subsequent) should be selected. Figure 14 presents the comparison of radiation patterns of the antenna at the center frequency (18.95 GHz). As Figure 12 and Figure 13 show, the behavior of the phased array at the lower and upper frequencies is very similar.
Finally, the realized active phased array antenna gain is measured by comparing with a calibrated standard gain horn antenna (SGH). Figure 15 shows the measured realized gain for all the beam steering directions; the highest gain of the phased array occurs in the broadside direction. The further you move away from the perpendicular axis of the array, the more the gain decreases. As can be seen in Figure 15, in the worst-case gain loss is 4 dB. The measured realized gain includes the losses of the cables, the additional lines that move the connectors away from the columns and the losses of the connectors.

5. Conclusions

In this paper, the comparison of calibration processes for an active phased array antenna is presented. The passive antenna prototype is characterized separately, revealing substantial manufacturing errors. These manufacturing errors can be corrected by using the reconfigurability methods provided by the beamformer.
Since the mutual coupling interaction of the array elements can be diminished, the proposed on/off toggle calibration method provides a faster alternative to the REV procedure. This method achieves coherent performance across the entire operating frequency band.
The presented measurement results demonstrate the capabilities of both methods to correct the impact of manufacturing tolerances on the passive phased array antenna elements.

Author Contributions

Conceptualization, X.S. and A.-T.M.-B.; methodology and validation X.S. and J.C.-M.; software J.C.-M.; formal analysis, X.S. and J.-M.F.-G.; writing—original draft preparation X.S., J.-M.F.-G. and M.S.-C.; writing—review and editing, X.S. and A.-T.M.-B. All authors have read and agreed to the published version of the manuscript.

Funding

This work was supported by the Spanish Government, Ministry of Economy, National Program of Research, Development and Innovation under the project New Array Antenna Technologies and Digital Processing for the FUTURE Integrated Terrestrial and Space-based Millimeter Wave Radio Systems—UPM-InTerSpaCE (PID2020-112545RB-C51).

Data Availability Statement

The original contributions presented in this study are included in the article. Further inquiries can be directed to the corresponding author.

Acknowledgments

We would like to thank LEHA-UPM for being able to carry out the measurements at the LEHA-UPM facilities with the support of their technicians. We would also like to thank the company Chengdu Xphased Technology Company Ltd. (Chengdu, China) for providing us with the ICs and the support received from their staff.

Conflicts of Interest

The authors declare no conflicts of interest.

References

  1. Corici, M.; Liolis, K.; Politis, C.; Geurtz, A.; Cahill, J.; Bunyan, S.; Schlichter, T.; Völk, F.; Kapovits, A. Satellite Is 5G—SATis5 Whitepaper. Available online: https://connectivity.esa.int/sites/default/files/Satellite%20is%205G%20-%20SATis5%20Whitepaper.pdf (accessed on 6 July 2024).
  2. Jung, Y.-B.; Eom, S.-Y.; Jeon, S.-I. Novel Antenna System Design for Satellite Mobile Multimedia Service. IEEE Trans. Veh. Technol. 2010, 59, 4237–4247. [Google Scholar] [CrossRef]
  3. Ding, R.; Chen, T.; Liu, L.; Zheng, Z.; Hao, Y.; Zheng, H.; Wang, W.; You, L. 5G Integrated Satellite Communication Systems: Architectures, Air Interface, and Standardization. In Proceedings of the 2020 International Conference on Wireless Communications and Signal Processing (WCSP), Nanjing, China, 21–23 October 2020; pp. 702–707. [Google Scholar]
  4. Jacomb-Hood, A.; Lier, E. Multibeam active phased arrays for communications satellites. IEEE Microw. Mag. 2000, 1, 40–47. [Google Scholar] [CrossRef]
  5. Khalily, M.; Tafazolli, R.; Xiao, P.; Kishk, A.A. Broadband mm-Wave Microstrip Array Antenna With Improved Radiation Characteristics for Different 5G Applications. IEEE Trans. Antennas Propag. 2018, 66, 4641–4647. [Google Scholar] [CrossRef]
  6. Muriel-Barrado, A.T.; Calatayud-Maeso, J.; Rodriguez-Gallego, A.; Sanchez-Olivares, P.; Fernandez-Gonzalez, J.M.; Sierra-Perez, M. Evaluation of a Planar Reconfigurable Phased Array Antenna Driven by a Multi-Channel Beamforming Module at Ka Band. IEEE Access 2021, 9, 63752–63766. [Google Scholar] [CrossRef]
  7. Sun, X.; Calatayud-Maeso, J.; Muriel-Barrado, A.-T.; Sanchez-Olivares, P.; Gonzalez, J.M.F. Low Cost Active Phased Array with Switchable Circular Polarization in Ka Band for SATCOM Application. In Proceedings of the 2022 16th European Conference on Antennas and Propagation (EuCAP), Madrid, Spain, 27 March–1 April 2022; pp. 1–5. [Google Scholar]
  8. Low, K.K.W.; Kanar, T.; Zihir, S.; Rebeiz, G.M. A 17.7–20.2-GHz 1024-Element K-Band SATCOM Phased-Array Receiver With 8.1-dB/K G/T, ±70° Beam Scanning, and High Transmit Isolation. IEEE Trans. Microw. Theory Tech. 2022, 70, 1769–1778. [Google Scholar] [CrossRef]
  9. 9. Jiang, H.; Qian, M.; Liao, S.; Xue, Q. A 17.7-21.2 GHz Antenna Element for SATCOM Phased-Array Receiver. In Proceedings of the 2024 15th Global Symposium on Millimeter-Waves & Terahertz (GSMM), Hong Kong, 20–22 May 2024; pp. 61–63. [Google Scholar]
  10. Hu, Z.; Li, L.; Kazan, O.; Rebeiz, G.M. A 16-Channel 3.1–25.5-GHz Phased-Array Receive Beamformer IC With Two Simultaneous Beams and 2.0–2.4-dB NF for C/X/Ku/Ka-Band SATCOM. IEEE Trans. Microw. Theory Tech. 2024, 72, 2773–2785. [Google Scholar] [CrossRef]
  11. Luo, X.; Ouyang, J.; Chen, Z.; Han, L.; Yan, W. A Low-Profile 36-Element K-Band Active Phased Array for Ultra-Small Aperture Application. IEEE Access 2020, 8, 62286–62297. [Google Scholar] [CrossRef]
  12. Song, A.H.; Wang, L.; Cheng, Y.J. A Scalable 32–38-GHz Transmitter and Receiver Phased Array With High Radiation Efficiency in UV-LIGA-Based Ceramic Packaging. IEEE Trans. Microw. Theory Tech. 2024, 72, 4975–4985. [Google Scholar] [CrossRef]
  13. Salas-Natera, M.A.; Rodriguez-Osorio, R.M.; de Haro, L. Procedure for Measurement, Characterization, and Calibration of Active Antenna Arrays. IEEE Trans. Instrum. Meas. 2013, 62, 377–391. [Google Scholar] [CrossRef]
  14. Zorkun, A.E.; Salas-Natera, M.A.; Pinto, A.A.; Rodríguez-Osorio, R.M.; Pérez, M.S. A Mutual Coupling-Based Full Self-Online Calibration Method for Antenna Arrays in Uplink. IEEE Open J. Antennas Propag. 2024, 5, 1026–1040. [Google Scholar] [CrossRef]
  15. Zorkun, A.E.; Salas-Natera, M.A.; Rodriguez-Osorio, R.M. Improved Iterative Inverse Matrix Approximation Algorithm for Zero Forcing Precoding in Large Antenna Arrays. IEEE Access 2022, 10, 100964–100975. [Google Scholar] [CrossRef]
  16. Pan, C.; Ba, X.; Tang, Y.; Zhang, F.; Zhang, Y.; Wang, Z.; Fan, W. Phased Array Antenna Calibration Method Experimental Validation and Comparison. Electronics 2023, 12, 489. [Google Scholar] [CrossRef]
  17. Abdel-Wahab, W.M.; Al-Saedi, H.; Alian, E.H.M.; Raeis-Zadeh, M.; Ehsandar, A.; Palizban, A.; Ghafarian, N.; Chen, G.; Gharaee, H.; Nezhad-Ahmadi, M.R.; et al. A Modular Architecture for Wide Scan Angle Phased Array Antenna for K/Ka Mobile SATCOM. In Proceedings of the 2019 IEEE/MTT-S International Microwave Symposium—IMS 2019, Boston, MA, USA, 2–7 June 2019; pp. 1076–1079. [Google Scholar]
  18. Mano, S.; Katagi, T. A method for measuring amplitude and phase of each radiating element of a phased array antenna. Electron. Commun. Jpn. (Part I Commun.) 1982, 65, 58–64. [Google Scholar] [CrossRef]
  19. Yoon, H.-J.; Min, B.-W. Improved Rotating-Element Electric-Field Vector Method for Fast Far-Field Phased Array Calibration. IEEE Trans. Antennas Propag. 2021, 69, 8021–8026. [Google Scholar] [CrossRef]
  20. Zhang, F.; Fan, W.; Wang, Z.; Zhang, Y.; Pedersen, G.F. Improved Over-the-Air Phased Array Calibration Based on Measured Complex Array Signals. IEEE Antennas Wirel. Propag. Lett. 2019, 18, 1174–1178. [Google Scholar] [CrossRef]
  21. Kim, D.-C.; Kim, T.-W.; Minz, L.; Park, S.-O. Fully Digital Beamforming Receiver With a Real-Time Calibration for 5G Mobile Communication. IEEE Trans. Antennas Propag. 2019, 67, 3809–3819. [Google Scholar] [CrossRef]
  22. He, G.; Gao, X.; Zhang, R. Impact Analysis and Calibration Methods of Excitation Errors for Phased Array Antennas. IEEE Access 2021, 9, 59010–59026. [Google Scholar] [CrossRef]
  23. Long, R.; Ouyang, J.; Yang, F.; Han, W.; Zhou, L. Fast Amplitude-Only Measurement Method for Phased Array Calibration. IEEE Trans. Antennas Propag. 2017, 65, 1815–1822. [Google Scholar] [CrossRef]
Figure 1. Schematic of the active phased array architecture.
Applsci 15 04066 g001
Figure 2. Prototype of the active phased array in the anechoic chamber.
Applsci 15 04066 g002
Figure 3. Simulation model and stack up of the 8 × 8 array antenna.
Applsci 15 04066 g003
Figure 4. Manufactured array prototype: (a) Front view. (b) Back view.
Applsci 15 04066 g004
Figure 5. Beamformer control and power supply schematic.
Applsci 15 04066 g005
Figure 6. Comparison of simulated and measured reflection coefficient.
Applsci 15 04066 g006
Figure 7. (a) Normalized measured amplitude of the subarray respect Col 5. (b) Normalized measured phase of the subarray respect Col 5.
Applsci 15 04066 g007
Figure 8. Calibration set up for the active phased array.
Applsci 15 04066 g008
Figure 9. Flowchart of the calibration process.
Applsci 15 04066 g009
Figure 10. (a) Normalized measured initial phase response of the subarray. (b) Normalized measured calibrated phase response of the subarray.
Applsci 15 04066 g010
Figure 11. (a) Measured horizontal cut of the phased array with (W) and without (WO) calibration, taking Column 4 (Col4) and Column 5 (Col5) as a reference. (b) Measured horizontal cut of the phased array with phase calibration and REV calibration.
Applsci 15 04066 g011
Figure 12. (a) Comparison of radiation patterns at frequency = 17.7 GHz. (b) Comparison of radiation patterns at frequency = 18.95 GHz. (c) Comparison of radiation patterns at frequency = 20.2 GHz.
Applsci 15 04066 g012
Figure 13. (a) Comparison of radiation patterns at frequency = 17.7 GHz. (b) Comparison of radiation patterns at frequency = 18.95 GHz. (c) Comparison of radiation patterns at frequency = 20.2 GHz.
Applsci 15 04066 g013
Figure 14. Simulated and measured copolar normalized radiation pattern at 18.95 GHz of the phased array antenna.
Applsci 15 04066 g014
Figure 15. Measured realized gain in band.
Applsci 15 04066 g015
Disclaimer/Publisher’s Note: The statements, opinions and data contained in all publications are solely those of the individual author(s) and contributor(s) and not of MDPI and/or the editor(s). MDPI and/or the editor(s) disclaim responsibility for any injury to people or property resulting from any ideas, methods, instructions or products referred to in the content.

