Article

Structural Modeling and Failure Assessment of Spar-Type Substructure for 5 MW Floating Offshore Wind Turbine under Extreme Conditions in the East Sea

1
Department of Floating Offshore Wind Energy System, University of Ulsan, Ulsan 44610, Korea
2
Fuel Gas Technology Center, Korea Marine Equipment Research Institute, Busan 49111, Korea
3
School of Naval Architecture & Ocean Engineering, University of Ulsan, Ulsan 44610, Korea
*
Author to whom correspondence should be addressed.
Kwangtae Ha and Jun-Bae Kim equally contributed to this work as first authors.
Energies 2021, 14(20), 6571; https://doi.org/10.3390/en14206571
Submission received: 14 August 2021 / Revised: 23 September 2021 / Accepted: 29 September 2021 / Published: 12 October 2021
(This article belongs to the Special Issue Advancement in Wind Turbine Technology)

Abstract

:
Not only the driving for offshore wind energy capacity of 12 GW by Korea’s Renewable Energy 2030 plan but also the need for the rejuvenation of existing world-class shipbuilders’ infrastructures is drawing much attention to offshore wind energy in Korea, especially to the diverse substructures. Considering the deep-sea environment in the East Sea, this paper presents detailed modeling and analysis of spar-type substructure for a 5 MW floating offshore wind turbine (FOWT). This process uses a fully coupled integrated load analysis, which was carried out using FAST, a widely used integrated load analysis software developed by NREL, coupled with an in-house hydrodynamic code (UOU code). The environmental design loads were calculated from data recorded over three years at the Ulsan Marine buoy point according to the ABS and DNVGL standards. The total 12 maximum cases from DLC 6.1 were selected to evaluate the structural integrity of the spar-type substructure under the three co-directional conditions (45°, 135°, and 315°) of wind and wave. A three-dimensional (3D) structural finite element (FE) model incorporating the wind turbine tower and floating structure bolted joint connection was constructed in FEGate (pre/post-structural analysis module based on MSC NASTRAN for ship and offshore structures). The FEM analysis applied the external loads such as the structural loads due to the inertial acceleration, buoyancy, and gravity, and the environmental loads due to the wind, wave, and current. The three-dimensional FE analysis results from the MSC Nastran software showed that the designed spar-type substructure had enough strength to endure the extreme limitation in the East Sea based on the von Mises criteria. The current process of this study would be applicable to the other substructures such as the submersible type.

1. Introduction

Among the renewable energy resources, wind energy has been growing steadily and securing the competitiveness of price through its lowering levelized cost of energy (LCOE). In particular, onshore wind has shown large cost reductions over decades with economically large-scaled wind turbine size and wind farms construction in addition to the improvement of the technologies and logistics, which lead to a preferable choice among other alternative renewable energy sources against fossil fuel energy [1,2,3,4].
But the onshore wind farms have been facing many limitations for large-scale wind turbines installation due to the visibility issue, noise emission, transportation difficulty, and other opposition aroused from residents. Moreover, due to their surrounding land conditions, onshore wind turbines are more likely to have lower capacity factors which could decrease the overall power performance [5,6,7]. To overcome these problems, wind turbines began to be installed on offshore instead of on the existing onshore regions. Normally offshore wind turbines tend to obtain higher wind speed, more sustained, lower turbulence, and better wind shear than onshore wind turbines, which means that it can increase the capacity factor [8]. For example, onshore wind farms in Europe have an average capacity factor of 24% while offshore wind farms reach 48% of their capacity in 2019 [9]. According to the 2019 offshore wind outlook by the International Energy Agency (IEA), offshore wind energy is considered to be a global trend and is poised to play an important role in future energy systems. Generally, the offshore wind turbines are categorized into bottom-fixed type and floating type depending on that the mounting substructure of the traditional wind turbines is floating or fixed [10,11,12].
The bottom-fixed offshore wind turbines exclusively dominate todays offshore wind energy market and the substructure types (monopile, gravity, and jacket) shown in Figure 1 are mostly utilized depending on the soil condition and water depth [13].
Arshad et al. reviewed the offshore structure foundation and also performed research on the design and analysis of the monopile with large-diameter and foundation under extreme conditions [14]. Abhinav and Sara focused on the dynamic analysis of monopile-supported offshore wind turbines depending on the soil condition related to the site-specific geotechnical investigations [15], and other researchers focused on the coupled simulation of wind turbines and substructures [16,17,18]. Chen et al. researched the design and analysis of jacket-type substructures using static stress analysis to ensure that all structures had a similar level of load-carrying capacity [19]. The design theory and tools for the jacket substructures are well-addressed in the document from NREL [20].
However, due to the installation limit of up to 35~50 m water depth, the bottom-fixed types are not easily applicable to many regions including the East Sea of South Korea with limited shallow waters [21,22]. In the case of a water depth over 35 m, floating offshore wind turbines (FOWTs) could be well utilized to access the incredible wind resources in terms of higher and steadier wind speed, and lower turbulence, which means that higher power generation efficiency can be expected from it [23]. Unlikely to be fixed offshore wind turbines, the floating offshore wind turbines (FOWTs) use floating foundations such as spar type, semi-submersible type including barge type, and TLP type as shown in Figure 2 [24].
The design of a FOWT in the deep-water environment is complicated compared to conventional fixed offshore wind turbines because of the complex external load conditions caused by waves, wind, and current as well as the structural loads including the hydrostatic pressure and ballast loads [25]. Due to the highly coupled interaction of aerodynamics from wind and hydrodynamics from the ocean, it is important to understand the dynamic behavior of the floating platform related to the six degrees of freedom such as pitch, yaw, roll, surge, heave, and sway to design the optimal substructure to mount the wind turbine generator [26]. There are many studies that have been performed for the dynamic response of floating offshore wind turbines and the resulting dynamic response values are then used for the structural analysis of the substructure model in detail [27,28,29,30].
Bagbanci et al. presented a coupled dynamic analysis of spar-type floating wind turbine and validated with results obtained from OC3 Hywind and obtained the tower base motions and platform motions for wind speed 3.7 m/s with 4 m wave height and 0 degrees heading angle [31]. Han et al. found the optimal spar substructure design for a 3 MW FOWT with the maximum postural stability in 6-DOF motions using a genetic algorithm with a neural network approximation [32]. Hegseth et al. presented a linearized aero-hydro-servo-elastic floating wind turbine model to find out the optimal design solution using the gradient-based optimization for a 10 MW FOWT with a spar-type substructure [33]. Valk and Paul performed the coupled simulations of FOWT to derive proper design strategies according to the dynamics of substructures [34]. However, there is little research on the detailed structural modeling process and stress analysis of a spar-type substructure for a FOWT utilizing the coupled load analysis and the interface between the nonlinear time-domain multi-physics models (aero-hydro-servo-elastic) and three-dimensional finite element model. Furthermore, even though there was a study on the substructures for the Southwest offshore wind farm in Korea with a water depth under 33 m, few studies were published for the FOWT in the East Sea of Korea, where six GW floating offshore wind farms were planned [35].
In this work, the design process on the structural model and analysis of a spar-type substructure for a 5 MW FOWT specially designated to the East Sea in South Korea will be presented in detail with a fully coupled integrated load analysis and three-dimensional finite element model/analysis. FAST, a widely used integrated load analysis software developed by NREL, was coupled with in-house hydrodynamic code (UOU code) [36,37]. The environmental design loads will be calculated from the data recorded for three years at the Ulsan Marine buoy point according to the ABS and DNV standards [38,39]. The three-dimensional (3D) structural finite element (FE) model of a spar-type substructure incorporating the wind turbine tower and floating structure bolted joint was constructed under the external loads such as the structural loads due to the inertial acceleration, buoyance, and gravity, and the environmental loads due to the wind, wave, and current. The structural integrity of the spar-type substructure was investigated under extreme limitations based on the von Mises criteria.

2. Specification of 5 MW FOWT

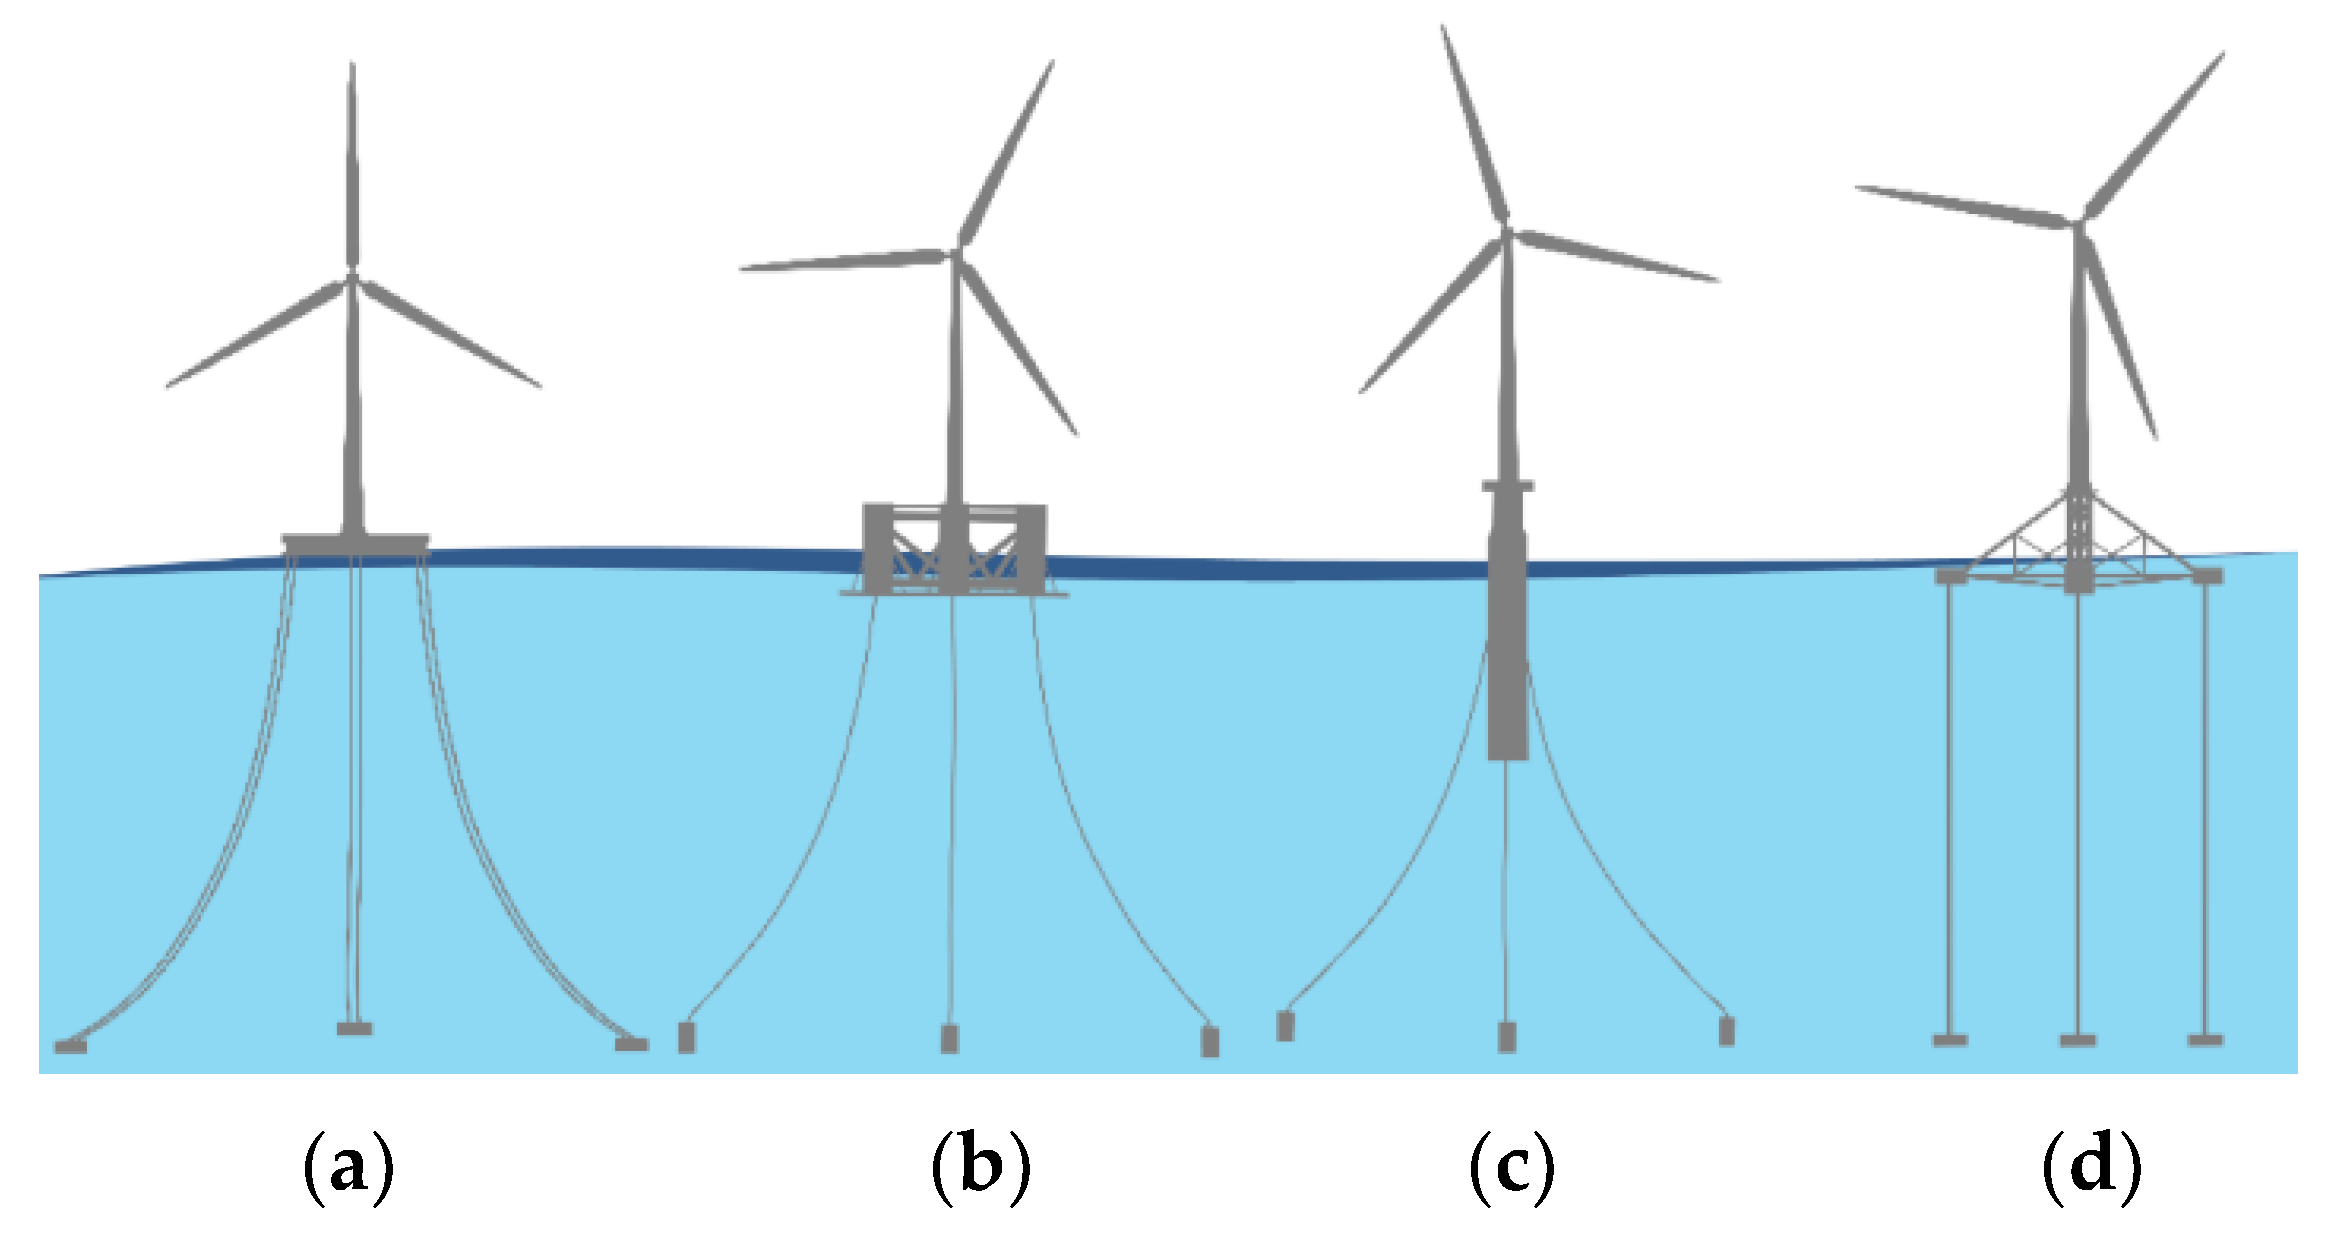
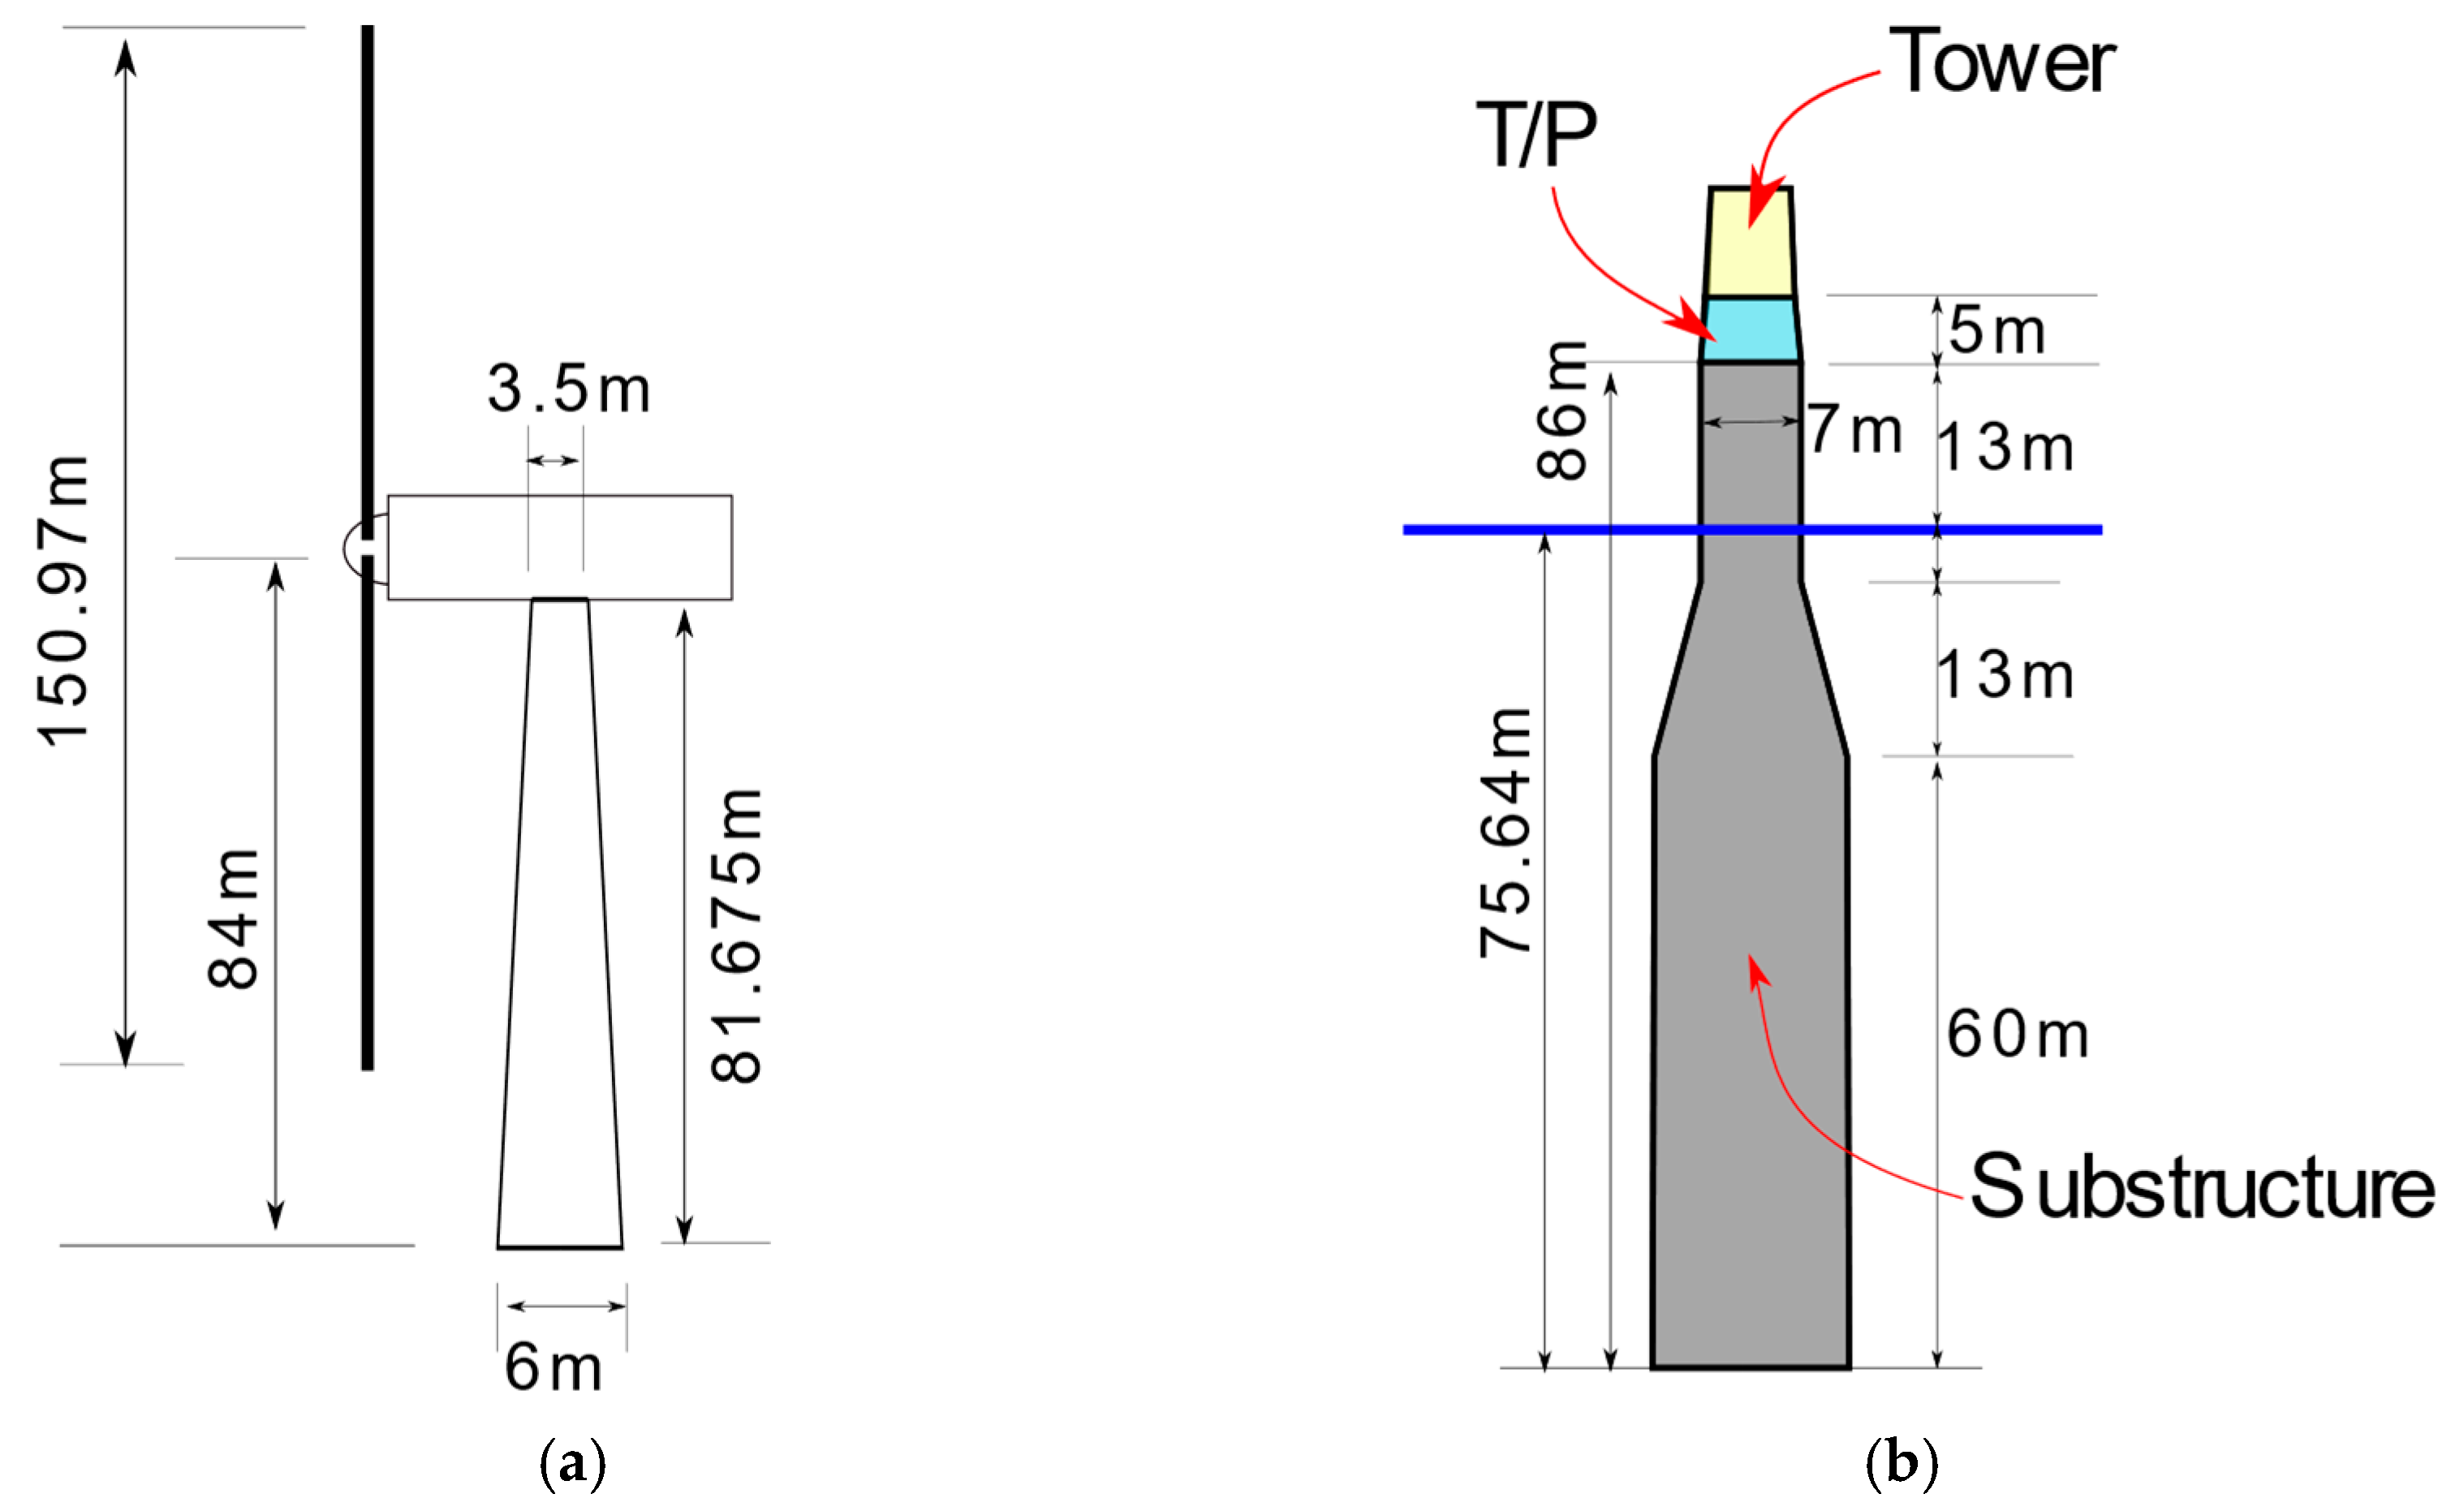
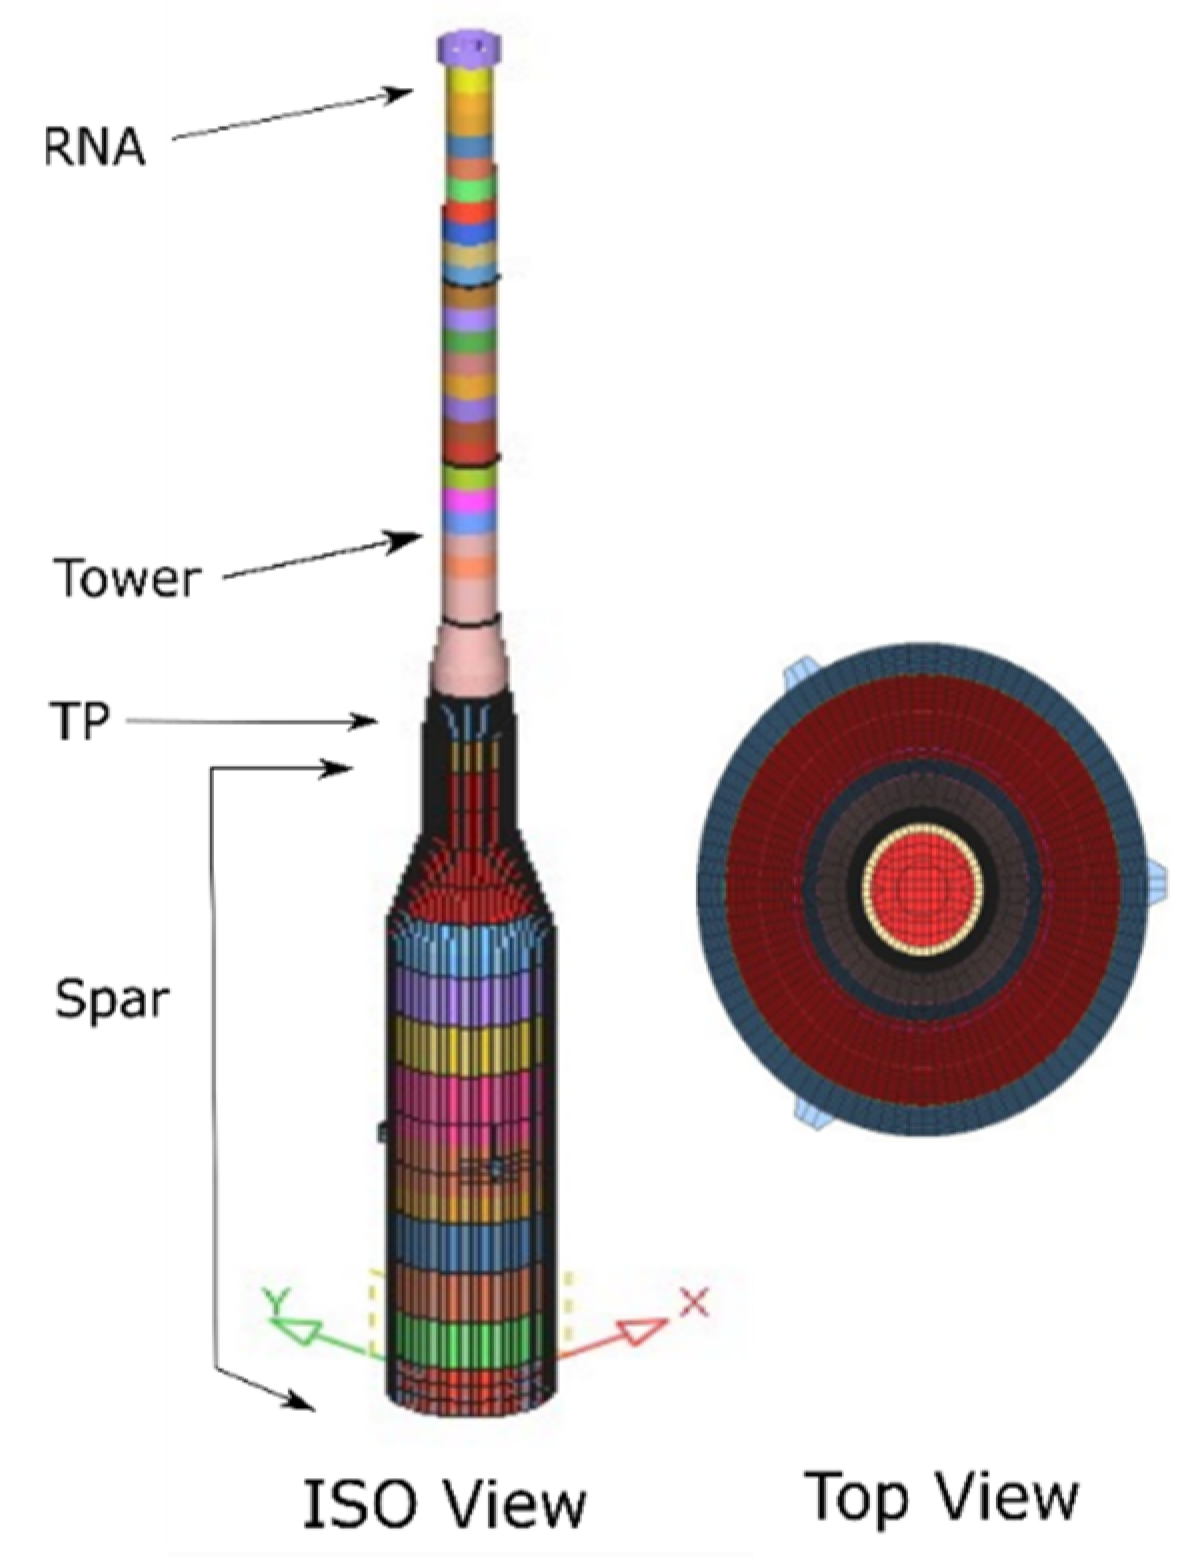
2.1. Overall Key Specifications and Schematic Layout

The schematic layout of the wind turbine and a spar-type floating platform are shown in Figure 3. Table 1 lists the overall key specification of 5 MW FOWT, and Table 2 and Table 3 lists the detailed properties of the baseline part of the 5 MW rotor nacelle assembly (RNA) and tower developed by Unison (www.unison.co.kr), and the characteristics of the structural specifications of the floating platform, respectively.

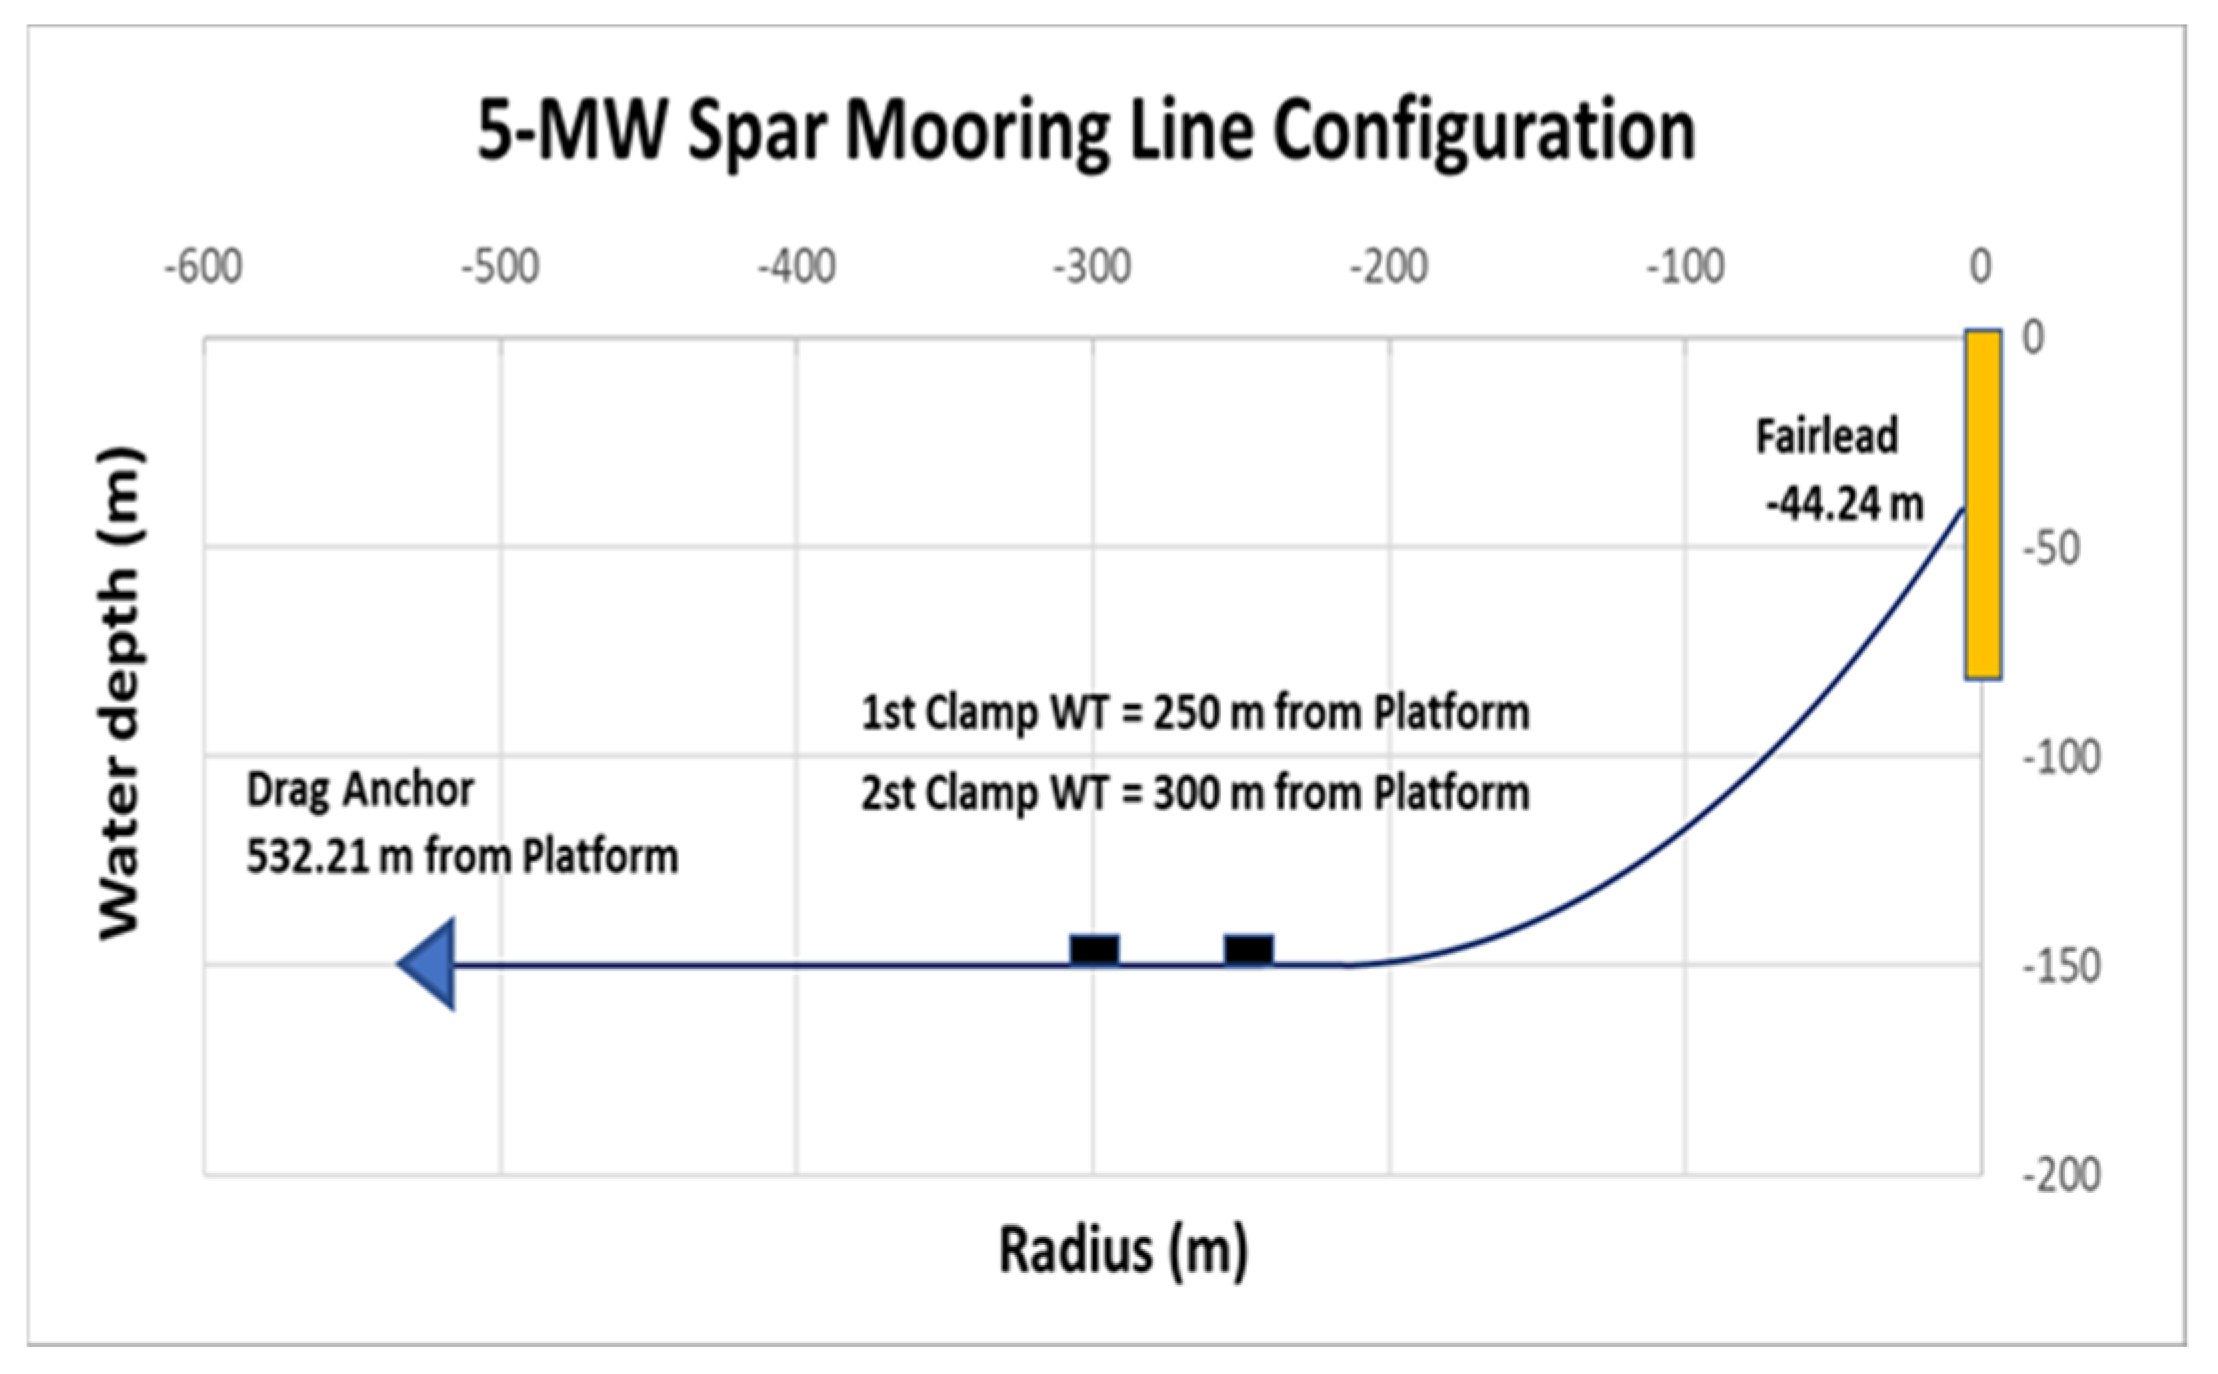
2.2. Mooring System Specification

The mooring system was designed as the catenary mooring type to suit the depth of 150 m in the waters of the Korea East Sea gas field. The layout and specifications of the mooring system are shown in Figure 4 and Table 4. It was designed as a studless link chain, the length of the chain was 560 m, the diameter was 120 mm, and the dry weight per unit length was 288 kg/m. The drag anchor is located at 532.21 m from the center of the floater, and by installing two clamp weights, it is designed so that lift-up does not occur at the anchor point even if the touched down length is short [40].

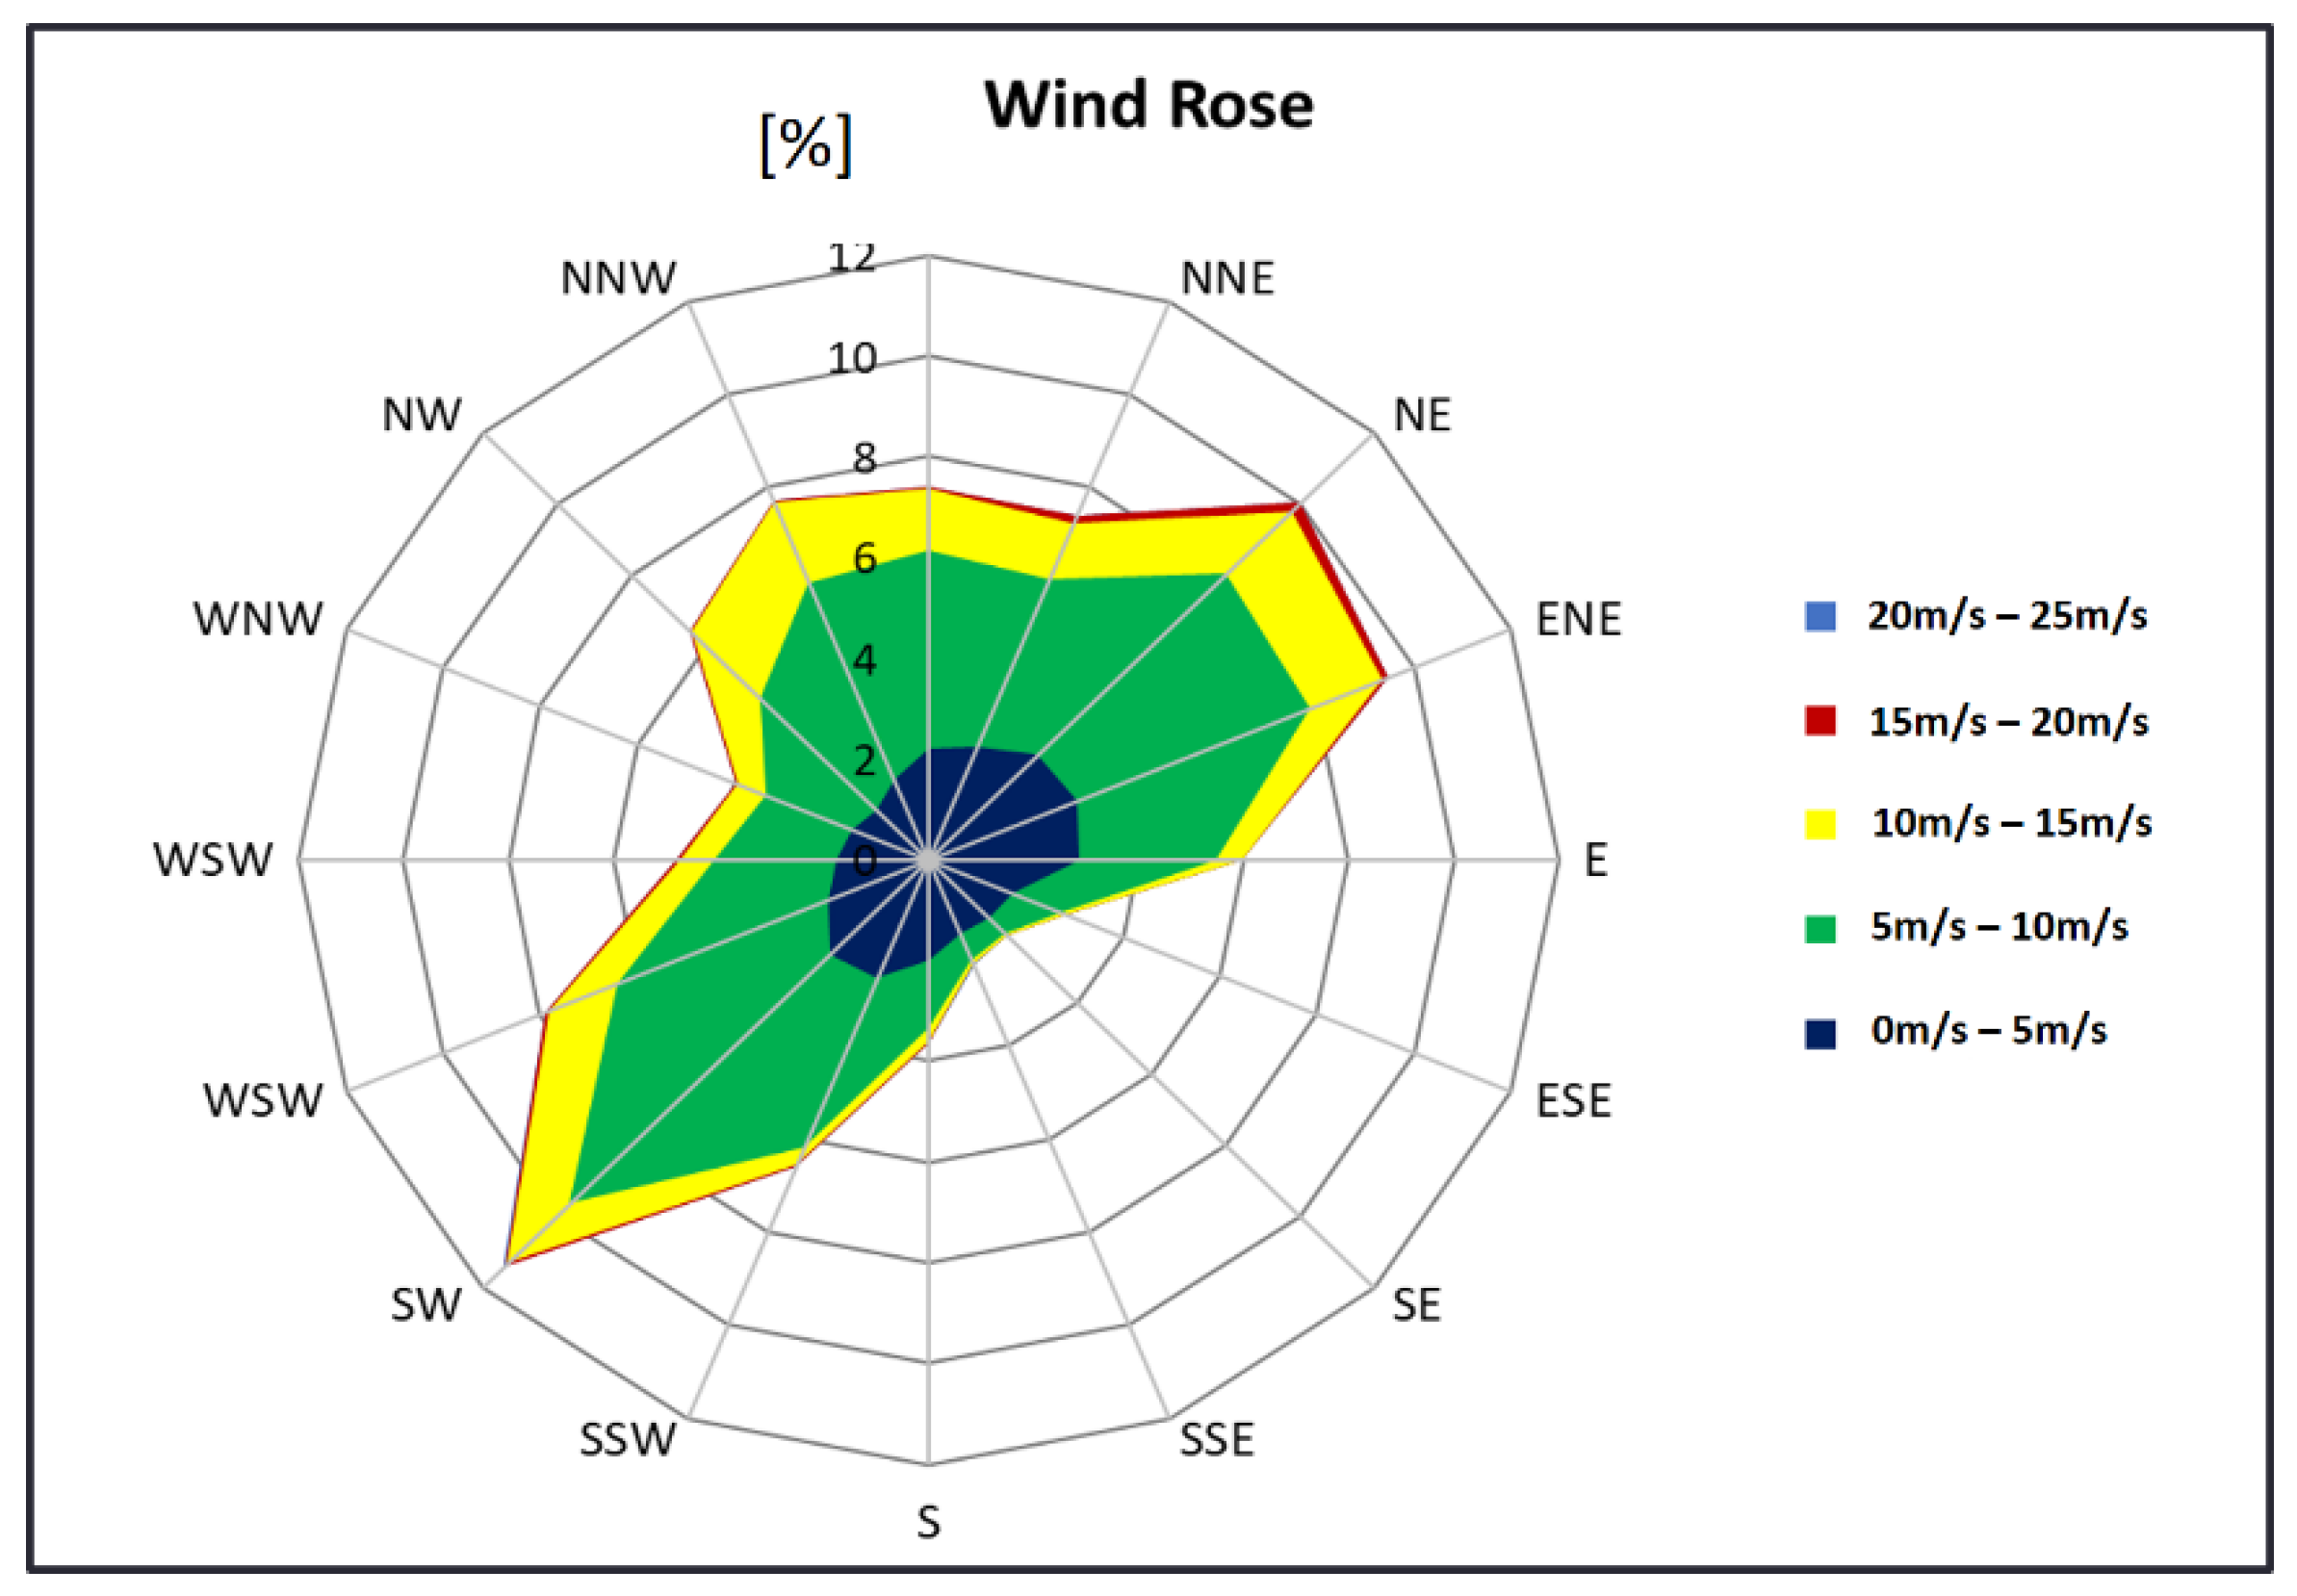
3. Extreme Environmental Conditions at the East Sea

The 5 MW SPAR FOWT is planned to be installed in the East Sea of 150 m water depth about 58 km from the Ulsan coastline in Korea. The wind and wave data were obtained from the data recorded for three (2016–2018) years at the nearest Ulsan Marine buoy point. The 50 years return period extreme sea state was estimated using extreme statistical analysis [41]. In the extreme sea state, the 50 years return period wind speed was applied to 39.83 m/s referring to the IEC standard [42,43]. The extreme period of significant wave height was 11.12 m with a wave period is 14.17 s. With reference to the annual tidal report, the extreme current speed was applied at 1.63 m/s [44]. Figure 5 shows the wind rose diagram with different wind speed configurations and Table 5 summarizes the extreme environmental design conditions.

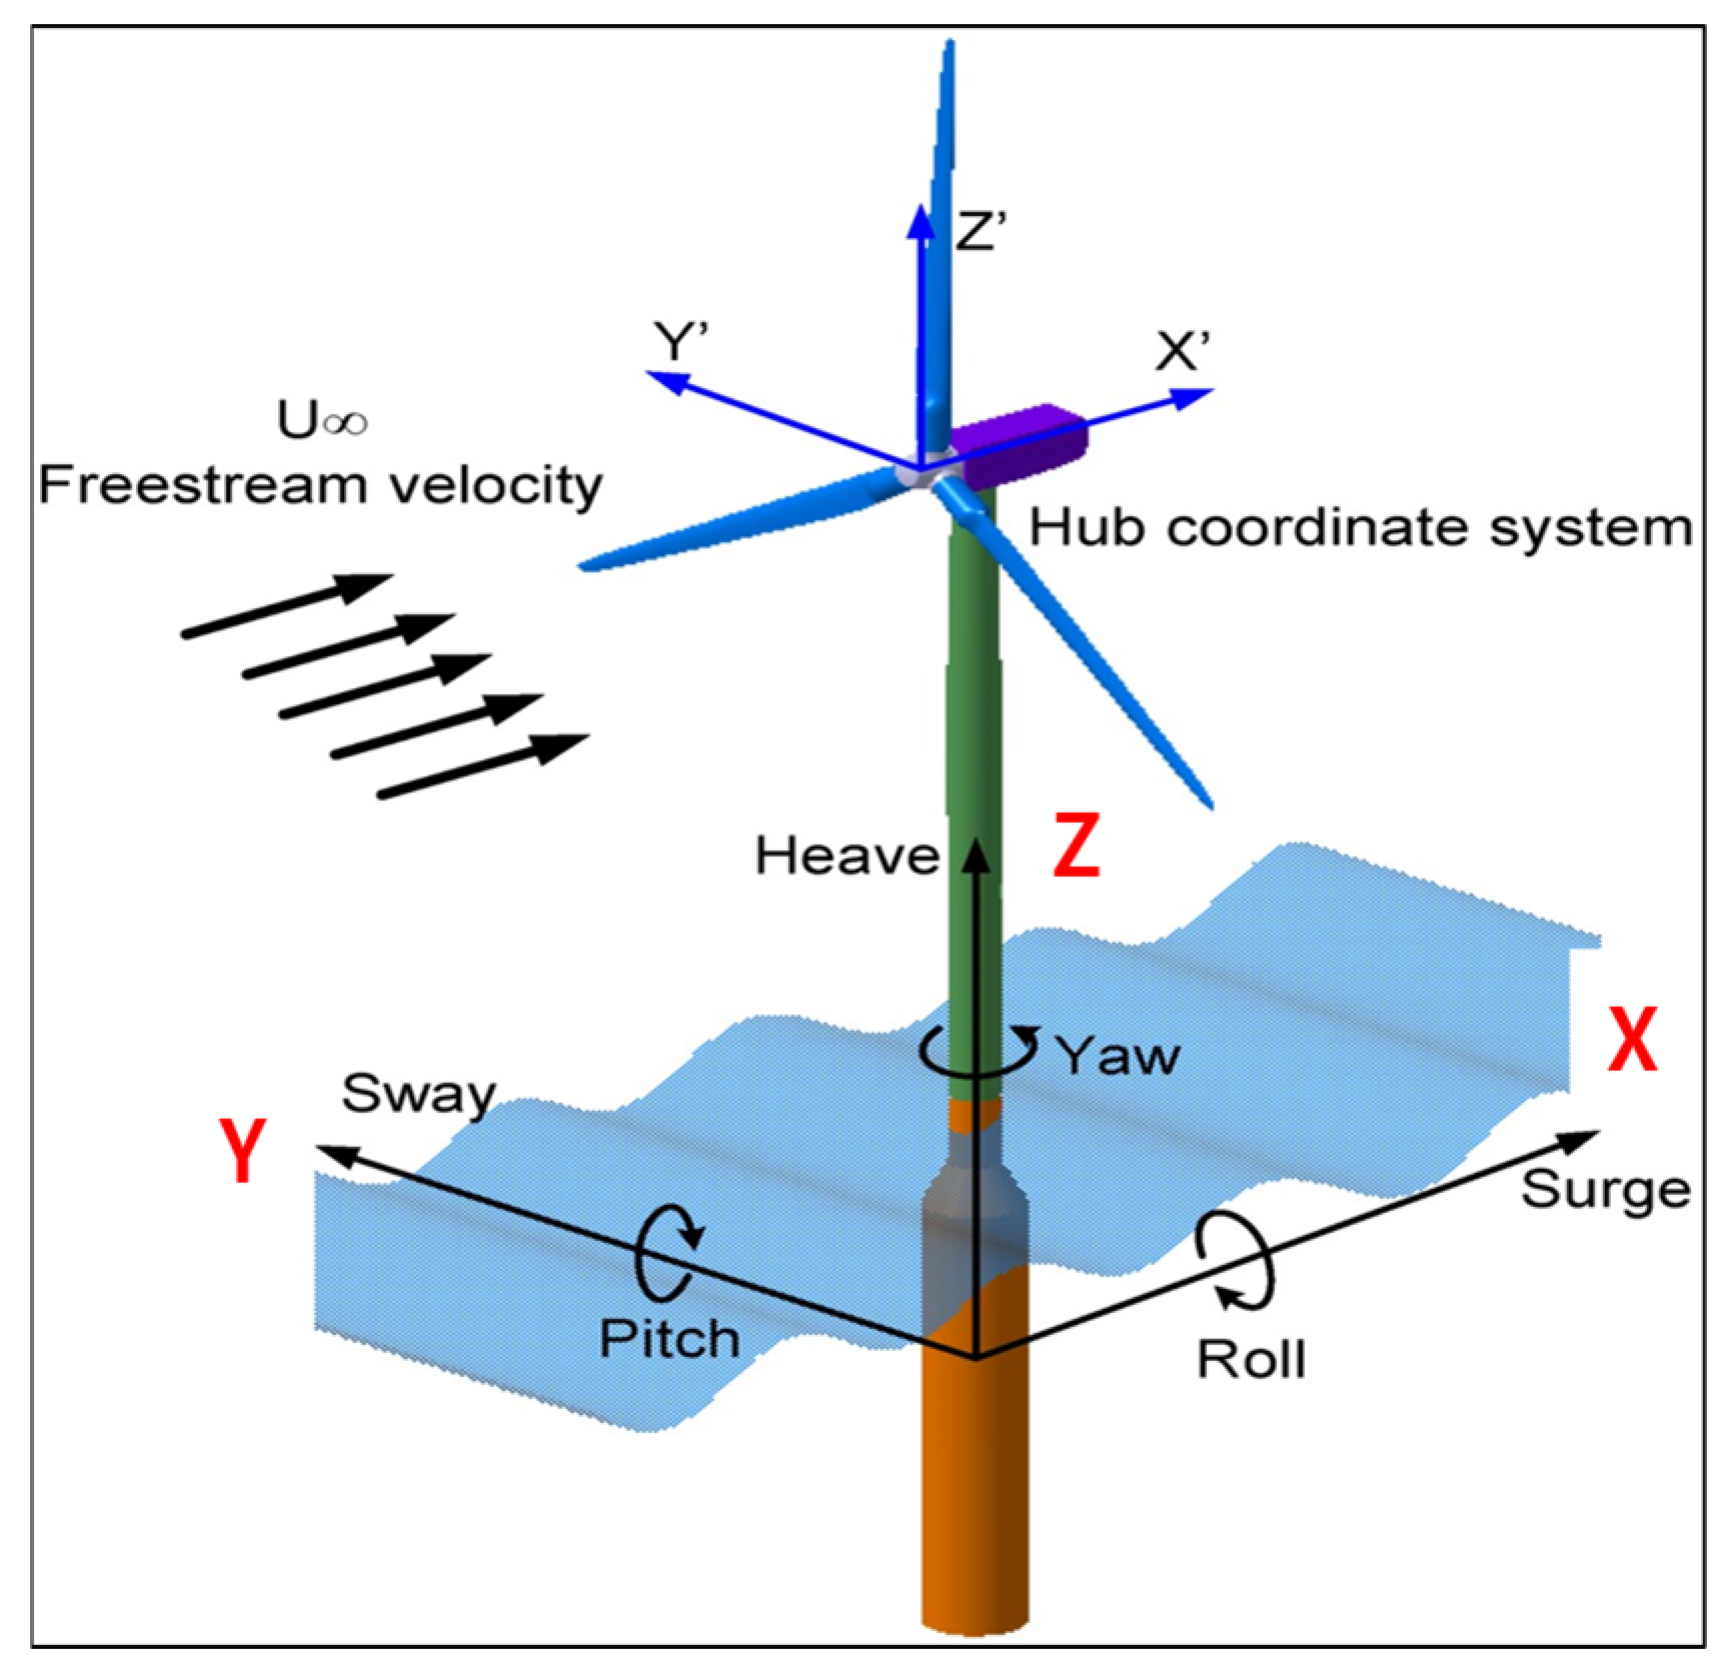
4. Fully Coupled Integrated Load Analysis

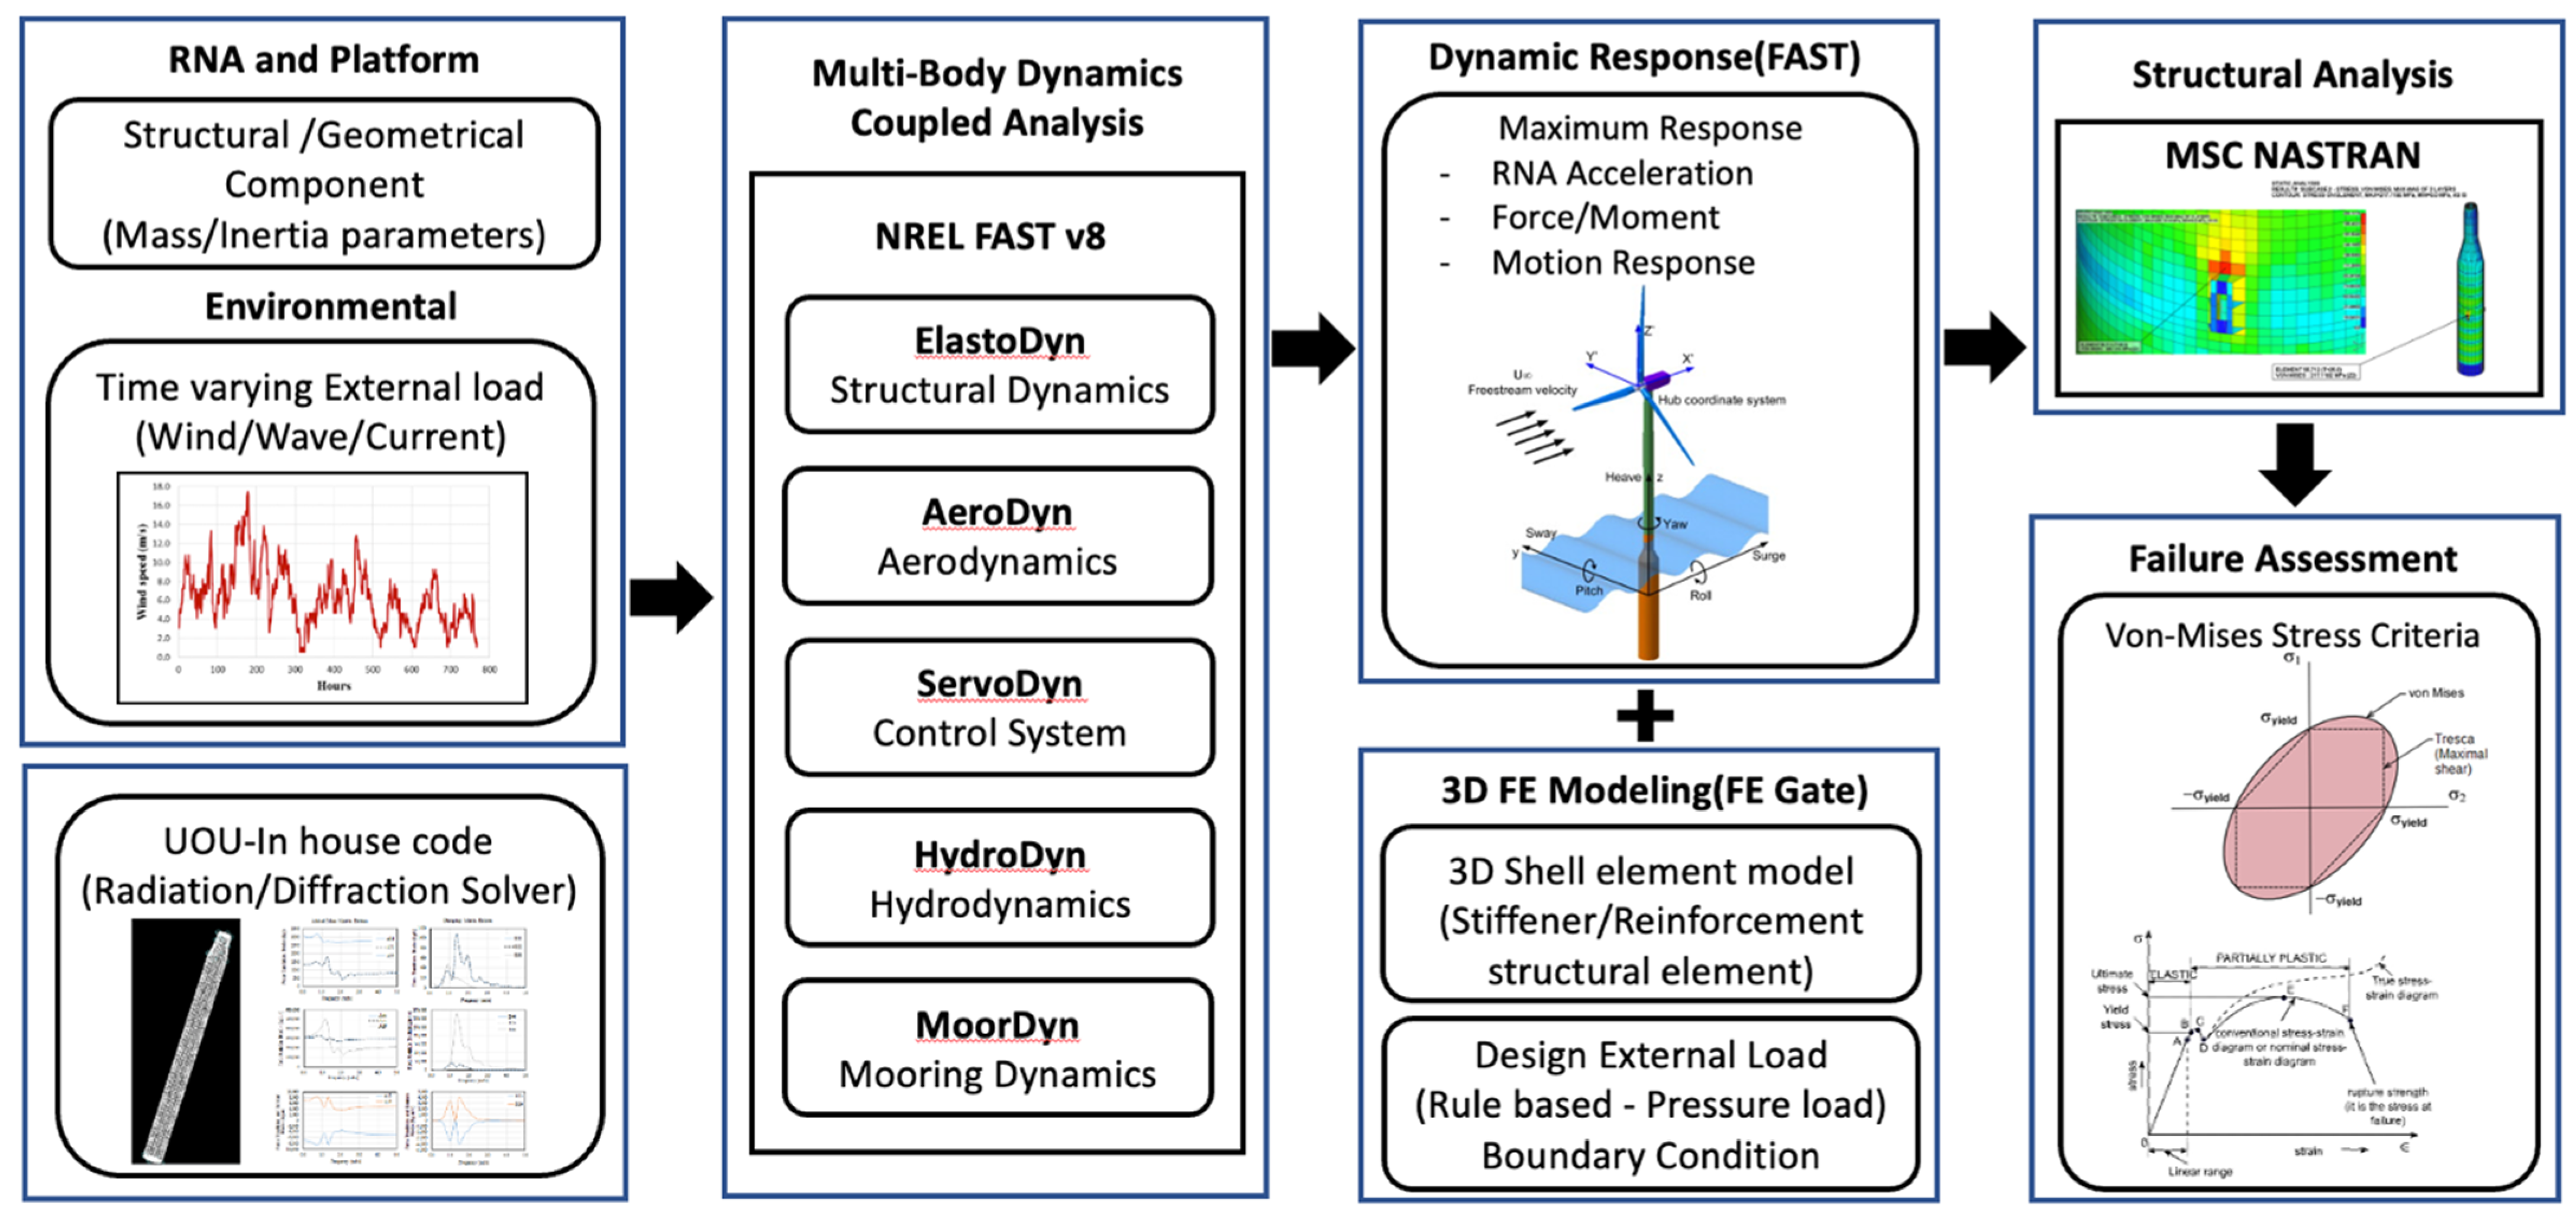
4.1. Integrated Design and Analysis Platform

Figure 6 shows the structural modeling and analysis process of the substructure for FOWT design using a fully coupled integrated load analysis. Fully coupled load analysis and integrated modeling/design were performed using NREL FAST, UOU code, FEGate, and MSC Nastran.
The numerical simulation analysis was carried out using FAST representative code to analyze floating offshore wind turbines. The FAST is open-source code developed by NREL. It is primarily used to perform complex aero-elastic analysis of three-bladed horizontal axis wind turbines (HAWTs), and the HydroDyn module was added to analyze floating offshore wind turbines [36]. In the FAST simulation, the hydrodynamic forces are calculated by adding the viscous drag of the Morison equation based on traditional potential theory. The volume and center of buoyancy under the waterline for the scaled floater were confirmed by 3D modeling, and the hydrostatic restoring coefficient was determined by the shape of the floater. The UOU in-house code solves the radiation problem and diffraction problem by using the 3D panel method for the interaction of surface waves with platform geometry through frequency domain analysis. The added mass, radiation damping, and wave excitation forces were obtained from the in-house code, and these values are used input data to the FAST fully coupled analysis of FOWT [45]. The numerical simulation of mooring lines was executed using the MoorDyn module. MoorDyn is based on a lumped-mass modeling approach that is able to capture mooring stiffness, inertia, and damping forces in the axial direction, weight and buoyancy effects, seabed contact forces, and hydrodynamic loads from mooring motion using Morison’s equation [46].
From the dynamic analysis in FAST, the following results were used for the structural analysis of the spar structure in MSC NASTRAN (FEGate); six degrees of freedom motions at COG (surge, sway, heave, roll, pitch, yaw). FEGate requires the period value as well as acceleration values directly calculated from the FAST model. The traditional and standard equations from DNVGL were used to derive the periods as mentioned in the above answer. The associated periods corresponding to the six-degrees of motion were calculated from the equation below [47].
The angular acceleration of roll motion shall be taken as Equation (1):
a r o l l = f p θ π 180 2 π T θ 2
where,
  • a 0 = acceleration parameter
  • f p = 1.0 for extreme sea loads design load scenario
  • θ = roll angle, in deg
  • T θ = roll period, in s
Inertial acceleration and period information are used as input for the FEM analysis in MSC NASTRAN (FEGate). In other words, from the FAST simulation, the dynamic response result according to the environmental load of the time varying was derived. Of these, 12 extreme value conditions were extracted for the structural analysis conditions. We used inertial acceleration directly from FAST which was input information for the FEM analysis. As a conservative approach, we also applied the direction of the environmental condition such as wind, wave, and current in which the extreme value occurs was also considered.
In the structural analysis, 3D shell elements were used for the plates and reinforcements such as stiffeners and girders. From the structural analysis, the failure assessment was performed according to the von Mises stress criteria.

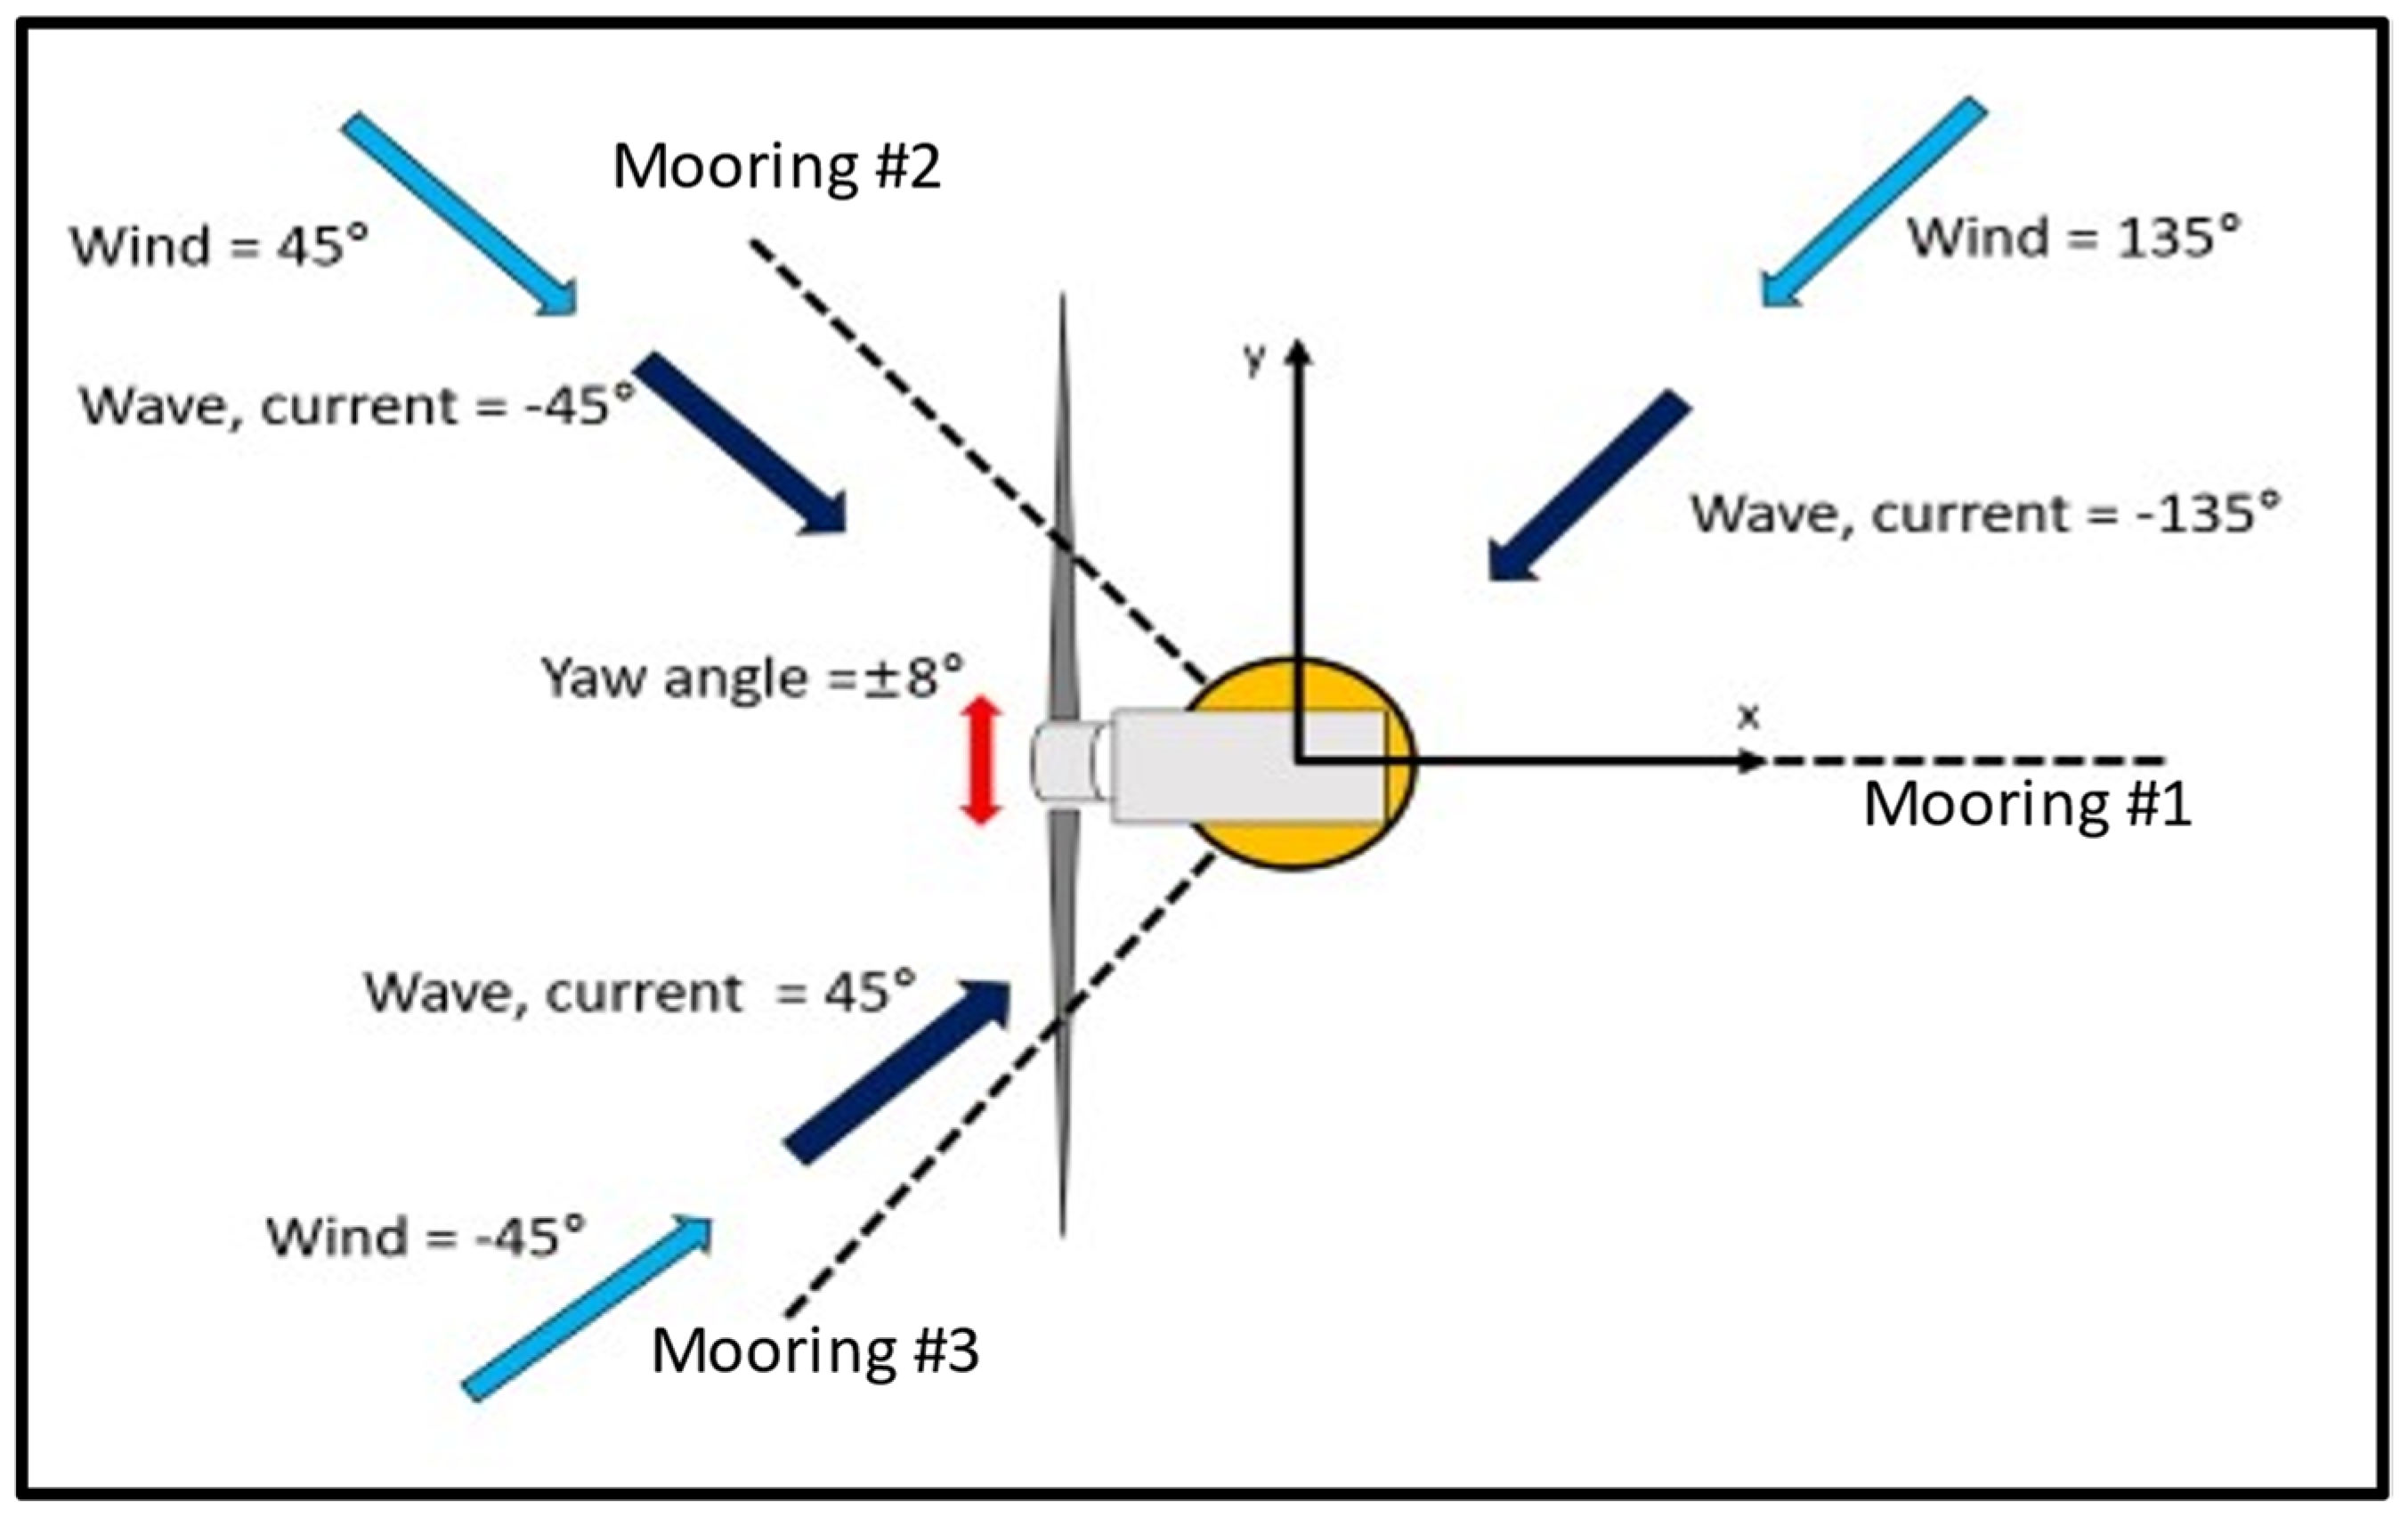
4.2. Dynamic Load Case (DLC)

DLC 6.1 was selected for the ultimate limit analysis of the FOWT under extreme environmental conditions [48]. Table 6 shows the summary of the simulation configuration for DLC 6.1.
Dynamic simulations for leveraging structural analysis models are commonly used to calculate wind turbine loading effects. In these cases, the total duration of the loading data should be long enough to ensure statistical reliability of the estimate of the characteristic loading effect. In general, continuous 1 h periods are required for each mean, hub height wind speed, and sea condition considered in the simulation [43]. In this study, each load case consisted of three random seeds of 1 h per simulation to conservatively approach the spectral gap of the wave at low frequencies, which is the low natural frequency of the floating substructure. Moreover, a 3D Kaimal turbulence model with six turbulence fields across all simulations and the wind gradient value of 0.11 was used. Extreme sea state with irregular waves was defined using the Jonswap spectrum. The load safety factor of 1.35 was considered for the load calculation. According to the wind rose previously shown in Figure 5, the environmental loads were applied in three main directions (45°, 135°, and 315°) as shown in Figure 7, and simulated under co-direction conditions by using FAST, an integrated analysis open software by NREL, coupled with the in-house hydrodynamic code developed by the University of Ulsan (Ulsan, Korea).

5. 3D Finite Element Modeling and Structural Analysis of a Spar-Type Substructure

Based on the conceptual layout, the 3D finite element model of the spar-type substructure was constructed with the aid of CATIA (CAD Modeler) and FEGate (FEM Pre/Post Processor) software and later numerically analyzed by MSC Nastran, a commercially available finite element analysis software [49,50,51]. All structural elements of the substructure were checked for compliance with the requirements of equivalent stress criteria in accordance with DNVGS-ST-0119 [24]. The individual design stress components and von Mises equivalent design stresses of the structure should not be greater than the design resistance considering the safety factors through linear elastic analysis [52].

5.1. 3D Finite Element Model

Finite element modeling was constructed as close as possible to the conceptual layout and basic specification of the spar-type substructure, and all structural components of the floater such as the shell, decks, girders, and reinforced stiffeners are modeled as shell elements. The mesh sizes of the rectangular and triangular shell elements are both set to less than 500 mm × 500 mm. Among the upper part of the FOWT, the RNA component was modeled as the lumped mass element to the center of gravity of the RNA, and the tower component was modeled as shell elements for the wind load application. Figure 8 shows the 3D finite element model of a spar structure. This approach has been used in several studies available in the literature and is in accordance with the DNV-RP-C208 [53].
Most shell and reinforcement plates consisting of the spar structure were constructed with the mild steel of grade A and the high tensile steel AH36/DH36 was especially used at the high-stress region such as the mooring fairleads. The corresponding material properties of plates considering the safety factor were listed in Table 7. According to the ABS MODU, the safety factor of 1.43 was used for the static loading analysis [54].
The bolted connection between the tower bottom flange and the TP (transition piece) mounted on the spar substructure was also constructed in the FE model, where the bolts were modeled in three different ways to check the sensitivity of bolted connection depending on the element types. Figure 9 shows three different modeling approaches for the bolted connection: RBE3 elements, the combination of RBE3 and beam elements, and solid elements. The flange was also modeled as either a shell element or solid element. The high strength bolt with the grade of 10.9 was used according to ISO 898-1 and the corresponding material property is listed in Table 8 [55].
The three-dimensional (3D) structural finite element (FE) model also incorporated the three mooring lines with the fixed boundary conditions at the end of the mooring lines. The basic shape of the mooring fairlead foundation was modeled and applied to the FE analysis using MPC (multi-point constraint. The external loads such as the structural loads due to the inertial acceleration, buoyance, and gravity, and the environmental loads due to the wind, wave, and current will be explained in the next section.

5.2. Structural Analysis Case

Based on the dynamic responses calculated from FAST coupled with UOU code, 12 cases with the maximum values were selected for the structural analysis of the spar substructure as listed in Table 9. Each analysis cases contain all the external loadings such as dynamic inertia loads from DLC 6.1, gravity-induced loads due to structural weights, buoyance, ballast, and environmental loads from wind, wave, and current.

5.3. External Loadings

Figure 10 shows the typical dynamic response with six degrees of freedom (surge, sway, heave, roll, pitch, and yaw). Calculated from the fully coupled integrated load analysis.

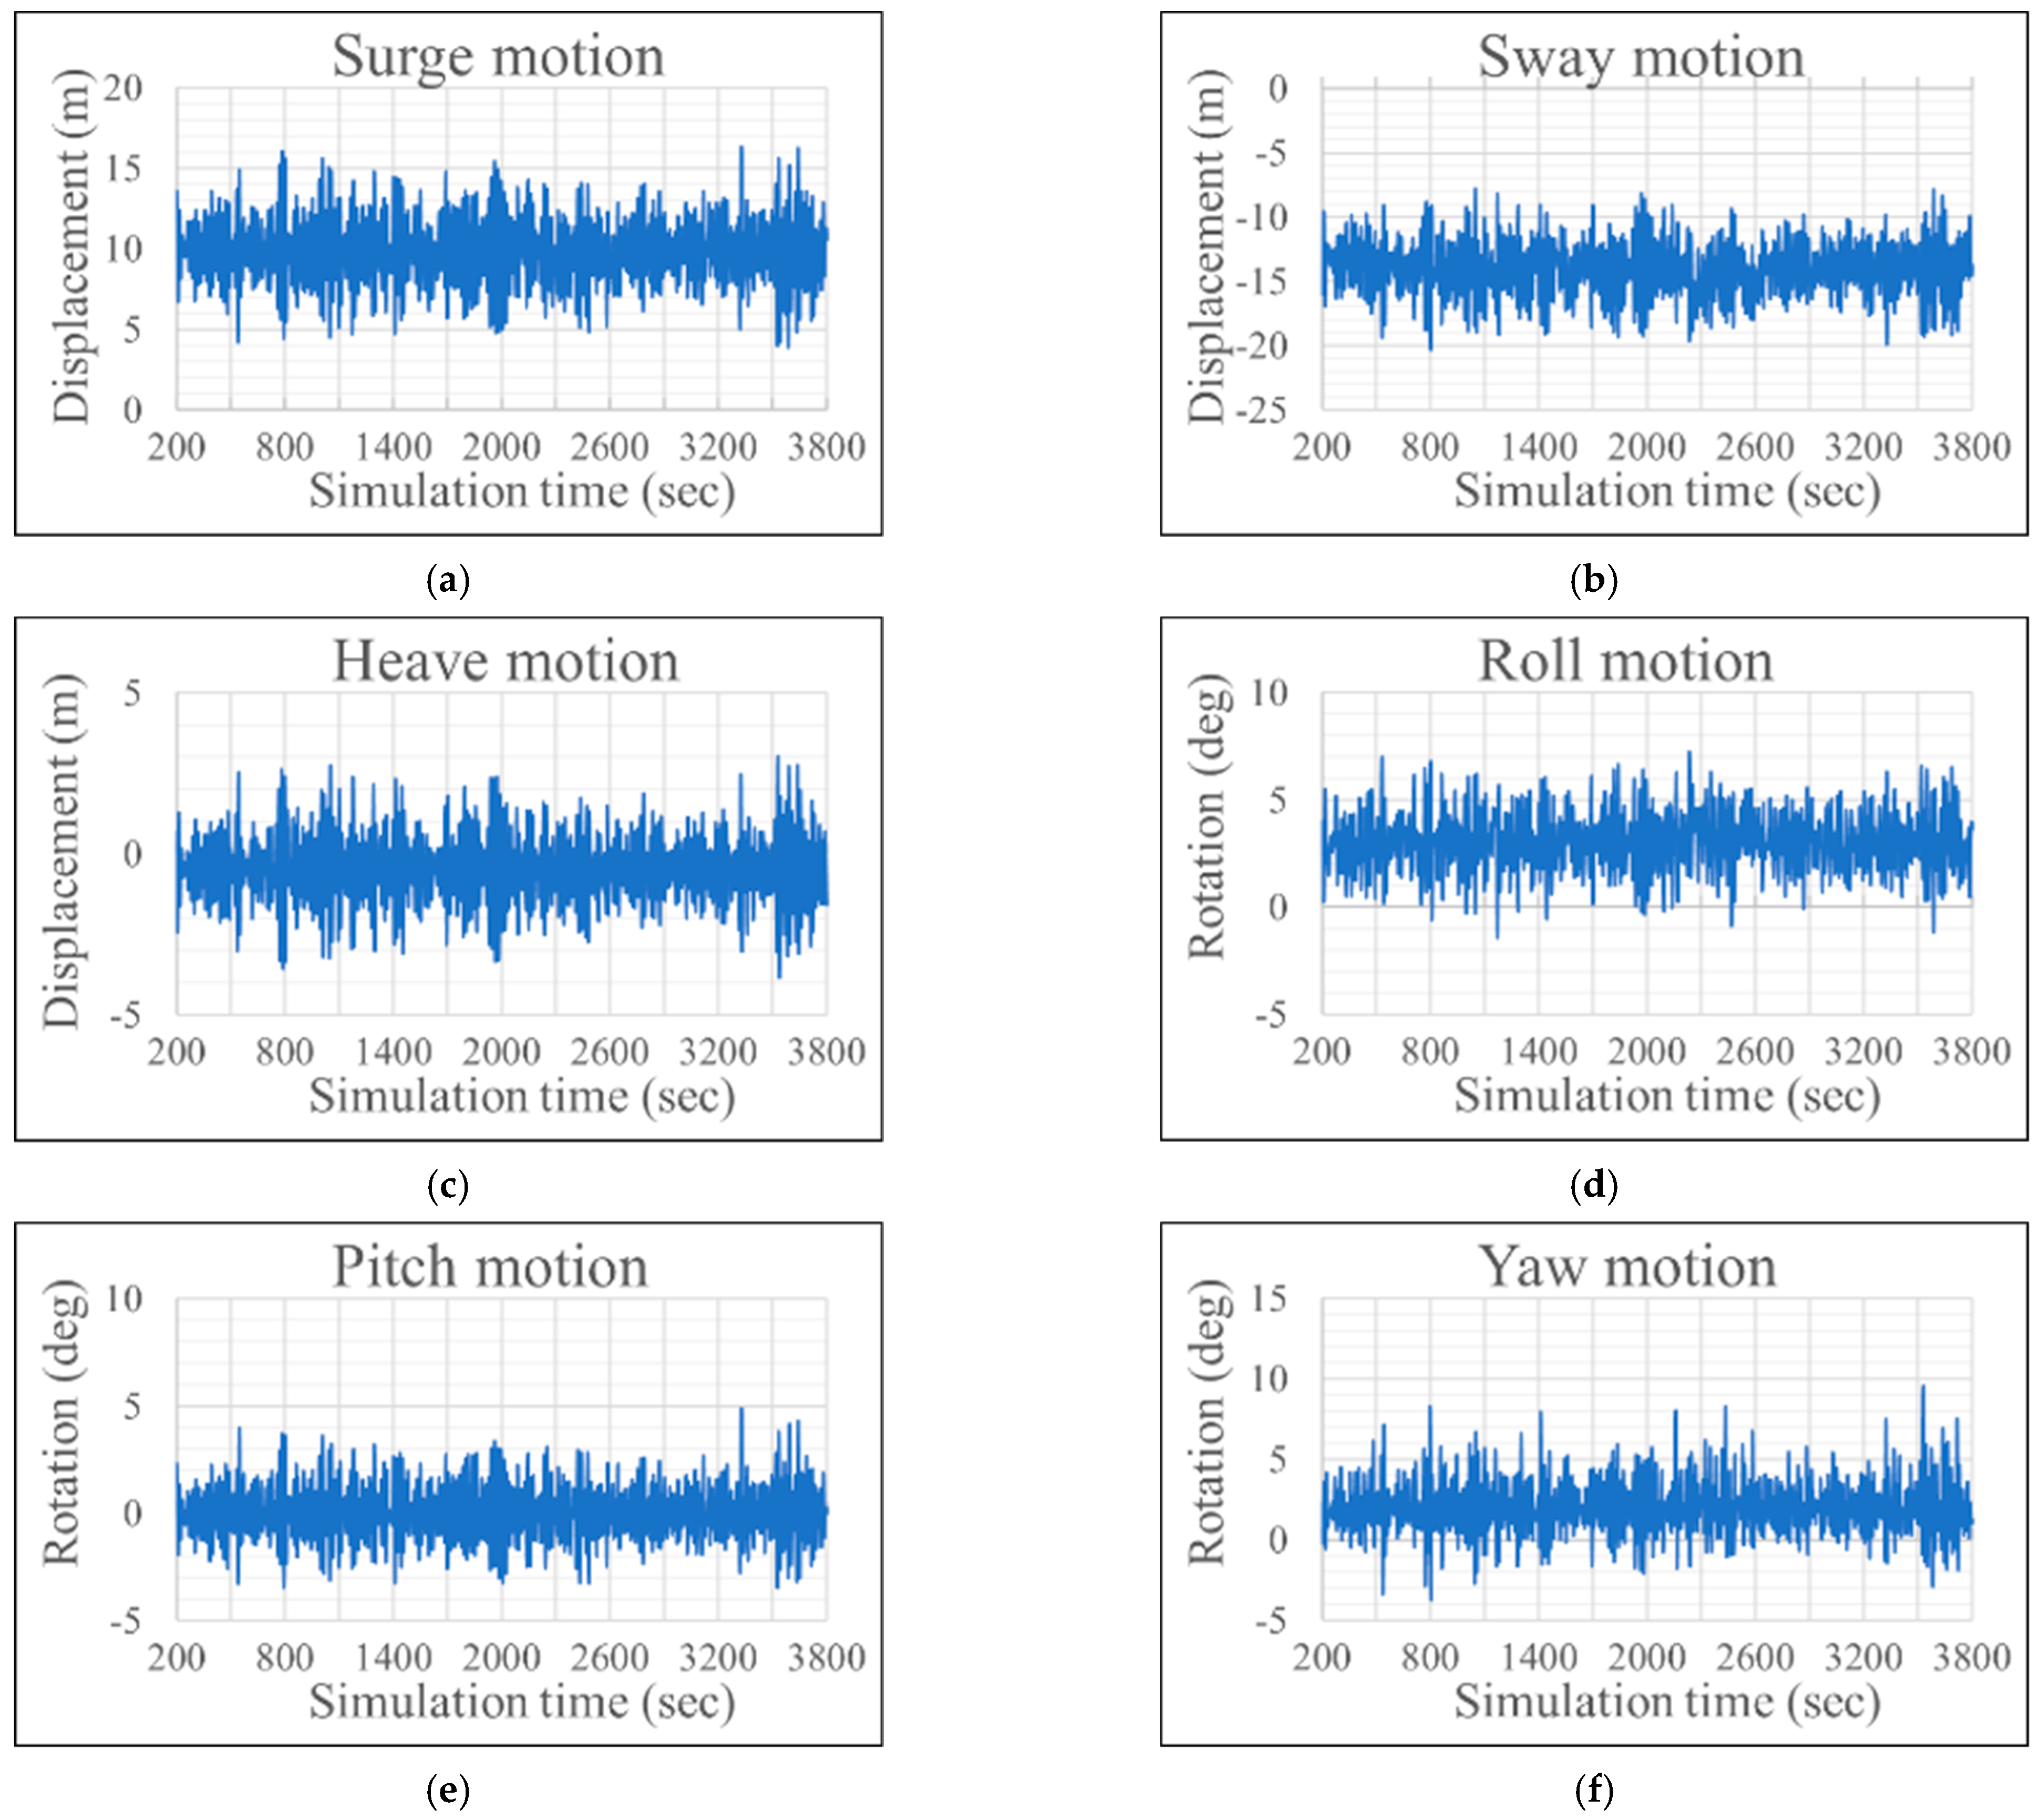
5.3.1. Dynamic Response from the DLC 6.1

A one-hour simulation for the LC06 case, for example, is shown in Figure 11. As shown in Figure 11, all dynamic response results from the integrated load analysis are listed in Table 10, which were then applied to the FE model of the spar structure as the converted inertial acceleration values based on the periods.

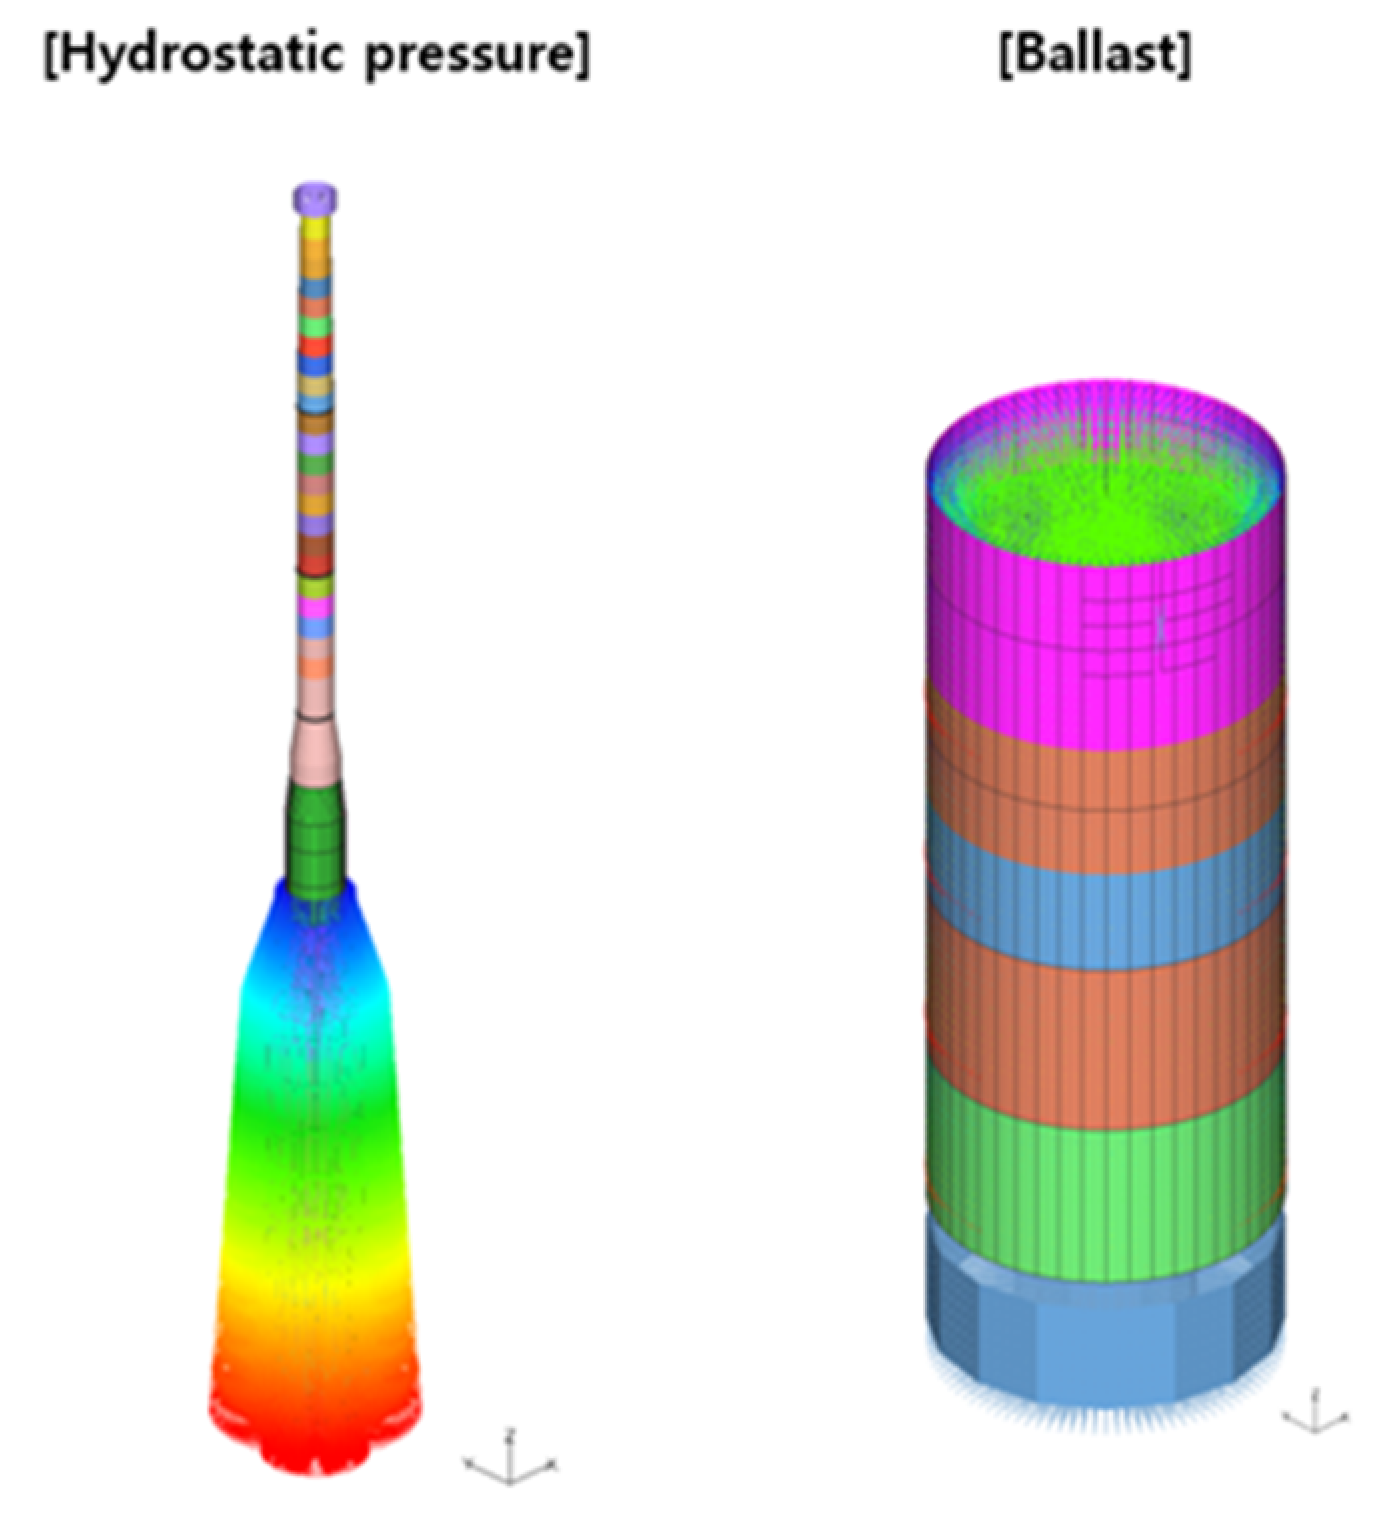
5.3.2. Structural Loads
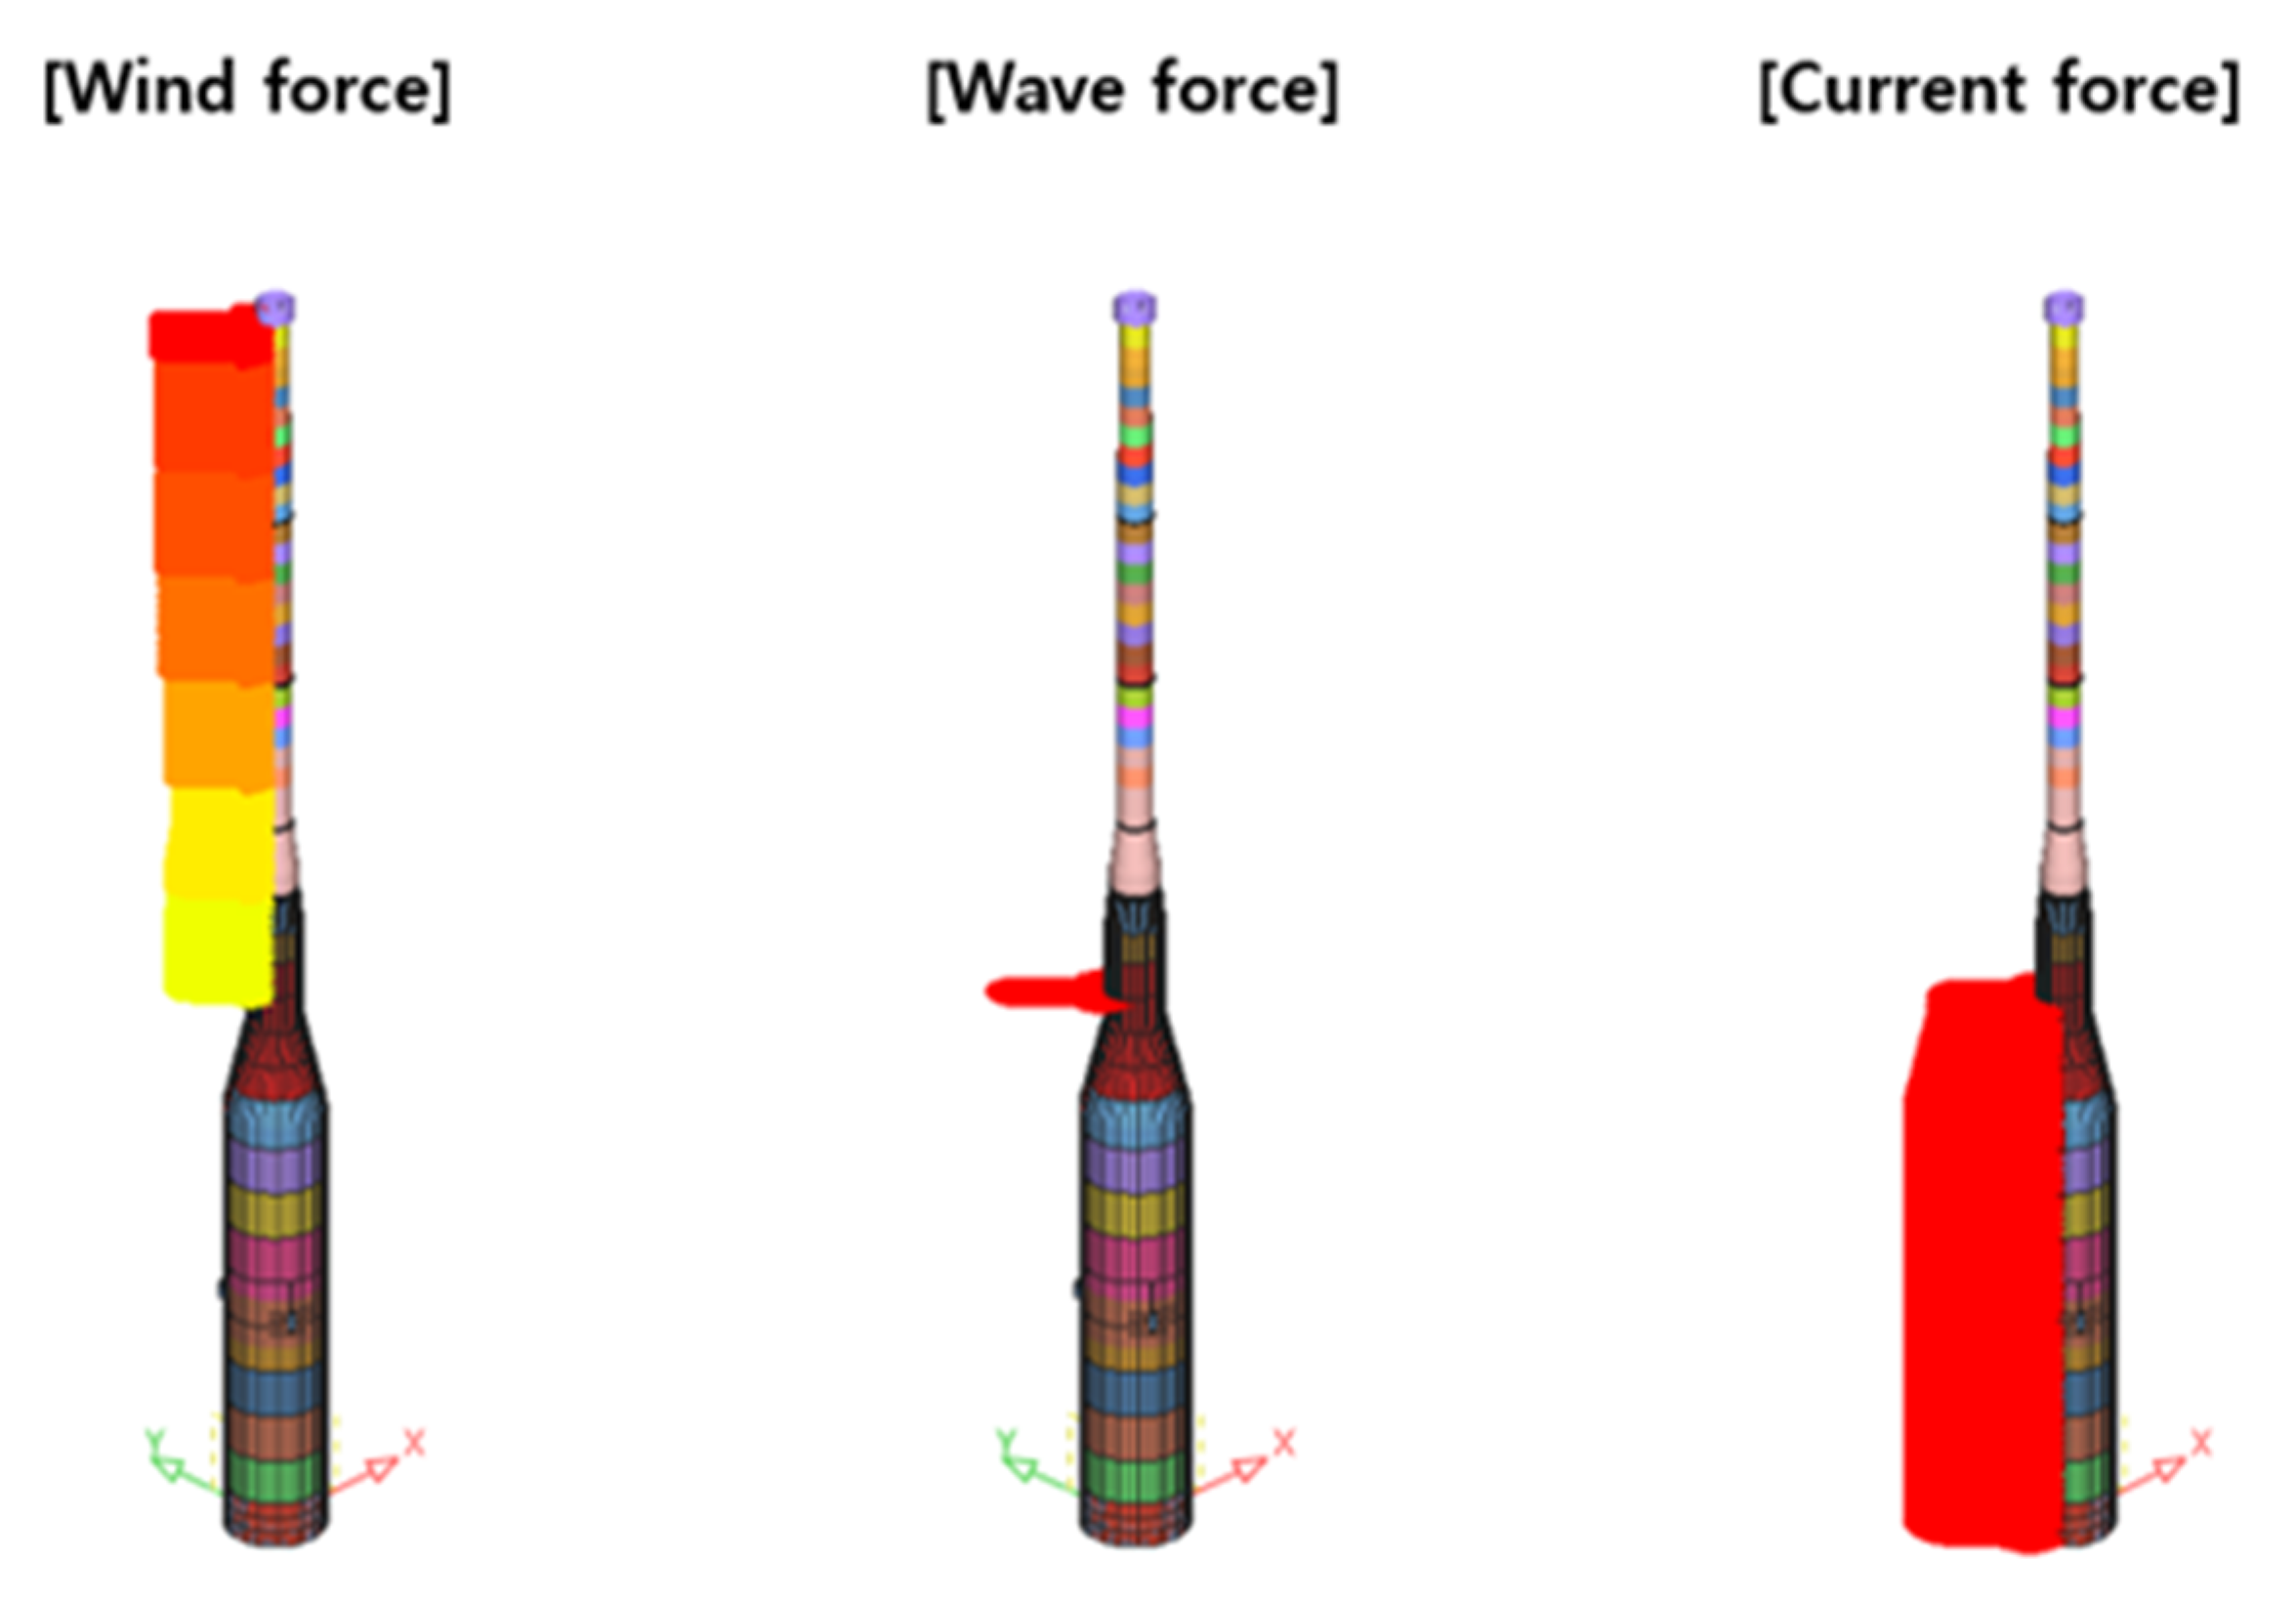
The structural mass information applied to the finite element model is listed in Table 11. The structure weight corresponding to 2316 tons was properly distributed to the entire elements through FE modeling and a buoyancy of 9338 tons is applied as a hydrostatic pressure load to the FE modeling. Moreover, the concrete ballasts were modeled as beam elements with masses and added to the center of gravity of the permanent ballast tank. Figure 12 shows the hydrostatic pressure as a buoyance loading of 9338.12 tons and pressure loading due to the water ballast loading of 3558.10 tons applied to the substructure.

5.3.3. Wind Force

The wind force was calculated from the Equation (2) according to the standards of ABS-MODU.
P = f · V k 2 · C h · C s
where,
  • f = 0.611
  • V k = wind velocity (m/s)
  • C h = height coefficient (according to th height, 1.48)
  • C s = shape coefficeint (cylindrical shapes, 0.5)
The design load is listed in Table 12. In the calculation of wind pressure (P), the shape and vertical height are to be subdivided approximately in accordance with the values of references. A total wind force of 27.77 tons is applied to the FE model, according to the shapes and vertical height of FOWT.

5.3.4. Wave Load

The wave load was calculated from the Equation (3) based on DNV-RP-H103 [57].
F w d = 1 / 8 · ρ w · g · R 2 · B · H s 2
where,
  • ρ w = density of sea water (1025 kg/m3)
  • g = gravity acceleration (9.81 m/s2)
  • H s = significant wave height (m)
  • B = breath of towed object (m)
The calculated design load was summarized in Table 13. A wave force of 159.41 tons was applied to the FE model at a determined angle notated in each load case.

5.3.5. Current Load

The current force was calculated from Equation (4) according to the ABS-MODU standards.
F D = C / 2 · D · C D · u n · u n
where,
  • C = 1.025
  • D = projected width (m)
  • C D = drag coefficeint
  • u n = componenet of the velocity vector (m/s)
The drag coefficient is taken 0.62 as references recommended. The current velocity was calculated of average value as the vertical height of the floater. A current force of 23.366 tons is applied to the FE model; it would be drag force for the structure as listed in Table 14.
Figure 13 shows the visualization of the load distribution applied to the FE model of the spar structure from the environmental loads such as wind, wave, and current.

5.4. Failure Assessment

The structural strength of the spar-type substructure was numerically analyzed by considering all external loadings such as inertia due to dynamic motions, gravitation forces due to weights, wind force, wave force, and current force under extreme conditions in the East Sea in Korea. The linear static analyses of about 12 cases were performed with MSC Nastran, a commercially available finite element analysis software, and the calculated design stress components of the structure were investigated according to the von Mises criteria.

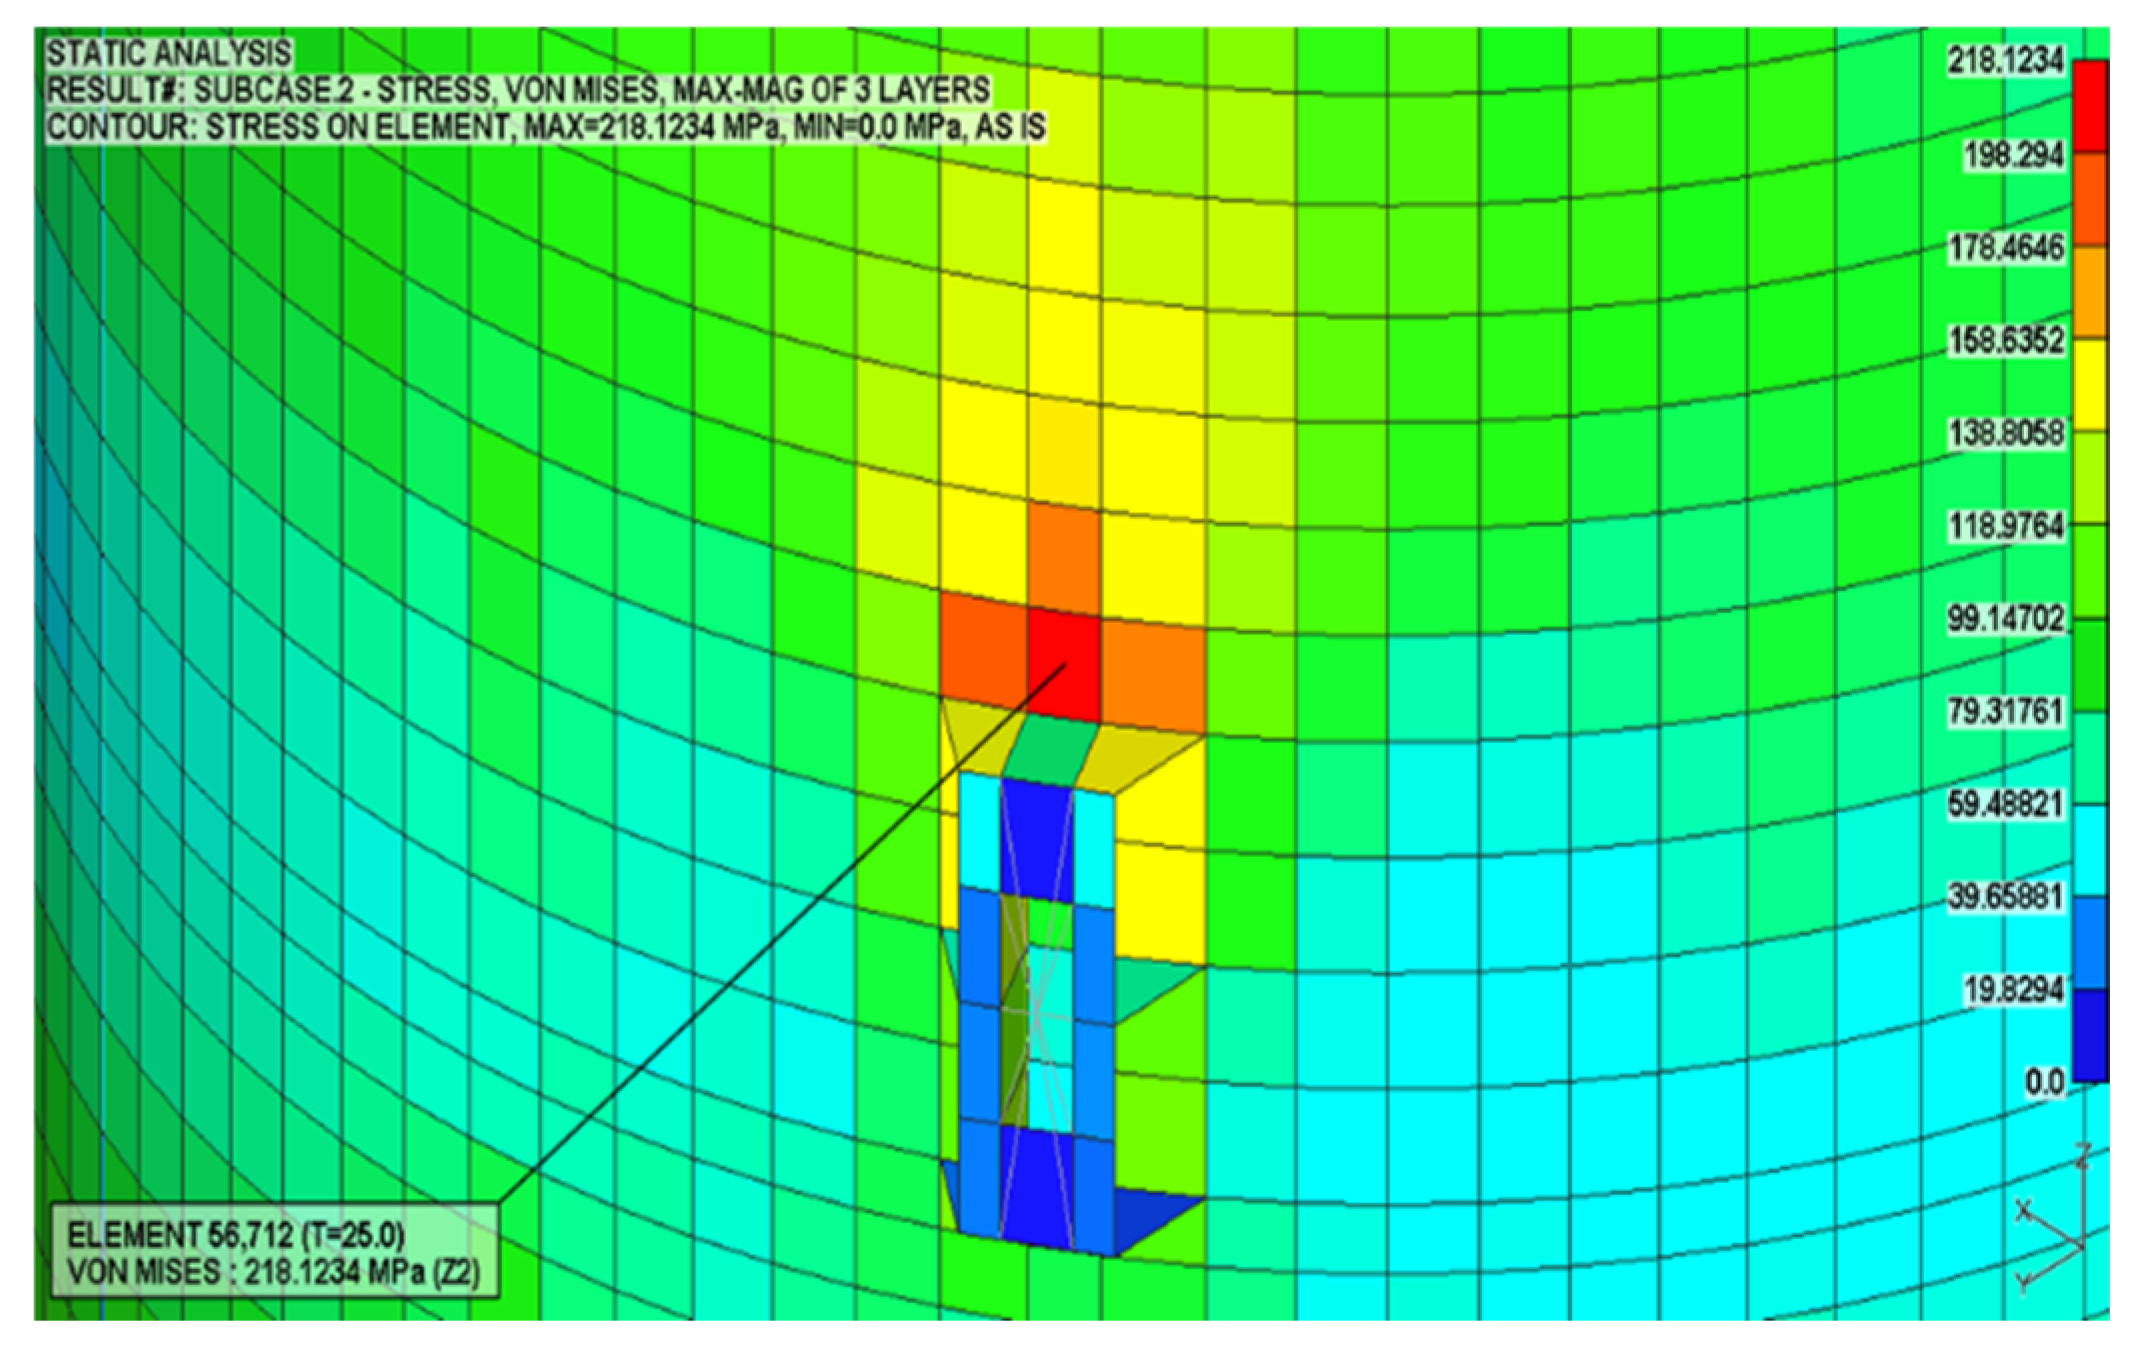
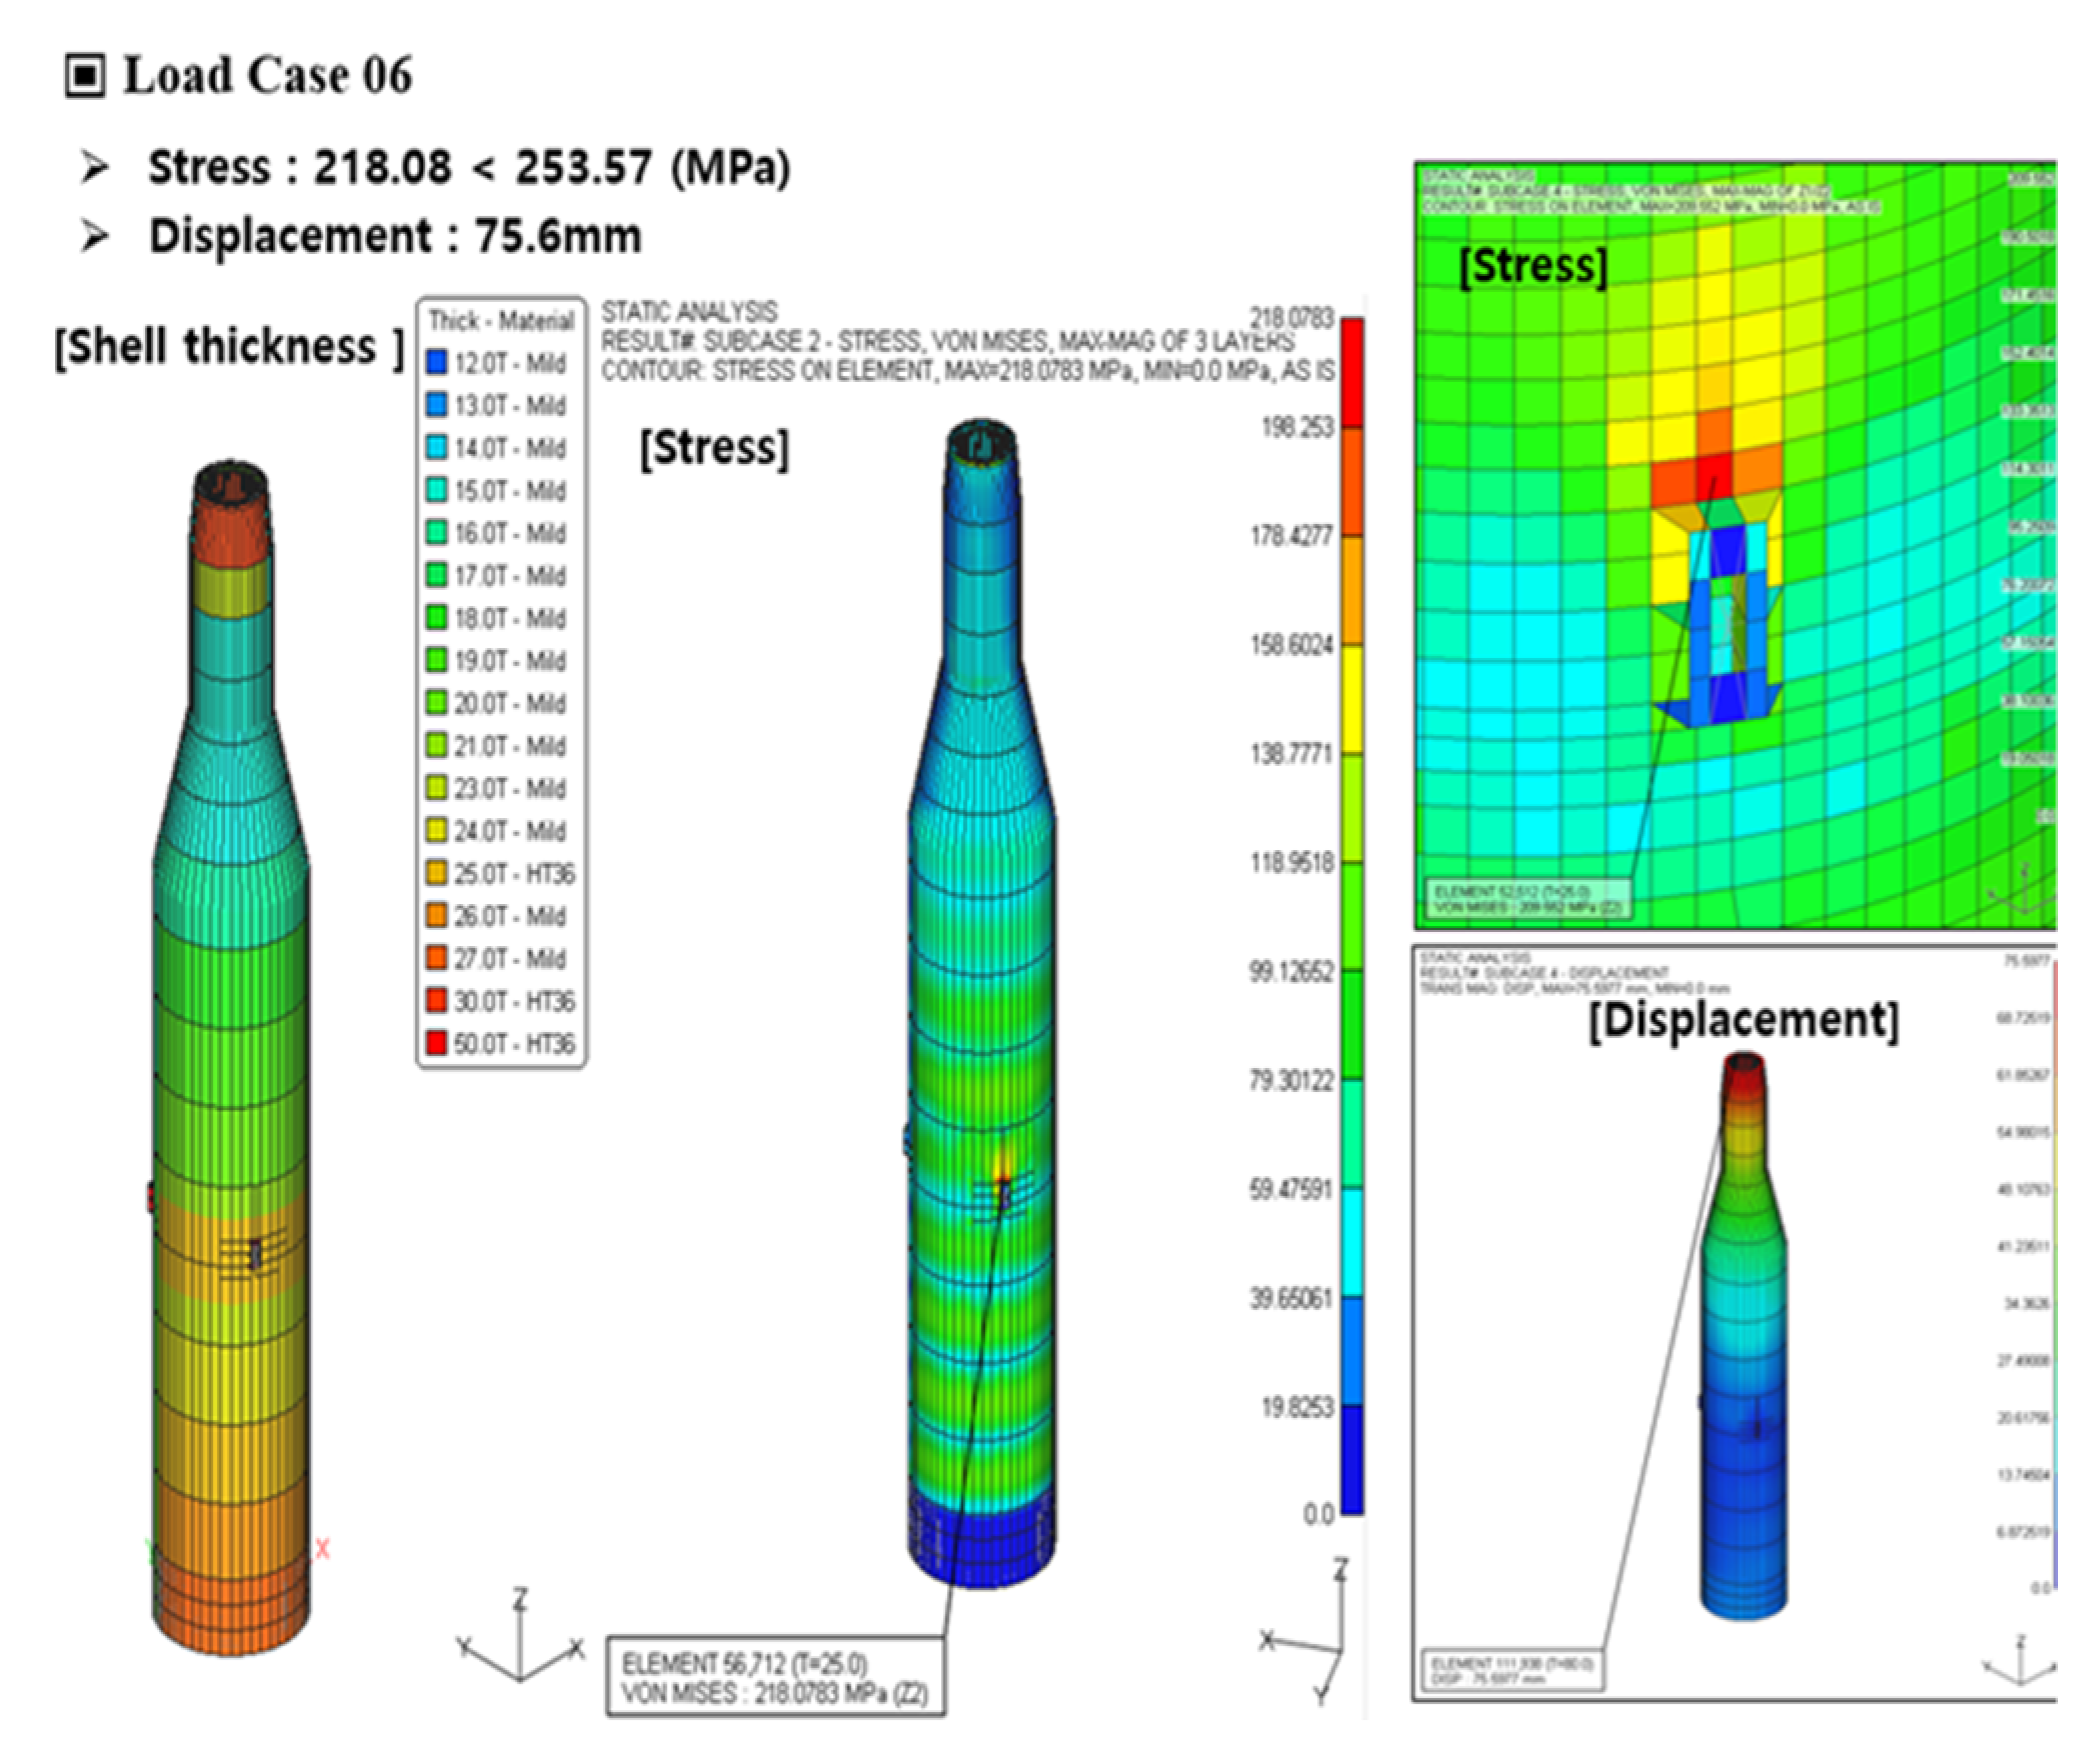
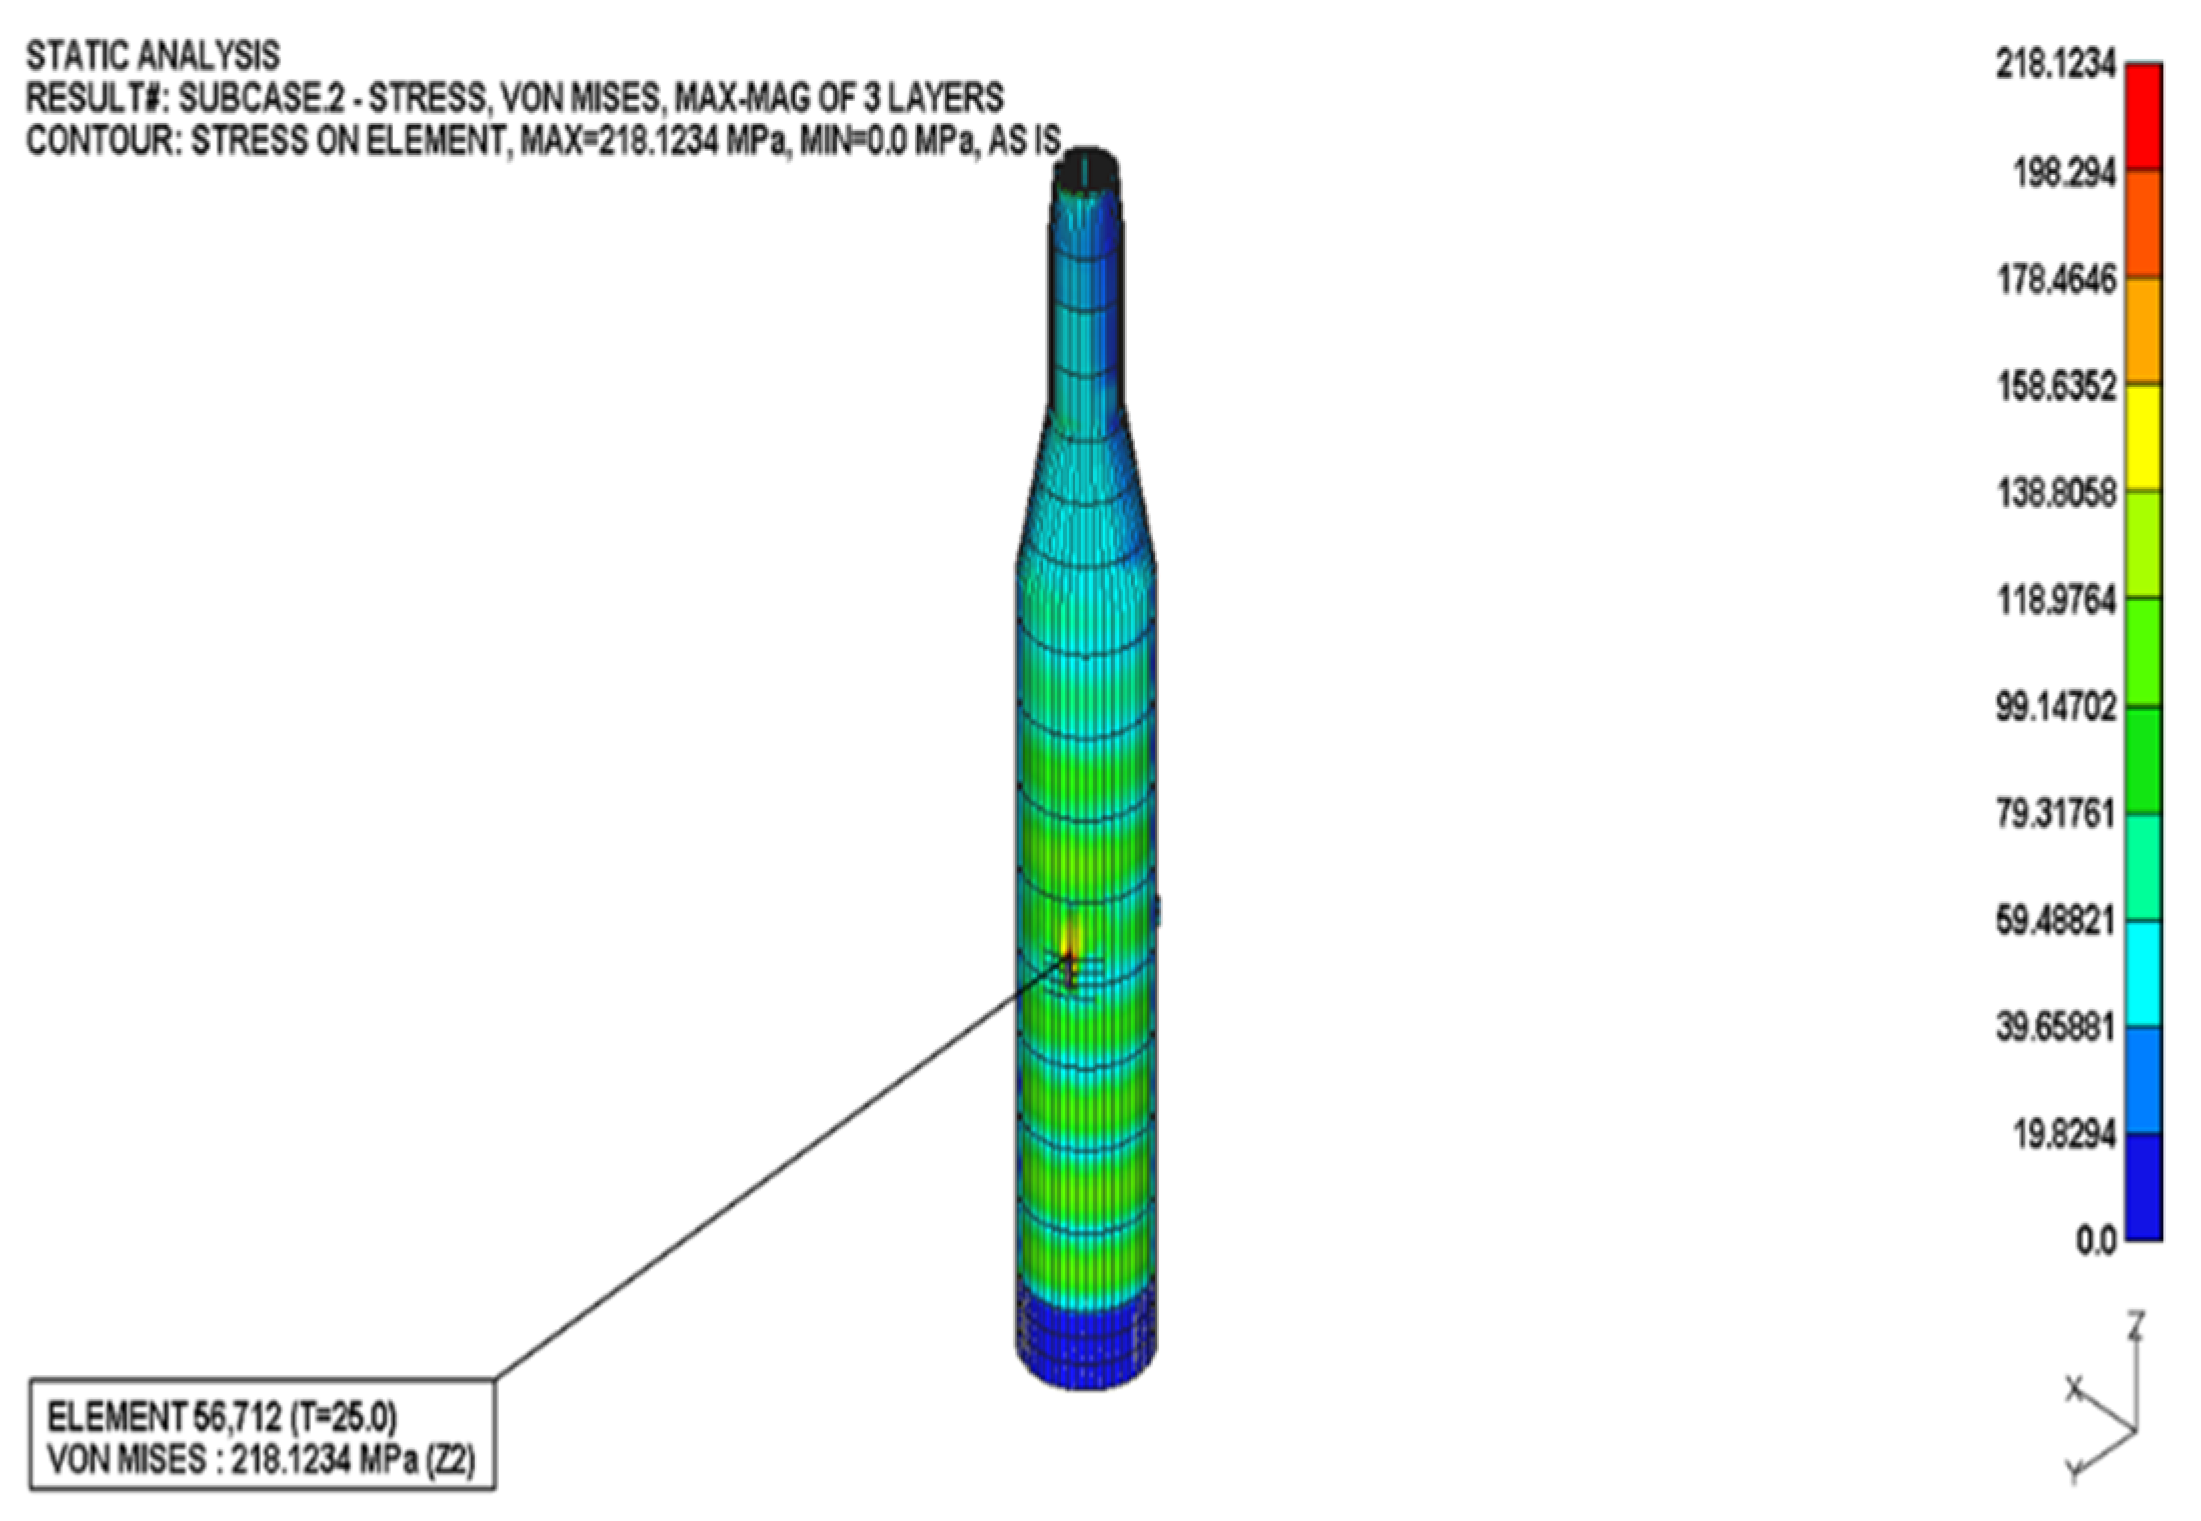
5.4.1. Stresses from the Substructure Platform

Figure 14, Figure 15 and Figure 16 show that the maximum equivalent stress of 218.08 MPa occurred at the mooring fairlead point from the analysis case 6, which was the reason to apply the high tensile steel AH36/DH36 grade specifically to the fairlead parts. In addition, other structures can be seen where all stresses of shell element mesh of structure are less than the allowable stress of the mild steel A grade. Because all the maximum equivalent stresses (von Mises stresses) from 12 load cases are less than the allowable stress, it can be addressed that the spar-type substructure for the 5 MW floating offshore wind turbine has enough strength to endure extreme conditions. The results showed that the von Mises stresses of the plates including fairlead points on the 12 analysis cases were under the allowable stress (253.57 MPa) of the plate as shown in Table 15.

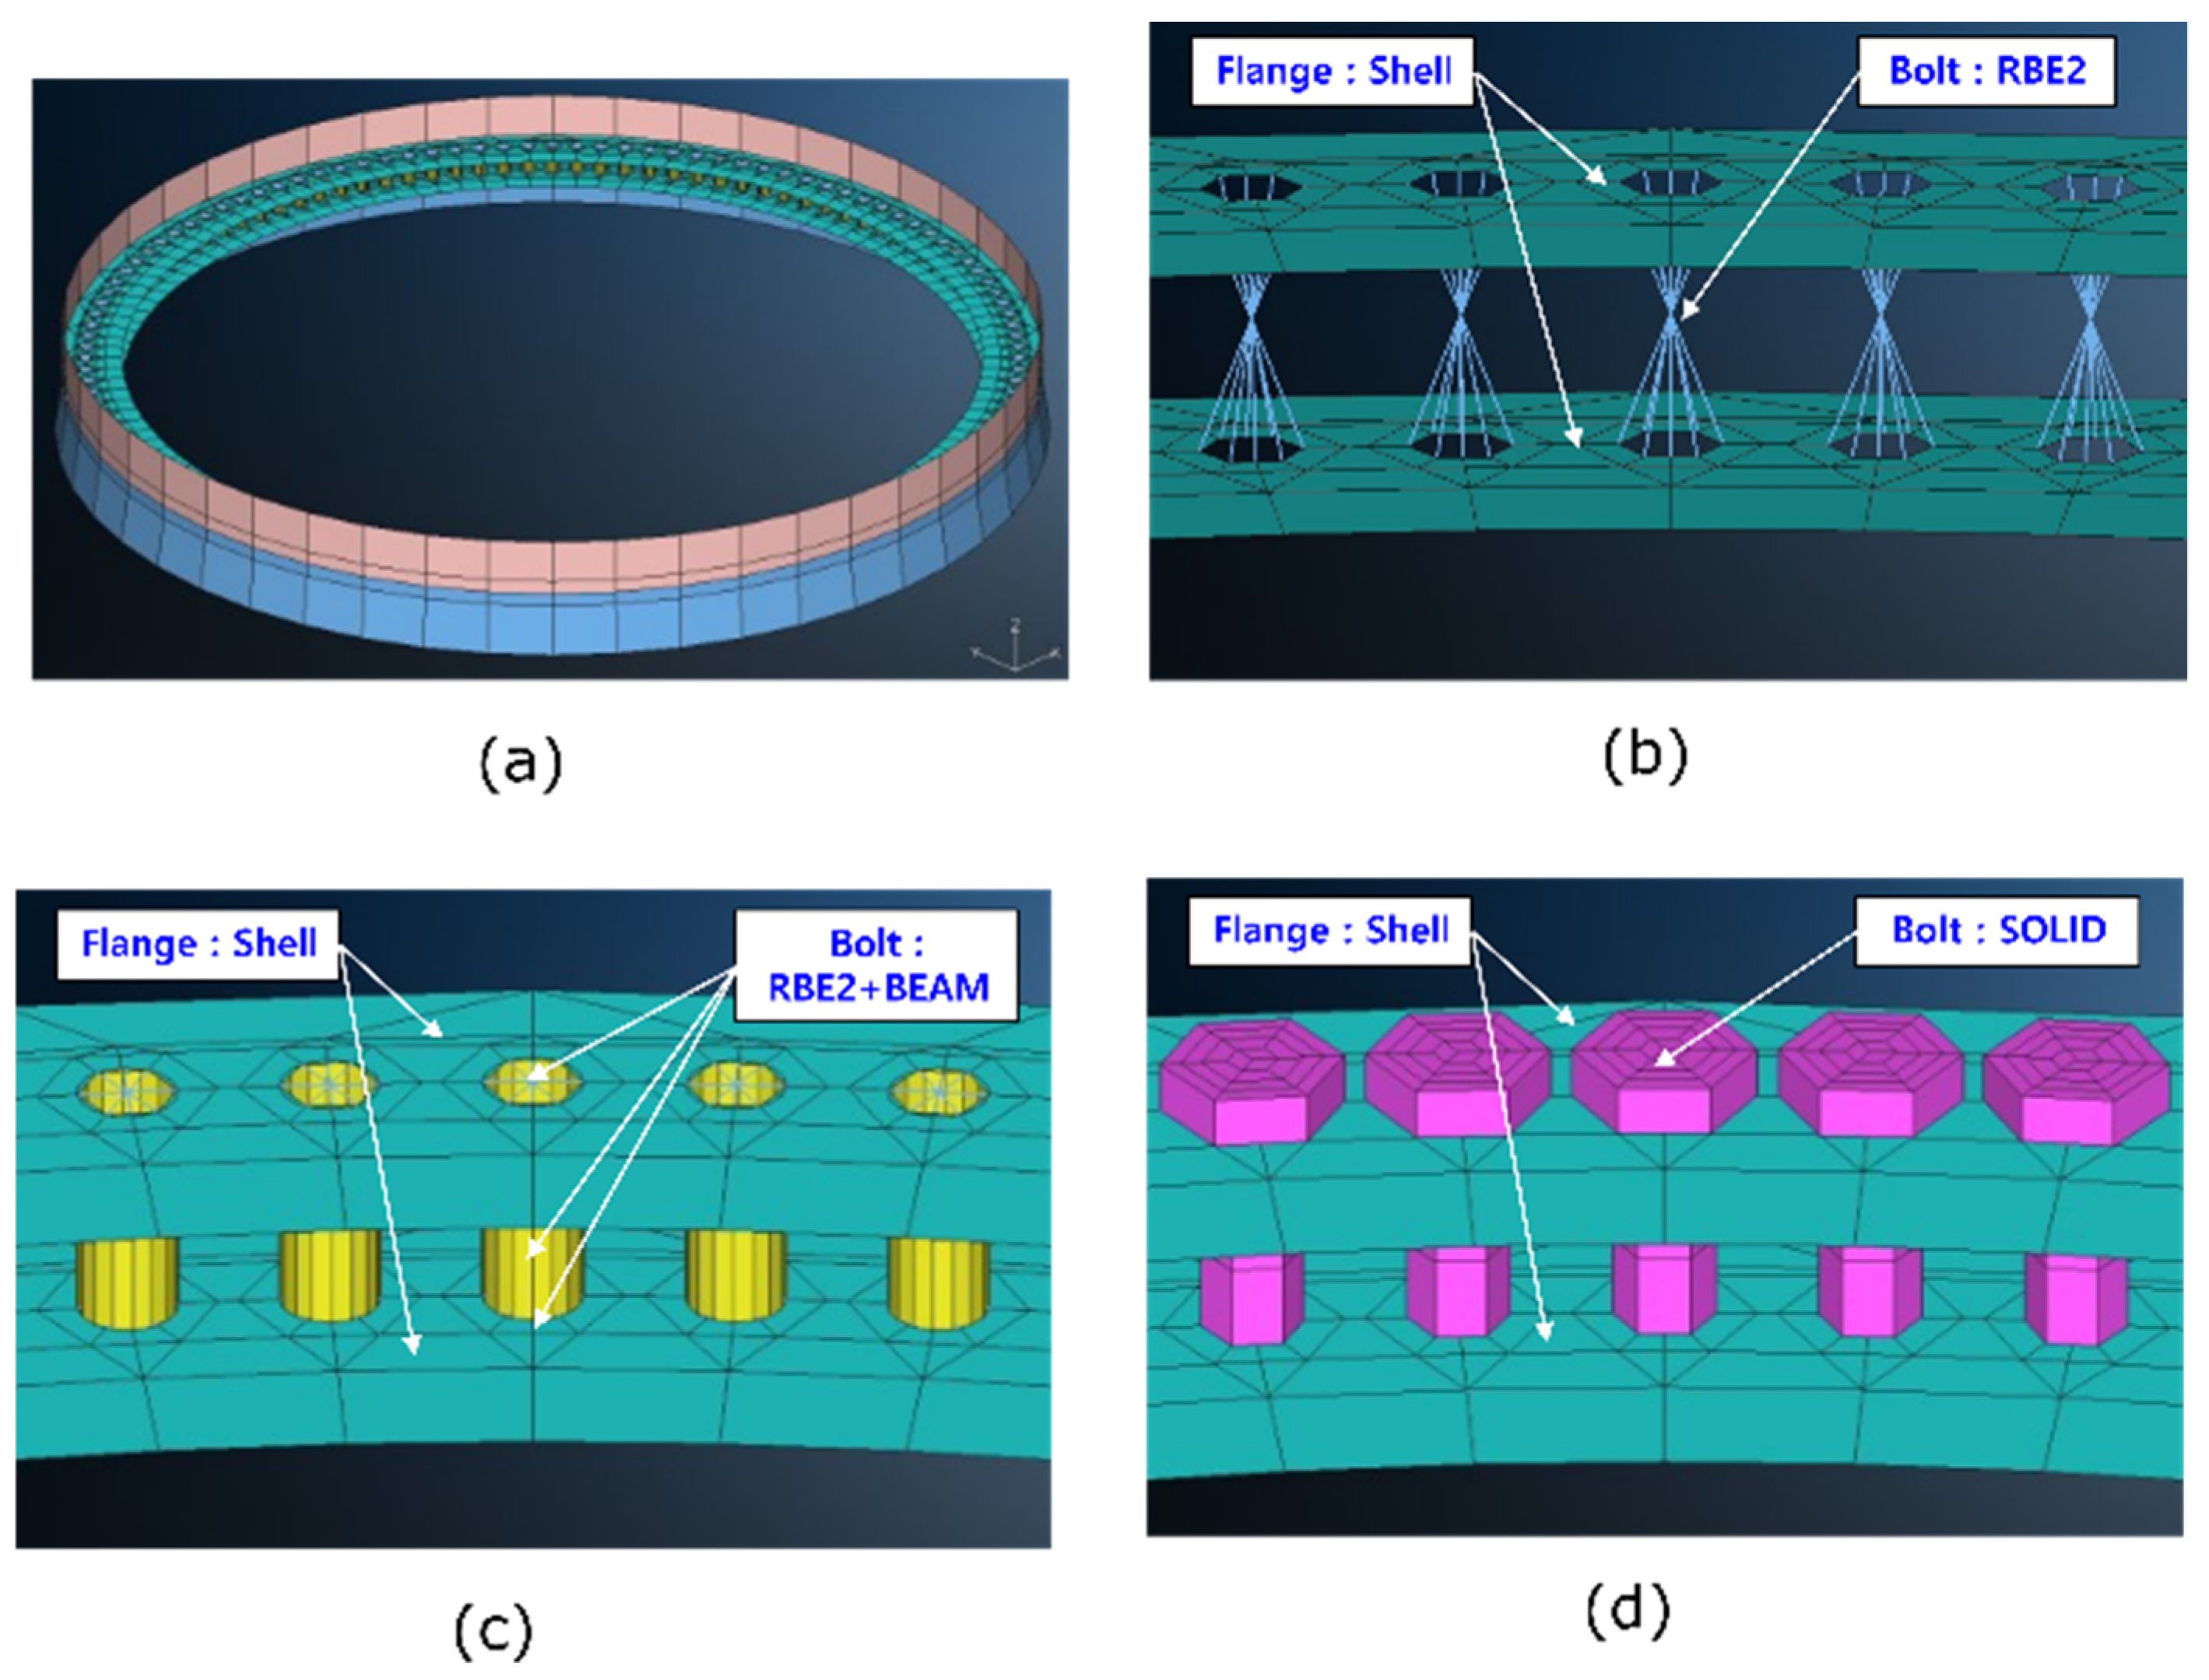
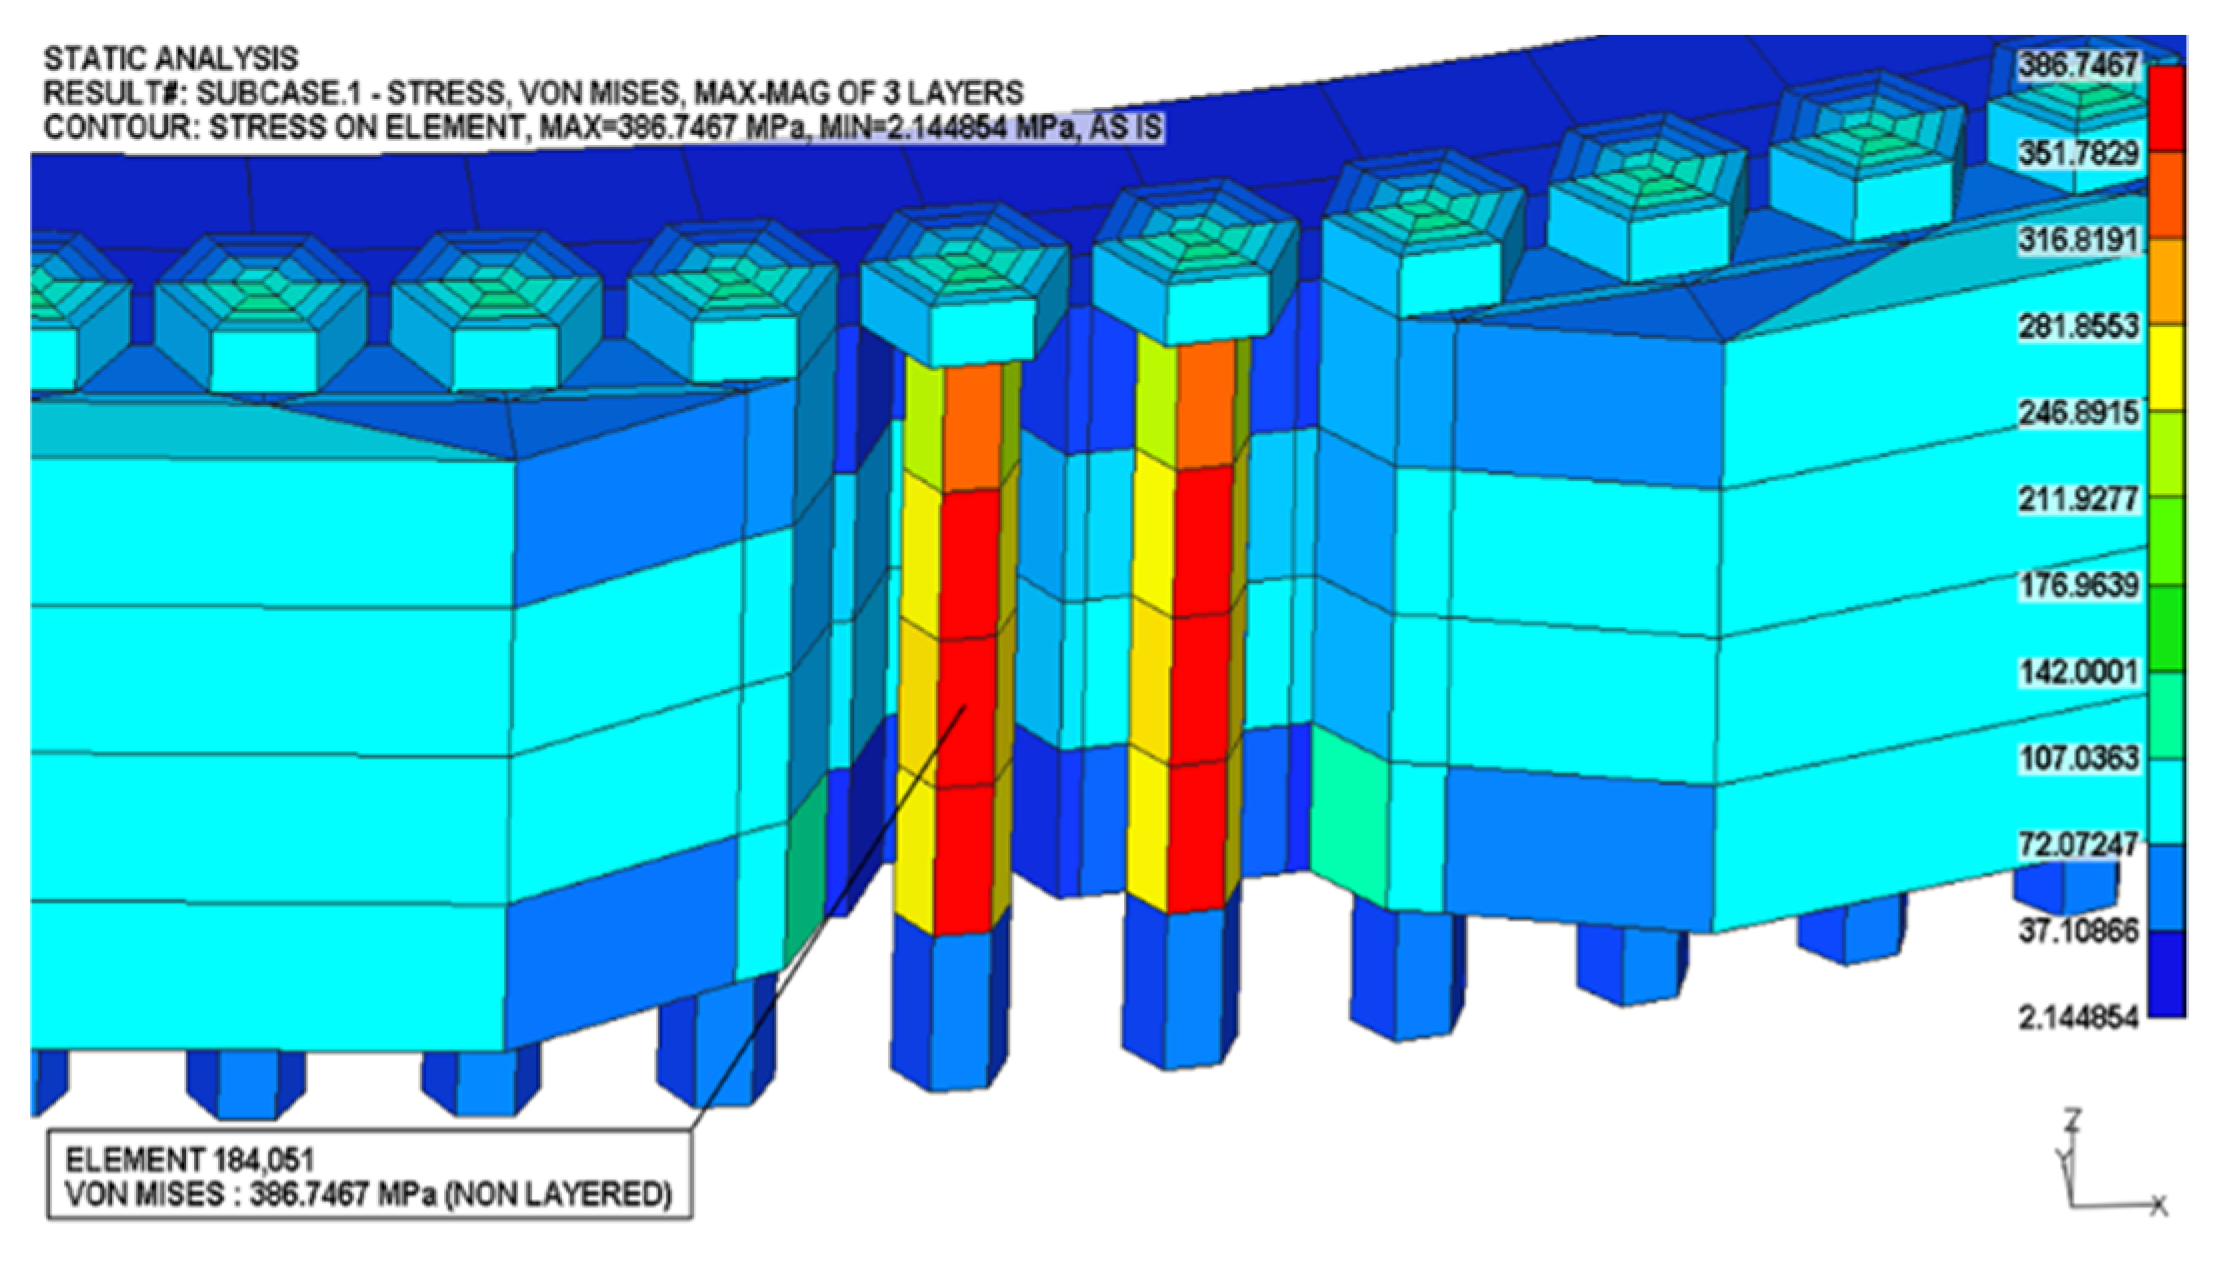
5.4.2. Stresses from the Bolted Joint Connection

Three types of bolt elements and two types of flange elements were studied for the bolted connection joints between TP and the upper part of the substructure, and it was found that the solid element applied to the flange was conservative in the analysis as listed in Table 16.
Based on the investigation of bolt and shell element types, the solid elements were applied to bolted joint connections of a spar structure FE model. Figure 17 and Figure 18 show the stress distribution of the bolted connection in the simulation case of LC06.
The results showed that the von Mises stresses of bolts on the 12 analysis cases were under the allowable stress (830 MPa) of the bolt as shown in Table 17.

6. Conclusions

In this paper, the finite element model of the spar-type substructure for a 5 MW FOWT planned in the East Sea was constructed in detail for structural integrity evaluation under extreme environmental conditions. The extreme environmental conditions in the sea with 150 m water depth about 58 km away from the coastline of Ulsan were also investigated. Based on the data recorded for three years (2016–2018) at the nearest Ulsan Marine buoy point, the 50 years return period extreme sea state was calculated which resulted in extreme wind load, wave load, and current load to be used for the fully coupled integrated load analysis with FAST, a widely used load analysis software developed by NREL, coupled with the in-house hydrodynamic code developed by UOU. From the integrated load analysis, the dynamic responses with six degrees of freedom motions of the floating offshore wind turbine were applied to the FE model of the spar-type substructure under three co-directional conditions (45°, 135°, and 315°) of wind and wave. The three-dimensional (3D) structural finite element (FE) model incorporating the mooring lines and bolted joint connection was constructed in FEGate with the fixed boundary conditions at the end of the mooring lines and the external loads such as the structural loads due to the inertial acceleration, buoyancy, and gravity, and the environmental loads due to the wind, wave, and current. The three-dimensional FE analysis in MSC Nastran software showed that the designed spar-type substructure had enough strength to endure the extreme limitation in the East Sea based on the von Mises criteria. For future work, the fatigue life calculation and damage tolerance design using the current process will be executed with high fidelity. The performed structural modeling and analysis process based on the fully coupled integrated analysis will also be beneficial to the modeling and analysis of the other FOWT substructures, such as submersible type.

Author Contributions

Conceptualization and methodology, H.-S.S. and K.H.; software, J.-B.K. and Y.Y.; validation, J.-B.K.; investigation, K.H.; writing—original draft preparation, J.-B.K. and K.H.; writing—review and editing, K.H. and H.-S.S.; visualization, Y.Y.; project administration and funding, K.H.; All authors have read and agreed to the published version of the manuscript.

Funding

This work was supported by the Korea Institute of Energy Technology Evaluation and Planning (KETEP) of the Republic of Korea (No.: 20183010025270). Also, this work was supported by Brain Pool Program through the National Research Foundation of Korea (NRF) funded by the Ministry of Science and ICT (grant number: 2019H1D3A2A02102093).

Institutional Review Board Statement

Not applicable.

Informed Consent Statement

Not applicable.

Conflicts of Interest

The authors declare no conflict of interest.

Abbreviations

CFDComputational fluid dynamics
CMCenter of mass
FFTFast Fourier transform
FOWTFloating offshore wind turbine
JONSWAPJoint North Sea Wave Project
PMPierson–Moskowitz
QTFQuadratic transfer function
RAOResponse amplitude operator
RWTReference wind turbine
S-FOWTSuperconducting floating offshore wind turbine
SWLStill water level

References

  1. Trevor, M. Future Energy, 3rd ed.; Elsevier: Amsterdam, The Netherlands, 2020; pp. 331–355. ISBN 9780081028865. [Google Scholar] [CrossRef]
  2. Krohn, S.; Morthorst, P.E.; Awerbuch, S. The Economics of Wind Energy; European Wind Energy Association: Brussels, Belgium, 2009; pp. 28–29. [Google Scholar]
  3. Mckenna, R.; Hollnaicher, S.; Leye, P.; Fichtner, W. Cost-potentials for large onshore wind turbines in Europe. Energy 2015, 83, 217–229. [Google Scholar] [CrossRef]
  4. Lantz, E.; Hand, M.; Wiser, R. The Past and Future Cost of Wind Energy. In Proceedings of the 2012 World Renewable Energy Forum Denver, Denver, CO, USA, 13–17 May 2012. NREL/CP-6A20-54526. [Google Scholar]
  5. Michael, H.; Ben, A.; Patrick, J.; AbuBakr, B. Assessing socially acceptable locations for onshore wind energy using a GIS-MCDA approach. Int. J. Low-Carbon Technol. 2019, 14, 160–169. [Google Scholar] [CrossRef]
  6. European Environment Agency. Europe’s Onshore and Offshore Wind Energy Potential an Assessment of Environmental and Economic Constraints; Technical Report Series, No. 6; EEA: Copenhagen, Denmark, 2019. [Google Scholar] [CrossRef]
  7. Konstantinidis, E.I.; Botsaris, P.N. Wind Turbines: Current status, obstacles, trends, and technologies. In IOP Conference Series: Materials Science and Engineering; IOP: Pireas, Greece, 2016. [Google Scholar] [CrossRef]
  8. Wehrmann, B. German Offshore Wind Power–Output, Business, and Perspectives, Clean Energy Wire. 2020. Available online: https://www.cleanenergywire.org/factsheets/german-offshore-wind-power-output-business-and-perspectives (accessed on 1 August 2021).
  9. WindEurope. Wind Energy in Europe in 2019–Trends and Statistics. 2020. Available online: https://windeurope.org/about-wind/statistics/european/wind-energy-in-europe-in-2019/ (accessed on 1 August 2021).
  10. Manwell, J.F.; McGowan, J.G.; Rogers, A.L. Wind Energy Explained: Theory, Design and Application (Chapter 3); John Wiley & Sons: Hoboken, NJ, USA, 2020. [Google Scholar]
  11. Burton, T.; Jenkins, N.; Sharpe, D.; Bossanyi, E. Wind Energy Handbook, 2nd ed.; John Wiley & Sons: Hoboken, NJ, USA, 2011. [Google Scholar] [CrossRef]
  12. Hau, E. Wind Turbines: Fundamentals, Technologies, Application, Economics; Springer: Berlin/Heidelberg, Germany, 2013. [Google Scholar] [CrossRef]
  13. Seidel, M. Substructures for Offshore Wind Turbines CURRENT Trends and Developments; Festschrift Peter Schauma: Hannover, Germany, 2014. [Google Scholar] [CrossRef]
  14. Muhammad, A.; Brendan, O.K. Offshore wind-turbine structures: A review. Proc. Inst. Civ. Eng. Energy 2013, 166, 139–152. [Google Scholar] [CrossRef]
  15. Abhinav, K.A.; Saha, N. Dynamic Analysis of an Offshore Wind Turbine Including Soil Effects. Procedia Eng. 2015, 116, 32–39. [Google Scholar] [CrossRef] [Green Version]
  16. Plodpradit, P.; Dinh, V.N.; Kim, K.D. Coupled Analysis of Offshore Wind Turbine Jacket Structures with Pile-Soil-Structure Interaction Using FAST v8 and X-SEA. Appl. Sci. 2019, 9, 55. [Google Scholar] [CrossRef] [Green Version]
  17. Fabian, V.; Reuter, A. Fully-coupled Wind Turbine Simulation Including Substructuring of Support Structure Components: Influence of Newly Developed Modeling Approach on Fatigue Loads for an Offshore Wind Turbine on a Tripod Support Structure. In Proceedings of the 21st International Offshore and Polar Engineering Conference, Maui, HI, USA, 16–21 June 2011. [Google Scholar]
  18. Lai, W.J.; Lin, C.Y.; Huang, C.C.; Lee, R.M. Dynamic Analysis of Jacket Substructure for Offshore Wind Turbine Generators under Extreme Environmental Conditions. Appl. Sci. 2016, 6, 307. [Google Scholar] [CrossRef] [Green Version]
  19. Chen, I.W.; Wong, B.L.; Lin, Y.H.; Chau, S.W.; Huang, H.H. Design and Analysis of Jacket Substructures for Offshore Wind Turbines. Energies 2016, 9, 264. [Google Scholar] [CrossRef] [Green Version]
  20. Damiani, R. JacketSE: An Offshore Wind Turbine Jacket Sizing Tool; Theory Manual and Sample Usage with Preliminary Validation; TP-5000-65417; NREL: Golden, CO, USA, 2016. [Google Scholar] [CrossRef] [Green Version]
  21. Teh, N. Japan & South Korea Floating Offshore Wind 2019. Innovate UK Global Expert Mission; KTN: Lodon, UK, 2019. [Google Scholar]
  22. Kim, J.Y.; Kang, K.S.; Oh, K.Y.; Lee, J.S.; Ryu, M.S. A Study on the Site Selection of Offshore Wind Farm around Korean Peninsula. In Proceedings of the the 3rd International Conference on Ocean Energy (ICOE), Bilbao, Spain, 6–7 October 2010. [Google Scholar]
  23. IRENA. Floating Foundations: A Game Changer for Offshore Wind Power; International Renewable Energy Agency: Abu Dhabi, United Arab Emirates, 2016. [Google Scholar]
  24. DNVGL. DNVGL-ST-0119: Floating Wind Turbine Structures; DNV GL AS: Bærum, Norway, 2018. [Google Scholar]
  25. Jonkman, J. Dynamics Modeling and Loads Analysis of an Offshore Floating Wind Turbine; NREL/TP-500-41958; National Renewable Energy Laboratory: Golden, CO, USA, 2017. [Google Scholar]
  26. DNVGL Recommended Practice. In Coupled Analysis of Floating Wind Turbines; DNVGL-RP-0286; DNVGL: Bærum, Norway, 2019.
  27. Galán-Lavado, A.; Santos, M. Analysis of the Effects of the Location of Passive Control Devices on the Platform of a Floating Wind Turbine. Energies 2021, 14, 2850. [Google Scholar] [CrossRef]
  28. Villoslada, D.; Santos, M.; Tomás-Rodríguez, M. General Methodology for the Identification of Reduced Dynamic Models of Barge-Type Floating Wind Turbines. Energies 2021, 14, 3902. [Google Scholar] [CrossRef]
  29. Pimenta, F.; Ruzzo, C.; Failla, G.; Arena, F.; Alves, M.; Magalhães, F. Dynamic response characterization of floating structures based on numerical simulations. Energies 2020, 13, 5670. [Google Scholar] [CrossRef]
  30. Ruzzo, C.; Failla, G.; Collu, M.; Nava, V.; Fiamma, V.; Arena, F. Operational modal analysis of a spar-type floating platform using frequency domain decomposition method. Energies 2016, 9, 870. [Google Scholar] [CrossRef] [Green Version]
  31. Hassan, B.; Karmakar, D.; Carlos, G.S. Dynamic analysis of spar type floating offshore wind turbine. In Proceedings of the Coastal and Maritime Mediterranean Conference, Rhodes, Greece, 25–29 October 2011. [Google Scholar] [CrossRef]
  32. Choi, E.; Han, C.; Kim, H.; Park, S. Optimal Design of Floating Substructures for Spar-Type Wind Turbine Systems. Wind Struct. 2014, 18, 253–265. [Google Scholar] [CrossRef]
  33. Hegseth, J.M.; Bachynski, E.E.; Martins, J. Design Optimization of Spar Floating Wind Turbines Considering Different Control Strategies. J. Phys. Conf. Ser. 2020, 1669, 012010. [Google Scholar] [CrossRef]
  34. Van der Valk, P. Coupled Simulations of Wind Turbines and Offshore Support Structures: Strategies based on the Dynamic Substructuring Paradigm; Delft University of Technology: Delft, The Netherlands, 2014. [Google Scholar] [CrossRef]
  35. Shi, W.; Han, J.; Kim, C.; Lee, D.; Shin, K.; Park, H. Feasibility study of offshore wind turbine substructures for southwest offshore wind farm project in Korea. Renew. Energy 2015, 74, 406–413. [Google Scholar] [CrossRef]
  36. Jonkman, J.M.; Buhl, M.L. FAST User’s Guide; National Renewable Energy Laboratory: Golden, CO, USA, 2005. [Google Scholar]
  37. NWTC Information Portal (FAST v8). National Renewable Energy Laboratory. Available online: https://nwtc.nrel/gov/FAST8 (accessed on 1 August 2021).
  38. ABS. Guide for Building and Classing Floating Offshore Wind Turbine Installations; ABS: Houston, TX, USA, 9 April 2013. [Google Scholar]
  39. Lene, H.A.; Kimon, A.; Andreas, M.; Jarett, G.; Knut, R. DNV GL Standard for Floating Wind Turbines; IOWTC: San Francisco, CA, USA, 2018. [Google Scholar] [CrossRef]
  40. API. Design and Analysis of Station keeping Systems for Floating Structures, 3rd ed.; API RP 2SK; API: Washington, DC, USA, 2005. [Google Scholar]
  41. IEC. Wind Energy Generation Systems-Part 3-1: Design Requirements for Fixed Wind Offshore Wind Turbines; IEC 61400-3-1, Edition 1.0.; IEC: Geneva, Switzerland, 2019. [Google Scholar]
  42. IEC. Wind Energy Generation Systems-Part 1: Design Requirements; IEC61400-1, Edition 4.0; IEC: Geneva, Switzerland, 2019. [Google Scholar]
  43. IEC. Wind Energy Generation System—Part 3-2: Design Requirements for Floating Offshore Wind Turbines; Technical Specification; IEC-61400-3-2, Edition 1.0; IEC: Geneva, Switzerland, 2019; ISBN 978-2-8322-5986-3. [Google Scholar]
  44. KHOA. 2017 National Oceanographic Survey Annual White Paper; 11-1192136-000032-01; Korea Hydrographic and Oceanographic Agency: Busan, Korea, 2018; pp. 314–316. (In Korean) [Google Scholar]
  45. Kim, J.B.; Shin, H.K. Validation of a 750 kW semi-submersible floating offshore wind turbine numerical model with model test data, part II: Model-II. Int. J. Nav. Archit. Ocean Eng. 2019, 12, 213–225. [Google Scholar] [CrossRef]
  46. Hall, M. MoorDyn User’s Guide; Department of Mechanical Engineering, University of Maine: Orono, ME, USA, 2015. [Google Scholar]
  47. DNVGL. Rules for Classification, Ships, Part 3 Hull, Chapter 4 Loads; DNVGL-RU-SHIP-Pt3Ch4; DNVGL: Bærum, Norway, 2019. [Google Scholar]
  48. Natarajan, A.; Hansen, M.H.; Wang, S. Design Load Basis for Offshore Wind Turbines: DTU Wind Energy Report No. E-0133; DTU: Lyngby, Denmark, 2016. [Google Scholar]
  49. Dassault Systems. CATIA V5; Dassault Systems: San Diego, CA, USA, 2020. [Google Scholar]
  50. RAONX Solutions, FEGate, SVC Incorporation. 2019. Available online: http://www.svd.co.kr/product_fegate1.html (accessed on 1 August 2021).
  51. Hexagon, MSC Software, MSC Nastran. Available online: https://www.mscsoftware.com/product/msc-nastran (accessed on 1 August 2021).
  52. DNV. Design of Offshore Steel Structures, General-LRFD Method; DNVGL-OS-C101; DNVGL: Bærum, Norway, 2019. [Google Scholar]
  53. DNV. Determination of Structural Capacity by Non-Linear FE Analysis Methods; DNV-RP-C208; DNVGL: Bærum, Norway, 2013. [Google Scholar]
  54. ABS-MODU. Mobile Offshore Drilling Units (Part 3), Hull Construction and Equipment; ABS: Sring, TX, USA, 2017. [Google Scholar]
  55. ISO. Mechanical Properties of Fasteners Made of Carbon Steel and Alloy Steel–Part 1: Bolts, Screws, and Studs with Specified Property Classes–Coarse Thread and Fine Pitch Thread, 4th ed.; ISO 898-1; ISO: Geneva, Switzerland, 2019. [Google Scholar]
  56. Tran, T.; Kim, D.-H. The platform pitching motion of floating offshore wind turbine: A preliminary unsteady aerodynamic analysis. J. Wind. Eng. Ind. Aerodyn. 2015, 142, 65–81. [Google Scholar] [CrossRef] [Green Version]
  57. DNV. Modelling and Analysis of Marine Operations; DNV-RP-H103; DNVGL: Bærum, Norway, 2011. [Google Scholar]
Figure 1. Various bottom-fixed substructure types: (a) Monopile; (b) gravity-base; (c) tripod; (d) jacket [34].
Energies 14 06571 g001
Figure 2. Various floating-type substructure types: (a) Barge; (b) semi-submersible; (c) spar; (d) tension leg platform (TLP) [24].
Energies 14 06571 g002
Figure 3. Schematic layout of 5 MW floating offshore wind turbine system. (a) Base layout of a wind turbine; (b) Base layout of a spar platform.
Energies 14 06571 g003
Figure 4. Baseline configuration of the mooring system.
Energies 14 06571 g004
Figure 5. Wind rose with different wind speeds.
Energies 14 06571 g005
Figure 6. Modeling and analysis process of a FOWT substructure.
Energies 14 06571 g006
Figure 7. Co-directional conditions of wind, wave, and current.
Energies 14 06571 g007
Figure 8. 3D finite element model of a spar structure.
Energies 14 06571 g008
Figure 9. Various element representations of a bolted joint connection. (a) FE modeling of tower bottom and TP flange; (b) Connection method (Flange: Shell, Bolt: RBE2); (c) Connection method (Flange: Shell, Bolt: RBE2+Beam); (d) Connection method (Flange: Shell, Bolt: Solid).
Energies 14 06571 g009
Figure 10. The degrees of freedom of a FOWT with a spar substructure [56].
Energies 14 06571 g010
Figure 11. Six D.O.F. motion results of spar-type platform (LC06 case). (a) Surge motion; (b) Sway motion; (c) Heave motion; (d) Roll motion; (e) Pitch motion; (f) Yaw motion.
Energies 14 06571 g011
Figure 12. Visual representation of structural loads.
Energies 14 06571 g012
Figure 13. Visual representation of environmental loads (wind force, wave force, and current force).
Energies 14 06571 g013
Figure 14. Three-dimensional finite element model and results of a spar structure.
Energies 14 06571 g014
Figure 15. Equivalent stress distribution (LC06).
Energies 14 06571 g015
Figure 16. Maximum equivalent stress at fairlead (close up).
Energies 14 06571 g016
Figure 17. Equivalent stress distribution of bolted joint connection (LC06).
Energies 14 06571 g017
Figure 18. Maximum equivalent stress at bolt (Close-up).
Energies 14 06571 g018
Table 1. Overall key specification of 5 MW FOWT.
DescriptionValue
Rated power5 MW
Rotor Orientation, configurationUpwind, 3 blades
ControlVariable speed, collective pitch
DrivetrainHigh speed,
multiple-stage gearbox
Rotor, hub diameter150.97 m, 3 m
Hub height99.36 m
Cut-in, rated, cut-out wind speed3 m/s, 10.8 m/s, 22 m/s
Cut-in, rated rotor speed6.0 rpm, 11.3 rpm
Overhang, shaft tilt, pre-cone5 m, 5°, 2.5°
Table 2. Properties of 5 MW baseline wind turbine.
DescriptionValue
RotorDiameter150.97 m
Projected area17,900.7 m2
Mass126,602 kg
NacelleLength12.0 m
Breadth4.5 m
Height4.7 m
Mass200,000 kg
TowerDiameter at top3.5 m
Diameter at base6.0 m
Height81.675 m
Mass383,549 kg
Table 3. Structural characteristics of 5 MW floating platform.
DescriptionUnitValue
FOWT
(total)
Length (depth)m91.0
Draftm75.64
Freeboardm15.36
CB (center of buoyancy)m34.561
CG (center of gravity)m27.100
PlatformHullWeightt1471.2
VCGm32.281
EquipmentWeightt107
VCGm86.000
SubtotalWeightt1579
VCGm35.932
BallastConcreteWeightt3093.9
VCGm2.99
WaterWeightt3785.7
VCGm20.37
Platform + ballastWeightt8458.1
Freeboardm28.568
CB (center of buoyancy)m31.107
CG (center of gravity)m15.826
Roll inertiat × m21,261,706
Pitch inertiat × m21,228,964
Yaw inertiat × m2353,848
Table 4. Mooring system properties.
DescriptionUnitValue
Number of Mooring lines-3
Chain type-R4 Studless
MBLkN13,573
Angle between adjacent linesdeg.120.0
Depth to anchors below SWL (water depth)m150.0
Depth to fairleads below SWLm44.24
Radius to anchors from floater centerlinem532.21
Radius to fairleads from floater centerlinem7.5
Unstretched mooring line lengthm560.0
Mooring ling diameterm0.12
Equivalent mooring line mass densitykg/m288.0
Equivalent mooring line weight in waterN/m250.0
Equivalent mooring line extensional stiffnessN1,229,760,000
Drag anchor ultimate holding capacityton612.0
Clamp Weight (Concrete Block)
L × B × Hm2.8 × 2.6 × 2.6
Dry weightkg39,400
Wet weightkg20,000
Table 5. Extreme environmental design condition.
TypeItemsUnit50-yr
Wind10 min at 10 m heightm/s30.99
10 min at hub heightm/s39.83
1 h at 10 m heightm/s29.44
1 h at hub heightm/s37.49
Directiondeg45/225/337.5
Exponent for profile-0.11
WaveSignificant wave heightm11.117
Spectral peak periods14.171
Maximum wave heightm17.859
Directiondeg0
CurrentSurfacem/s1.63
Intermediatem/s0.61
Bottomm/s0.34
Directiondeg12
TideHighest design water levelm1.48
Lowest design water levelm0
Table 6. Simulation configuration for DLC 6.1.
Turbine Operational ModeDLCFloater TypeWind ConditionEnvironmental DirectionsWave &
Wind Misalignment
Yaw
Error
Wind Speed
at Hub
Wave ConditionCurrentWater Level
WindWaveCurrentHsTp
(deg)(deg)(deg)(deg)(m/s)(m)(s)(m/s)
Parked (Idling)6.1Spar50 years
Storm
454545Co-direction−8, 0, +839.83211.11711.9961.63MSL
454545Co-direction−8, 0, +839.83211.11713.7261.63MSL
454545Co-direction−8, 0, +839.83211.11715.4551.63MSL
−45−45−45Co-direction−8, 0, +839.83211.11711.9961.63MSL
−45−45−45Co-direction−8, 0, +839.83211.11713.7261.63MSL
−45−45−45Co-direction−8, 0, +839.83211.11715.4551.63MSL
−135−135−135Co-direction−8, 0, +839.83211.11711.9961.63MSL
−135−135−135Co-direction−8, 0, +839.83211.11713.7261.63MSL
−135−135−135Co-direction−8, 0, +839.83211.11715.4551.63MSL
Table 7. Material properties of the plate structures.
DescriptionMild Steel (Grade A)AH36/DH36
Elastic modulus206,000 MPa206,000 MPa
Poisson ratio0.30.3
Yield stress235 MPa355 MPa
Tensile stress400 MPa490 MPa
Material factor (k)10.72
Safety factor1.431.43
Allowable stress167.86253.57
Table 8. Material properties of bolt.
GradeTensile
Strength (MPa)
Stress under
Proof Load (MPa)
10.91000830.0
Table 9. Structural simulation cases.
Case No.Description
LC01Max. X-dir. moment (tower base)
LC02Max. Y-dir. moment (tower base)
LC03Max. Z-dir. moment (tower base)
LC04Max. X-dir. force (tower base)
LC05Max. Y-dir. force (tower base)
LC06Max. mooring tension
LC07Max. surge motion
LC08Max. sway motion
LC09Max. heave motion
LC10Max. roll motion
LC11Max. pitch motion
LC12Max. yaw motion
Table 10. Dynamic motions of 5 MW FOTW platform.
Case No.Environment
Angle (deg)
SurgeSwayHeaveRollPitchYaw
Displacement (m)Displacement (m)Displacement (m)Displacement (deg)Displacement (deg)Displacement (deg)
Acceleration (m/s2)Acceleration (m/s2)Acceleration (m/s2)Acceleration (deg/s2)Acceleration (deg/s2)Acceleration (deg/s2)
LC014516.17−18.98−3.386.823.7113.63
1.578−1.685−0.8361.2091.1135.568
LC02135−19.01−25.90−3.574.60−4.193.28
1.540−1.564−0.8091.0250.9331.914
LC0331514.6518.97−3.37−6.593.68−19.13
1.6021.694−0.845−1.25−1.148−9.355
LC0431516.5618.35−3.43−6.333.96−14.84
1.5891.677−0.8437−1.1981.0786.945
LC054516.17−18.98−3.386.823.7113.63
1.578−1.685−0.8731.2091.1135.568
LC064516.34−20.33−3.857.244.899.55
1.425−1.408−0.7260.9120.9571.913
LC07135−19.33−26.45−3.875.16−4.691.94
−1.395−1.392−0.685−0.871−0.900−0.668
LC08135−19.33−26.45−3.875.16−4.691.94
−1.395−1.392−0.685−0.871−0.900−0.668
LC09135−19.33−26.45−3.875.16−4.691.94
−1.395−1.392−0.685−0.871−0.900−0.668
LC104516.34−20.33−3.857.244.899.55
1.425−1.408−0.7260.9120.9571.913
LC114513.70−20.73−3.797.12−4.9611.98
1.453−1.408−0.7240.934−1.005−2.408
LC1231513.2019.39−3.23−6.42−3.75−19.80
1.6051.662−0.842−1.224−1.116−9.519
Table 11. Structural loads.
DescriptionValue (ton)
Structure weight2316.24
Buoyancy9338.12
Permanent ballast3085.20
Table 12. Wind forces.
Height above
Water Line (m)
PartsProjection
Area (m2)
Height Coef.
(Ch)
Wind Force
(ton)
0.0~15.3Tower32.501.001.61
Platform72.521.003.58
15.3~30.5Tower76.161.104.14
30.5~46.0Tower68.201.204.04
46.0~61.0Tower66.001.304.24
61.0~76.0Tower65.161.374.41
76.0~91.5Tower60.741.434.29
91.5~106.5Tower19.841.481.45
Total461.1227.77
Table 13. Wave load.
TypeBreadth of
Towed Object (m)
Reflection
Coefficient (R)
Significant Wave
Height (m)
Wave Force
(ton)
Spar13.000.8811.117159.41
Table 14. Current load.
TypeProjected Area (m2)Drag Coefficient
(Cd)
Current Velocity
(m/s)
Current Force
(ton)
Spar1058.480.621.6325.366
Table 15. Maximum equivalent stresses of the plates.
Load CaseEnvironment
Angle (deg)
Equivalent
Stress (MPa)
Allowable
Stress (MPa)
Result
LC0145217.12253.57Satisfied
LC02135181.35253.57Satisfied
LC03315215.38253.57Satisfied
LC04315214.59253.57Satisfied
LC0545217.12253.57Satisfied
LC0645218.08253.57Satisfied
LC07135182.87253.57Satisfied
LC08135182.87253.57Satisfied
LC09135182.87253.57Satisfied
LC1045218.08253.57Satisfied
LC1145217.73253.57Satisfied
LC12315214.79253.57Satisfied
Table 16. Maximum equivalent stresses of the flange.
Bolt ElementPartStress (MPa)Allowable Stress (MPa)
RBE3Flange (shell)88.9248.25
RBE3 + beamFlange (shell)115.9248.25
solidFlange (shell)140.5248.25
RBE3Flange (solid)211.0248.25
RBE3 + beamFlange (solid)201.4248.25
solidFlange (solid)179.9248.25
Table 17. Maximum equivalent stresses of bolts.
Load CaseEnvironment
Angle (deg)
Equivalent
Stress (MPa)
Allowable
Stress (MPa)
Result
LC0145369.65830.00Satisfied
LC02135282.27830.00Satisfied
LC03315362.07830.00Satisfied
LC04315350.63830.00Satisfied
LC0545369.65830.00Satisfied
LC0645386.75830.00Satisfied
LC07135304.91830.00Satisfied
LC08135304.91830.00Satisfied
LC09135304.91830.00Satisfied
LC1045386.75830.00Satisfied
LC1145382.94830.00Satisfied
LC12315354.44830.00Satisfied
Publisher’s Note: MDPI stays neutral with regard to jurisdictional claims in published maps and institutional affiliations.

