
The Footprint of Type 1 Diabetes on Red Blood Cells: A Metabolomic and Lipidomic Study
 , , , and
Abstract
:
1. Introduction
2. Materials and Methods
2.1. Study Design and Subjects
2.2. Peripheral Blood Samples
2.3. Extraction of Metabolites and Lipids
2.4. NMR Experiments
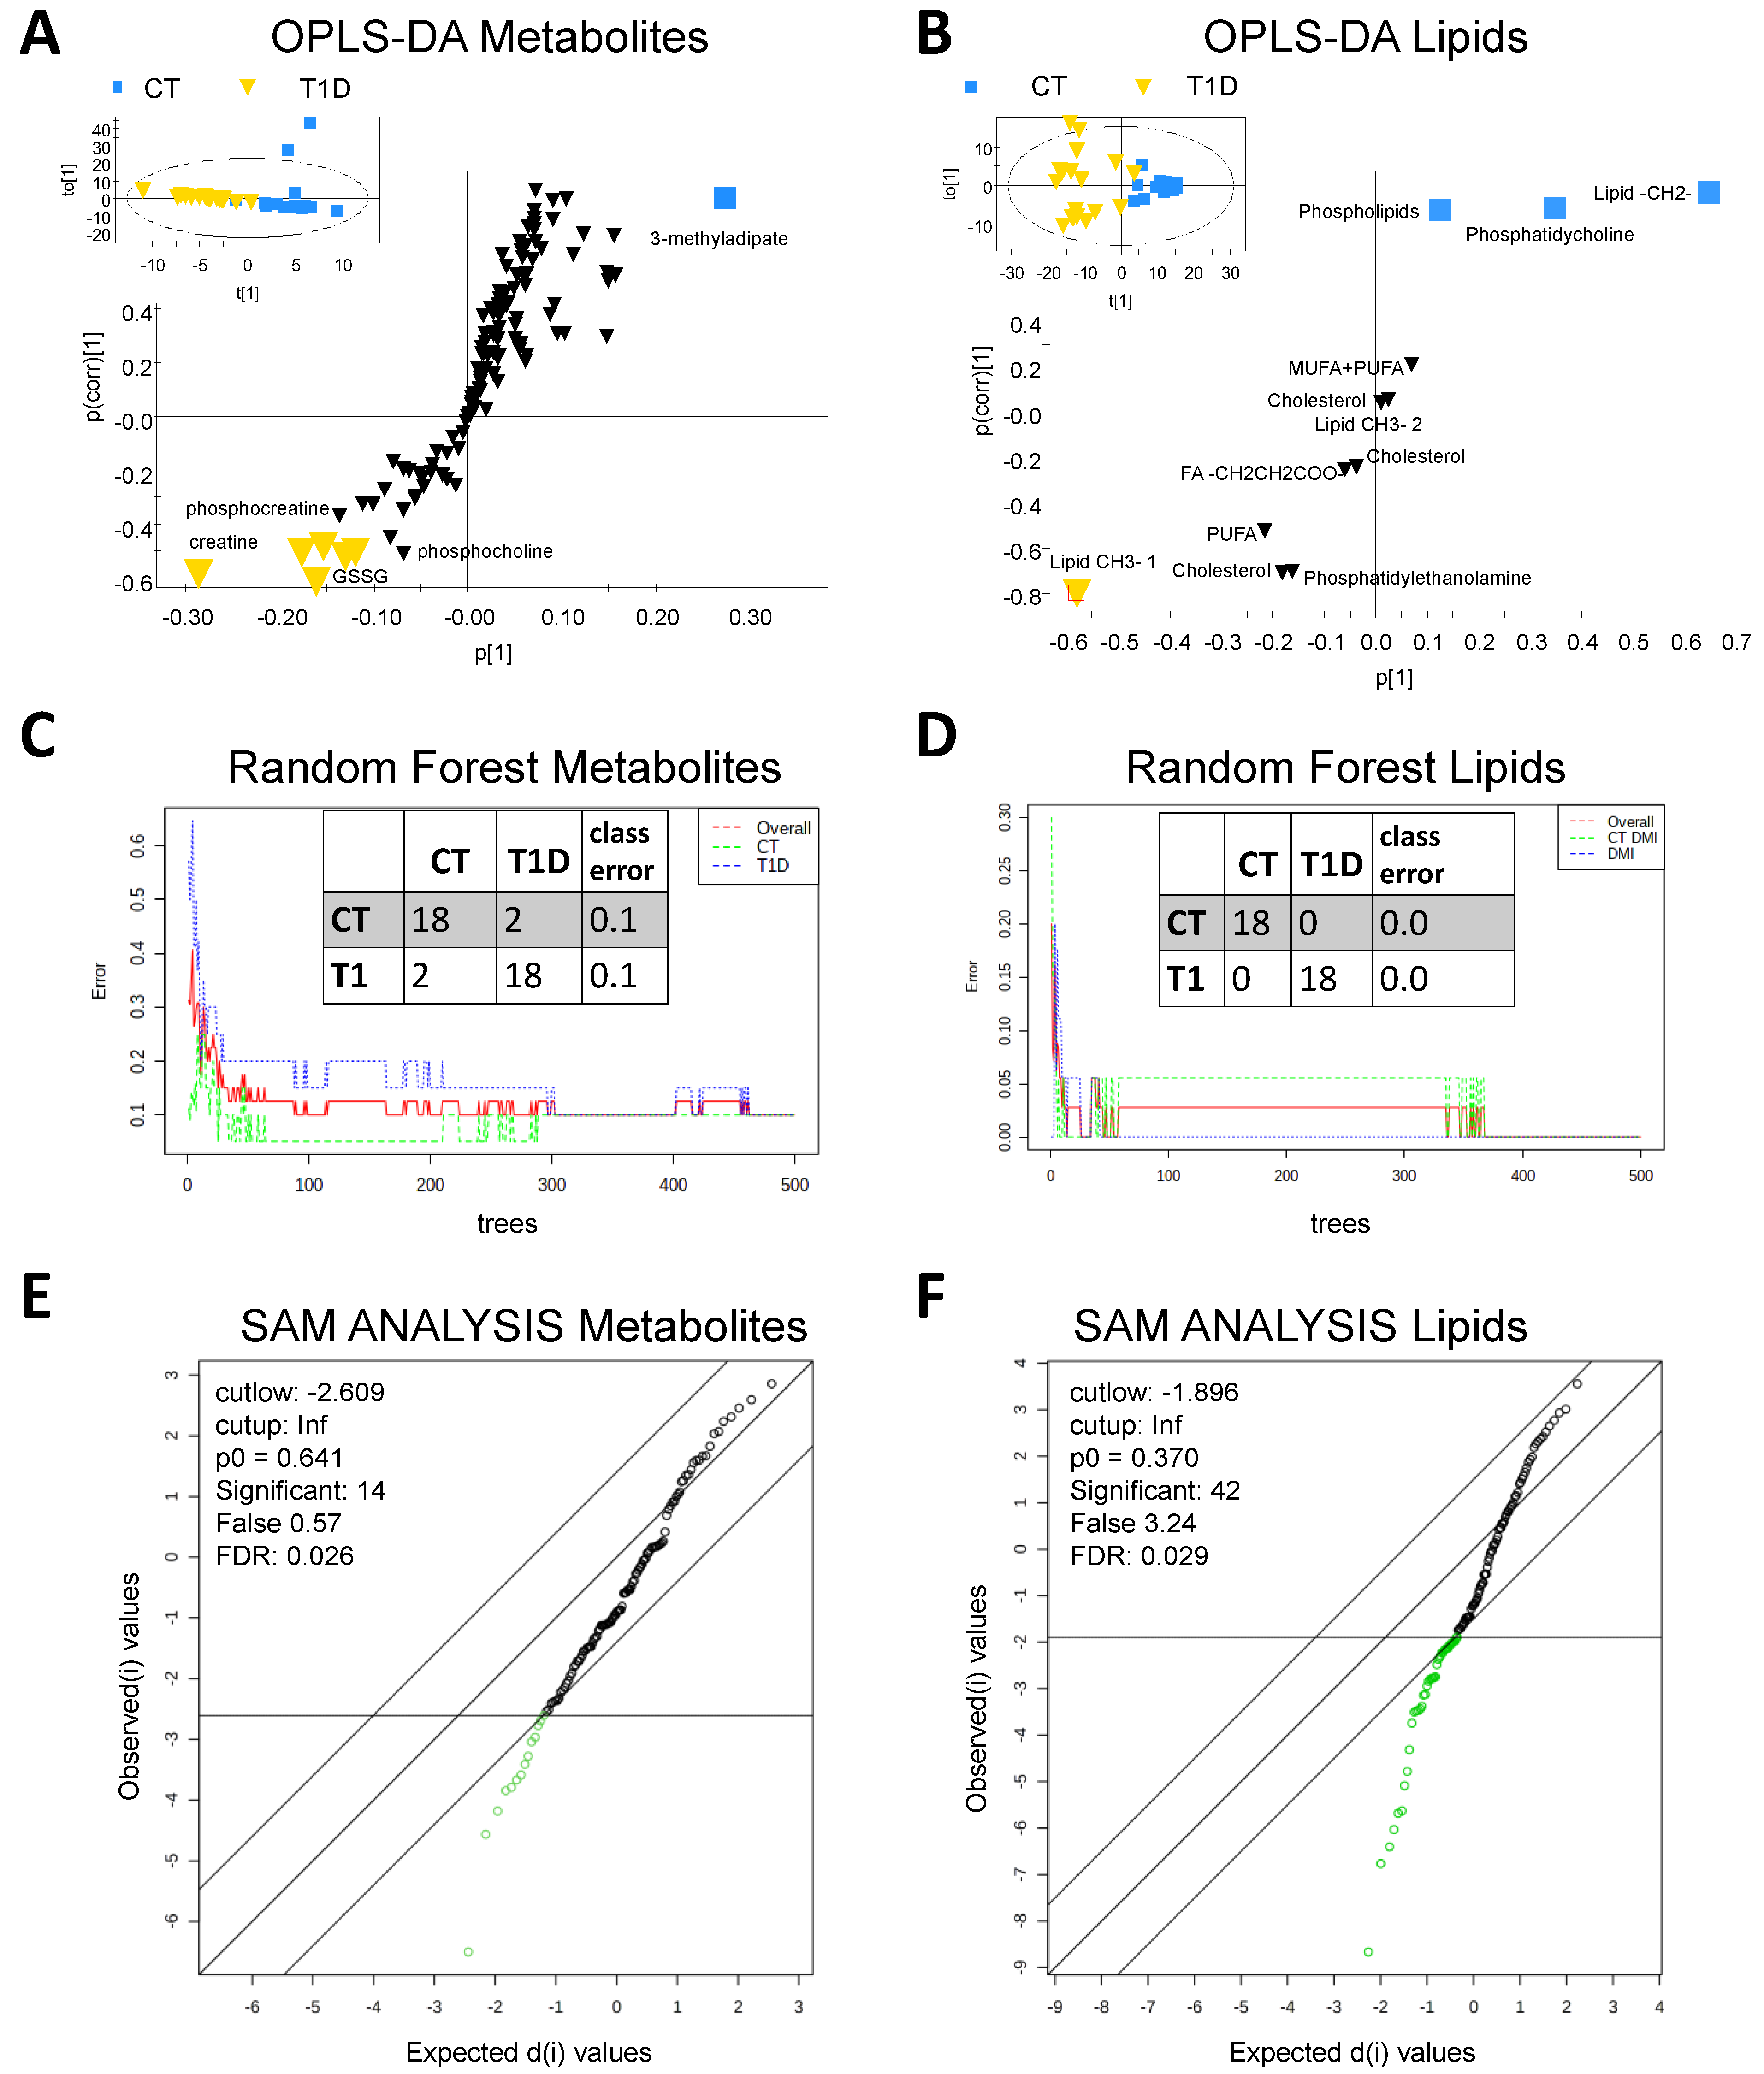
2.5. Data Analysis
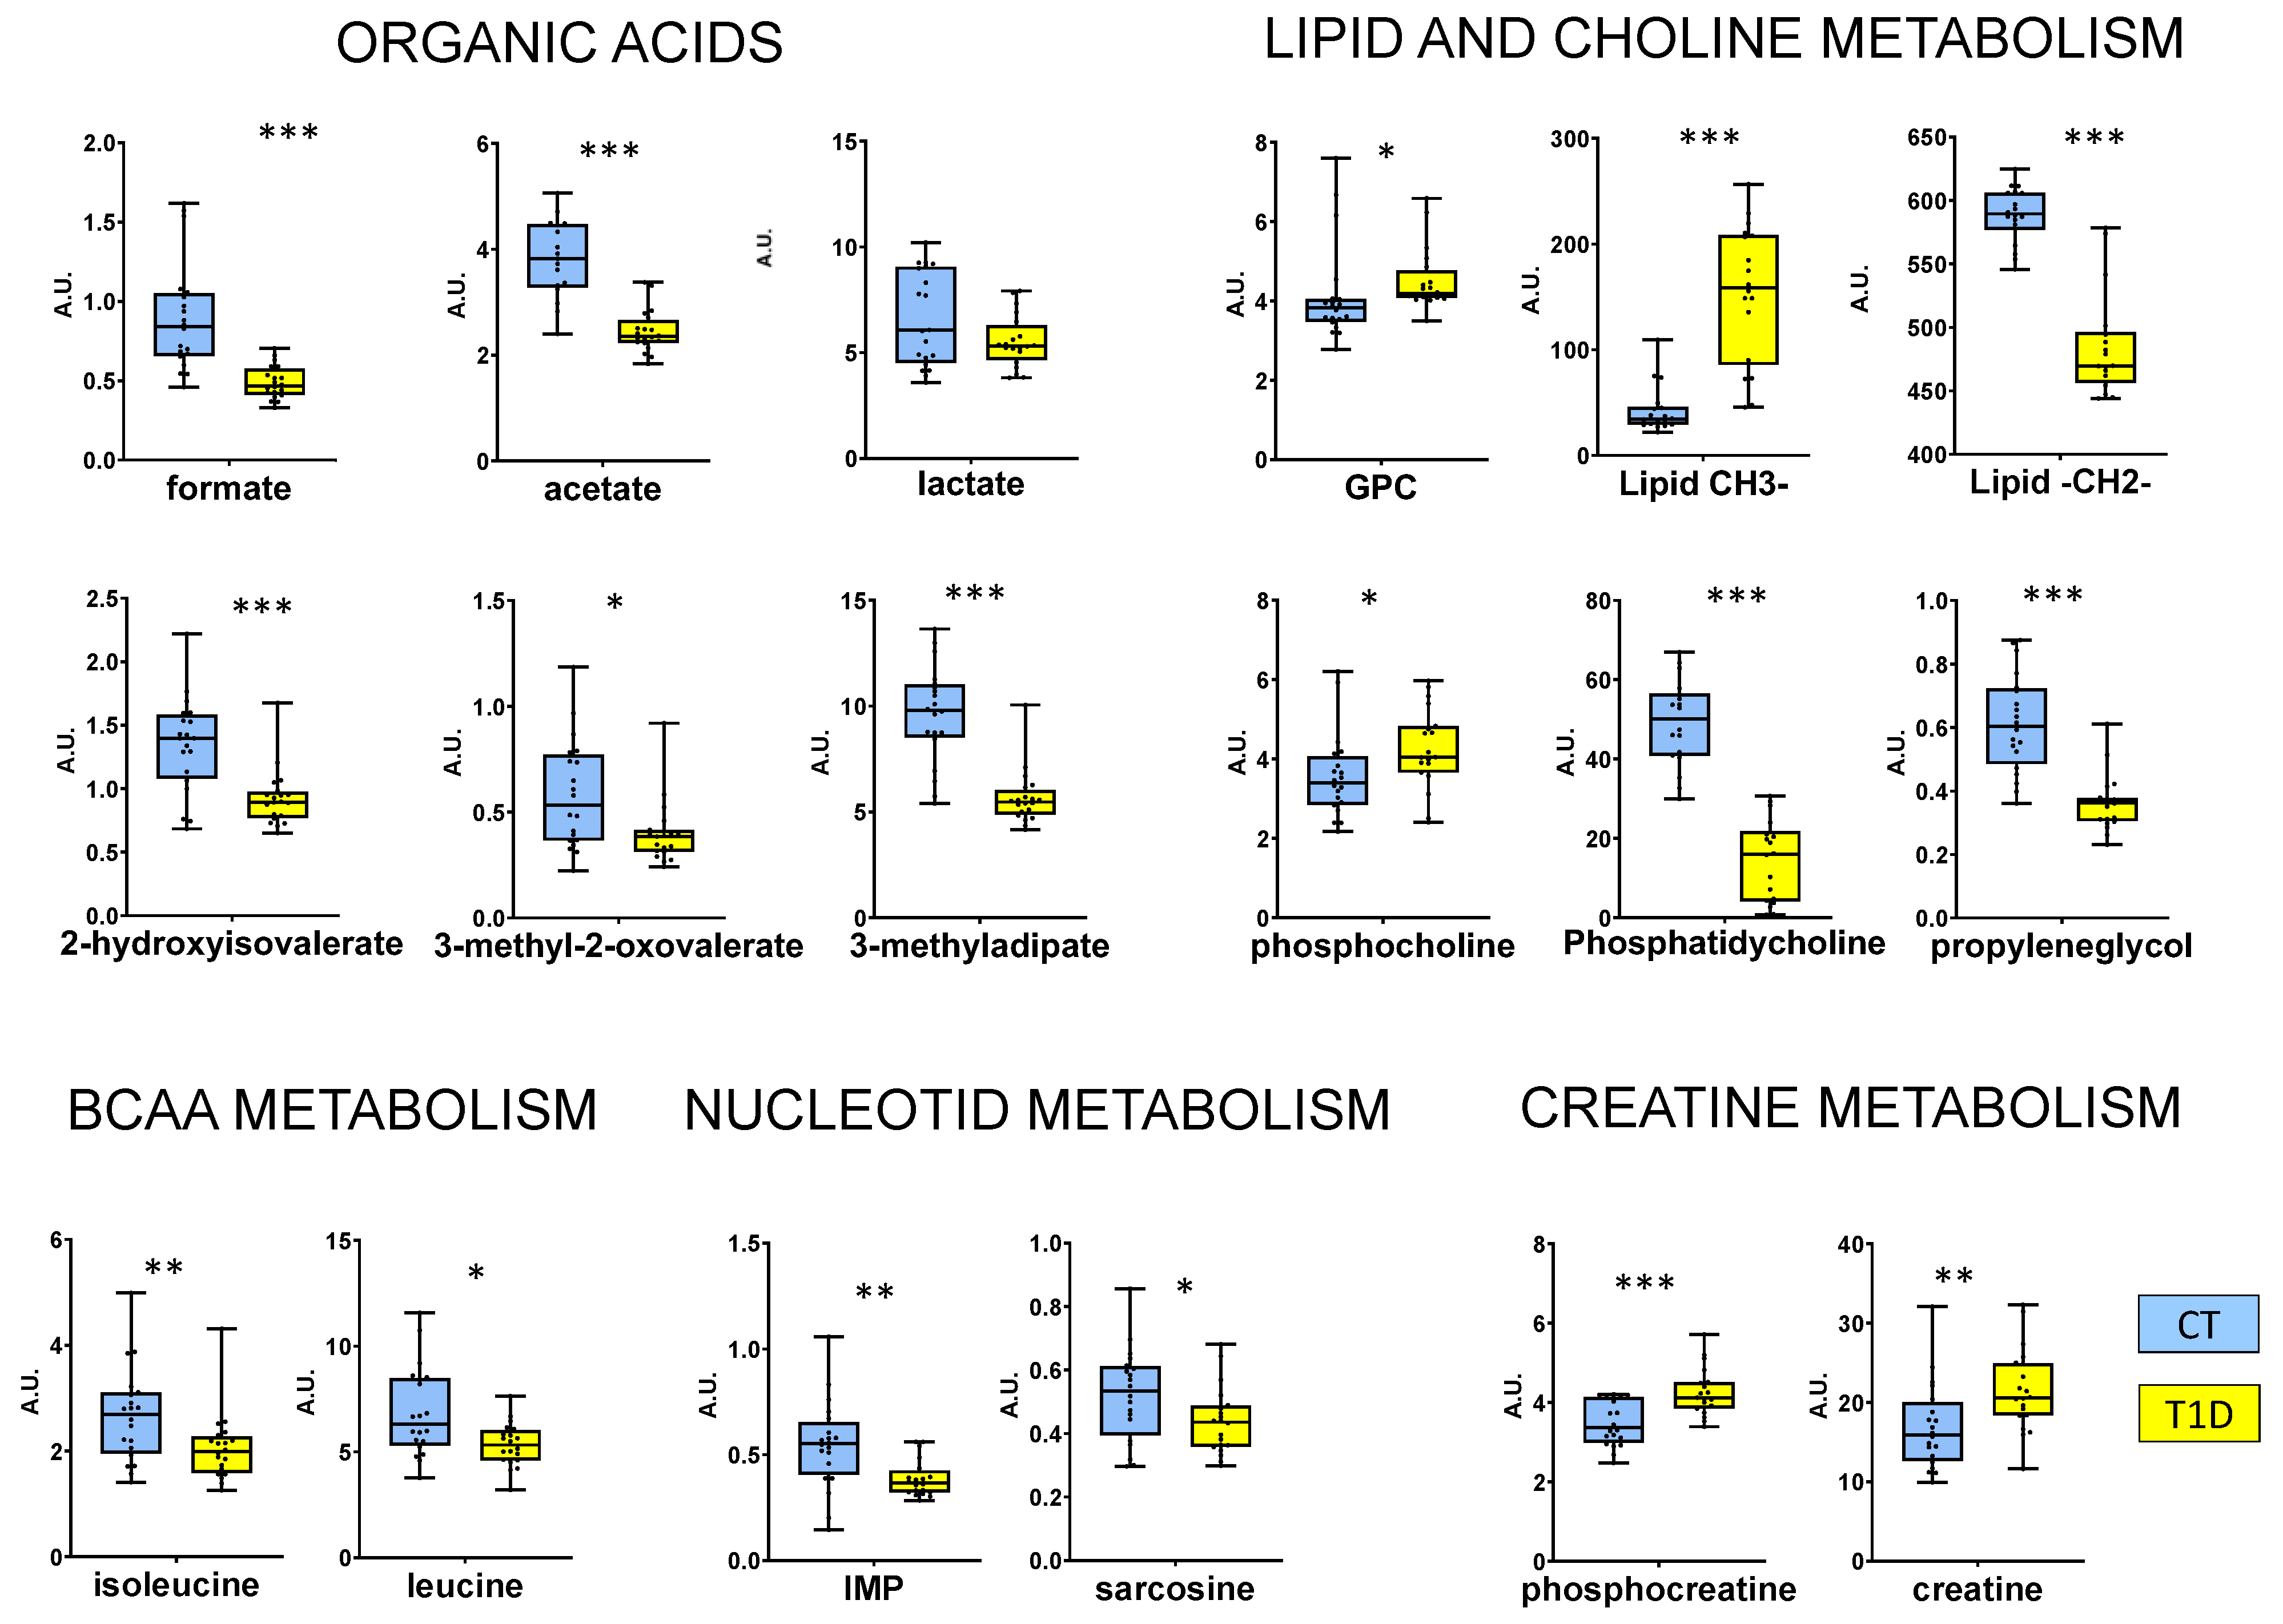
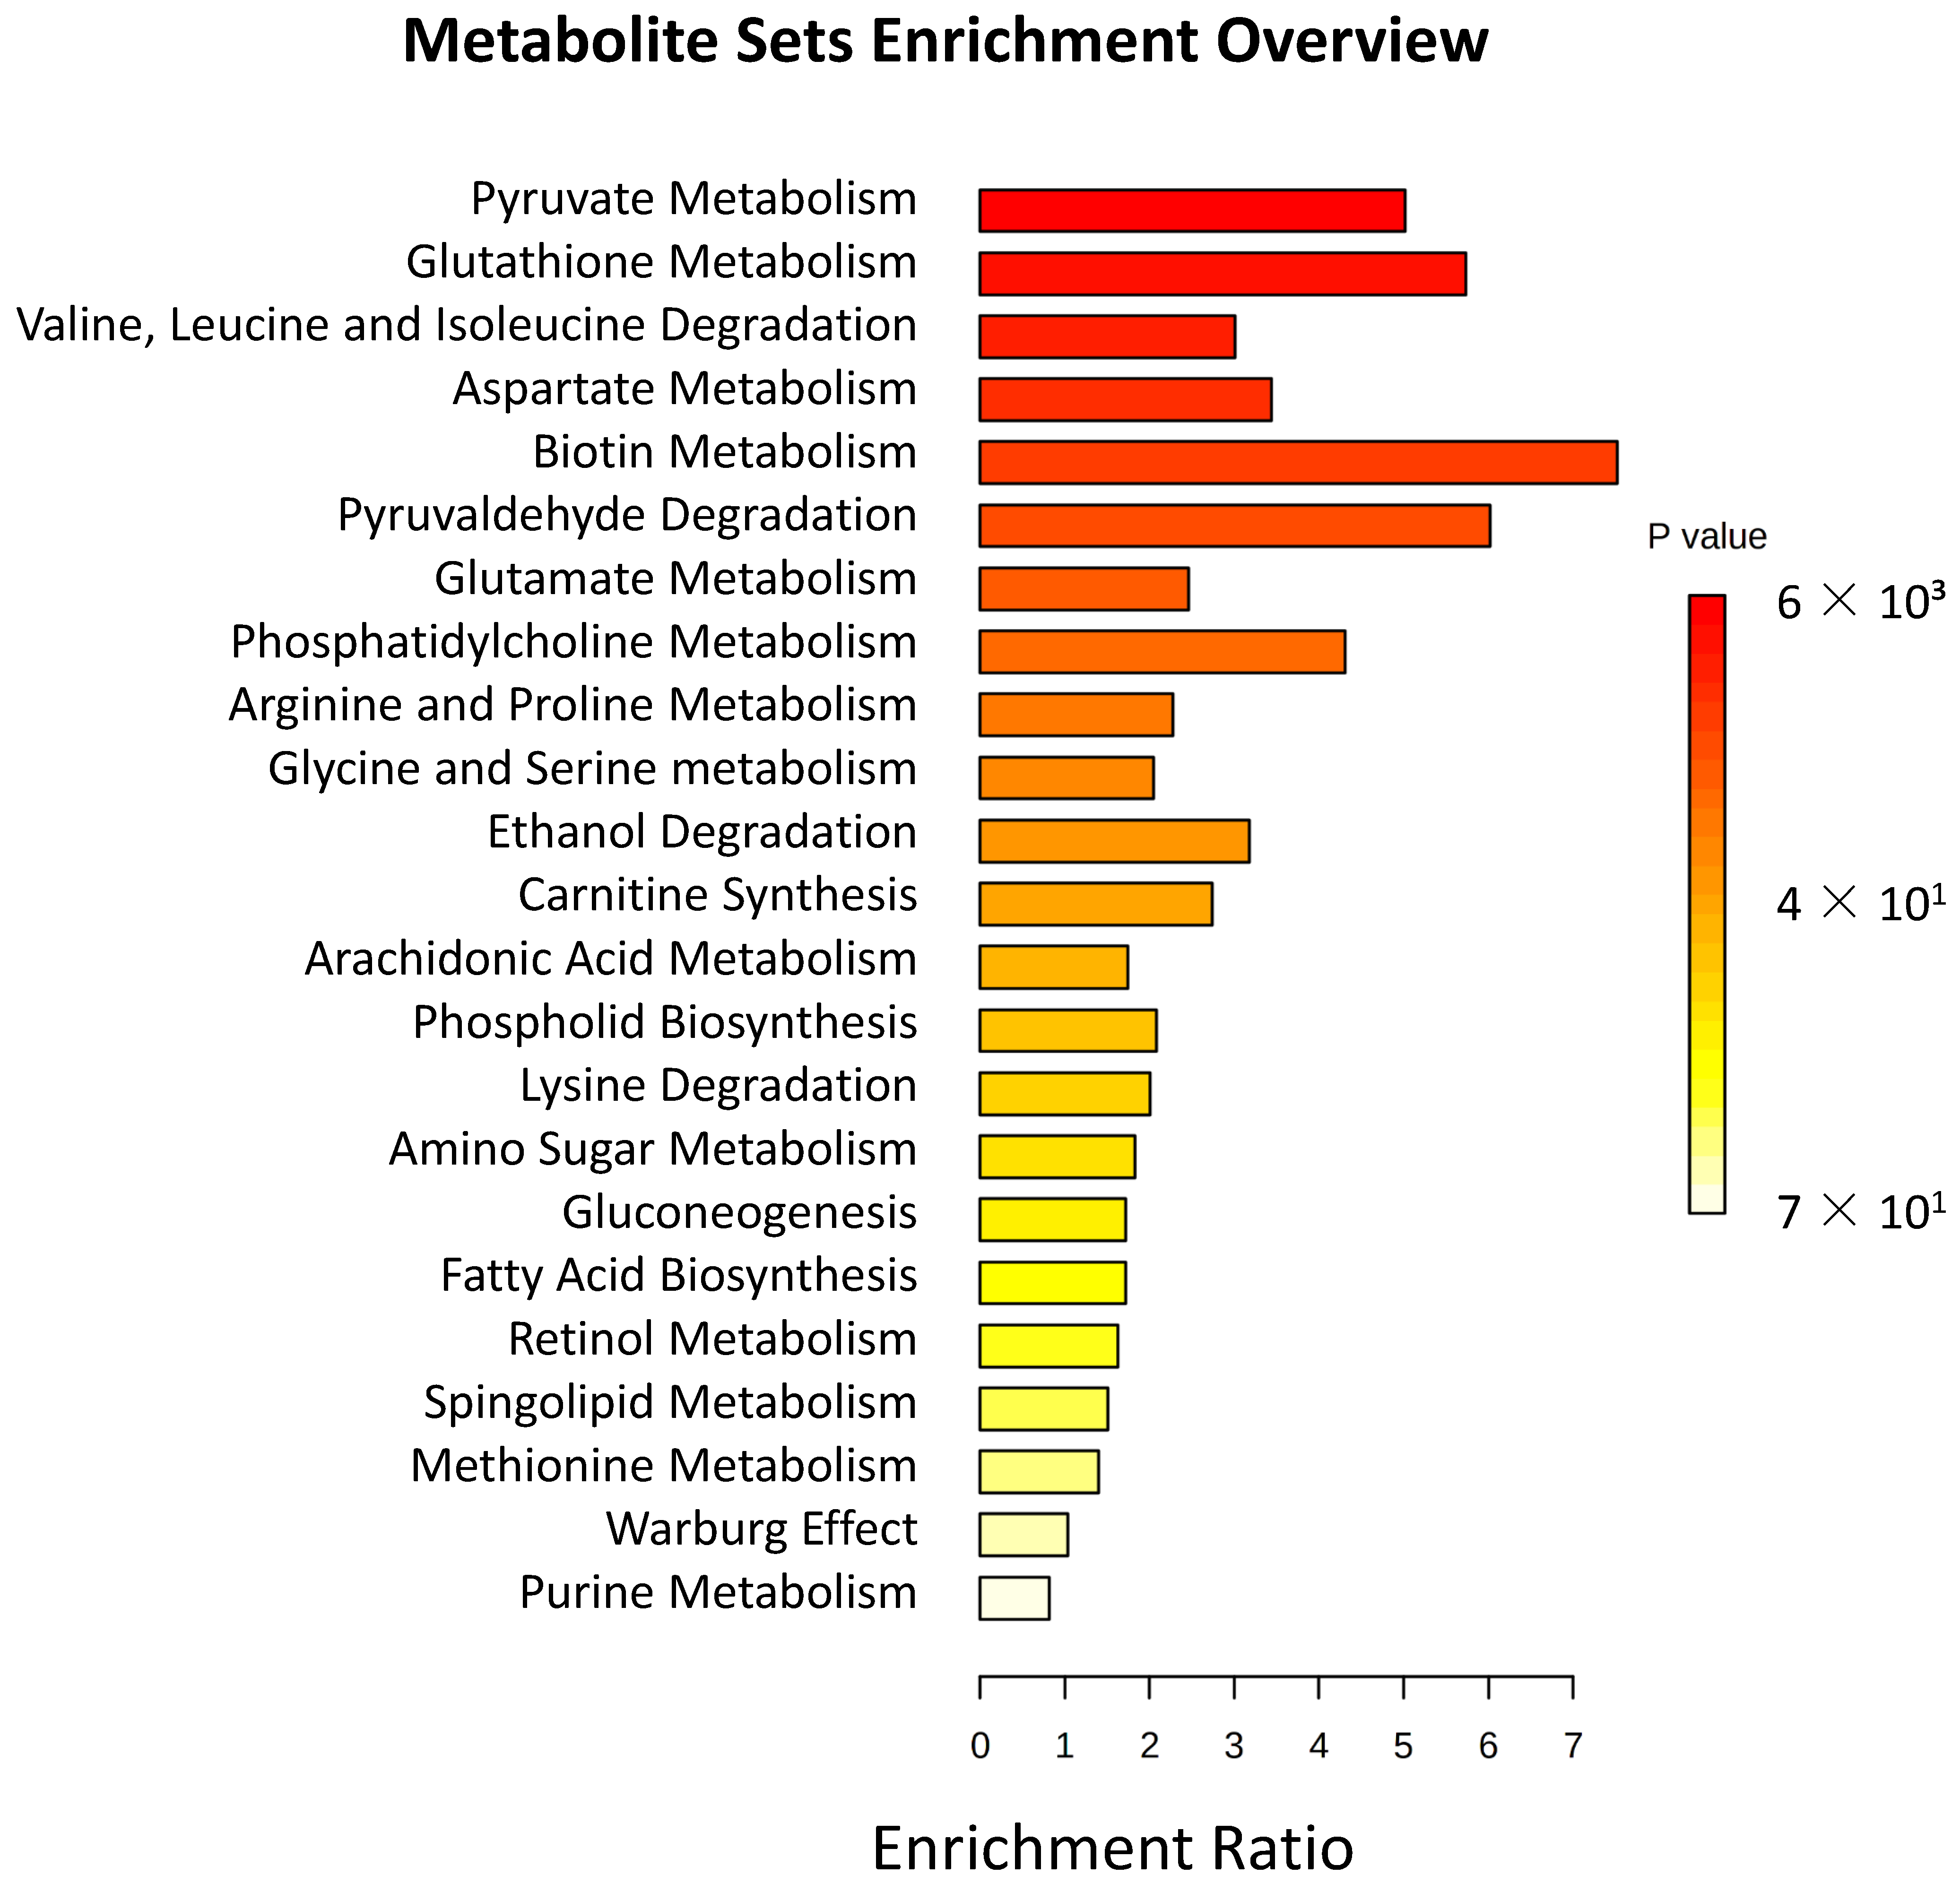
3. Results
4. Discussion
Supplementary Materials
Author Contributions
Funding
Institutional Review Board Statement
Informed Consent Statement
Data Availability Statement
Acknowledgments
Conflicts of Interest
References
- United Nations. Modalities, Format and Organization of the High-Level Meeting of the General Assembly on the Prevention and Control of Non-Communicable Diseases. Resolut. A/RES/65/238 2011, 11759, 1–4. [Google Scholar]
- Skyler, J.S.; Bakris, G.L.; Bonifacio, E.; Darsow, T.; Eckel, R.H.; Groop, L.; Groop, P.H.; Handelsman, Y.; Insel, R.A.; Mathieu, C.; et al. Differentiation of Diabetes by Pathophysiology, Natural History, and Prognosis. Diabetes 2017, 66, 241–255. [Google Scholar] [CrossRef] [PubMed] [Green Version]
- Care, D.; Suppl, S.S. Classification and Diagnosis of Diabetes: Standards of Medical Care in Diabetes-2020. Diabetes Care 2020, 43, S14–S31. [Google Scholar] [CrossRef] [Green Version]
- Soriguer, F.; Goday, A.; Bosch-Comas, A.; Bordiú, E.; Calle-Pascual, A.; Carmena, R.; Casamitjana, R.; Castaño, L.; Castell, C.; Catalá, M.; et al. Prevalence of Diabetes Mellitus and Impaired Glucose Regulation in Spain: The [email protected] Study. Diabetologia 2012, 55, 88–93. [Google Scholar] [CrossRef] [PubMed] [Green Version]
- Patterson, C.C.; Karuranga, S.; Salpea, P.; Saeedi, P.; Dahlquist, G.; Soltesz, G.; Ogle, G.D. Worldwide Estimates of Incidence, Prevalence and Mortality of Type 1 Diabetes in Children and Adolescents: Results from the International Diabetes Federation Diabetes Atlas, 9th Edition. Diabetes Res. Clin. Pract. 2019, 157, 107842. [Google Scholar] [CrossRef] [Green Version]
- Mobasseri, M.; Shirmohammadi, M.; Amiri, T.; Vahed, N.; Fard, H.H.; Ghojazadeh, M. Prevalence and Incidence of Type 1 Diabetes in the World: A Systematic Review and Meta-Analysis. Heal. Promot. Perspect. 2020, 10, 98–115. [Google Scholar] [CrossRef] [PubMed]
- Pippitt, K.; Li, M.; City, S.L.; Gurgle, U.H.E.; College, U.; City, S.L. Diabetes Mellitus: Screening and Diagnosis. Am. Fam. Phys. 2016, 93, 103–109. [Google Scholar]
- Maahs, D.M.; West, N.A.; Lawrence, J.M.; Mayer-Davis, E.J. Epidemiology of Type 1 Diabetes. Endocrinol. Metab. Clin. N. Am. 2010, 39, 481–497. [Google Scholar] [CrossRef] [Green Version]
- Roglic, G.; Norris, S.L. Medicines for Treatment Intensification in Type 2 Diabetes and Type of Insulin in Type 1 and Type 2 Diabetes in Low-Resource Settings: Synopsis of the World Health Organization Guidelines on Second- and Third-Line Medicines and Type of Insulin for the Con. Ann. Intern. Med. 2018, 169, 394–397. [Google Scholar] [CrossRef] [Green Version]
- Wolosowicz, M.; Lukaszuk, B.; Chabowski, A. The Causes of Insulin Resistance in Type 1 Diabetes Mellitus: Is There a Place for Quaternary Prevention? Int. J. Environ. Res. Public Health 2020, 17, 8651. [Google Scholar] [CrossRef]
- Gregory, J.M.; Smith, T.J.; Slaughter, J.C.; Mason, H.R.; Hughey, C.C.; Smith, M.S.; Kandasamy, B.; Greeley, S.A.W.; Philipson, L.H.; Naylor, R.N.; et al. Iatrogenic Hyperinsulinemia, Not Hyperglycemia, Drives Insulin Resistance in Type 1 Diabetes as Revealed by Comparison with GCK-MODY (MODY2). Diabetes 2019, 68, 1565–1576. [Google Scholar] [CrossRef] [Green Version]
- Rains, J.L.; Jain, S.K. Oxidative Stress, Insulin Signaling, and Diabetes. Free Radic. Biol. Med. 2011, 50, 567–575. [Google Scholar] [CrossRef] [PubMed]
- Citro, A.; Campo, F.; Dugnani, E.; Piemonti, L. Innate Immunity Mediated Inflammation and Beta Cell Function: Neighbors or Enemies? Front. Endocrinol. 2021, 11, 606332. [Google Scholar] [CrossRef]
- Eizirik, D.L.; Colli, M.L.; Ortis, F. The Role of Inflammation in Insulitis and Β-Cell Loss in Type 1 Diabetes. Nat. Rev. Endocrinol. 2009, 5, 219–226. [Google Scholar] [CrossRef]
- Tsalamandris, S.; Antonopoulos, A.S.; Oikonomou, E.; Papamikroulis, G.A.; Vogiatzi, G.; Papaioannou, S.; Deftereos, S.; Tousoulis, D. The Role of Inflammation in Diabetes: Current Concepts and Future Perspectives. Eur. Cardiol. Rev. 2019, 14, 50–59. [Google Scholar] [CrossRef] [PubMed] [Green Version]
- American Diabetes Association. ADA-Standards-of-Medical-Care-Diabetes-Care-2021; Diabetes Care; American Diabetes Association: Arlington County, VA, USA, 2021; Volume 44. [Google Scholar]
- Hare, M.J.L.; Shaw, J.E.; Zimmet, P.Z. Current Controversies in the Use of Haemoglobin A 1c. J. Intern. Med. 2012, 271, 227–236. [Google Scholar] [CrossRef]
- Alsalhi, M.S.; Devanesan, S.; Alzahrani, K.E.; Alshebly, M.; Al-Qahtani, F.; Farhat, K.; Masilamani, V. Impact of Diabetes Mellitus on Human Erythrocytes: Atomic Force Microscopy and Spectral Investigations. Int. J. Environ. Res. Public Health 2018, 15, 2368. [Google Scholar] [CrossRef] [Green Version]
- Zilberman-Kravits, D.; Harman-Boehm, I.; Shuster, T.; Meyerstein, N. Increased Red Cell Aggregation Is Correlated with HbA1C and Lipid Levels in Type 1 but Not Type 2 Diabetes. Clin. Hemorheol. Microcirc. 2006, 35, 463–471. [Google Scholar]
- Piagnerelli, M.; Zouaoui Boudjeltia, K.; Brohee, D.; Vereerstraeten, A.; Piro, P.; Vincent, J.L.; Vanhaeverbeek, M. Assessment of Erythrocyte Shape by Flow Cytometry Techniques. J. Clin. Pathol. 2007, 60, 549–554. [Google Scholar] [CrossRef] [PubMed] [Green Version]
- Sabo, A.; Jakovljević, V.; Stanulović, M.; Lepsanović, L.; Pejin, D. Red Blood Cell Deformability in Diabetes Mellitus: Effect of Phytomenadione. Int. J. Clin. Pharmacol. Ther. Toxicol. 1993, 31, 1–5. [Google Scholar] [PubMed]
- Labrouche, S.; Freyburger, G.; Gin, H.; Boisseau, M.R.; Cassagne, C. Changes in Phospholipid Composition of Blood Cell Membranes (Erythrocyte, Platelet, and Polymorphonuclear) in Different Types of Diabetes - Clinical and Biological Correlations. Metabolism 1996, 45, 57–62. [Google Scholar] [CrossRef] [PubMed]
- Dincer, Y.; Akcay, T.; Alademir, Z.; Ilkova, H. Effect of Oxidative Stress on Glutathione Pathway in Red Blood Cells from Patients with Insulin-Dependent Diabetes Mellitus. Metabolism 2002, 51, 1360–1362. [Google Scholar] [CrossRef] [PubMed]
- Petruzzi, E.; Orlando, C.; Pinzani, P.; Sestini, R.; Del Rosso, A.; Dini, G.; Tanganelli, E.; Buggiani, A.; Pazzagli, M. Adenosine Triphosphate Release by Osmotic Shock and Hemoglobin A1C in Diabetic Subjects’ Erythrocytes. Metabolism 1994, 43, 435–440. [Google Scholar] [CrossRef] [PubMed]
- Palomino-Schätzlein, M.; Lamas-Domingo, R.; Ciudin, A.; Gutiérrez-Carcedo, P.; Marés, R.; Aparicio-Gómez, C.; Hernández, C.; Simó, R.; Herance, J.R. A Translational in Vivo and in Vitro Metabolomic Study Reveals Altered Metabolic Pathways in Red Blood Cells of Type 2 Diabetes. J. Clin. Med. 2020, 9, 1619. [Google Scholar] [CrossRef]
- Domingo-Ortí, I.; Lamas-Domingo, R.; Ciudin, A.; Hernández, C.; Herance, J.R.; Palomino-Schätzlein, M.; Pineda-Lucena, A. Metabolic Footprint of Aging and Obesity in Red Blood Cells. Aging (Albany. NY). 2021, 13, 4850–4880. [Google Scholar] [CrossRef]
- Foster, D.; Karloff, H.; Shirley, K.E. How Well Does the Standard Body Mass Index or Variations with a Different Exponent Predict Human Lifespan? Obesity 2016, 24, 469–475. [Google Scholar] [CrossRef] [Green Version]
- Palomino-Schätzlein, M.; Simó, R.; Hernández, C.; Ciudin, A.; Mateos-Gregorio, P.; Hernández-Mijares, A.; Pineda-Lucena, A.; Herance, J.R. Metabolic Fingerprint of Insulin Resistance in Human Polymorphonuclear Leucocytes. PLoS ONE 2018, 13, e0199351. [Google Scholar] [CrossRef]
- Ulrich, E.L.; Akutsu, H.; Doreleijers, J.F.; Harano, Y.; Ioannidis, Y.E.; Lin, J.; Livny, M.; Mading, S.; Maziuk, D.; Miller, Z.; et al. BioMagResBank. Nucleic Acids Res. 2008, 36. [Google Scholar] [CrossRef] [Green Version]
- Wishart, D.S.; Guo, A.C.; Oler, E.; Wang, F.; Anjum, A.; Peters, H.; Dizon, R.; Sayeeda, Z.; Tian, S.; Lee, B.L.; et al. HMDB 5.0: The Human Metabolome Database for 2022. Nucleic Acids Res. 2022, 50, D622–D631. [Google Scholar] [CrossRef]
- Herance, J.R.; Ciudin, A.; Lamas-Domingo, R.; Aparicio-Gómez, C.; Hernández, C.; Simó, R.; Palomino-Schätzlein, M. Normalized NMR Integration Values from the Metabolomic and Lipidomic Analysis of Red Blood Cell Extract from Type 1 Diabetes Patients and Matched Healthy Subjects. Zenodo 2022. [Google Scholar] [CrossRef]
- Wiklund, S.; Johansson, E.; Sjöström, L.; Mellerowicz, E.J.; Edlund, U.; Shockcor, J.P.; Gottfries, J.; Moritz, T.; Trygg, J. Visualization of GC/TOF-MS-Based Metabolomics Data for Identification of Biochemically Interesting Compounds Using OPLS Class Models. Anal. Chem. 2008, 80, 115–122. [Google Scholar] [CrossRef] [PubMed]
- Eriksson, L.; Trygg, J.; Svante, W. CV-ANOVA for Significance Testing of PLS and OPLS® Models. J. Chemom. 2008, 22, 11–12. [Google Scholar] [CrossRef]
- Pang, Z.; Chong, J.; Zhou, G.; De Lima Morais, D.A.; Chang, L.; Barrette, M.; Gauthier, C.; Jacques, P.É.; Li, S.; Xia, J. MetaboAnalyst 5.0: Narrowing the Gap between Raw Spectra and Functional Insights. Nucleic Acids Res. 2021, 49, W388–W396. [Google Scholar] [CrossRef] [PubMed]
- Schwender, H.; Ickstadt, K. Empirical Bayes Analysis of Single Nucleotide Polymorphisms. BMC Bioinform. 2008, 9, 144. [Google Scholar] [CrossRef] [PubMed] [Green Version]
- Liaw, A.; Wiener, M. Classication and Regression by RandomForest. R News 2002, 2, 18–22. [Google Scholar]
- Guo, X.; Li, H.; Xu, H.; Woo, S.; Dong, H.; Lu, F.; Lange, A.J.; Wu, C. Glycolysis in the Control of Blood Glucose Homeostasis. Acta Pharm. Sin. B 2012, 2, 358–367. [Google Scholar] [CrossRef] [Green Version]
- Akanji, A.O.; Humphreys, S.; Thursfield, V.; Hockaday, T.D.R. The Relationship of Plasma Acetate with Glucose and Other Blood Intermediary Metabolites in Non-Diabetic and Diabetic Subjects. Clin. Chim. Acta 1989, 185, 25–34. [Google Scholar] [CrossRef]
- Ibrahim, S.I.; Amodu, A.D.; Ene-Ojo, A.S.; Ismaila, U.A.; Fakhruddeen, M. Effect of Hyperglycemia on Erythrocyte Carbonic Anhydrase and Lactic Acid in Type II Diabetic Subjects. J. Diabetes Mellit. 2016, 06, 158–165. [Google Scholar] [CrossRef] [Green Version]
- Davis, J. What Are Leucine and Isoleucine? News Med. Life Sci. 2019, 1–4. [Google Scholar]
- Mochida, T.; Tanaka, T.; Shiraki, Y.; Tajiri, H.; Matsumoto, S.; Shimbo, K.; Ando, T.; Nakamura, K.; Okamoto, M.; Endo, F. Time-Dependent Changes in the Plasma Amino Acid Concentration in Diabetes Mellitus. Mol. Genet. Metab. 2011, 103, 406–409. [Google Scholar] [CrossRef]
- Holeček, M. Why Are Branched-Chain Amino Acids Increased in Starvation and Diabetes? Nutrients 2020, 12, 3087. [Google Scholar] [CrossRef]
- Hameed, A.; Mojsak, P.; Buczynska, A.; Suleria, H.A.R.; Kretowski, A.; Ciborowski, M. Altered Metabolome of Lipids and Amino Acids Species: A Source of Early Signature Biomarkers of T2DM. J. Clin. Med. 2020, 9, 2257. [Google Scholar] [CrossRef]
- Seibert, R.; Abbasi, F.; Hantash, F.M.; Caulfield, M.P.; Reaven, G.; Kim, S.H. Relationship between Insulin Resistance and Amino Acids in Women and Men. Physiol. Soc. 2015, 3, e12392. [Google Scholar] [CrossRef] [PubMed]
- Post, A.; Groothof, D.; Schutten, J.C.; Flores-Guerrero, J.L.; Swarte, J.C.; Douwes, R.M.; Kema, I.P.; de Boer, R.A.; Garcia, E.; Connelly, M.A.; et al. Plasma Creatine and Incident Type 2 Diabetes in a General Population-Based Cohort: The PREVEND Study. Clin. Endocrinol. 2021, 94, 563–574. [Google Scholar] [CrossRef]
- Tullson, P.C.; Bangsbo, J.; Hellsten, Y.; Richter, E.A. IMP Metabolism in Human Skeletal Muscle after Exhaustive Exercise. J. Appl. Physiol. 1995, 78, 146–152. [Google Scholar] [CrossRef]
- Darmaun, D.; Smith, S.D.; Sweeten, S.; Sager, B.K.; Welch, S.; Mauras, N. Evidence for Accelerated Rates of Glutathione Utilization and Glutathione Depletion in Adolescents with Poorly Controlled Type 1 Diabetes. Diabetes 2005, 54, 190–196. [Google Scholar] [CrossRef] [PubMed] [Green Version]
- Lorenzo-Medina, M.; Uranga, B.; Rus, A.; Martínez, R.; Puertas, C.; Blanco, M.D.; Casís, E.; Corcoy, R. Sex and Age Affect Agreement between Fasting Plasma Glucose and Glycosylated Hemoglobin for Diagnosis of Dysglycemia. Endocrinol. Diabetes y Nutr. 2017, 64, 345–354. [Google Scholar] [CrossRef] [PubMed]
- Ahmed, R.G. The Physiological and Biochemical Effects of Diabetes on the Balance between Oxidative Stress and Antioxidant Defense System. Med. J. Islam. World Acad. Sci. 2005, 15, 32–42. [Google Scholar]
- Sender, R.; Fuchs, S.; Milo, R. Revised Estimates for the Number of Human and Bacteria Cells in the Body. PLoS Biol. 2016, 14, e1002533. [Google Scholar] [CrossRef] [Green Version]
- Murakami, K.; Ohtsuka, Y.; Fujiwara, Y.; Shimada, M. Impairment of Glutathione Metabolism in Erythrocytes With Diabetes Mellitus. National Library of Medicine 1989, 38, 753–758. [Google Scholar] [CrossRef]
- Ciuchi, E.; Odetti, P.; Prando, R. Relationship Between Glutathione and Sorbitol Concentrations in Erythrocytes From Diabetic Patients. Metabolism 1996, 45, 611–613. [Google Scholar] [CrossRef]
- Sung, K.C.; Lee, M.Y.; Lee, J.Y.; Lee, S.H.; Kim, S.H.; Kim, S.H. Utility of ALT Concentration in Men and Women with Nonalcoholic Fatty Liver Disease: Cohort Study. J. Clin. Med. 2019, 8, 445. [Google Scholar] [CrossRef] [Green Version]
- Sakhi, A.K.; Berg, T.J. Reduced Glutathione Concentrations Are Not Decreased in Red Blood Cells of Patients with Long Term Type 1-Diabetes. Scand. J. Clin. Lab. Invest. 2011, 71, 108–111. [Google Scholar] [CrossRef]
- Płoszczyca, K.; Czuba, M.; Chalimoniuk, M.; Gajda, R.; Baranowski, M. Red Blood Cell 2,3-Diphosphoglycerate Decreases in Response to a 30 Km Time Trial Under Hypoxia in Cyclists. Front. Physiol. 2021, 12. [Google Scholar] [CrossRef]
- Bucala, R.; Makita, Z.; Vega, G.; Grundy, S.; Koschinsky, T.; Cerami, A.; Vlassara, H. Modification of Low Density Lipoprotein by Advanced Glycation End Products Contributes to the Dyslipidemia of Diabetes and Renal Insufficiency. Proc. Natl. Acad. Sci. USA 1994, 91, 9441–9445. [Google Scholar] [CrossRef] [PubMed] [Green Version]
- Murfitt, S.A.; Zaccone, P.; Wang, X.; Acharjee, A.; Sawyer, Y.; Koulman, A.; Roberts, L.D.; Cooke, A.; Griffin, J.L. Metabolomics and Lipidomics Study of Mouse Models of Type 1 Diabetes Highlights Divergent Metabolism in Purine and Tryptophan Metabolism Prior to Disease Onset. J. Proteome Res. 2018, 17, 946–960. [Google Scholar] [CrossRef]
- Vergès, B. Lipid Disorders in Type 1 Diabetes. Diabetes Metab. 2009, 35, 353–360. [Google Scholar] [CrossRef] [PubMed]
- Jones, A.R.; Coleman, E.L.; Husni, N.R.; Deeney, J.T.; Raval, F.; Steenkamp, D.; Dooms, H.; Nikolajczyk, B.S.; Corkey, B.E. Type 1 Diabetes Alters Lipid Handling and Metabolism in Human Fibroblasts and Peripheral Blood Mononuclear Cells. PLoS ONE 2017, 12, e0188474. [Google Scholar] [CrossRef] [Green Version]
- Ritchie, R.H.; Zerenturk, E.J.; Prakoso, D.; Calkin, A.C. Lipid Metabolism and Its Implications for Type 1 Diabetes-Associated Cardiomyopathy. J. Mol. Endocrinol. 2017, 58, R225–R240. [Google Scholar] [CrossRef] [PubMed]


| T1D | CT | p | |
|---|---|---|---|
| Age (years) | 32.3 ± 1.6 | 33.0 ± 2.4 | 0.821 |
| Gender F/M | 8/12 | 8/12 | - |
| HbA1c (DCCT%) | 8.00 ± 0.29 | 5.12 ± 0.06 | <0.001 |
| Glucose (mg/dL) | 168.7 ± 18.3 | 82.4 ± 2.2 | <0.001 |
| BMI (kg/m2) | 24.1 ± 1.0 | 23.4 ± 0.8 | 0.604 |
| Cholesterol (mg/dL) | 187 ± 10 | 185 ± 7 | 0.892 |
| HDL (mg/dL) | 57 ± 3 | 60 ± 3 | 0.440 |
| LDL (mg/dL) | 116 ± 9 | 109 ± 6 | 0.525 |
| Triacylglycerides (mg/dL) | 75 ± 9 | 84 ± 9 | 0.483 |
Disclaimer/Publisher’s Note: The statements, opinions and data contained in all publications are solely those of the individual author(s) and contributor(s) and not of MDPI and/or the editor(s). MDPI and/or the editor(s) disclaim responsibility for any injury to people or property resulting from any ideas, methods, instructions or products referred to in the content. |
© 2023 by the authors. Licensee MDPI, Basel, Switzerland. This article is an open access article distributed under the terms and conditions of the Creative Commons Attribution (CC BY) license (https://creativecommons.org/licenses/by/4.0/).
Share and Cite
Herance, J.R.; Ciudin, A.; Lamas-Domingo, R.; Aparicio-Gómez, C.; Hernández, C.; Simó, R.; Palomino-Schätzlein, M. The Footprint of Type 1 Diabetes on Red Blood Cells: A Metabolomic and Lipidomic Study. J. Clin. Med. 2023, 12, 556. https://doi.org/10.3390/jcm12020556
Herance JR, Ciudin A, Lamas-Domingo R, Aparicio-Gómez C, Hernández C, Simó R, Palomino-Schätzlein M. The Footprint of Type 1 Diabetes on Red Blood Cells: A Metabolomic and Lipidomic Study. Journal of Clinical Medicine. 2023; 12(2):556. https://doi.org/10.3390/jcm12020556
Chicago/Turabian StyleHerance, José Raul, Andreea Ciudin, Rubén Lamas-Domingo, Carolina Aparicio-Gómez, Cristina Hernández, Rafael Simó, and Martina Palomino-Schätzlein. 2023. "The Footprint of Type 1 Diabetes on Red Blood Cells: A Metabolomic and Lipidomic Study" Journal of Clinical Medicine 12, no. 2: 556. https://doi.org/10.3390/jcm12020556