
The Diagnostic Yield of Implantable Loop Recorders Stratified by Indication: A “Real-World” Single-Center Experience


 , , , , , and
Abstract
1. Introduction
2. Materials and Methods
2.1. Patient Population, Data Collection, and Definition Adopted
2.2. Device Implantation and Remote Control
2.3. Follow-Up
2.4. Statistical Analysis
3. Results
3.1. Patient Characteristics
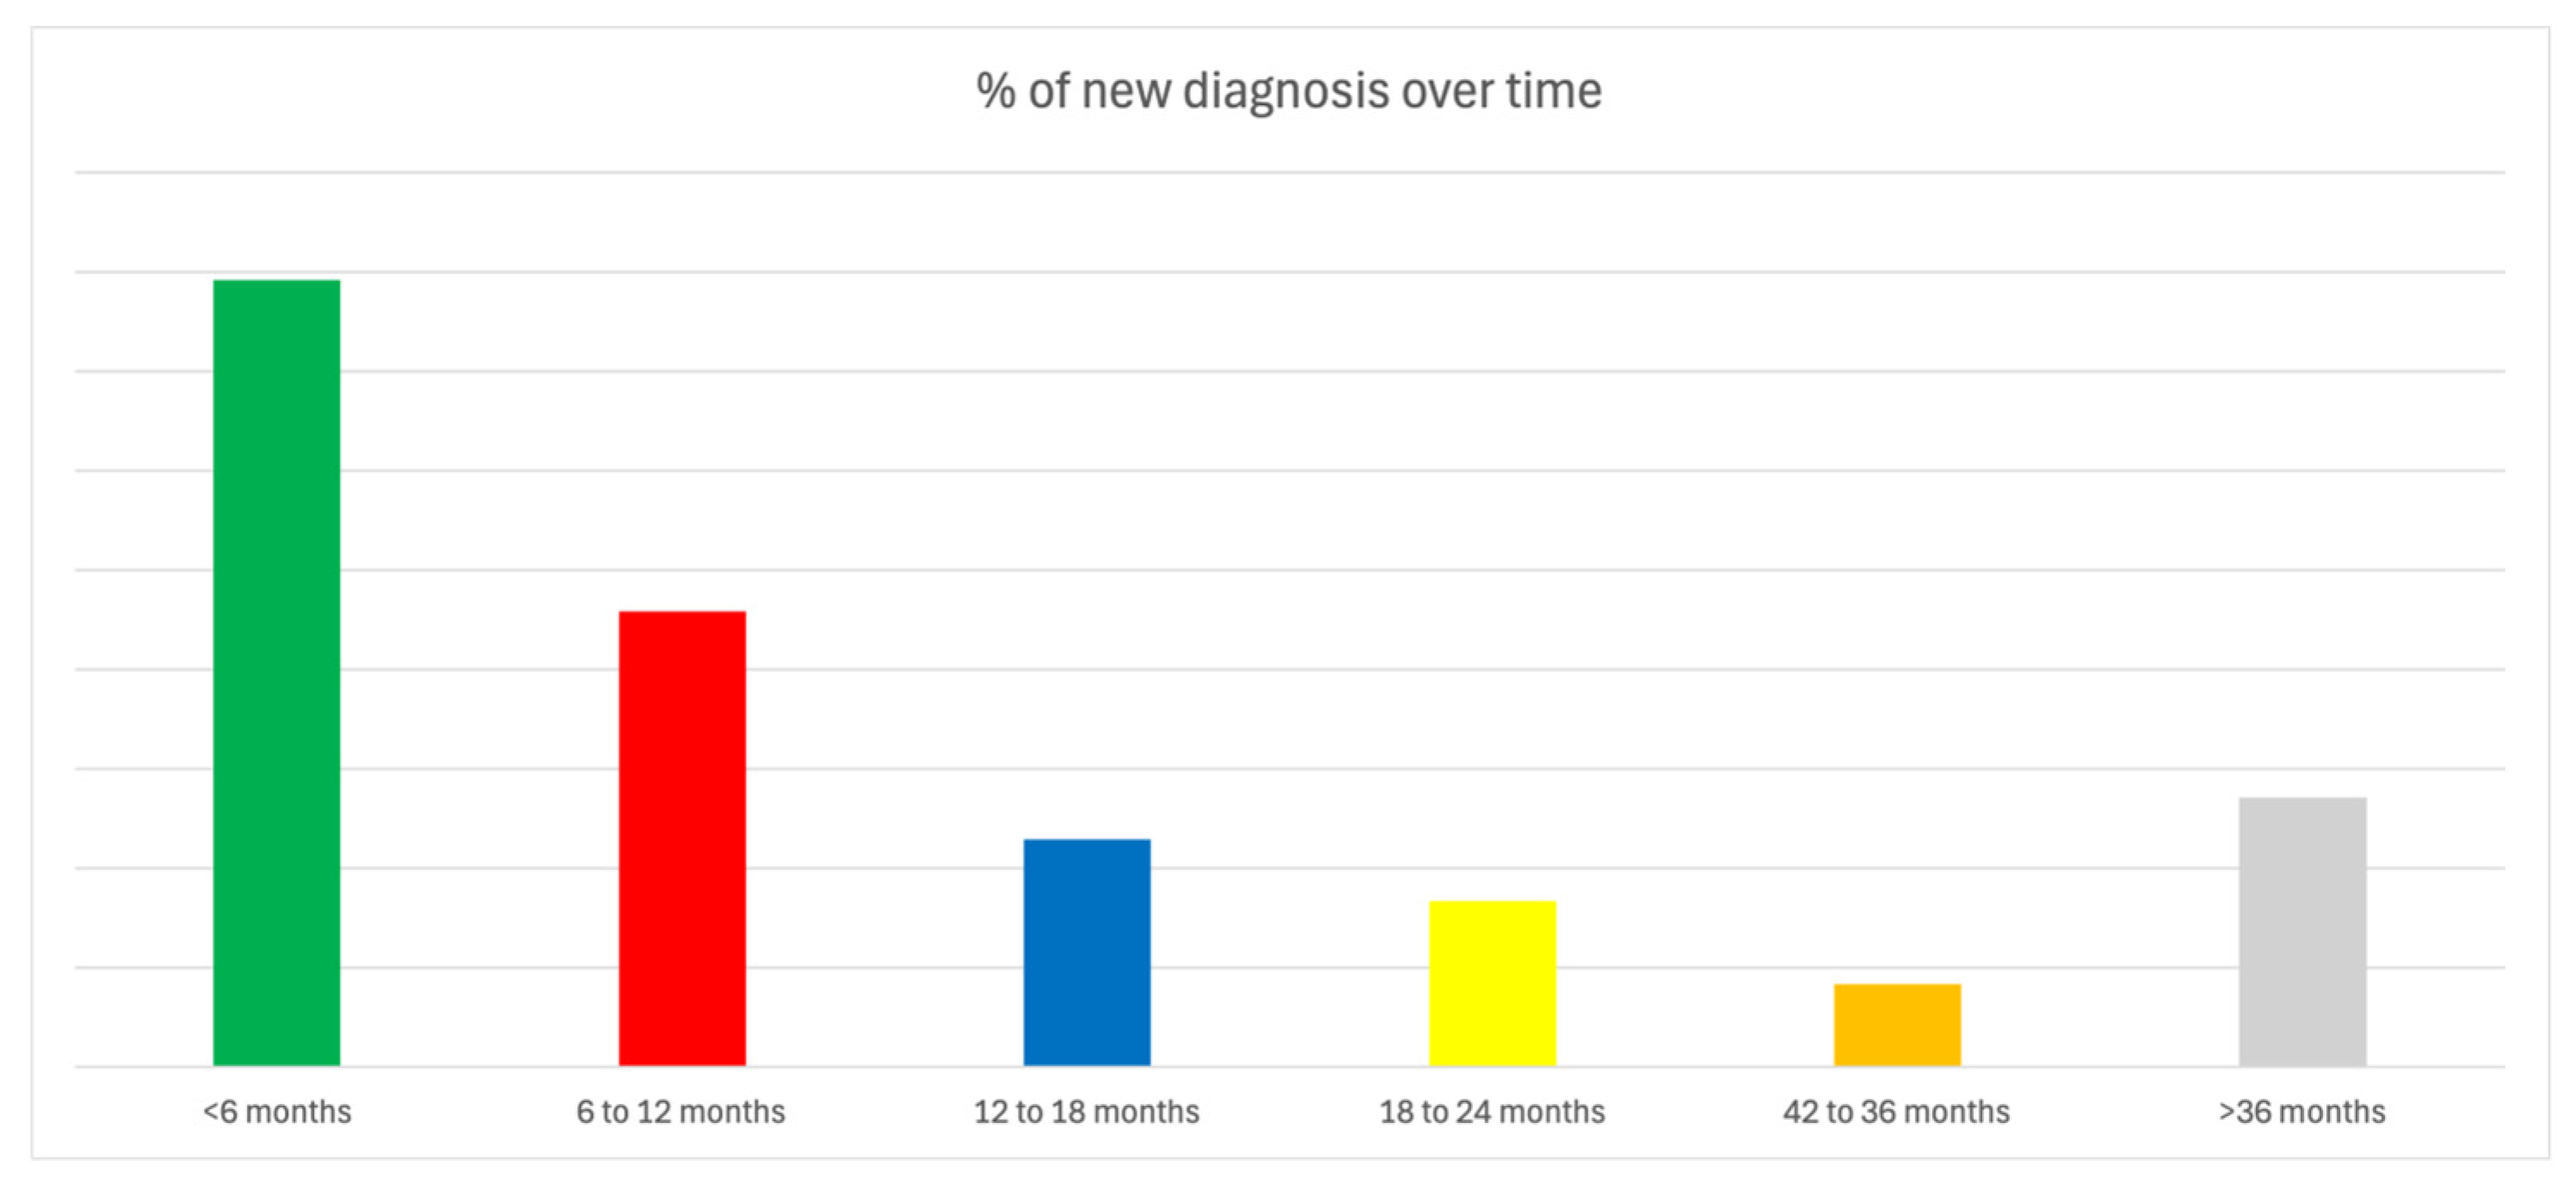
3.2. Diagnostic Outcomes
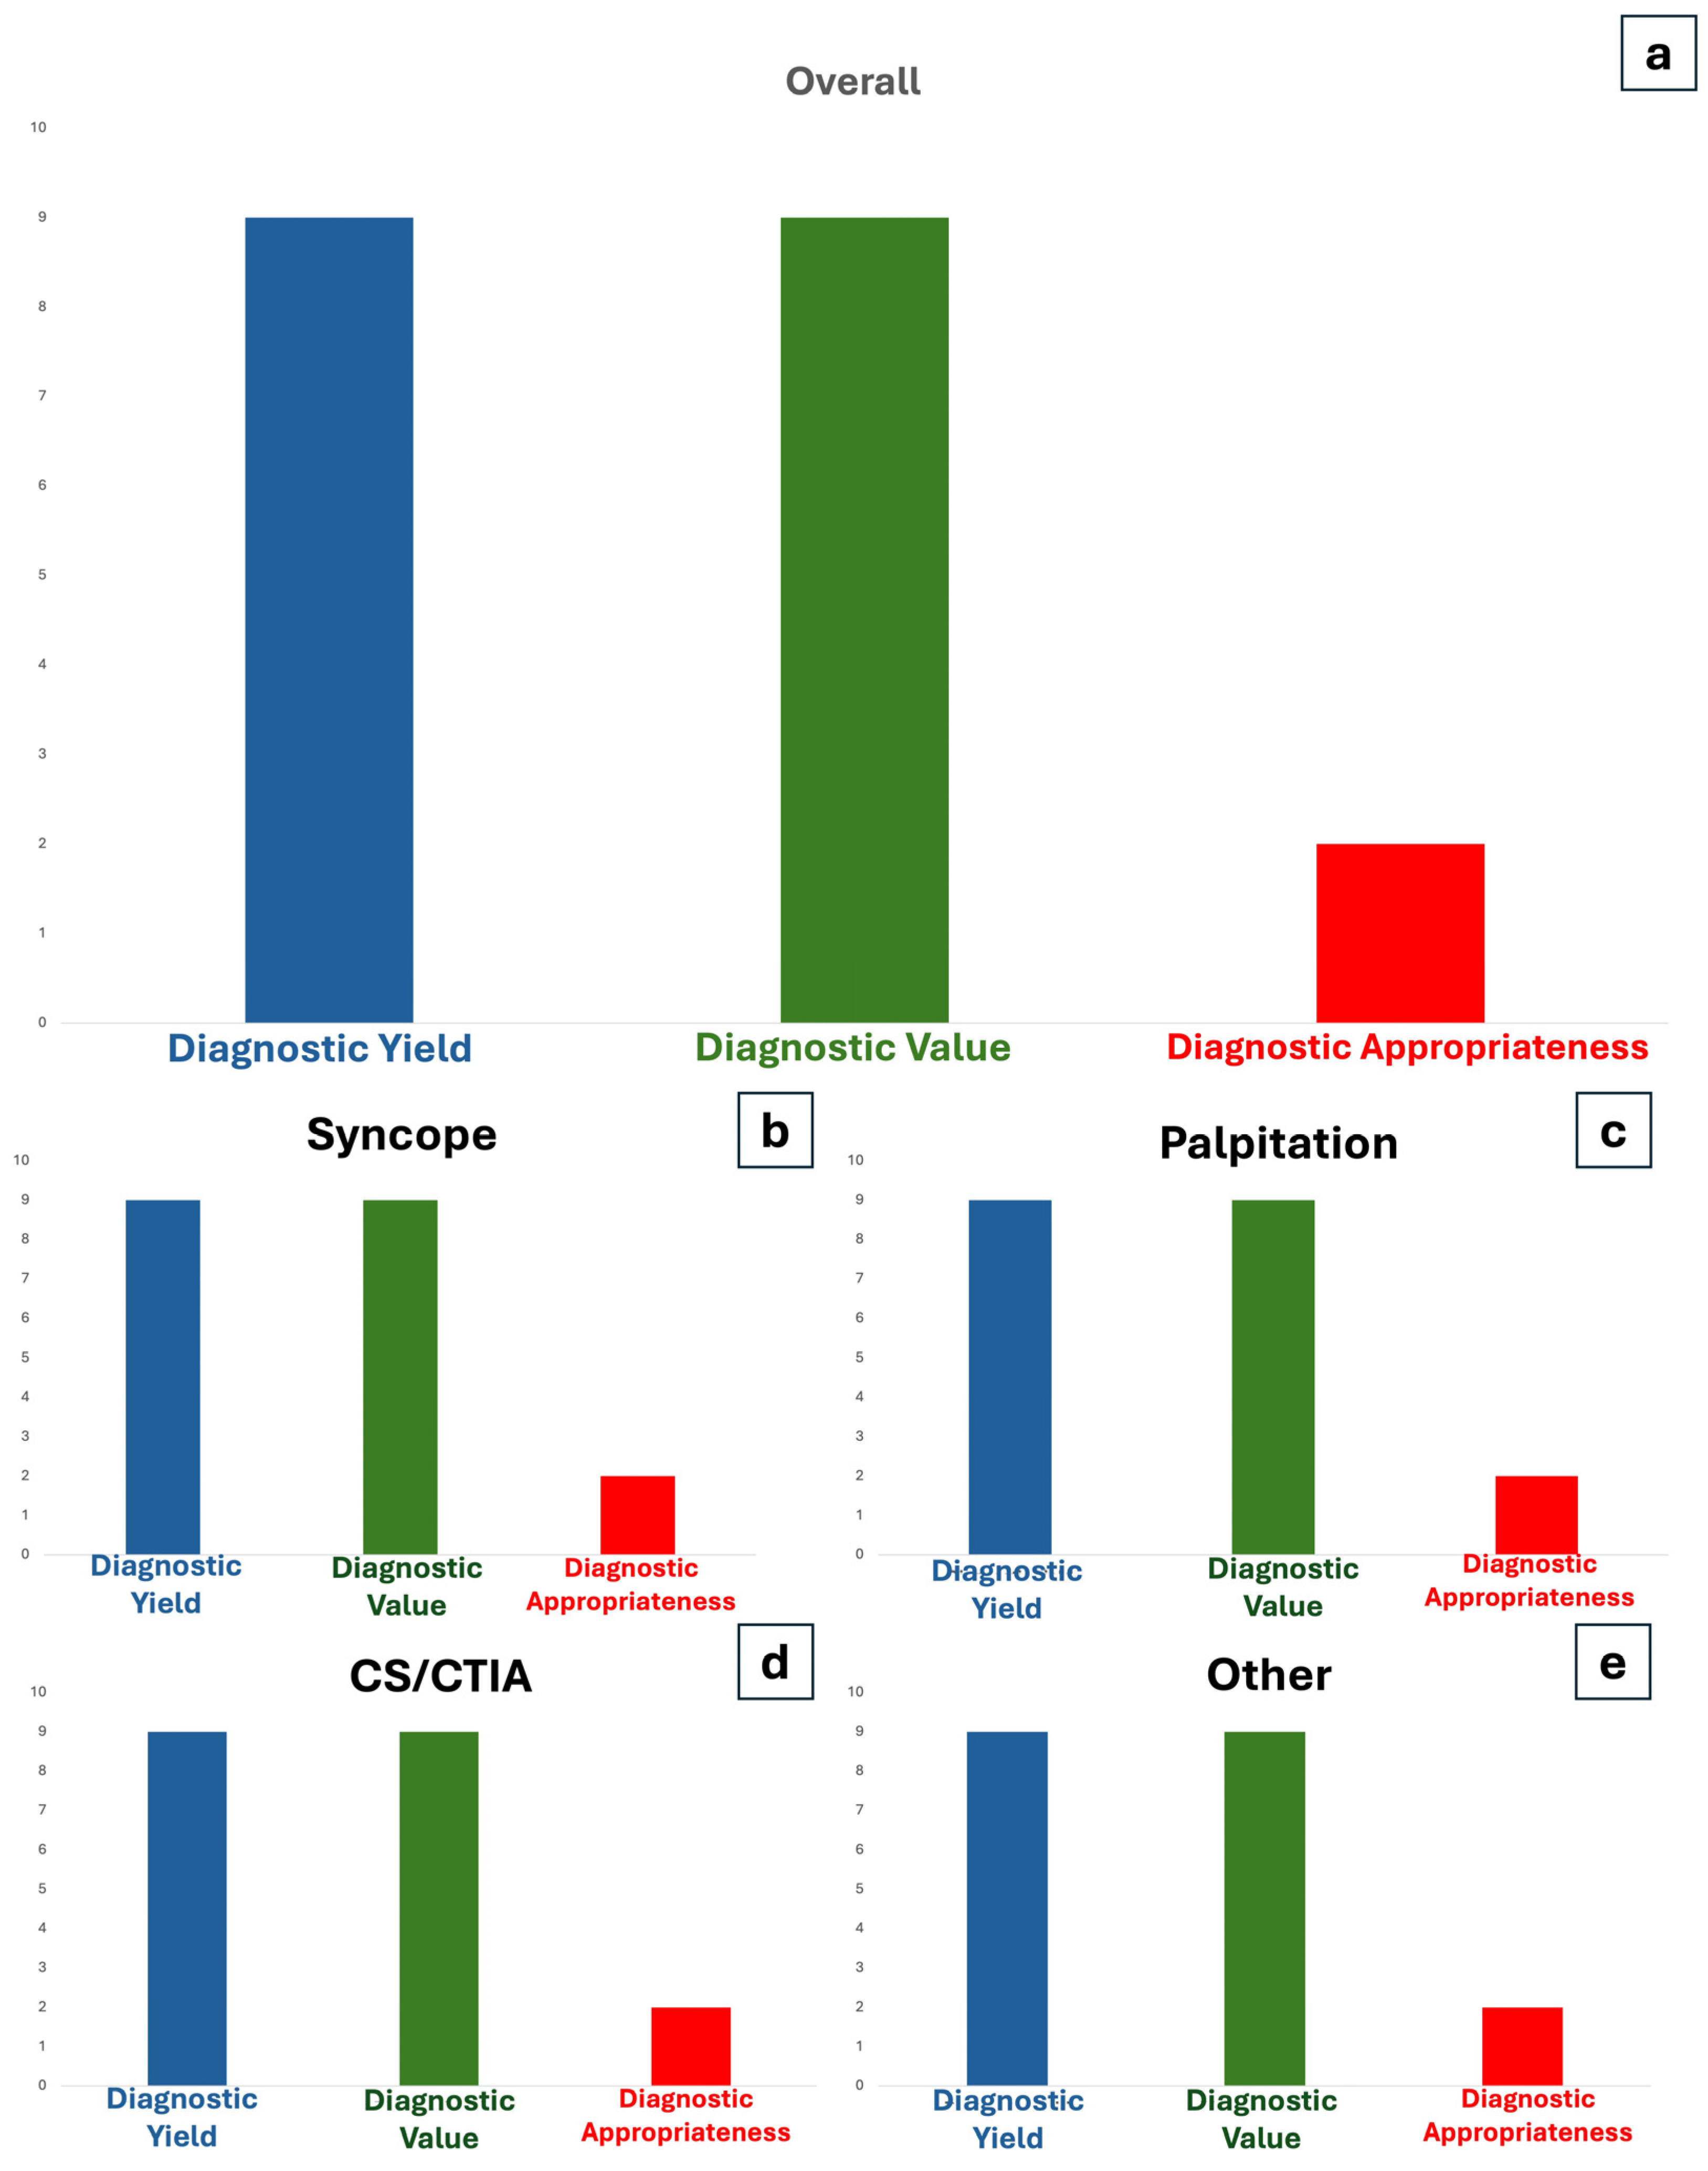
3.3. Diagnostic Yield

| Overall | Syncope | Palpitation | CS/CTIA | Other | p | |
|---|---|---|---|---|---|---|
| 316 | 183 | 59 | 57 | 17 | ||
| Diagnosis, n (diagnostic yield %) | 96 (30) | 50 (27) | 24 (41) | 13 (28) | 9 (53) | 0.247 |
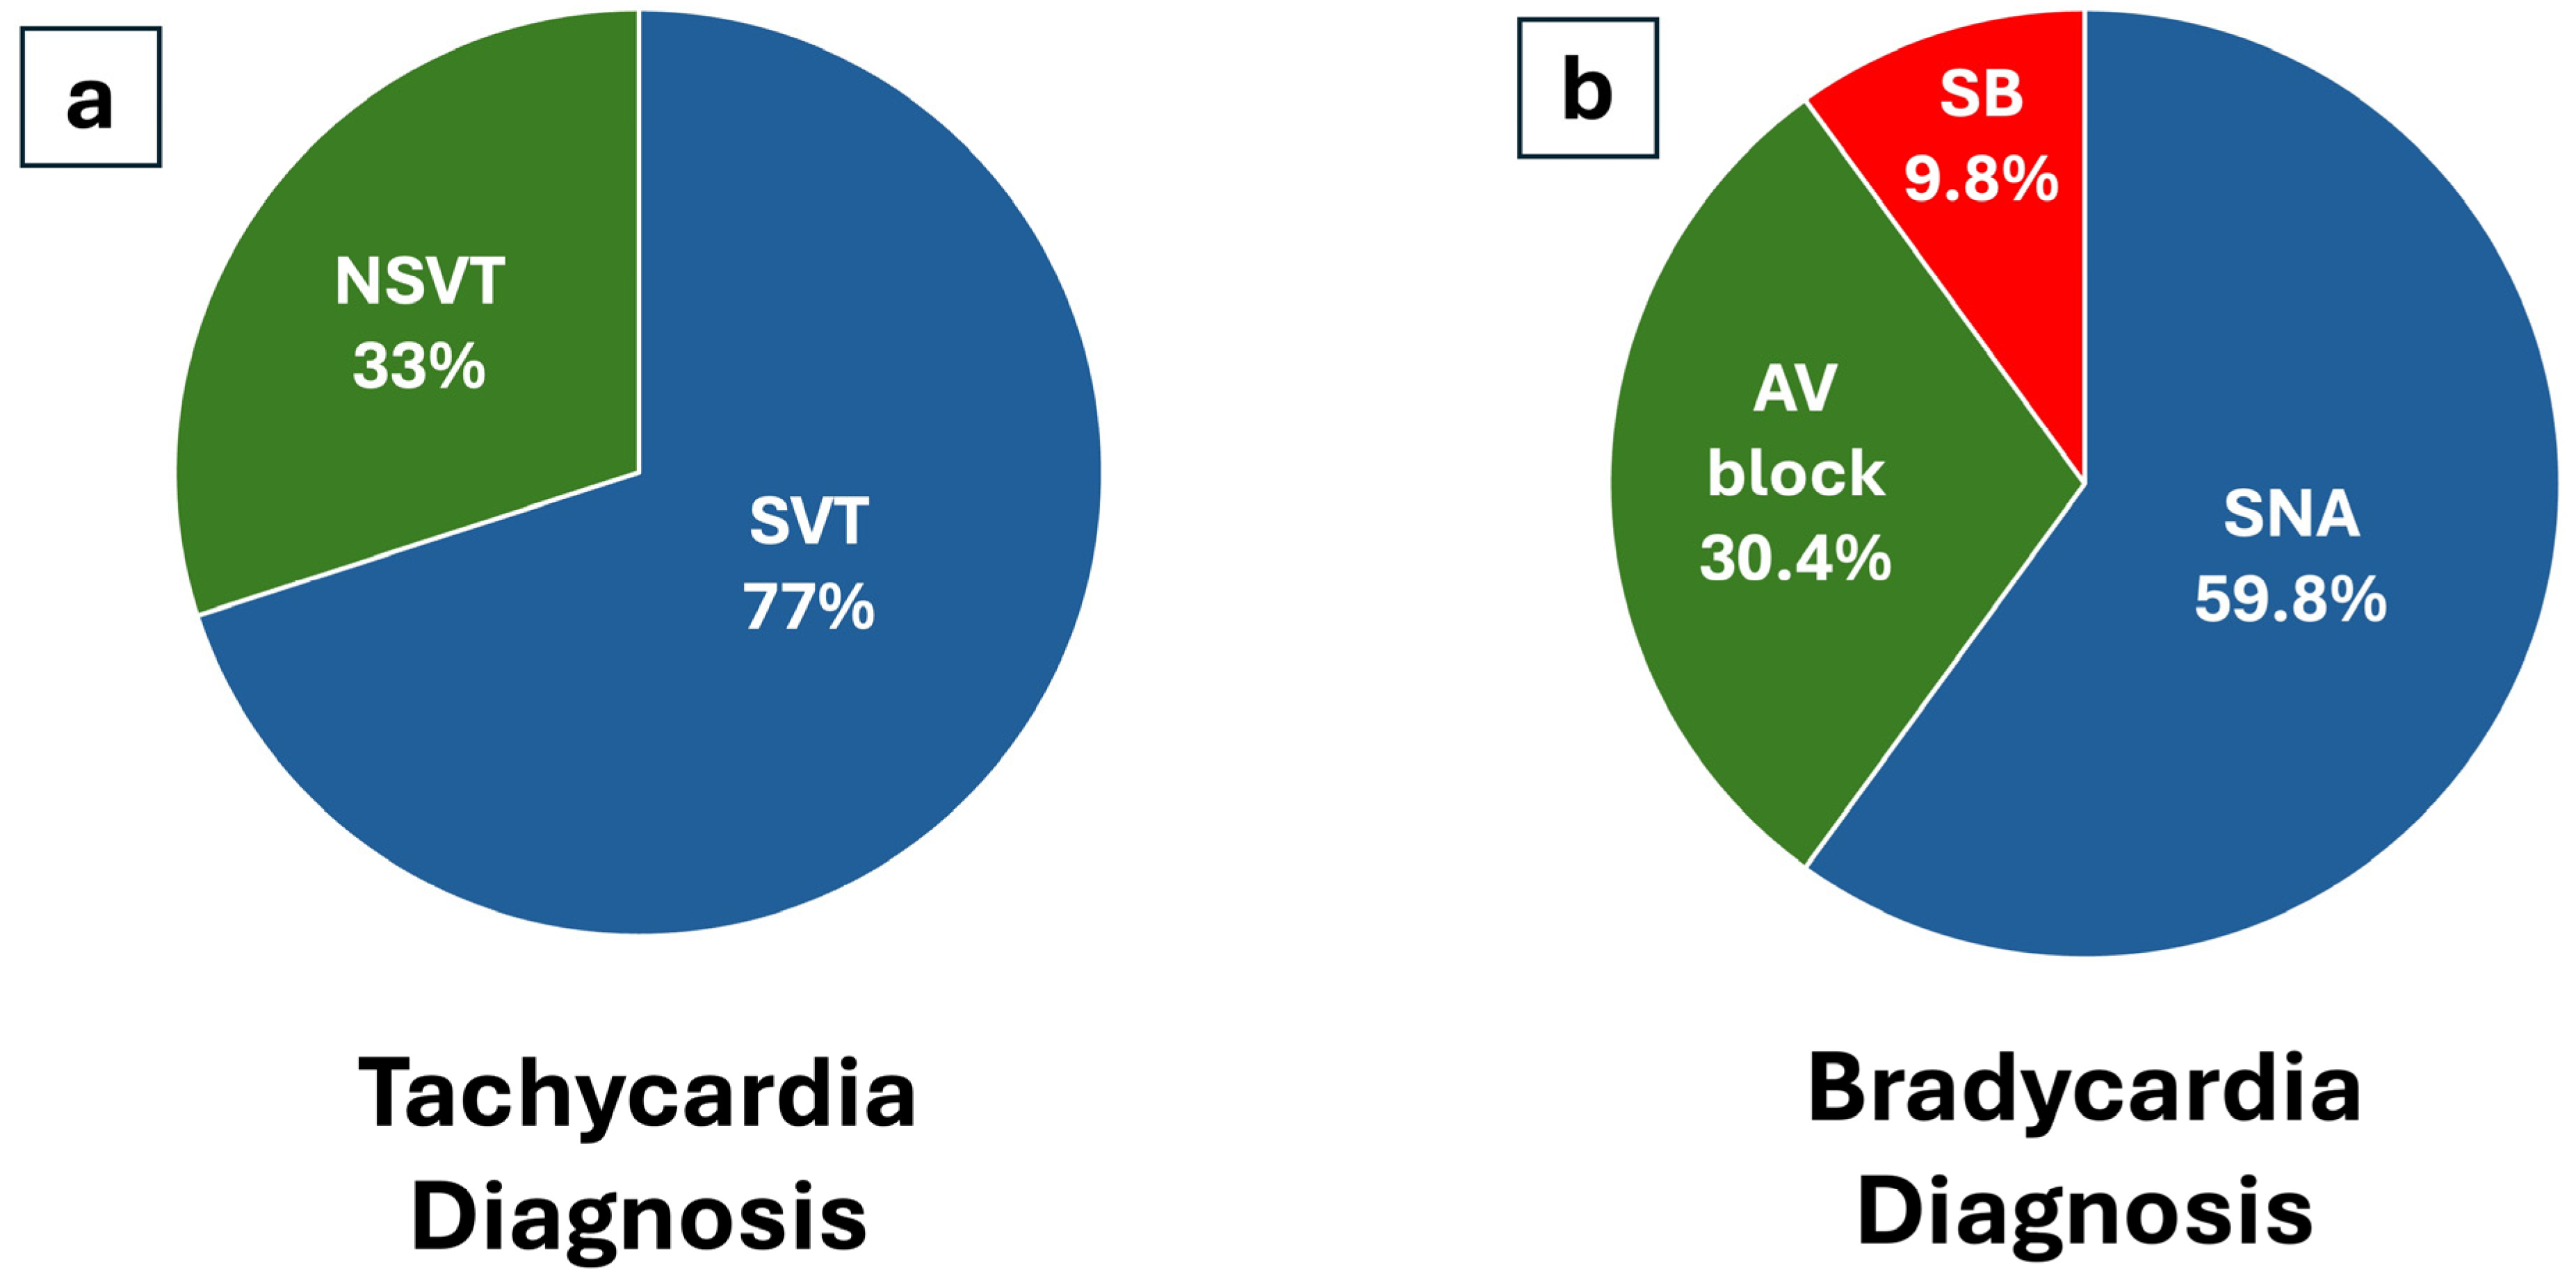
| Diagnosis tachy, n (%) | 43 (45) | 13 (26) | 18 (75) | 10 (62) | 2 (22) | |
| Diagnosis brady, n (%) | 53 (55) | 37 (74) | 6 (25) | 3 (19) | 7 (78) | |
| Diagnostic Value, n (%) | 93 (29) | 50 (27) | 21 (36) | 13 (28) | 9 (53) | |
| CA, n (%) | 18 (19) | 7 (14) | 7 (29) | 4 (31) | 0 (0) | |
| Repeted EPS, n (%) | 9 (9) | 4 (8) | 3 (13) | 1 (8) | 1 (11) | |
| PM implant, n (%) | 56 (58) | 38 (76) | 7 (29) | 4 (31) | 8 (89) | |
| ICD implant, n (%) | 5 (5) | 1 (2) | 4 (17) | 0 (0) | 0 (0) | |
| Only medical therapy changes, n (%) | 5 (5) | 0 (0) | 0 (0) | 4 (31) | 0 (0) | |
| No changes in management, n (%) | 3 (3) | 0 (0) | 3 (13) | 0 (0) | 0 (0) | |
| Diagnostic value/yield ratio, % | 97 | 100 | 89 | 100 | 100 | |
| Appropriate diagnosis, n (diagnostic appropriateness %) | 67 (70) | 40 (80) * | 15 (63) | 10 (77) * | 2 (22) * | <0.001 |
| Substitution, n (%) | 32 (10) | 16 (9) | 10 (17) | 5 (9) | 1 (6) | |
| Removal without Diagnosis, n (%) | 130 (41) | 79 (43) | 35 (59) | 12 (21) | 4 (24) | |
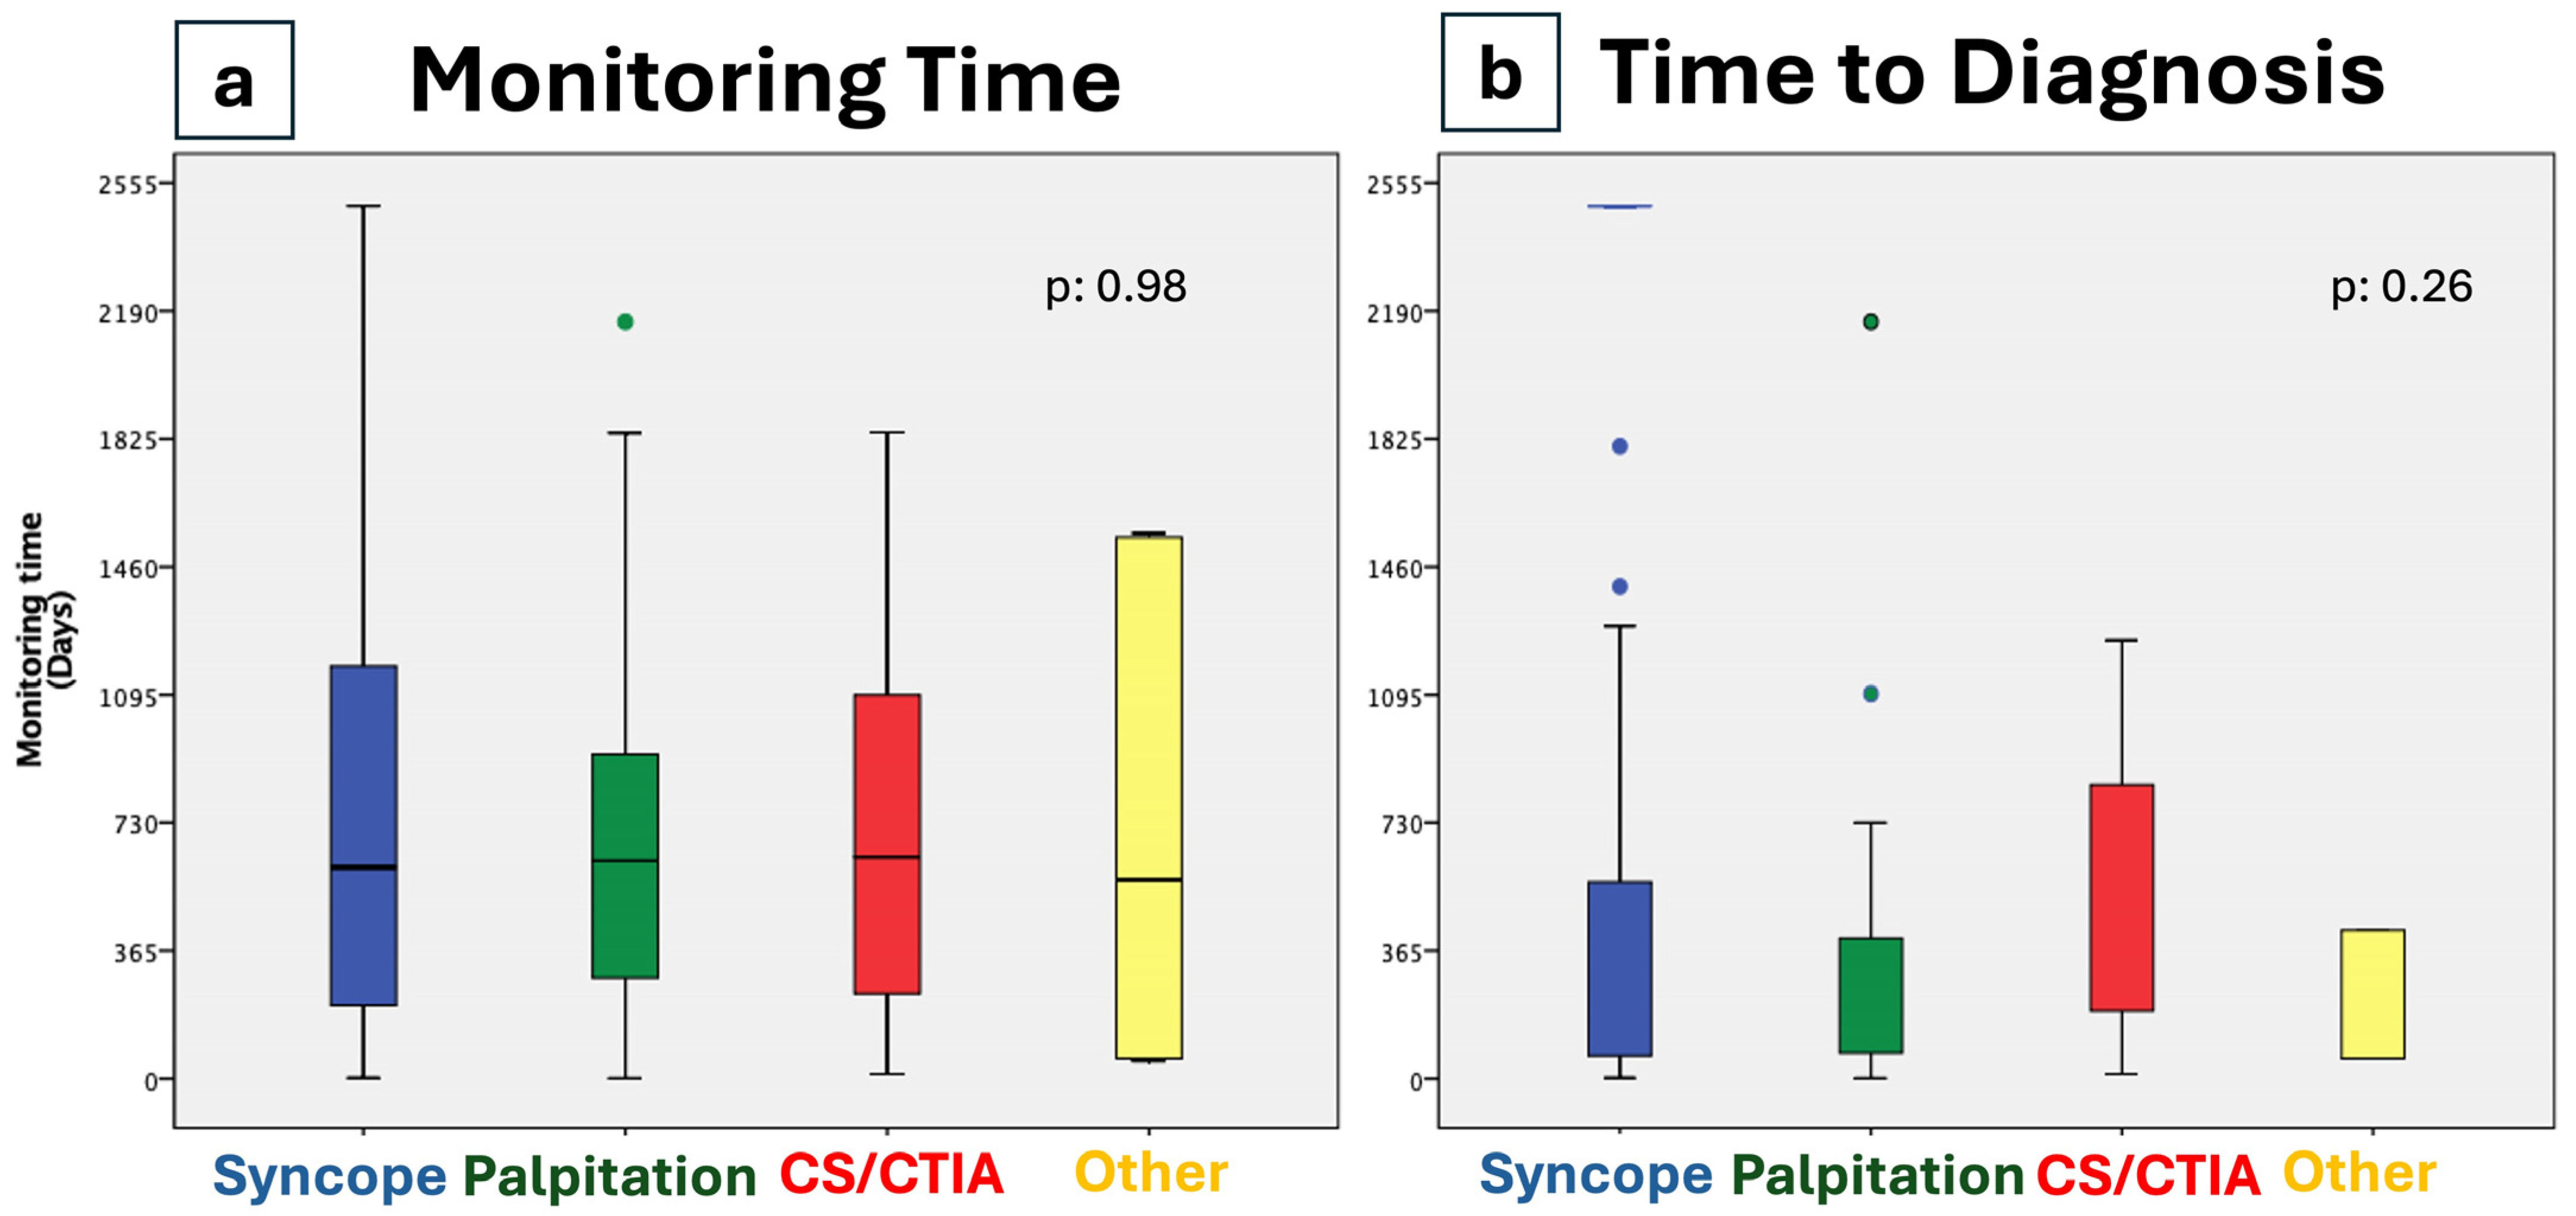
| Time to diagnosis, days (±SD) | 458 (674) | 440 (641) | 490 (904) | 455 (568) | 490 (421) | 0.263 |
| Time to removal (no diagnosis), days (±SD) | 1182 (421) | 1232 (383) | 1163 (413) | 864 (673) | 1136 (598) | 0.378 |
| Mean monitoring time, days (±SD) | 831 (606) | 765 (582) | 1005 (598) | 776 (643) | 1075 (766) | 0.98 |
3.4. Diagnostic Value
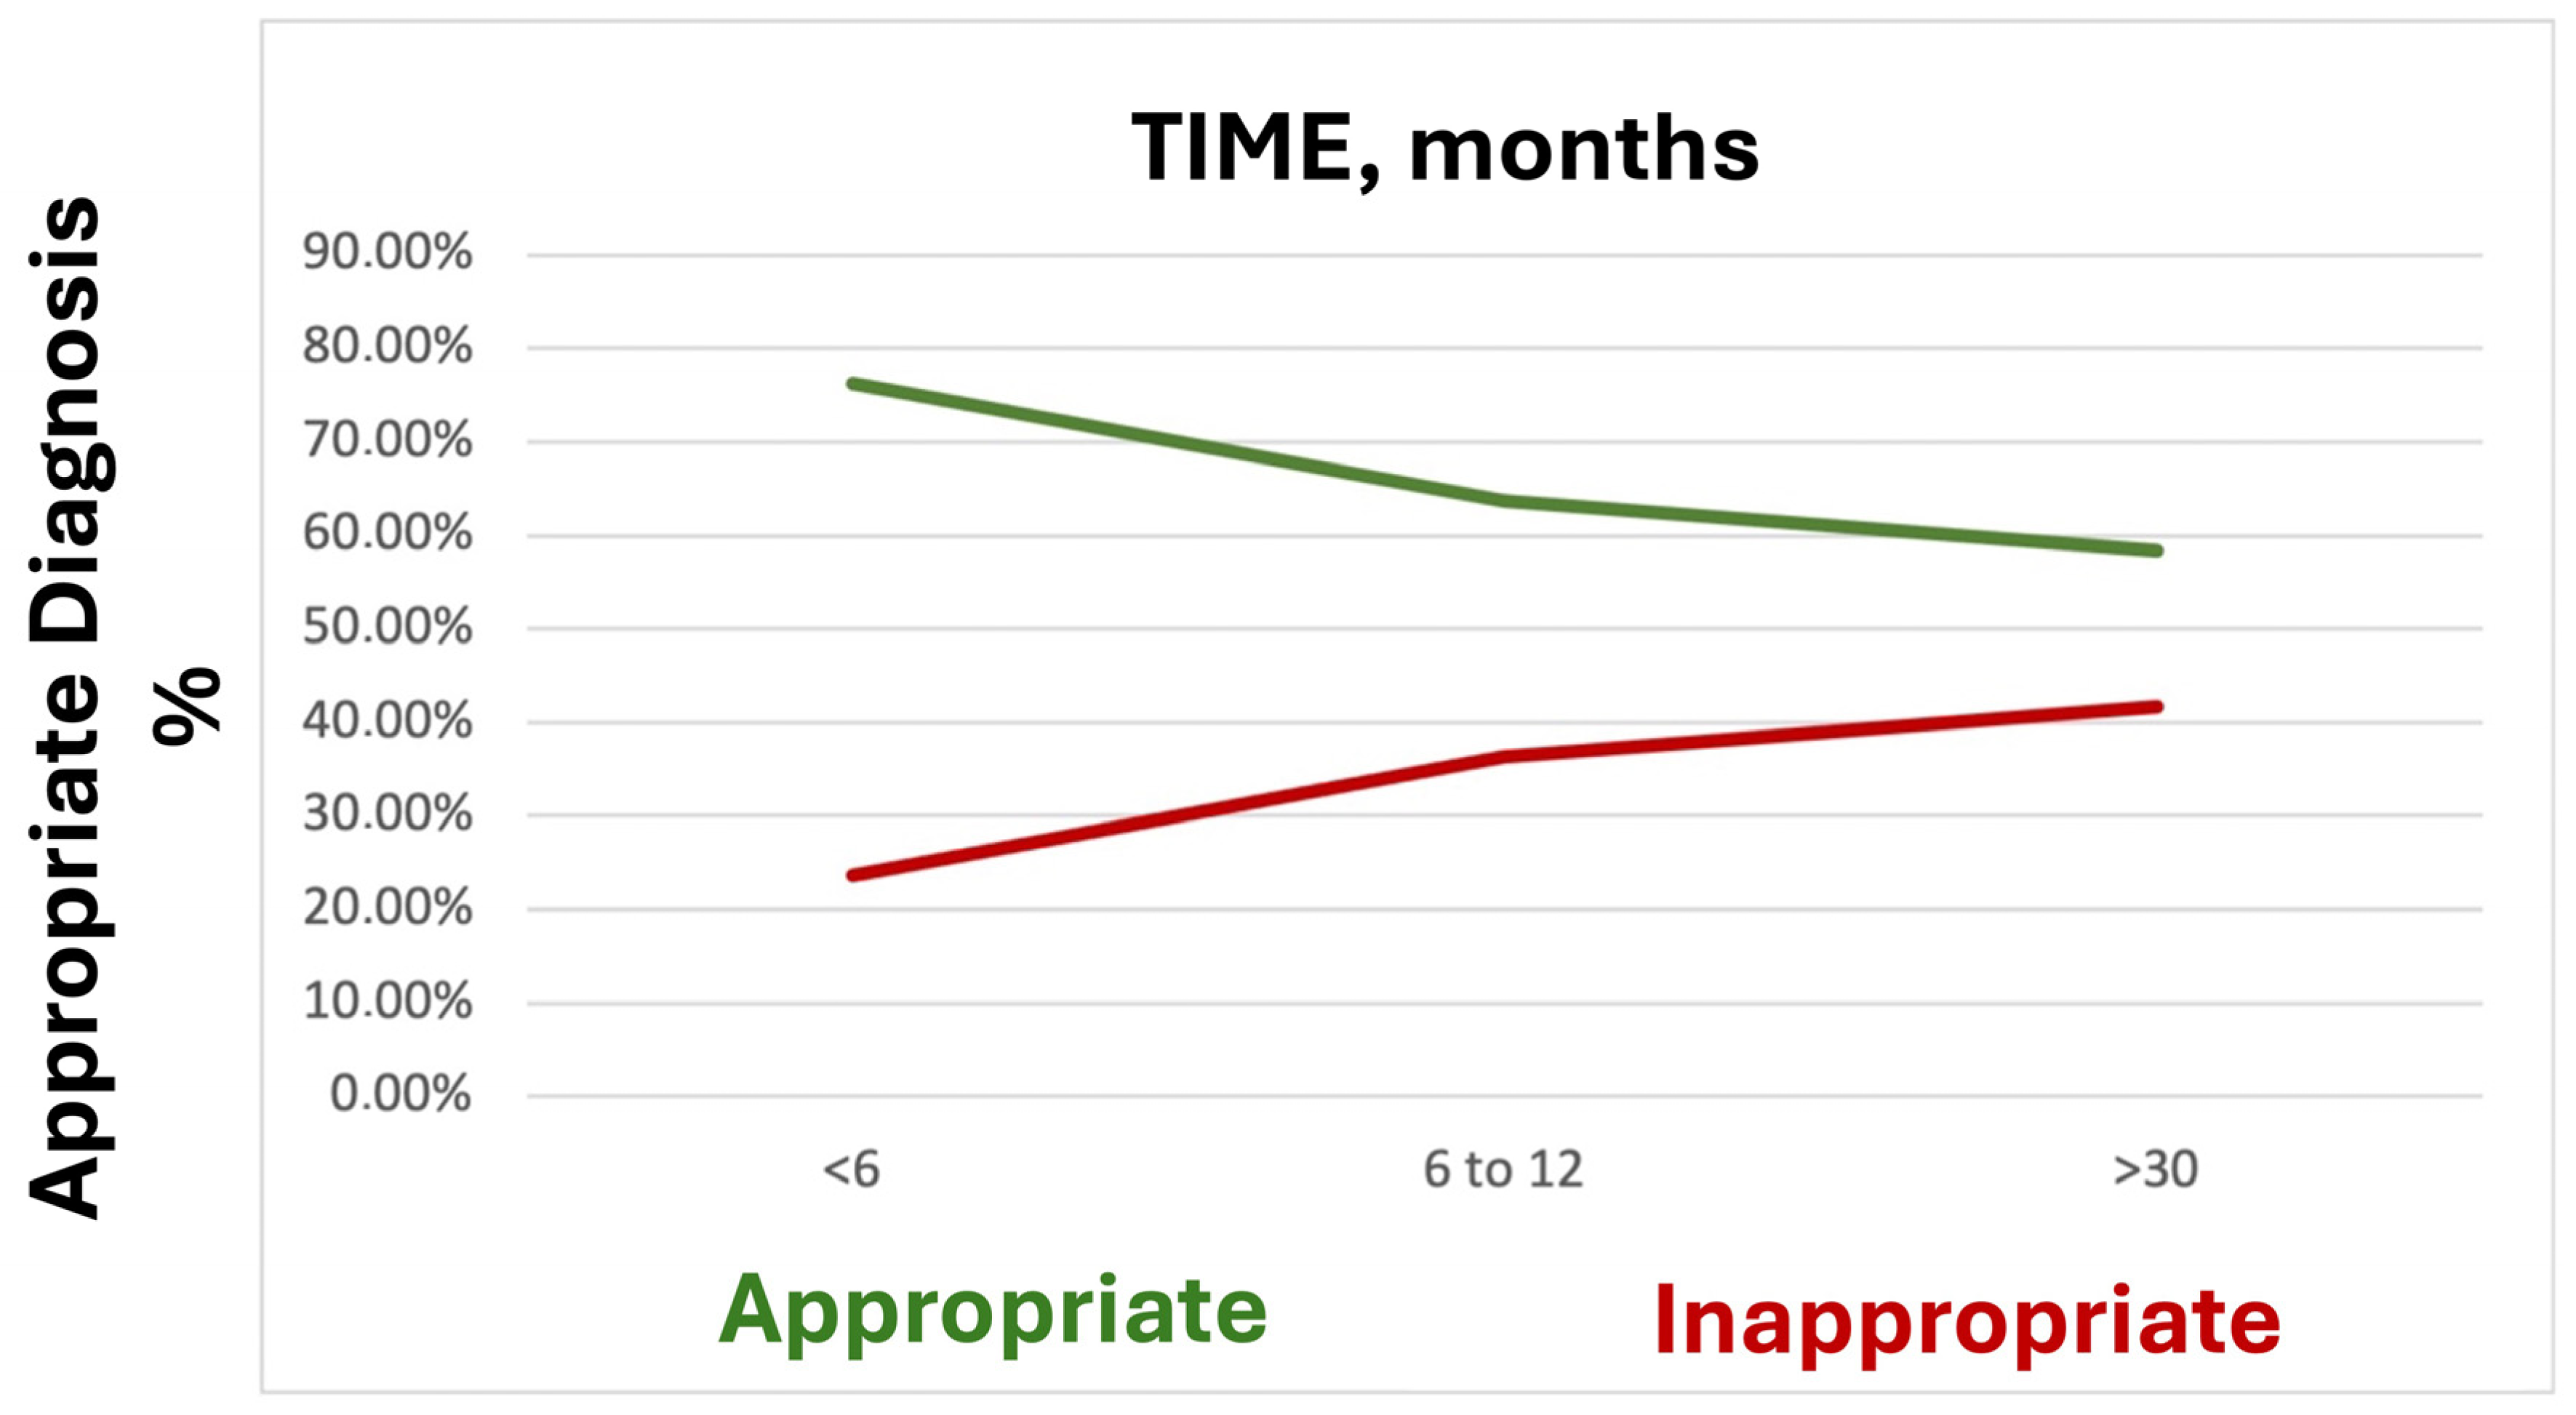
3.5. Diagnostic Appropriateness
4. Discussion
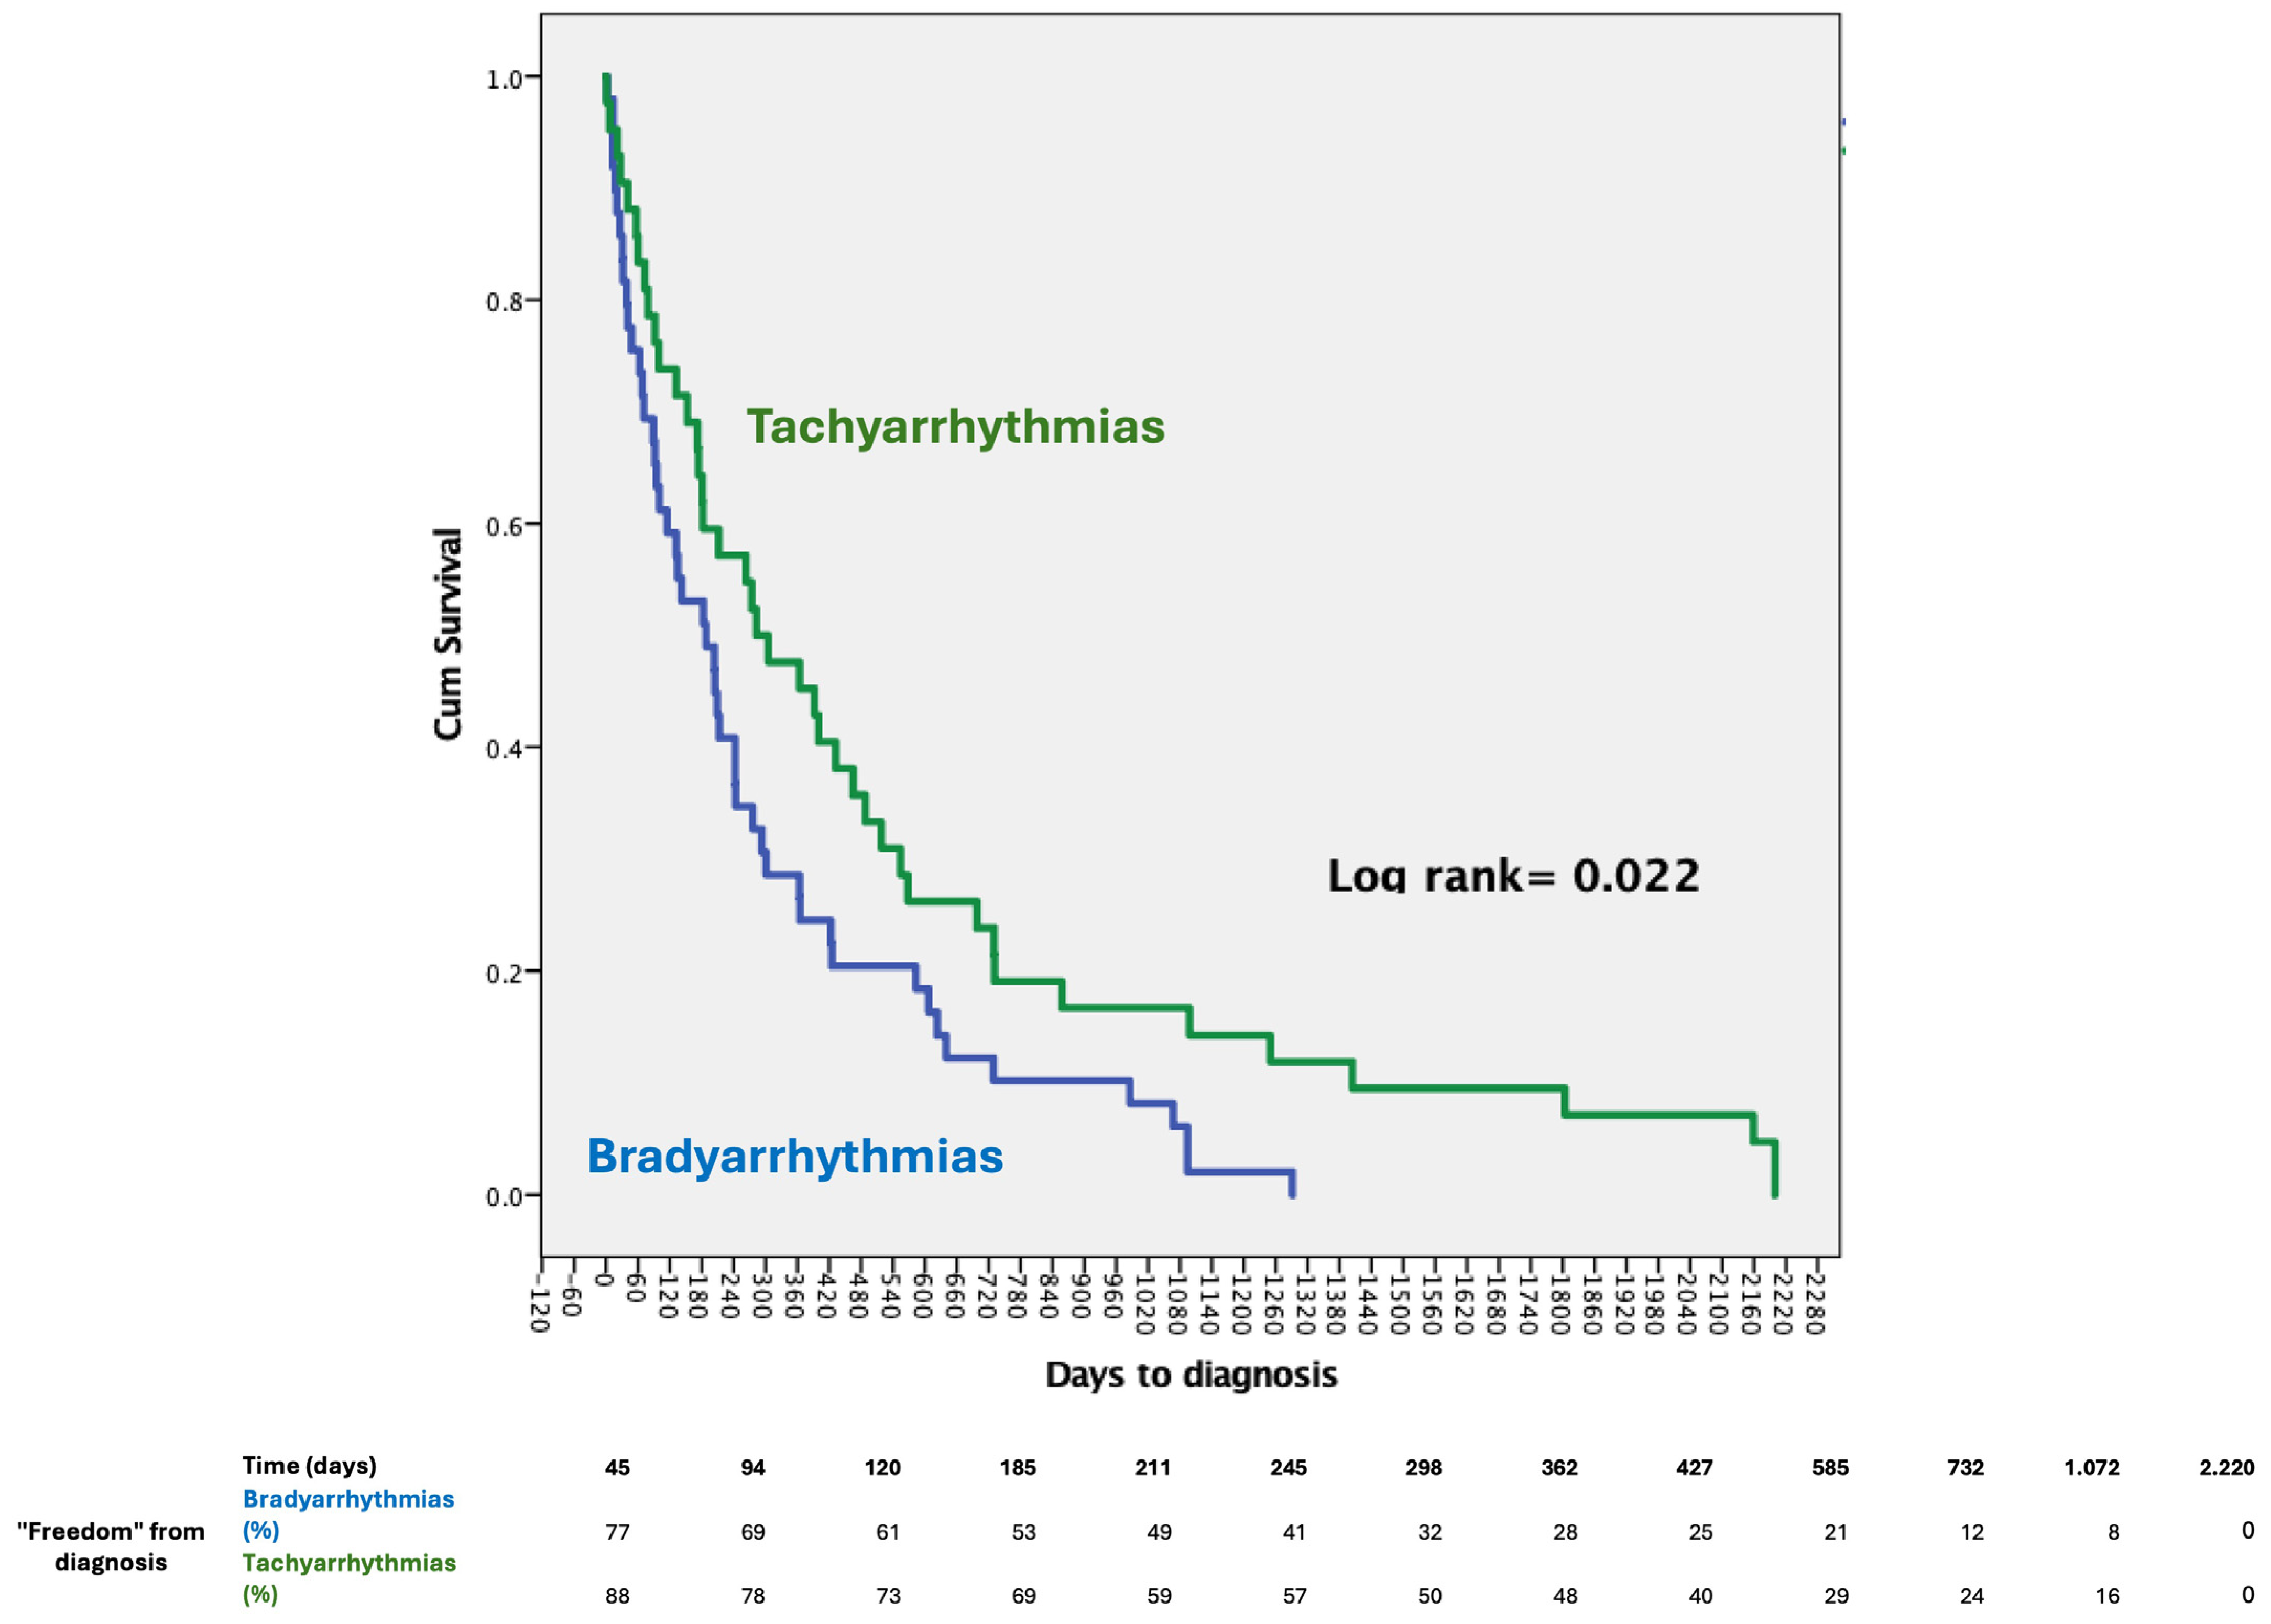
4.1. Bradycardia vs. Tachycardia Diagnosis
4.2. Diagnostic Yield, Diagnostic Value, and Diagnostic Appropriateness
5. Conclusions
Author Contributions
Funding
Institutional Review Board Statement
Informed Consent Statement
Data Availability Statement
Conflicts of Interest
References
- Di Cori, A.; De Lucia, R. Clinical implications of long-term ECG monitoring: From loop recorder to devices remote control. Minerva Cardioangiol. 2018, 66, 40–48. [Google Scholar] [CrossRef] [PubMed]
- Giada, F.; Raviele, A. Clinical Approach to Patients with Palpitations. Card. Electrophysiol. Clin. 2018, 10, 387–396. [Google Scholar] [CrossRef] [PubMed]
- Fedorowski, A.; Kulakowski, P.; Brignole, M.; de Lange, F.J.; Kenny, R.A.; Moya, A.; Rivasi, G.; Sheldon, R.; Van Dijk, G.; Sutton, R.; et al. Twenty-five years of research on syncope. EP Eur. 2023, 25, euad163. [Google Scholar] [CrossRef] [PubMed]
- Pistelli, L.; Vetta, G.; Parlavecchio, A.; Crea, P.; Parisi, F.; Magnocavallo, M.; Caminiti, R.; Frea, S.; Vairo, A.; Desalvo, P.; et al. Arrhythmic risk profile in mitral valve prolapse: A systematic review and metanalysis of 1715 patients. J. Cardiovasc. Electrophysiol. 2024, 35, 290–300. [Google Scholar] [CrossRef] [PubMed]
- Hindricks, G.; Potpara, T.; Dagres, N.; Arbelo, E.; Bax, J.J.; Blomström-Lundqvist, C.; Boriani, G.; Castella, M.; Dan, J.-A.; Dilaveris, P.E.; et al. 2020 ESC Guidelines for the diagnosis and management of atrial fibrillation developed in collaboration with the European Association for Cardio-Thoracic Surgery (EACTS). Eur. Heart J. 2021, 42, 373–498. [Google Scholar] [CrossRef]
- Karakasis, P.; Pamporis, K.; Siontis, K.C.; Theofilis, P.; Samaras, A.; Patoulias, D.; Stachteas, P.; Karagiannidis, E.; Stavropoulos, G.; Tzikas, A.; et al. Major clinical outcomes in symptomatic vs. asymptomatic atrial fibrillation: A meta-analysis. Eur. Heart J. 2024. [Google Scholar] [CrossRef] [PubMed]
- Essa, H.; Hill, A.M.; Lip, G.Y.H. Atrial Fibrillation and Stroke. Card. Electrophysiol. Clin. 2021, 13, 243–255. [Google Scholar] [CrossRef] [PubMed]
- Kishore, A.; Vail, A.; Majid, A.; Dawson, J.; Lees, K.R.; Tyrrell, P.J.; Smith, C.J. Detection of atrial fibrillation after ischemic stroke or transient ischemic attack: A systematic review and meta-analysis. Stroke 2014, 45, 520–526. [Google Scholar] [CrossRef] [PubMed]
- Padmanabhan, D.; Kancharla, K.; El-Harasis, M.A.; Isath, A.; Makkar, N.; Noseworthy, P.A.; Friedman, P.A.; Cha, Y.; Kapa, S. Diagnostic and therapeutic value of implantable loop recorder: A tertiary care center experience. Pacing Clin. Electrophysiol. 2019, 42, 38–45. [Google Scholar] [CrossRef]
- Radovanović, N.N.; Pavlović, S.U.; Kirćanski, B.; Branković, N.; Vujadinović, N.; Sajić, V.; Milašinović, A.; Bisenić, V.; Živković, M.; Milašinović, G. Diagnostic value of implantable loop recorders in patients with unexplained syncope or palpitations. Ann. Noninvasive Electrocardiol. 2021, 26, e12864. [Google Scholar] [CrossRef]
- Edvardsson, N.; Frykman, V.; van Mechelen, R.; Mitro, P.; Mohii-Oskarsson, A.; Pasquie, J.L.; Ramanna, H.; Schwertfeger, F.; Ventura, R.; Voulgaraki, D.; et al. Use of an implantable loop recorder to increase the diagnostic yield in unexplained syncope: Results from the PICTURE registry. EP Eur. 2011, 13, 262–269. [Google Scholar] [CrossRef] [PubMed]
- Quartieri, F.; Harish, M.; Calò, L.; Ebrahim, I.; Fusco, A.; Mester, S.; Cauti, F.; Park, S.-J.; Francia, P.; Giovagnoni, M.; et al. New insertable cardiac monitors show high diagnostic yield and good safety profile in real-world clinical practice: Results from the international prospective observational SMART Registry. EP Eur. 2023, 25, euad068. [Google Scholar] [CrossRef] [PubMed]
- Ibrahim, O.A.; Drew, D.; Hayes, C.J.; McIntyre, W.; Seifer, C.M.; Hopman, W.; Glover, B.; Baranchuk, A.M. Implantable loop recorders in the real world: A study of two Canadian centers. J. Interv. Card. Electrophysiol. Int. J. Arrhythm. Pacing 2017, 50, 179–185. [Google Scholar] [CrossRef] [PubMed]
- Furukawa, T.; Maggi, R.; Bertolone, C.; Fontana, D.; Brignole, M. Additional diagnostic value of very prolonged observation by implantable loop recorder in patients with unexplained syncope. J. Cardiovasc. Electrophysiol. 2012, 23, 67–71. [Google Scholar] [CrossRef]
- Merlos, P.; Rumiz, E.; Ruiz-Granell, R.; Martínez, Á.; Izquierdo, M.T.; Ferrero, Á.; Dominguez, E.; Sánchez, J.M.; Morell, S.; García-Civera, R. Outcome of patients with syncope beyond the implantable loop recorder. EP Eur. 2013, 15, 122–126. [Google Scholar] [CrossRef] [PubMed]
- Lilli, A.; Di Cori, A. The cold facts of long-term ECG monitoring. Expert Rev. Cardiovasc. Ther. 2015, 13, 125–127. [Google Scholar] [CrossRef] [PubMed]
- Smith, A.; Perdue, M.; Vojnika, J.; Frisch, D.R.; Pavri, B.B. The diagnostic yield of implantable loop recorders stratified by indication: “real-world” use in a large academic hospital. J. Interv. Card. Electrophysiol. 2021, 61, 303–311. [Google Scholar] [CrossRef] [PubMed]
- Savage, D.D.; Corwin, L.; McGee, D.L.; Kannel, W.B.; Wolf, P.A. Epidemiologic features of isolated syncope: The Framingham Study. Stroke 1985, 16, 626–629. [Google Scholar] [CrossRef]
- Letsas, K.P.; Saplaouras, A.; Mililis, P.; Kariki, O.; Bazoukis, G.; Archontakis, S.; Anagnostopoulos, I.; Triantafyllou, S.; Palaiodimou, L.; Chatziantoniou, A.; et al. Diagnostic yield of implantable loop recorders: Results from the hellenic registry. Hell. J. Cardiol. 2024, in press. [Google Scholar] [CrossRef] [PubMed]
- Noubiap, J.J.; Thomas, G.; Middeldorp, M.E.; Fitzgerald, J.L.; Harper, C.; Sanders, P. Atrial fibrillation detection using insertable cardiac monitor after stroke: A real-world cohort study. J. Cardiovasc. Electrophysiol. 2023, 34, 142–146. [Google Scholar] [CrossRef] [PubMed]

| Overall | Syncope | Palpitation | CS/CTIA | Other | p | |
|---|---|---|---|---|---|---|
| 316 (100) | 183 (58) | 59 (19) | 57 (18) | 17 (5) | ||
| Male, n (%) | 175 (55) | 107 (59) | 27 (46) | 30 (53) | 11 (65) | 0.297 |
| Age, y (±SD) | 63 (17) | 63 (17) | 63 (16) | 65 (15) | 56 (18) | 0.35 |
| Weight, kg (±SD) | 74 (17) | 74 (14) | 75 (22) | 78 (20) | 69 (6) | 0.511 |
| Height, cm (±SD) | 170 (10) | 170 (10) | 169 (10) | 169 (10) | 172 (7) | 0.945 |
| BMI, kg/mq (±SD) | 26 (4) | 25 (4) | 26 (6) | 27 (5) | 23 (2) | 0.167 |
| BSA, mq (±SD) | 1.8 (0.2) | 1.8 (0.2) | 1.8 (0.3) | 1.9 (0.3) | 1.8 (0.1) | 0.781 |
| Hypertension, n (%) | 157 (50) | 91 (59) | 20 (34) | 40 (71) * | 0 (0) | 0.001 |
| Diabete Mellitus, n (%) | 36 (11) | 22 (50) | 4 (7) | 10 (18) | 0 (0) | 0.145 |
| Previous ictus/TIA, n (%) | 78 (25) | 15 (12) | 5 (9) | 57 (100) * | 1 (6) | <0.001 |
| Smoke, n (%) | 32 (10) | 20 (8) | 5 (9) | 6 (11) | 1 (6) | 0.902 |
| CAD, n (%) | 28 (9) | 21 (5) | 6 (10) | 1 (2) | 0 (0) | 0.64 |
| PAD, n (%) | 21 (7) | 14 (12) | 7 (12) | 0 (0) | 0 (0) | 0.415 |
| CHADS VASC, n (%) | ||||||
| 0 | 41 (13) | 24 (8) | 9 (15) | 0 (0) | 0 (0) | 0.137 |
| 1 | 69 (22) | 39 (13) | 14 (24) | 0 (0) | 4 (24) | |
| 2 | 83 (26) | 45 (21) | 15 (25) | 24 (42) | 4 (24) | |
| 3 | 76 (24) | 45 (25) | 18 (31) | 16 (28) | 1 (6) | |
| 4 | 33 (10) | 22 (12) | 2 (3) | 10 (18) | 2 (12) | |
| 5 | 13 (4) | 7 (4) | 1 (2) | 7 (12) | 0 (0) | |
| 6 | 1 (0.3) | 1 (1) | 0 (0) | 0 (0) | 0 (0) | |
| COPD, n (%) | 7 (2) | 5 (3) | 2 (4) | 0 (0) | 0 (0) | 0.953 |
| Serum creatinine, mg/dL (±SD) | 1.3 (6) | 0.9 (0.2) | 0.9 (0.2) | 3.5 (0.2) | 0.9 (0.2) | 0.164 |
| ECHO | ||||||
| LVEF < 55%, n (%) | 10 (3) | 8 (11) | 1 (2) | 1 (2) | 0 (0) | 0.545 |
| LAD, mm (±SD) | 40 (8) | 40 (9) | 37 (7) | 41 (6) | 45 (12) | 0.228 |
| LAV, mL (±SD) | 65 (22) | 66 (21) | 59 (22) | 68 (20) | 66 (31) | 0.682 |
| LAVi, mL/mq (±SD) | 34 (12) | 36 (13) | 29 (10) | 37 (11) | 36 (14) | 0.163 |
| LVEDD, mm (±SD) | 48 (5) | 48 (6) | 47 (5) | 49 (5) | 47 (3) | 0.755 |
| LVEF, % (±SD) | 60 (8) | 61 (8) | 59 (7) | 56 (10) | 60 (8) | 0.207 |
| ECG | ||||||
| HR, bpm (±SD) | 65 (15) | 64 (14) | 63 (13) | 68 (14) | 60 (24) | 0.541 |
| Sinus rhythm, n (%) | 294 (93) | 179 (98) | 90 (153) | 19 (33) | 6 (35) | 0.144 |
| AF/AFl, n (%) | 16 (5) | 9 (5) | 7 (12) | 0 (0) | 0 (0) | |
| Conduction disturbance, n (%) | 80 (25) | 47 (26) | 27 (46) | 5 (9) | 1 (6) | 0.89 |
| Pre-implant investigation | ||||||
| Tilt test | 8 (3) | 8 (5) | 0 (0) | 0 (0) | 0 (0) | |
| Carotid sinus massage | 11 (4) | 10 (6) | 1 (2) | 0 (0) | 0 (0) | |
| EPS | 59 (19) | 30 (16) | 19 (32) | 8 (14) | 2 (12) |
| No Diagnosis | Diagnosis | p | |
|---|---|---|---|
| Total | 220 | 96 | |
| Male, n (%) | 122 (56) | 53 (55) | 0.609 |
| Age, y (±SD) | 64 (17) | 62 (16) | 0.501 |
| Weight, kg (±SD) | 74 (18) | 75 (13) | 0.67 |
| Height, cm (±SD) | 170 (10) | 169 (9) | 0.45 |
| BMI, kg/mq (±SD) | 25 (5) | 26 (4) | 0.236 |
| BSA, mq (±SD) | 1.8 (0.3) | 1.8 (0.2) | 0.758 |
| Hypertension, n (%) | 103 (47) | 54 (56) | 0.51 |
| Diabete mellitus, n (%) | 25 (11) | 11 (12) | 0.871 |
| Previous ictus/TIA, n (%) | 43 (20) | 12 (13) | 0.169 |
| Smoke, n (%) | 20 (9) | 12 (13) | 0.294 |
| CAD, n (%) | 20 (9) | 8 (8) | 0.911 |
| PAD, n (%) | 17 (7) | 4 (9) | 0.277 |
| CHADS VASC, n (%) | |||
| 0 | 32 (15) | 9 (9) | 0.694 |
| 1 | 48 (22) | 21 (22) | |
| 2 | 57 (26) | 26 (27) | |
| 3 | 50 (23) | 26 (27) | |
| 4 | 26 (12) | 7 (7) | |
| 5 | 10 (5) | 3 (3) | |
| 6 | 1 (1) | 0 (0) | |
| COPD, n (%) | 5 (2) | 2 (2) | 0.316 |
| Syncope, n (%) | 121 (55) | 45 (47) | 0.183 |
| Recurrent Presyncope (>1 episodes), n (%) | 28 (13) | 29 (30) | <0.001 * |
| Palpitation, n (%) | 51 (23) | 30 (31) | 0.265 |
| Prodroms, n (%) | 31 (14) | 14 (15) | 0.8 |
| Trauma, n (%) | 30 (14) | 18 (19) | 0.423 |
| ECHO | |||
| LVEF < 55%, n (%) | 7 (3) | 3 (3) | 0.971 |
| LAD, mm (±SD) | 41 (8) | 39 (8) | 0.493 |
| LAV, mL (±SD) | 65 (22) | 64 (23) | 0.878 |
| LAVi, mL/mq (±SD) | 33 (11) | 35 (13) | 0.509 |
| LVEDD, mm (±SD) | 49 (7) | 47 (4) | 0.142 |
| ECG | |||
| Sinus Rhythm, n (%) | 208 (95) | 86 (90) | 0.717 |
| AF/AFl, n (%) | 10 (5) | 6 (6) | |
| Conduction disturbance, n (%) | 50 (23) | 30 (31) | 0.044 |
| Pre-implant investigation, n (%) | |||
| Tilt Test, n (%) | 6 (2) | 2 (2) | 0.729 |
| Carotid sinus massage, n (%) | 8 (4) | 3 (3) | 0.814 |
| EPS, n (%) | 43 (20) | 16 (17) | 0.430 |
| Tachyarrhythmia | Bradyarrhythmia | p | |
|---|---|---|---|
| Male | 7 (54) | 25 (68) | 0.378 |
| Age, y | 64 (16) | 66 (16) | 0.595 |
| BMI, kg/mq | 24 (3) | 27 (3) | 0.047 |
| BSA, mq | 1.7 (0.1) | 1.8 (0.2) | 0.566 |
| Hypertension | 6 (46) | 24 (65) | 0.193 |
| Diabete mellitus | 8 (62) | 5 (14) | 0.331 |
| Previous ictus/TIA | 0 (0) | 5 (14) | 0.16 |
| Smoke | 4 (31) | 4 (11) | 0.1 |
| CAD | 0 (0) | 5 (14) | 0.156 |
| PAD | 0 (0) | 4 (11) | 0.21 |
| CHADSVASC | |||
| ≤2 | 7 (54) | 20 (54) | |
| >2 | 6 (46) | 17 (11) | |
| CKD | 0 | 4 (3) | 0.586 |
| COPD | 0 | 1 (3) | 0.686 |
| Pre-implant investigation | |||
| Tilt Test | 1 (8) | 1 (3) | 0.43 |
| Carotid sinus massage | 1 (8) | 1 (3) | 0.46 |
| EPS | 2 (15) | 2 (5) | 0.254 |
| Symptoms | |||
| Syncope | 10 (77) | 35 (95) | 0.68 |
| Presyncope | 11 (85) | 8 (22) | 0.042 * |
| Prodromi | 2 (15) | 10 (27) | 0.398 |
| Trauma | 2 (15) | 16 (43) | 0.072 |
| ECHO | |||
| LAD, mm | 35 (5) | 42 (10) | 0.111 |
| LAV, mL | 49 (10) | 70 (24) | 0.095 |
| LAVi, mL/mq | 26 (4) | 39 (16) | 0.101 |
| LVEDD, mm | 48 (3) | 46 (5) | 0.514 |
| LVEF, % | 63 (6) | 63 (8) | 0.99 |
| ECG | |||
| Sinus rhythm | 13 (100) | 33 (89) | 0.283 |
| Time to diagnosis, days | 590 (618) | 290 (353) | 0.04 * |
Disclaimer/Publisher’s Note: The statements, opinions and data contained in all publications are solely those of the individual author(s) and contributor(s) and not of MDPI and/or the editor(s). MDPI and/or the editor(s) disclaim responsibility for any injury to people or property resulting from any ideas, methods, instructions or products referred to in the content. |
© 2025 by the authors. Licensee MDPI, Basel, Switzerland. This article is an open access article distributed under the terms and conditions of the Creative Commons Attribution (CC BY) license (https://creativecommons.org/licenses/by/4.0/).
Share and Cite
Pistelli, L.; Di Cori, A.; Parollo, M.; Torre, M.; Fiorentini, F.; Barletta, V.; Giannotti Santoro, M.; Grifoni, G.; Canu, A.; Segreti, L.; et al. The Diagnostic Yield of Implantable Loop Recorders Stratified by Indication: A “Real-World” Single-Center Experience. J. Clin. Med. 2025, 14, 1052. https://doi.org/10.3390/jcm14041052
Pistelli L, Di Cori A, Parollo M, Torre M, Fiorentini F, Barletta V, Giannotti Santoro M, Grifoni G, Canu A, Segreti L, et al. The Diagnostic Yield of Implantable Loop Recorders Stratified by Indication: A “Real-World” Single-Center Experience. Journal of Clinical Medicine. 2025; 14(4):1052. https://doi.org/10.3390/jcm14041052
Chicago/Turabian StylePistelli, Lorenzo, Andrea Di Cori, Matteo Parollo, Marco Torre, Federico Fiorentini, Valentina Barletta, Mario Giannotti Santoro, Gino Grifoni, Antonio Canu, Luca Segreti, and et al. 2025. "The Diagnostic Yield of Implantable Loop Recorders Stratified by Indication: A “Real-World” Single-Center Experience" Journal of Clinical Medicine 14, no. 4: 1052. https://doi.org/10.3390/jcm14041052
APA StylePistelli, L., Di Cori, A., Parollo, M., Torre, M., Fiorentini, F., Barletta, V., Giannotti Santoro, M., Grifoni, G., Canu, A., Segreti, L., De Lucia, R., Viani, S., & Zucchelli, G. (2025). The Diagnostic Yield of Implantable Loop Recorders Stratified by Indication: A “Real-World” Single-Center Experience. Journal of Clinical Medicine, 14(4), 1052. https://doi.org/10.3390/jcm14041052