
Skip to Content
You are currently on the new version of our website. Access the old version .
  • 4.7
    Impact Factor
  • 8.5
    CiteScore
  • 15 days
    Submission to First Decision
  • 3 days
    Acceptance to Publication

Plants

Plants is an international, scientific, peer-reviewed, open access journal on plant science published semimonthly online by MDPI. The Spanish Phytopathological Society (SEF), the Spanish Society of Plant Biology (SEBP), the Spanish Society of Horticultural Sciences (SECH) and the Italian Society of Phytotherapy (S.I.Fit.) are affiliated with Plants and their members receive a discount on the article processing charges.
  • Open Access— free for readers, with article processing charges (APC) paid by authors or their institutions.
  • High Visibility: indexed within Scopus, SCIE (Web of Science), PubMed, PMC, PubAg, AGRIS, CAPlus / SciFinder, and other databases.
  • Journal Rank: JCR - Q1 (Plant Sciences) / CiteScore - Q1 (Ecology, Evolution, Behavior and Systematics)
  • Rapid Publication: manuscripts are peer-reviewed and a first decision is provided to authors approximately 14.8 days after submission; acceptance to publication is undertaken in 2.9 days (median values for papers published in this journal in the first half of 2026).
  • Recognition of Reviewers: Reviewers whose reports are timely and of high quality receive an APC discount voucher for a future publication in an MDPI journal. Become a reviewer.
  • Companion journals for Plants include: Legumes and Plant Protection Insights.

Get Alerted

Add your email address to receive forthcoming issues of this journal.

All Articles (24,412)

  • Article
  • Open Access

SlPsbTn1 and SlPsbTn2 Contribute to Photosynthetic Thermotolerance in Tomato

  • Yingqi Hu,
  • Jingying Qian and
  • Yixuan Wang
  • + 10 authors

Photosynthesis determines plant growth but is sensitive to heat stress. Photosystem II (PSII) exhibits greater thermosensitivity than photosystem I (PSI). In tomato (Solanum lycopersicum), we found that the PSII low-molecular-weight protein, SlPsbTn, is markedly induced by heat stress, suggesting that it may play an important role in the heat response. The tomato genome contains two heat-induced genes, Solyc12g099650 and Solyc01g008510, encoding proteins localizing to the chloroplast (SlPsbTn1) and putatively the chloroplast, endoplasmic reticulum, and Golgi apparatus (SlPsbTn2), respectively, based on GFP-fusion observations. Loss of SlPsbTn1 or SlPsbTn2 function did not have effects on growth under control conditions, but resulted in a more pronounced decline in photosynthetic capacity under heat stress in these single mutants. By contrast, overexpressing SlPsbTn1 or SlPsbTn2 helped protect PSII against heat stress. In addition, the basic leucine zipper (bZIP) transcription factor SlbZIP51 was found to associate specifically with the SlPsbTn1 promoter, whereas the yeast one-hybrid assay showed no binding of SlbZIP51 to the SlPsbTn2 promoter. These findings suggest that SlPsbTn1 and SlPsbTn2 play protective roles in maintaining photosynthetic performance during heat stress. Furthermore, SlbZIP51 positively regulates the heat-induced transcription of SlPsbTn1, whereas the upstream regulator of SlPsbTn2 remains to be identified.

Plants

14 November 2026

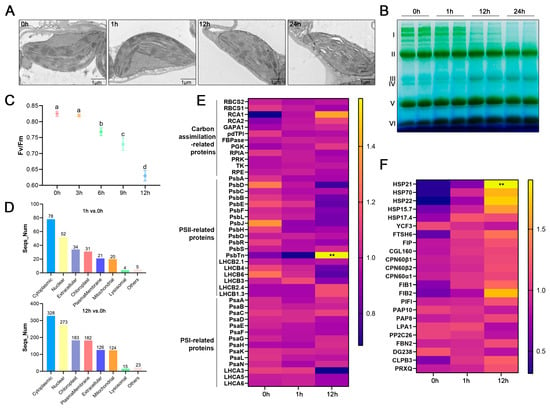
Analysis of photosynthetic damage in tomato chloroplasts under heat stress. (A) Chloroplast ultrastructure observation of the WT at 42 °C for 0 h, 1 h, 12 h and 24 h. Data are representative of three independent biological replicates. Bars, 1 μm. (B) BN-PAGE analysis of chlorophyll–protein complexes. Thylakoid membrane samples with equal concentration from the leaves of the WT at 25 °C (0 h) or 42 °C for 1 h, 12 h, and 24 h were solubilized by treatment with 2% (w/v) DM (n-Dodecyl-beta-D-maltoside) and separated by BN-PAGE. Data are representative of three independent biological replicates. The assignments of macromolecular protein complexes of thylakoid membranes indicated at left. I, PSII supercomplexes; II, PSI + PSII dimer; III, PSII monomer; IV, CP43 free PSII; V, LHCII trimer; VI, LHCII monomer. (C) Maximal photochemical efficiency of PSII (Fv/Fm) values of the WT during heat treatment. Data are presented as means ± SD of three biological replicates. Different lowercase letters indicate significant differences (p < 0.05, one-way ANOVA followed by Tukey’s post hoc test). (D) Subcellular localization analysis of differentially abundant proteins (DAPs) in WT after 1h or 12h at 42 °C. The subcellular localizations were predicted based on database annotation of whole-leaf proteomics. Values above the bars denote the number of DAPs. (E,F) Protein abundance analysis of the proteins involved in carbon fixation, photosystem (E) and photosynthetic capacity maintenance (F). The heatmaps display the relative protein abundance (ratio) of each protein. Ratios were calculated as the median of unique peptide ratios, normalized to the sample’s median ratio. Higher protein levels are shown in yellow and lower protein levels are shown in blue. Asterisks indicate significant differences (**, adjusted p < 0.05). Note: The highly homologous SlPsbTn1/SlPsbTn2 proteins could not be distinguished by mass spectrometry; thus, the proteomic data are presented as the PsbTn protein group.
  • Article
  • Open Access

Low phosphorus (P) availability limits the growth and productivity of Chinese fir (Cunninghamia lanceolata) plantations in southern China. Melatonin (MT) regulates plant growth and stress responses, but its effects on Chinese fir under low P conditions remain unclear. A sand-culture pot experiment was conducted with two clones differing in P use efficiency, No. 36 and No. 41. Treatments comprised a normal-P control without MT and low P supply with 0, 25, 50, 100, 150, or 200 μmol L−1 MT. Low P stress inhibited growth and photosynthetic performance and increased root membrane damage in both clones. Appropriate MT concentrations improved growth, photosynthetic performance, and pigment contents, modulated root antioxidant enzyme activities and protective compound accumulation, and reduced root malondialdehyde content and electrolyte leakage. Compared with the low P control without MT, 100 μmol L−1 MT increased shoot biomass by 87.80% and 41.41%, root biomass by 78.13% and 67.18%, and whole-plant P accumulation by 24.75% and 90.10% in No. 36 and No. 41, respectively. At this concentration, stem and whole-plant P use efficiency increased in No. 36, whereas No. 41 showed a greater relative increase in whole-plant P accumulation. Principal component analysis identified ascorbate peroxidase (APX) activity, transpiration rate (Tr), and stomatal conductance (gs) as representative physiological response indicators. Among the concentrations tested, 100 μmol L−1 MT produced the most favorable overall growth and physiological responses. These findings provide a physiological basis for further evaluation of melatonin as a treatment to improve Chinese fir seedling performance under P limitation.

Plants

14 November 2026

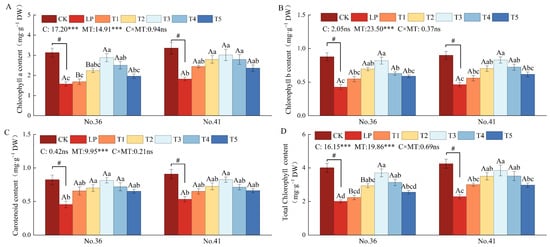
Effects of exogenous melatonin on photosynthetic pigment contents, including chlorophyll a content (A), chlorophyll b content (B), carotenoid content (C), and total chlorophyll content (D), in Chinese fir under low phosphorus stress. CK: normal phosphorus supply; LP (T0): low phosphorus without melatonin; T1, T2, T3, T4, and T5: low phosphorus with root application of 25, 50, 100, 150, and 200 μmol L−1 melatonin, respectively. Bars represent means ± SE (n = 4). Different lowercase letters indicate significant differences among low phosphorus treatments within the same clone, and different uppercase letters indicate significant differences between clones under the same treatment (p < 0.05). The # symbol indicates a significant difference between CK and LP (T0) within the same clone (p < 0.05). The two-way ANOVA includes only low phosphorus treatments (T0, T1, T2, T3, T4, and T5). Clone (C) and melatonin concentration (MT) were the two factors, and C × MT denotes their interaction. Numbers following C, MT, and C × MT in each panel indicate the corresponding F values; ***: p < 0.001; ns: not significant.
  • Article
  • Open Access

Mirabilis himalaica (Edgew.) Heimerl, known as “Bazhu” in Tibetan medicine, is an endangered medicinal plant whose roots are traditionally used to treat nephritic edema, kidney stones, joint pain, and uterine cancer. Small Auxin-Up RNA (SAUR) genes regulate cell expansion and plant growth, yet they remain uncharacterized in M. himalaica. Here, we identified 42 SAUR family members (MhSAURs) from the M. himalaica genome. Phylogenetic analysis placed MhSAUR1 in a clade with AtSAUR36, a regulator of hypocotyl elongation, and MhSAUR5 with AtSAUR40/41/71/72, which regulate hypocotyl elongation and biomass. MhSAUR1 was preferentially expressed in fibrous roots and MhSAUR5 in lateral roots, and both were rapidly induced by exogenous IAA. Heterologous overexpression of MhSAUR1 and MhSAUR5 in Arabidopsis and tobacco promoted leaf and root growth and biomass accumulation. Using the tissue-culture-free CDB method, we further generated MhSAUR1-overexpressing M. himalaica plants, in which root length and root dry weight were significantly increased relative to empty-vector controls. Homologous validation of MhSAUR5 was not performed in this study. These results identify MhSAUR1 and MhSAUR5 as candidate auxin-responsive growth-promoting genes, with MhSAUR1 functionally validated in the native species, and indicate that CDB is a feasible, though currently low-efficiency, transformation route for this recalcitrant medicinal plant.

Plants

14 November 2026

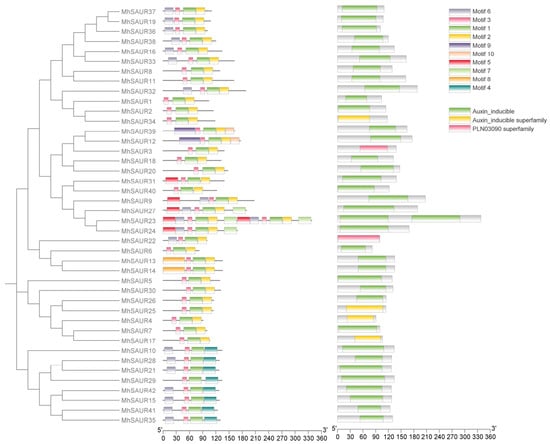
Analysis of conserved motifs and conserved domains of the MhSAUR gene family. Left panel: phylogenetic tree of MhSAUR proteins. Middle panel: distribution of conserved motifs (Motif 1–10) in MhSAUR proteins. Right panel: conserved domains (Auxin_inducible, Auxin_inducible superfamily, and PLN03090 superfamily). The scale bars at the bottom indicate the amino acid sequence length (aa). Different colored boxes represent different motifs or domains, as indicated in the legend. The 5′ and 3′ ends indicate the orientation of the protein sequences.
  • Article
  • Open Access

Mitogen-activated protein kinases (MAPKs) play important roles in plant stress signaling, but the contribution of MAPK group D in maize drought tolerance remains unclear. Here, we investigated MAPK group D ZmMAPK14 through phylogenetic and structural analyses, kinase activity assays, transgenic functional characterization, physiological measurements, biochemical analyses and RNA sequencing. ZmMAPK14 was classified as a group D MAPK containing the threonine-aspartate-tyrosine (TDY) motif, and drought stress significantly induced an increase in its kinase activity. ZmMAPK14-overexpressing lines exhibited higher survival rates, greater leaf relative water content, reduced detached-leaf water loss, lower membrane injury and reactive oxygen species (ROS) accumulation, and increased antioxidant enzyme activities. In contrast, ZmMAPK14-knockdown lines showed the opposite phenotypes. Transcriptome analysis identified 2005 drought-responsive genes in ZmMAPK14-overexpressing and knockdown lines. Gene Ontology (GO) enrichment analysis revealed significant enrichment of the “response to oxidative stress” term (GO:0006979) among drought-responsive genes in ZmMAPK14-overexpressing lines. This term comprised 313 differentially expressed genes (DEGs), including 13 antioxidant enzyme-encoding genes with diverse expression patterns. Collectively, these findings demonstrated that ZmMAPK14 positively regulates drought tolerance in maize by improving water status and strengthening antioxidant defense, providing a basis for further investigation of its underlying regulatory mechanisms.

Plants

14 November 2026

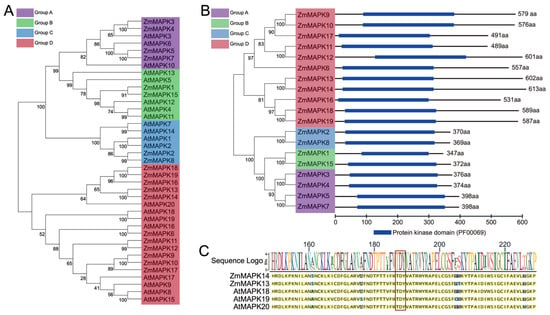
Phylogenetic classification, protein kinase domain distribution, and conserved activation-loop motif of maize MAPKs. (A) Phylogenetic tree of maize (Zea mays) and Arabidopsis (Arabidopsis thaliana) MAPK proteins. MAPKs were classified into four groups (A–D), indicated by purple, green, blue, and red, respectively. Numbers at the branches indicate branch-support values. (B) Protein lengths and distributions of the conserved protein kinase domain (PF00069) among the 19 maize MAPK proteins. Blue bars indicate the positions and extents of the protein kinase domain, and the numbers on the right indicate protein lengths in amino acids (aa). (C) Sequence logo and multiple-sequence alignment of the conserved MAPK activation-loop region. The conserved TDY motif is highlighted by a red box.

Featured Articles of Last Quarter

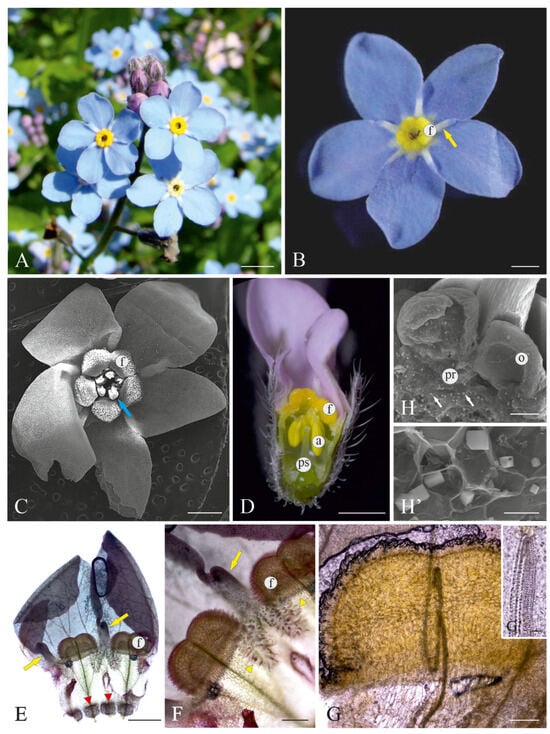
Inflorescences and flowers of M. scorpioides (C,H,H’) and M. sylvatica (A,B,D,E–G’); stereoscopic microscopy (SM)—(B,D), scanning electron microscopy (SEM)—(C,H,H’), light microscopy (LM)—(E–G’). (A) Flowers borne on scorpioid cymes. (B) Magnification of a flower with visible faucal scales and white appendages on petals (yellow arrow). (C) Flower with velvety texture of petals; blue arrow shows an appendage of stamen connectives. (D) Faucal scales and anthers on the longitudinal section of a flower. (E) Inner part of the flower with faucal scales, appendages on petals (yellow arrows), and basal scales (red arrowheads). (F) Parts of petals with faucal scales, appendages on petals (yellow arrows), and trichomes beneath them (yellow arrowheads). (G) Faucal scale with a vascular bundle running through its centre. (G’) Magnification of a vascular bundle of the faucal scale with helical vessels. (H) Part of the longitudinal section of a flower with the ovary and receptacle parenchyma with visible calcium oxalate crystals (white arrows). (H’) Magnification of receptacle parenchyma cells with prismatic calcium oxalate crystals. (F,G) Staining with Sudan Red B; a—anther, f—faucal scale, o—ovary, ps—pistil. Scale bars = 3 mm (A); 1 mm (B,D); 0.7 mm (C); 0.5 mm (F); 200 µm (G); 100 µm (E,H), 50 µm (H’), 5 µm (G’).
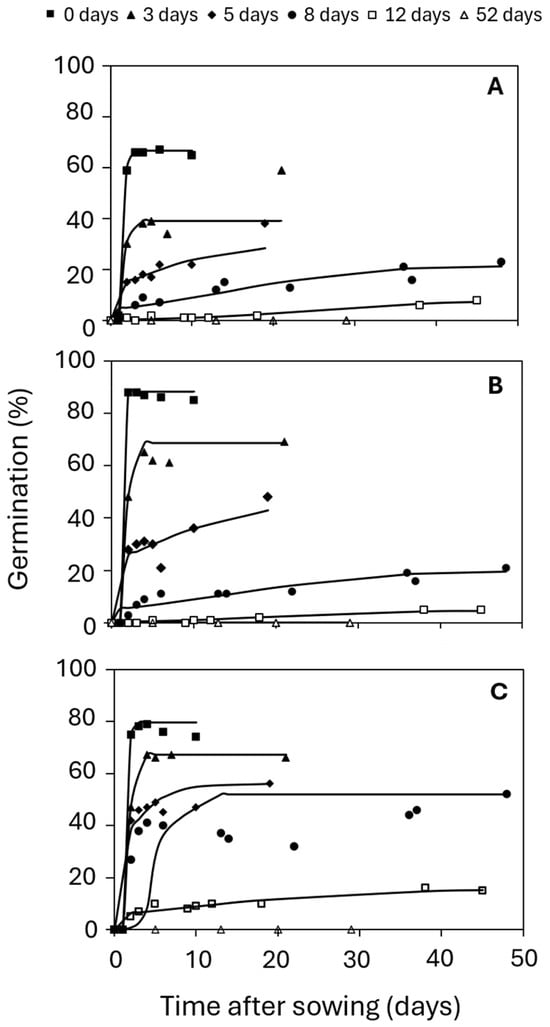
Germination curves for experimentally aged Funaria hygrometrica spores at different maturity stages: (A) most immature spores in green capsules, (B) near-full maturity spores in yellow capsules, (C) fully mature spores in brown capsules. In each curve, symbols represent the proportion of germination over time measured for each aging time assayed (indicated with different symbols). The resultant germination curves (solid lines) follow a sigmoidal distribution obtained after fitting the experimental points of each aging time to a Boltzmann curve.
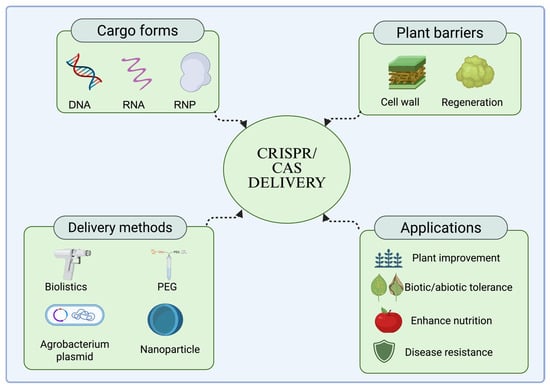
General components of CRISPR/Cas delivery in plants. Created in BioRender. Huiban, F. (2026) https://BioRender.com/pl7bf0a.

Highly Accessed Articles

News & Conferences

Latest Issues

Open for Submission

Journal Sections

XFacebookLinkedIn
Plants - ISSN 2223-7747