- Article

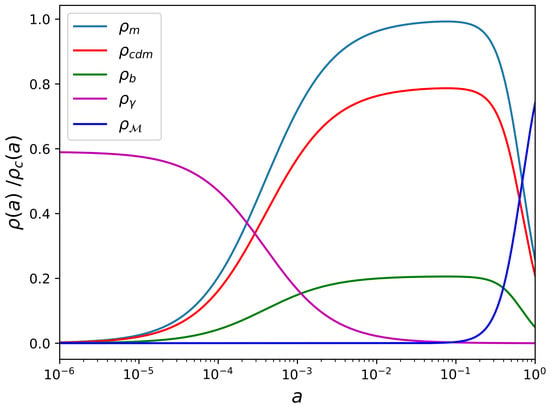
Recent DESI results suggest a preference for evolving dark energy (DE) over a cosmological constant, motivating the exploration of alternative models for the background expansion. These data also lead to neutrino-mass constraints close to the lower bounds permitted by oscillation experiments. In this work, we propose and test a conformal holographic dark energy (CHDE) model in which the DE density depends on a power law of the conformal time, characterized by an exponent n. The model introduces one additional parameter relative to ΛCDM and reduces to it in the limit . We confront CHDE with BAO, CMB, and SNe Ia datasets, following the combinations used by DESI, and perform parameter inference in both flat and non-flat cosmologies. We find a consistent preference for to , with uncertainties below , and disfavor the ΛCDM limit at the – level; however, the model-comparison statistics provide no consistent preference for CHDE over ΛCDM. The resulting neutrino-mass constraints remain compatible with terrestrial limits and yield posterior distributions that peak at positive values, avoiding the negative-mass preference found in ΛCDM. The CHDE model is therefore consistent with current observational constraints and provides a viable alternative to constant dark energy.
13 November 2026