
Bias Investigation in Artificial Intelligence Systems for Early Detection of Parkinson’s Disease: A Narrative Review
 ,
, 
 ,
,
Abstract
:1. Introduction
2. Search Strategy and Statistical Distribution
2.1. PRISMA Model
2.2. Statistical Distribution
Performance Metrics
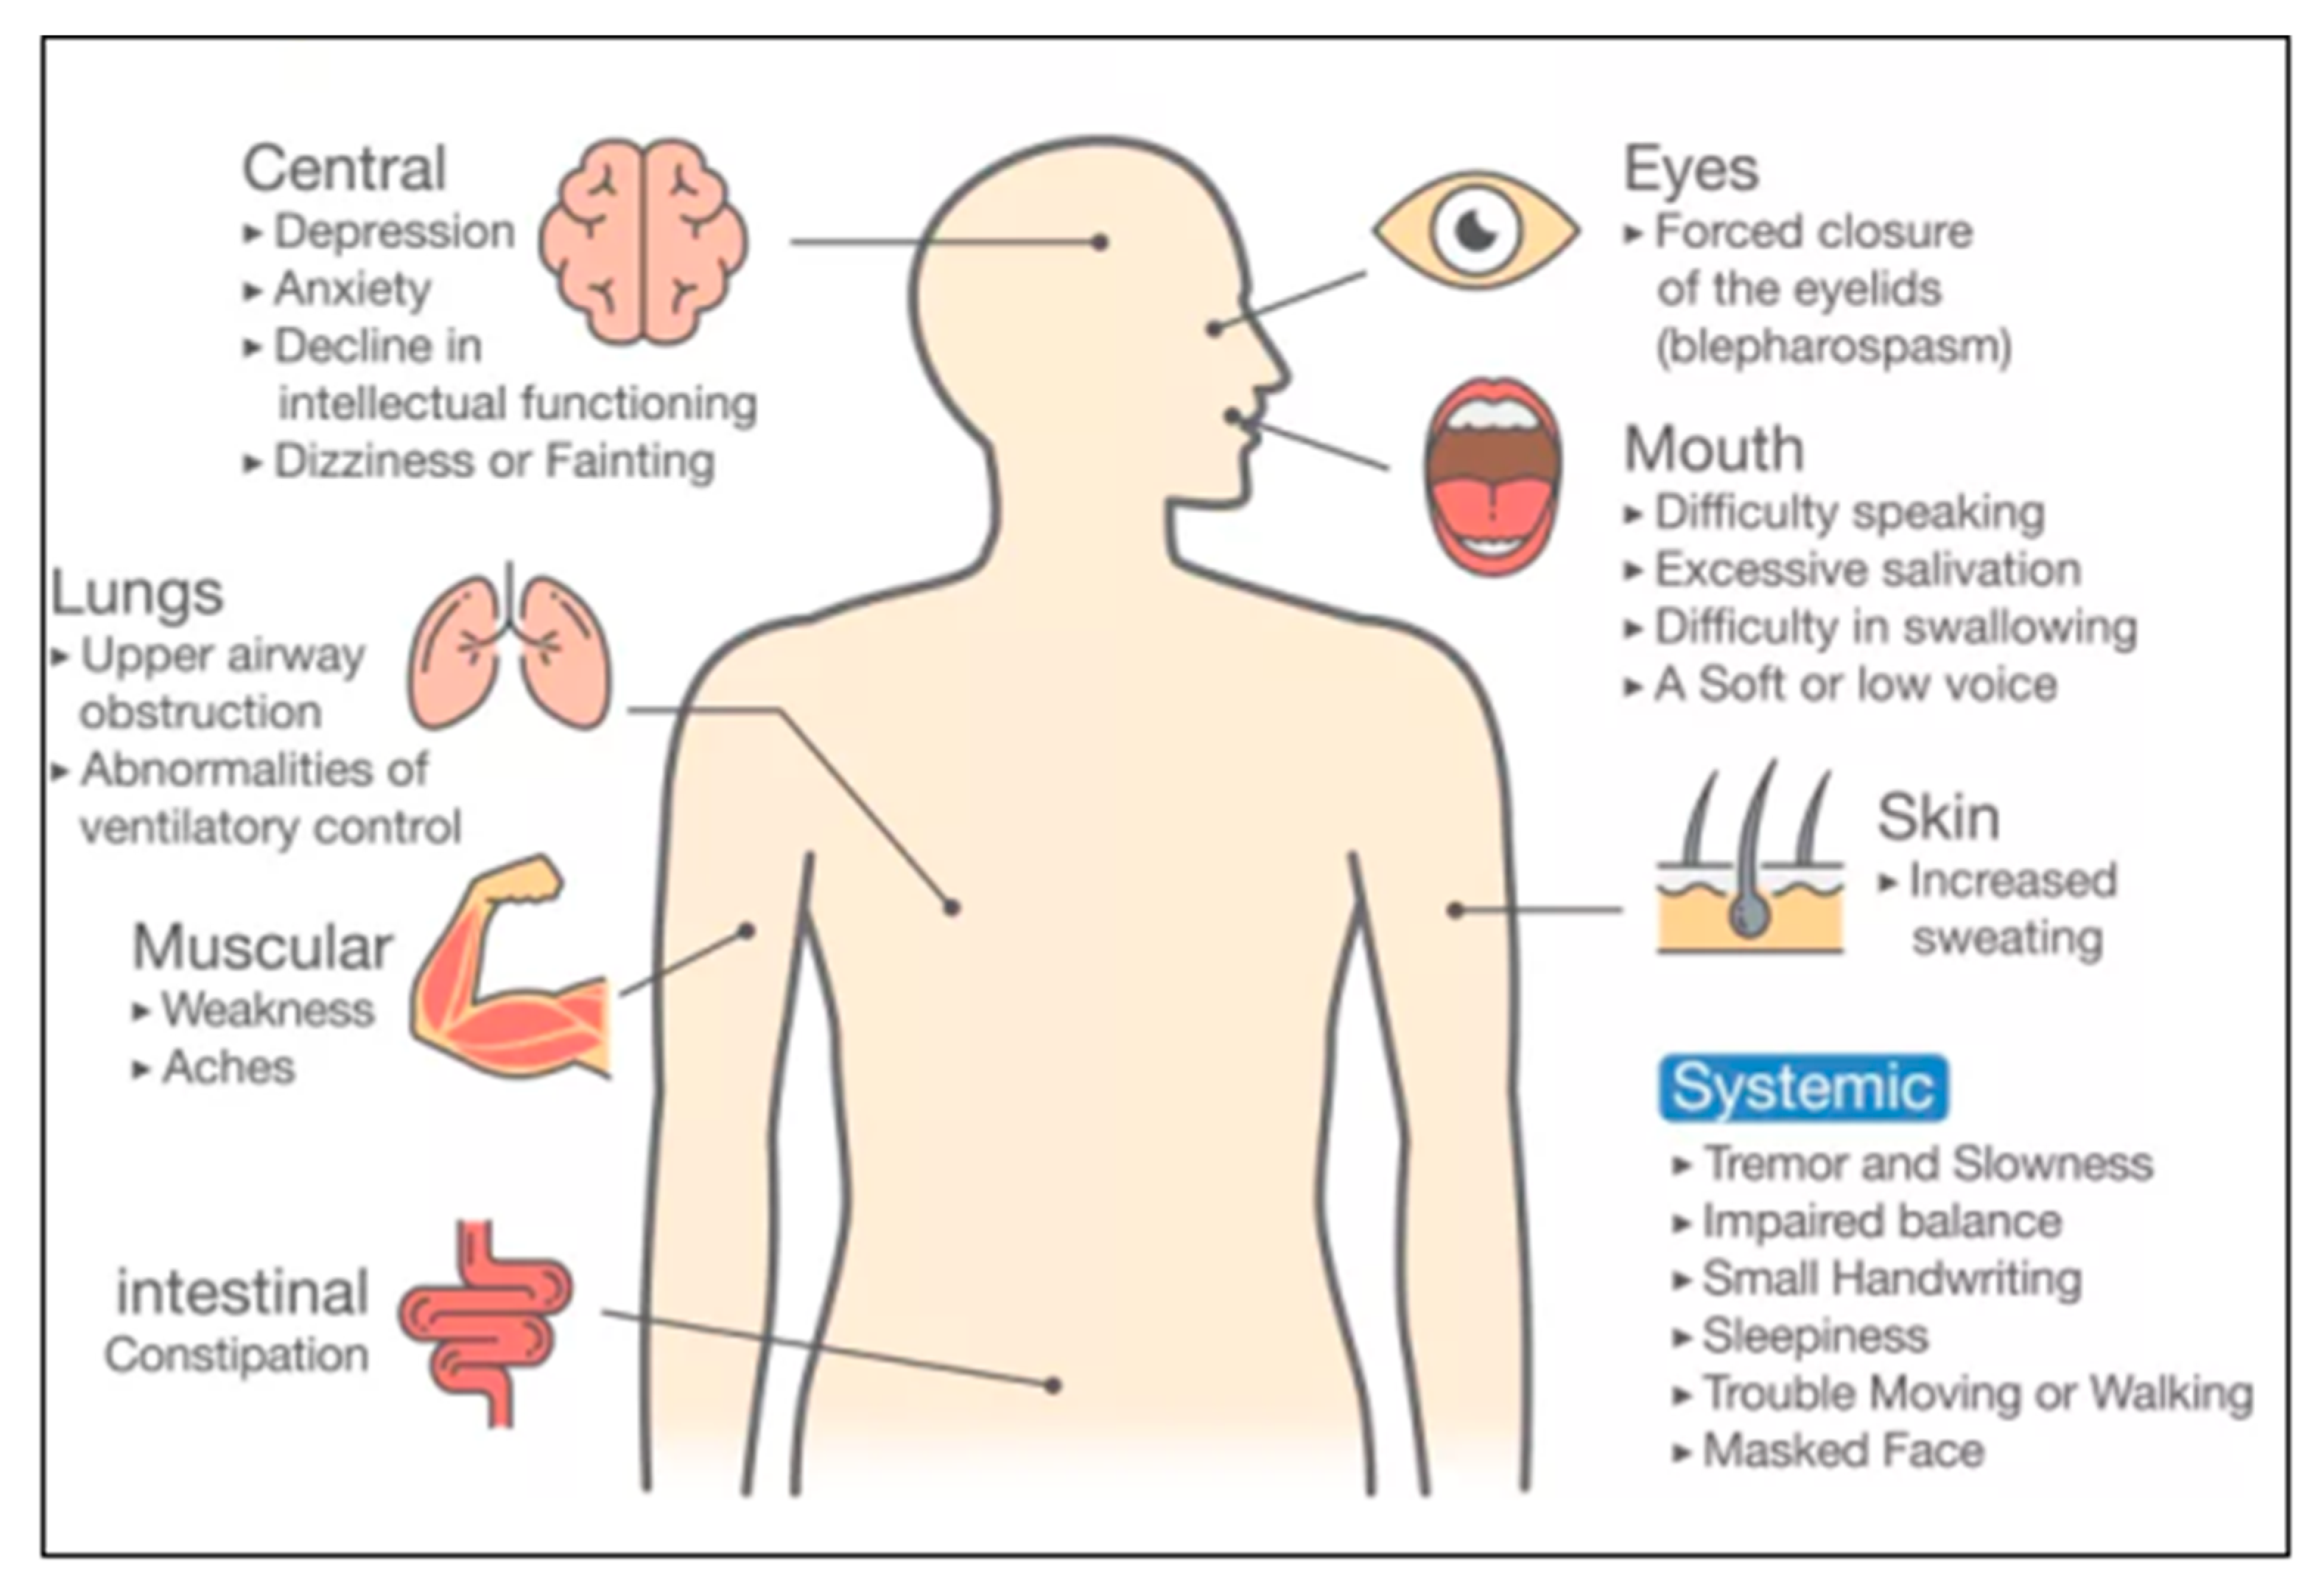
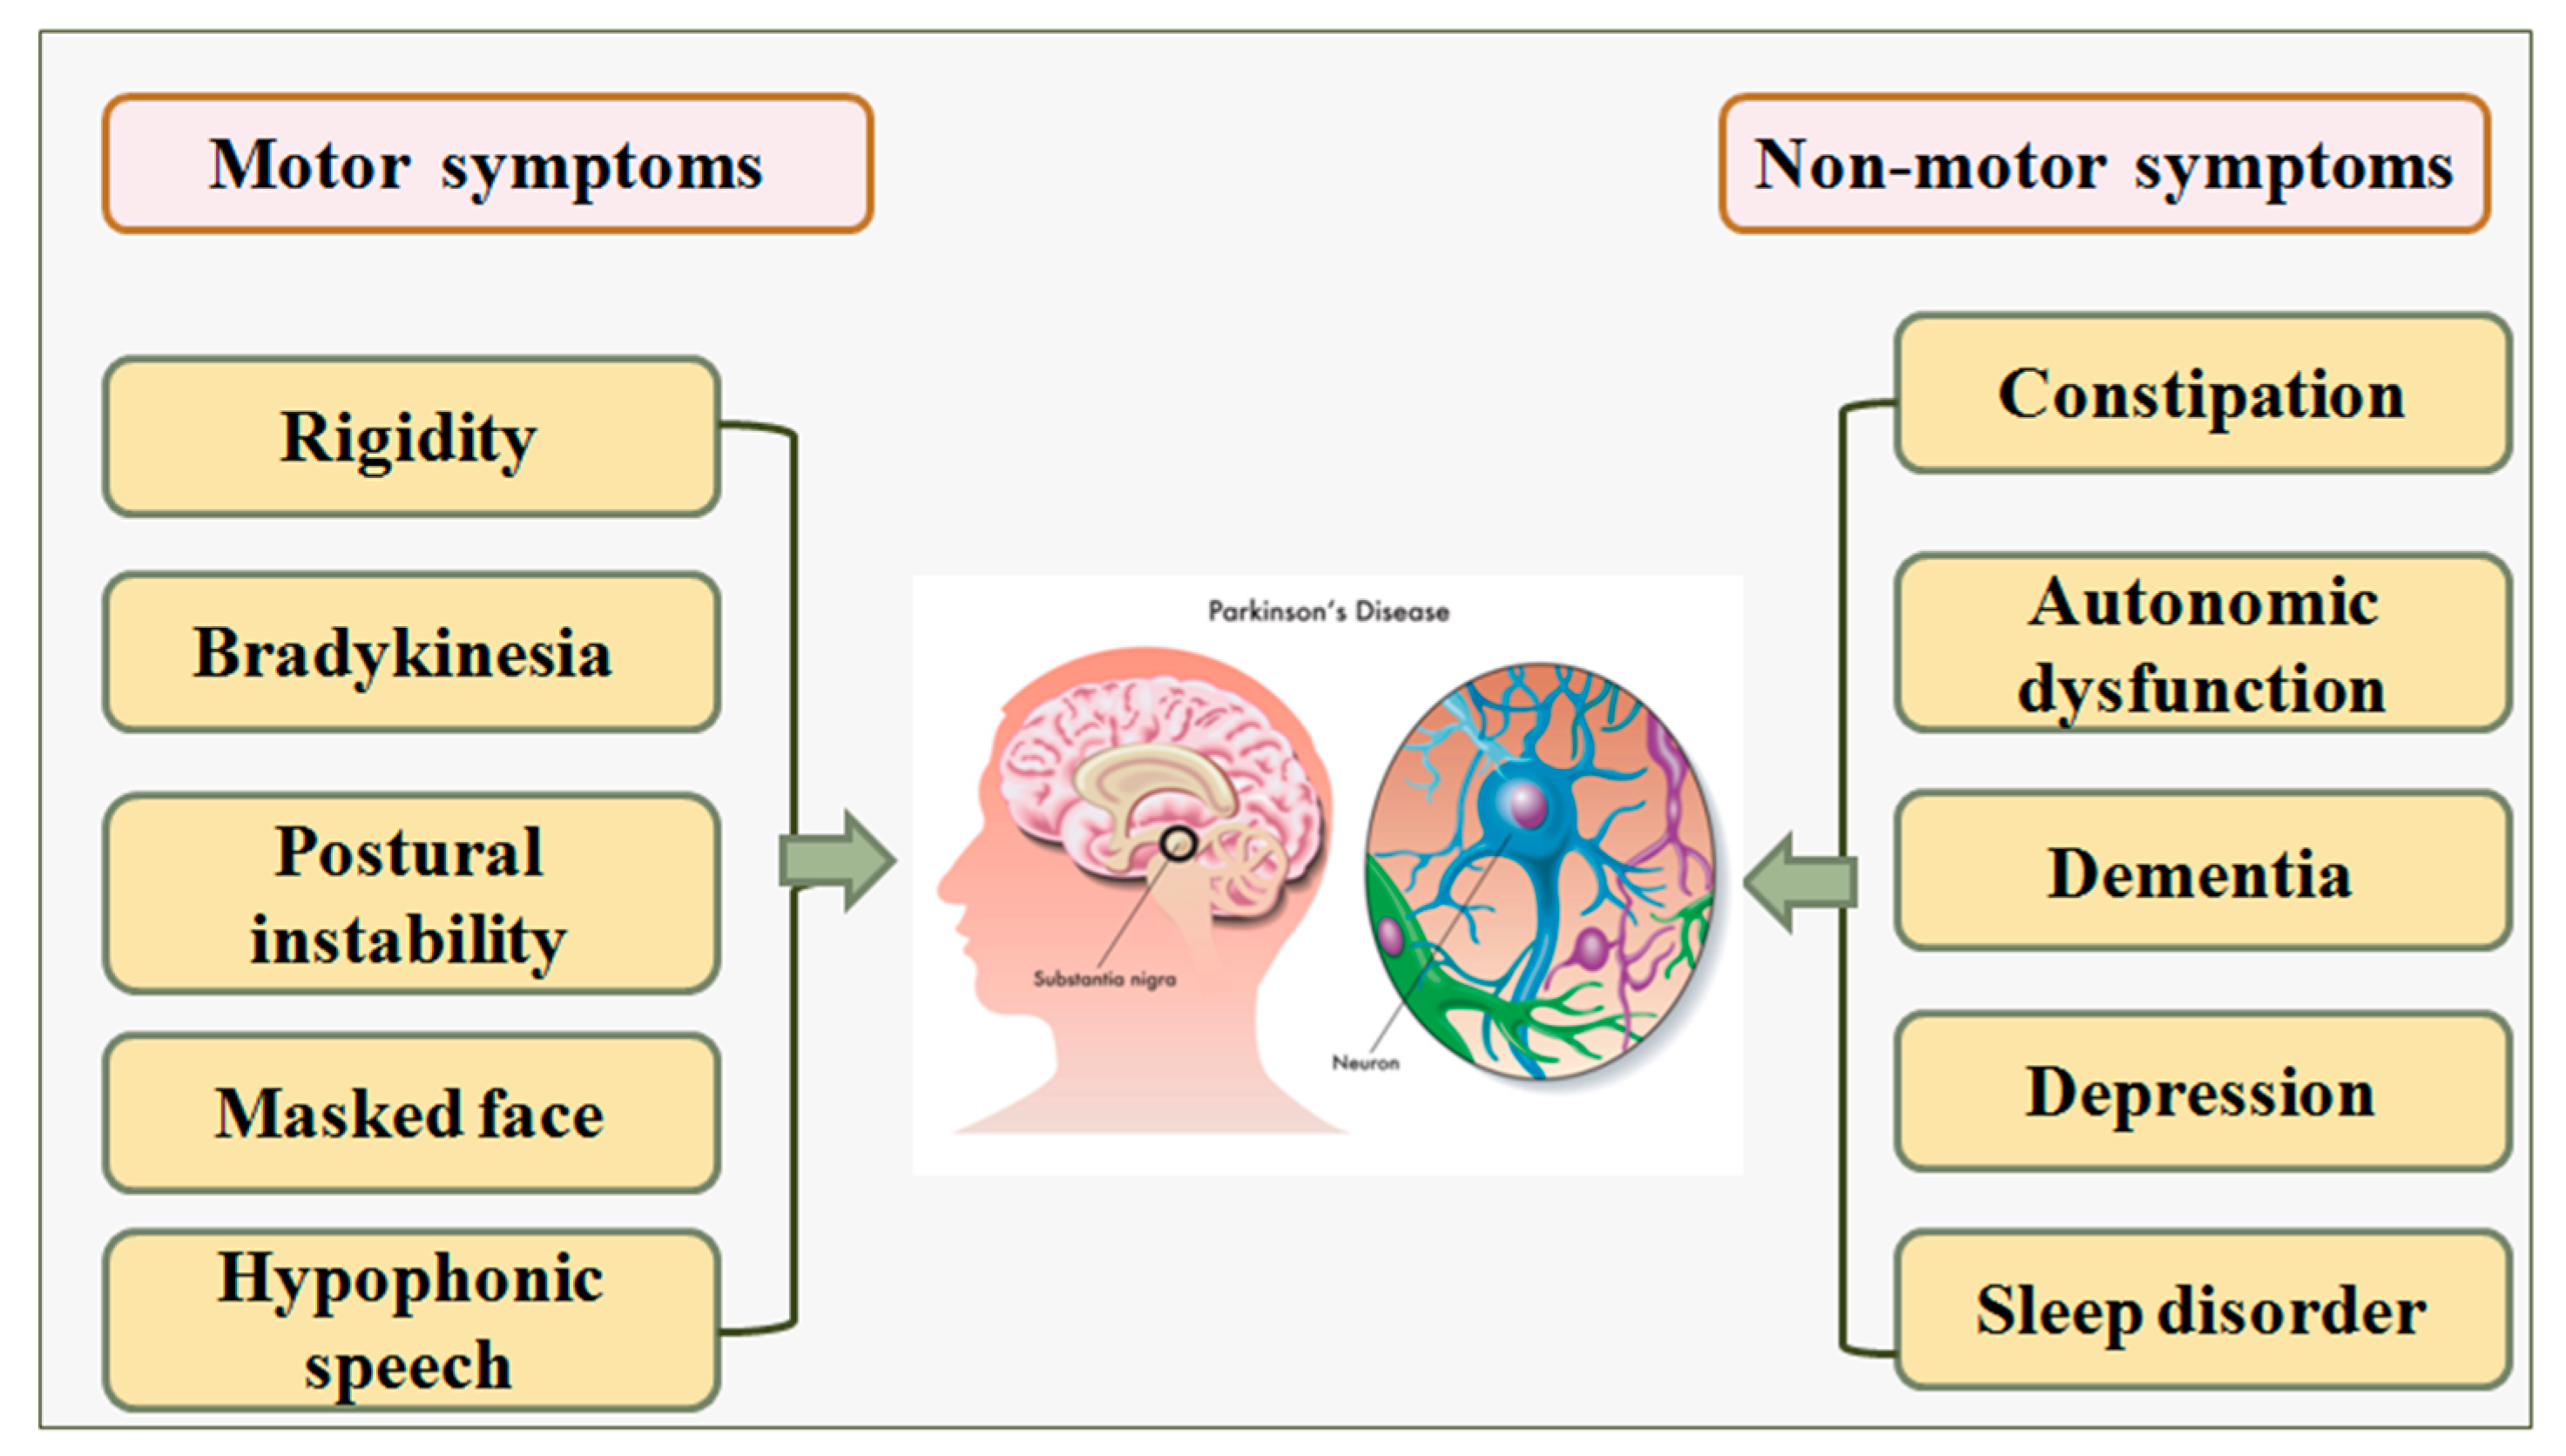
3. Biology of Parkinson’s Disease
4. Artificial Intelligence Architectures
4.1. A Note on Assumptions for Adaptation of the ML Algorithms
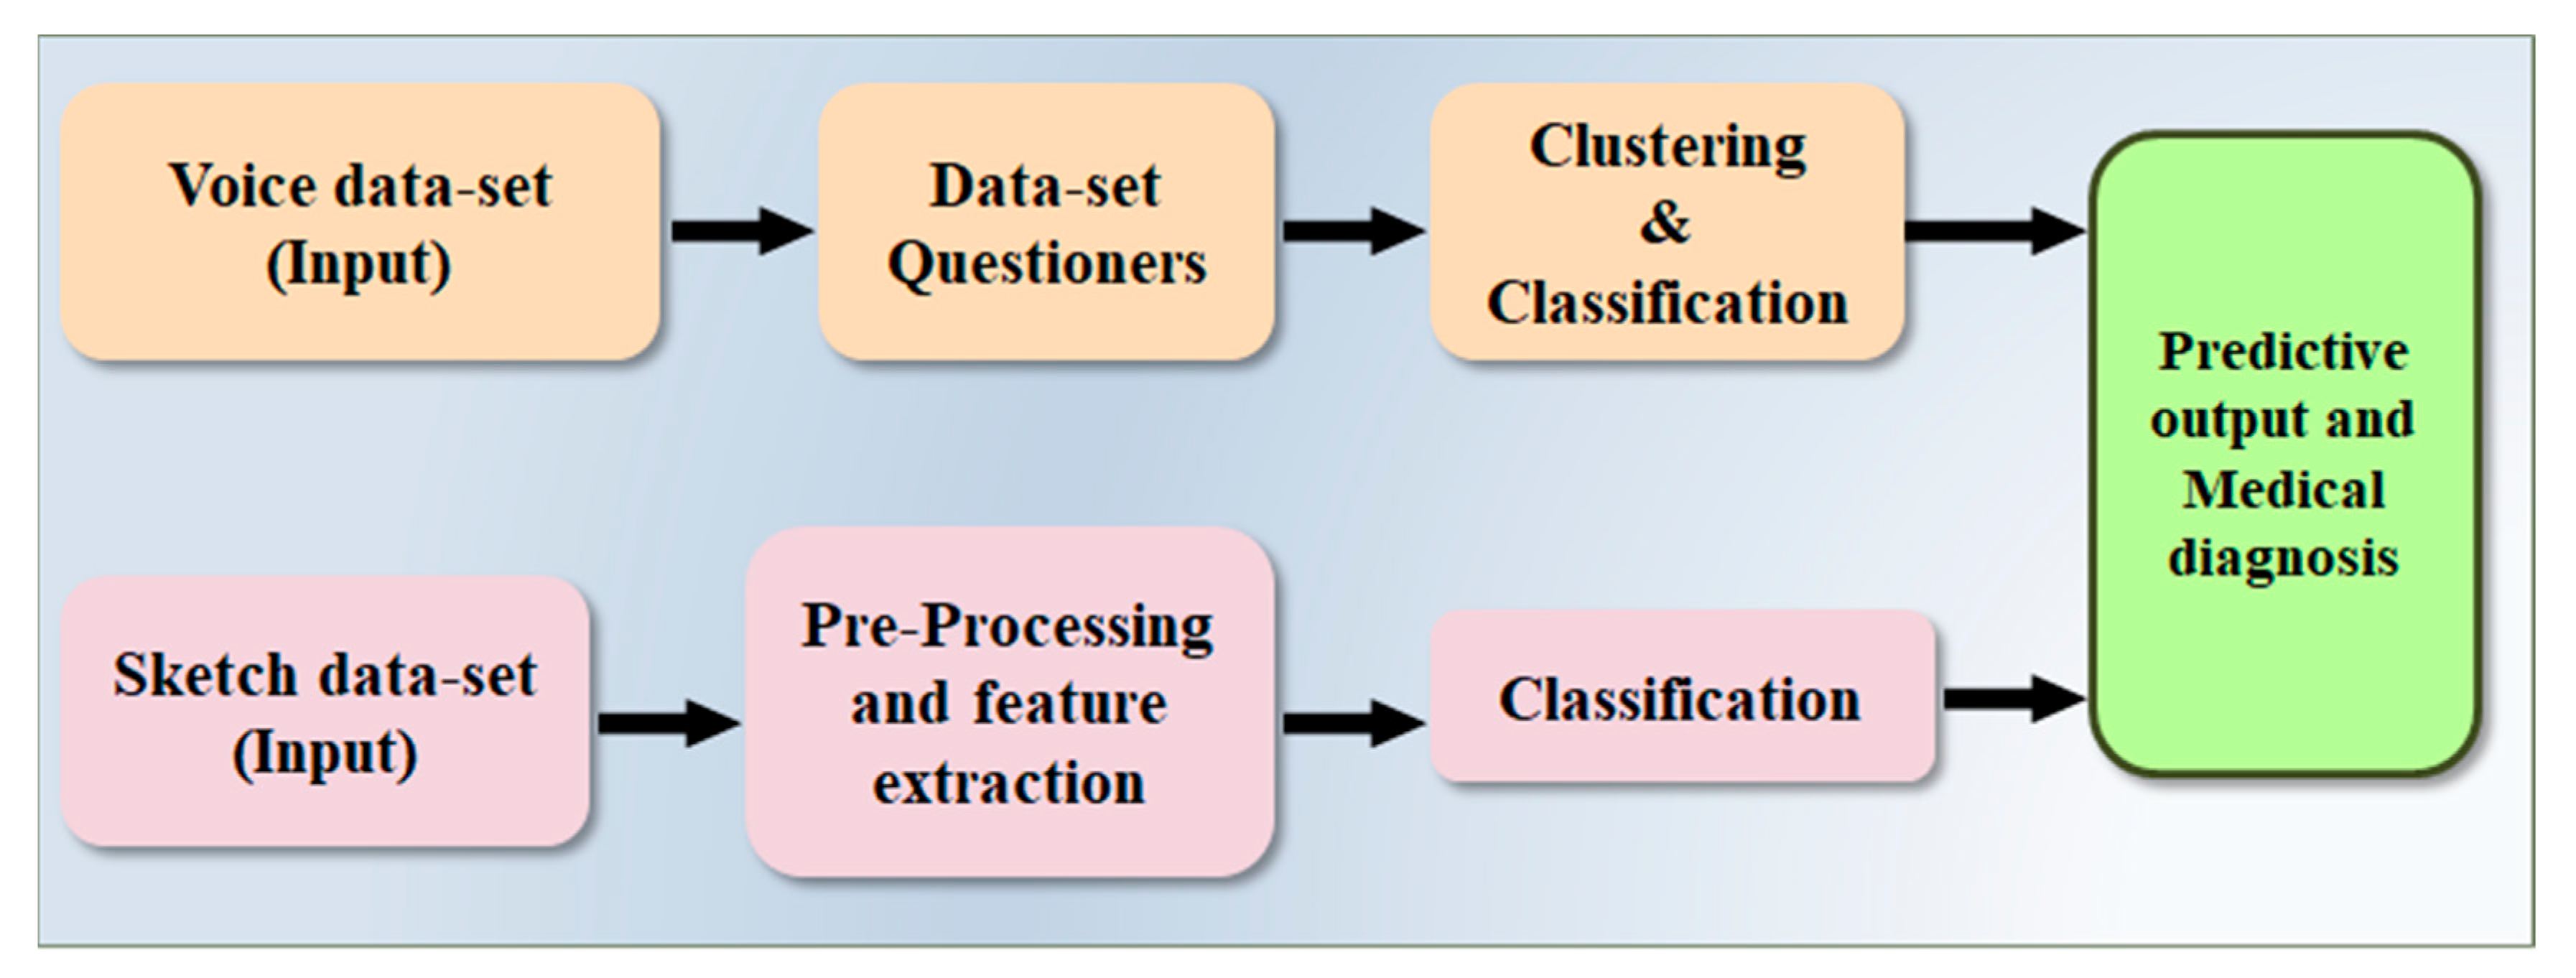
4.2. Architecture Based on Voice and Sketch Input
4.3. Architecture Based on Tremor
4.4. Architecture Based Speech Input with Information Gain Parameter
5. Ranking of Selected Studies
5.1. Grading, Scoring, and Ranking of the Studies
5.2. Bias Cutoff Computation
5.3. Linking of Bias with AI Architectures
5.4. Bias Distribution in AI Attributes
5.5. Recommendations for Bias Reduction
6. Discussion
6.1. Principal Findings
6.2. Benchmarking
6.3. A Short Note on Bias in ML
6.4. A Short Note PD Database and Gender Studies
6.5. Role of Human-Computer Interface in Early Detection of the PD
6.6. Strengths, Weakness, and Extensions of Our Study
7. Conclusions
Author Contributions
Funding
Institutional Review Board Statement
Informed Consent Statement
Data Availability Statement
Conflicts of Interest
Abbreviations
| SN | Abb* | Definition | SN | Abb* | Definition |
| 1 | AI | Artificial intelligence | 25 | HMI | Human-machine interface |
| 2 | AA | Attribute Analysis | 26 | IEC | Inclusive and Exclusive criteria |
| 3 | AUC | Area under curve | 27 | IPA | Input parameter analysis |
| 4 | ACC | Accuracy | 28 | InParm | Input parameter |
| 5 | ARC | Architecture | 29 | MAE | Mean absolute error |
| 6 | BA | Benchmarking analysis | 30 | ME | Model Evaluation |
| 7 | BN | Batch normalization | 31 | ML | Machine learning |
| 8 | BS | Bias studies | 32 | NPV | Negative predictive value |
| 9 | BI | Brain interface | 33 | MSE | Mean square error |
| 10 | OB | Objective | 34 | PCA | Principal component analysis |
| 11 | CV | Cross-validation | 35 | PE | Performance evaluation indicator |
| 12 | CT | Classifier type | 36 | RoB | Risk of bias |
| 13 | CNN | Convolution neural network | 37 | RNN | Recurrent neural network |
| 14 | CONV | Convolution | 38 | RF | Random forest |
| 15 | CVD | Cardiovascular disease | 39 | SEN | Sensitivity |
| 16 | DL | Deep learning | 40 | SV | Scientific validation |
| 17 | DT | Decision tree | 41 | SDL | Solo deep learning |
| 18 | DE | Data Extraction | 42 | SPE | Specificity |
| 19 | DD | Demographic discussion | 43 | SVM | Support vector machine |
| 20 | DS | Data set | 44 | P | Precision |
| 21 | DSE | Dataset Size | 45 | R | Recall |
| 22 | ET | Ethnicity | 46 | RS | Reference studies |
| 23 | EEG | Electroencephalography | 47 | PD | Parkinson’s Disease |
| 24 | HAR | Human activity recognition | 48 | Abb* | Abbreviations |
Appendix A

| Cluster Type | A# | Name of Attributes | #A/C | Grading Scheme (G*) |
|---|---|---|---|---|
| Cluster 1 (Publications Details) | A1 | Citation | 3 | 5 (G = 3); 3 (G < 3); 1 (G < 2) |
| A2 | Year of Publication | |||
| A3 | Impact Factor | |||
| Cluster 2 (Objective) | A4 | Objective | 4 | 5 (G = 4); 4 (G < 3); 3 (G < 2); 1 (G = 1) |
| A5 | Dataset Used | |||
| A6 | Dataset Size | |||
| A7 | Diagnosis Method | |||
| Cluster 3 (AI Architecture) | A8 | AI Type | 7 | 5 (G = 7); 4 (G < 5); 3 (G < 4); 2 (G< 3); 1 (G < 2); 0 (G = 1); |
| A9 | Architecture Used | |||
| A10 | Internal Layers Used | |||
| A11 | Type of Classifiers | |||
| A12 | Data Pre-Processing | |||
| A13 | Feature Extraction | |||
| A14 | Activation Function | |||
| Cluster 4 (Optimization) | A15 | Learning/Optimization Algorithm | 3 | 5 (G = 3); 4 (G < 2); 2 (G = 1); 0 (G = 0) |
| A16 | Evaluation Metrics Used for Classification | |||
| A17 | Comparison With | |||
| Cluster 5 (Performance) | A18 | Accuracy | 7 | 5 (G = 7); 4 (G < 5); 3 (G < 4); 2 (G < 3); 0 (G = 1) |
| A19 | Sensitivity | |||
| A20 | Specificity | |||
| A21 | AUC | |||
| A22 | MCC | |||
| A23 | NPV | |||
| A24 | F1 | |||
| Cluster 6 Clinical Evaluation and Benchmarking | A25 | Demographic | 6 | 5 (G = 6); 4 (G < 5); 3 (G < 4); 2 (G < 3); 0 (G = 1); |
| A26 | Age | |||
| A27 | Ethnicity | |||
| A28 | Validation | |||
| A29 | Seen Vs. Unseen | |||
| A30 | Treatment |
Appendix B
| SN | A0 | A1 | A2 | A3 | A4 | A5 | A6 | A7 | A8 |
|---|---|---|---|---|---|---|---|---|---|
| Citations | DS | DSE | ET | Age (yrs) | InPram | Arch | CT | ACC (%) | |
| 1 | Alzubaidi et al. [30] (2021) | ACM | 1011 | Asian | 60 | Tremor | HDL | SVM, CNN | 87.9 |
| 2 | Ahmed et al. [31] (2021) | UCI | 104 | Asian | 60 | Voice | ML | RNN | 95.8 |
| 3 | Mei et al. [17] (2021) | PubMed, IEEE | 209 | Europe | 60 | Voice | ML | SVM | 83.07 |
| 4 | Singamaneni et al. [22] (2021) | UCI | 410 | Asian | 50 | Voice | ML | LDR | 94.86 |
| 5 | Jaichandran et al. [20] (2020) | UCI | 129 | Asian | 60 | Voice | ML | SVM, ET, K-Mean | 78.34 |
| 6 | Anitha et al. [6] (2020) | UCI | 467 | Asian | 50 | Voice | ML | CNN | 90.21 |
| 7 | Maitín et al. [15] (2020) | ACM, IEEE | 780 | America | 60 | EEG | ML | SVM | 62.99 |
| 8 | Poorjam et al. [13] (2019) | PPMI | 24 | Australia | 50 | Voice | HDL | iHMM | 96.00 |
| 9 | Aseer et al. [1] (2019) | MNIST | 255 | Asian | 65 | Handwriting | SDL | CNN | 98.28 |
| 10 | Naghsh et al. [35] (2019) | ELAB | 20 | Asian | 50 | EEG | SDL | ICA, SVM, K-Mean | 97.38 |
| 11 | Wang et al. [6] (2017) | PPMI | 584 | Asian | 50 | Biomarker | HDL | CNN, SVM, RF, NB, BT | 96.12 |
Appendix C
| Attributes (Left to Right) | A0 | A1 | A2 | A3 | A4 | A5 | A6 | A7 |
|---|---|---|---|---|---|---|---|---|
| Citations | IP | AI | ACC | SEN | SPE | AUC | MCC | F1 |
| Alzubaidi et al. [30] (2021) | Tremor | HDL | 87.9 | - | - | - | 89.34 | 1.17 |
| Ahmed et al. [31] (2021) | Voice | ML | 95.8 | 90.24 | 92.3 | - | 92.03 | 96 |
| Mei et al. [17] (2021) | Voice | ML | 83.07 | - | - | 0.91 | - | - |
| Singamaneni et al. [22] (2021) | Voice | ML | 94.86 | - | - | - | - | - |
| Jaichandran et al. [20] (2020) | Voice | ML | 78.34 | - | - | - | - | - |
| Anitha et al. [6] (2020) | Voice | ML | 90.21 | 1.8 | 4.39 | 2.49 | 1.17 | |
| Maitín et al. [15] (2020) | EEG | ML | 62.99 | 0.9067 | 0.981 | - | - | - |
| Poorjam et al. [13] (2019) | Voice | HDL | 96.00 | - | - | - | - | - |
| Aseer et al. [1] (2019) | Handwriting | SDL | 98.28 | - | - | - | - | |
| Naghsh et al. [35] (2019) | EEG | SDL | 97.38 | 0.9891 | 0.987 | - | - | - |
| Wang et al. [6] (2017) | Biomarker | HDL | 96.12 | - | - | - | - | - |
References
- Aal, H.A.A.E.; Taie, S.A.; El-Bendary, N. An optimized RNN-LSTM approach for parkinson’s disease early detection using speech features. Bull. Electr. Eng. Inform. 2021, 10, 2503–2512. [Google Scholar] [CrossRef]
- Priya, S.J.; Rani, A.J.; Subathra, M.; Mohammed, M.A.; Damaševičius, R.; Ubendran, N. Local pattern transformation based feature extraction for recognition of Parkinson’s disease based on gait signals. Diagnostics 2021, 11, 1395. [Google Scholar] [CrossRef]
- Bhat, S.; Acharya, U.R.; Hagiwara, Y.; Dadmehr, N.; Adeli, H. Parkinson’s disease: Cause factors, measurable indicators, and early diagnosis. Comput. Biol. Med. 2018, 102, 234–241. [Google Scholar] [CrossRef]
- Sabeena, B.; Sivakumari, S.; Amudha, P. A technical survey on various machine learning approaches for Parkinson’s disease classification. Mater. Today Proc. 2020. [Google Scholar] [CrossRef]
- Naseer, A.; Rani, M.; Naz, S.; Razzak, M.I.; Imran, M.; Xu, G. Refining Parkinson’s neurological disorder identification through deep transfer learning. Neural Comput. Appl. 2019, 32, 839–854. [Google Scholar] [CrossRef] [Green Version]
- Neharika, D.B.; Anusuya, S. Machine Learning Algorithms for Detection of Parkinson’s Disease using Motor Symptoms: Speech and Tremor. IJRTE 2020, 8, 47–50. [Google Scholar]
- Sriram, T.V.; Rao, M.V.; Narayana, G.S.; Kaladhar, D.; Vital, T.P.R. Intelligent Parkinson disease prediction using machine learning algorithms. Int. J. Eng. Innov. Technol. 2013, 3, 1568–1572. [Google Scholar]
- Liu, R.; Umbach, D.M.; Peddada, S.D.; Xu, Z.; Tröster, A.I.; Huang, X.; Chen, H. Potential sex differences in nonmotor symptoms in early drug-naive Parkinson disease. Neurology 2015, 84, 2107–2115. [Google Scholar] [CrossRef] [PubMed] [Green Version]
- Alzubaidi, M.; Shah, U.; Zubaydi, H.D.; Dolaat, K.; Abd-Alrazaq, A.; Ahmed, A.; Househ, M. The Role of Neural Network for the Detection of Parkinson’s Disease: A Scoping Review. Healthcare 2021, 9, 740. [Google Scholar] [CrossRef] [PubMed]
- Moore, S.T.; MacDougall, H.; Ondo, W.G. Ambulatory monitoring of freezing of gait in Parkinson’s disease. J. Neurosci. Methods 2008, 167, 340–348. [Google Scholar] [CrossRef] [PubMed]
- Ahlrichs, C.; Lawo, M. Parkinson’s Disease Motor Symptoms in Machine Learning: A Review. Health Inform.-Int. J. 2013, 2, 1–18. [Google Scholar] [CrossRef]
- Maitín, A.M.; García-Tejedor, A.J.; Muñoz, J.P.R. Machine Learning Approaches for Detecting Parkinson’s Disease from EEG Analysis: A Systematic Review. Appl. Sci. 2020, 10, 8662. [Google Scholar] [CrossRef]
- Mei, J.; Desrosiers, C.; Frasnelli, J. Machine Learning for the Diagnosis of Parkinson’s Disease: A Review of Literature. Front. Aging Neurosci. 2021, 13, 633752. [Google Scholar] [CrossRef]
- Isaacs, D. Artificial intelligence in health care. J. Paediatr. Child Health 2020, 56, 1493–1495. [Google Scholar] [CrossRef]
- Anitha, R.; Nandhini, T.; Raj, S.S.; Nikitha, V. Early detection of parkinson’s disease using machine learning. IEEE Access 2020, 8, 147635–147646. [Google Scholar]
- Challa, K.N.R.; Pagolu, V.S.; Panda, G.; Majhi, B. An improved approach for prediction of Parkinson’s disease using machine learning techniques. In Proceedings of the 2016 International Conference on Signal Processing, Communication, Power and Embedded System (SCOPES), Paralakhemundi, India, 3–5 October 2016; pp. 1446–1451. [Google Scholar] [CrossRef] [Green Version]
- Wroge, T.J.; Özkanca, Y.; Demiroglu, C.; Si, D.; Atkins, D.C.; Ghomi, R.H. Parkinson’s disease diagnosis using machine learning and voice. In Proceedings of the 2018 IEEE Signal Processing in Medicine and Biology Symposium (SPMB), Philadelphia, PA, USA, 1–7 December 2018. [Google Scholar]
- Shimoda, A.; Li, Y.; Hayashi, H.; Kondo, N. Dementia risks identified by vocal features via telephone conversations: A novel machine learning prediction model. PLoS ONE 2021, 16, e0253988. [Google Scholar] [CrossRef] [PubMed]
- Wibawa, M.S.; Nugroho, H.A.; Setiawan, N.A. Performance evaluation of combined feature selection and classification methods in diagnosing parkinson disease based on voice feature. In Proceedings of the 2015 International Conference on Science in Information Technology (ICSITech) Yogyakarta, Indonesia, 27–28 October 2015; pp. 126–131. [Google Scholar] [CrossRef]
- Saba, L.; Biswas, M.; Kuppili, V.; Godia, E.C.; Suri, H.S.; Edla, D.R.; Omerzu, T.; Laird, J.R.; Khanna, N.N.; Mavrogeni, S.; et al. The present and future of deep learning in radiology. Eur. J. Radiol. 2019, 114, 14–24. [Google Scholar] [CrossRef]
- Tandel, G.S.; Biswas, M.; Kakde, O.G.; Tiwari, A.; Suri, H.S.; Turk, M.; Laird, J.R.; Asare, C.K.; Ankrah, A.A.; Khanna, N.N.; et al. A Review on a Deep Learning Perspective in Brain Cancer Classification. Cancers 2019, 11, 111. [Google Scholar] [CrossRef] [Green Version]
- Biswas, M.; Kuppili, V.; Saba, L.; Edla, D.R.; Suri, H.S.; Cuadrado-Godia, E.; Laird, J.R.; Marinhoe, R.T.; Sanches, J.M.; Nicolaides, A.J.F.B. State-of-the-art review on deep learning in medical imaging. Front. Biosci. 2019, 24, 392–426. [Google Scholar]
- Maniruzzaman, M.; Kumar, N.; Abedin, M.M.; Islam, M.S.; Suri, H.S.; El-Baz, A.S.; Suri, J.S. Comparative approaches for classification of diabetes mellitus data: Machine learning paradigm. Comput. Methods Programs Biomed. 2017, 152, 23–34. [Google Scholar] [CrossRef]
- Maniruzzaman, M.; Rahman, J.; Hasan, A.M.; Suri, H.S.; Abedin, M.; El-Baz, A.; Suri, J.S. Accurate Diabetes Risk Stratification Using Machine Learning: Role of Missing Value and Outliers. J. Med. Syst. 2018, 42, 92. [Google Scholar] [CrossRef] [Green Version]
- Saba, L.; Sanagala, S.S.; Gupta, S.K.; Koppula, V.K.; Johri, A.M.; Khanna, N.N.; Mavrogeni, S.; Laird, J.R.; Pareek, G.; Miner, M.; et al. Multimodality carotid plaque tissue characterization and classification in the artificial intelligence paradigm: A narrative review for stroke application. Ann. Transl. Med. 2021, 9, 1206. [Google Scholar] [CrossRef]
- Jamthikar, A.D.; Gupta, D.; Mantella, L.E.; Saba, L.; Laird, J.R.; Johri, A.M.; Suri, J.S. Multiclass machine learning vs. conventional calculators for stroke/CVD risk assessment using carotid plaque predictors with coronary angiography scores as gold standard: A 500 participants study. Int. J. Cardiovasc. Imaging 2020, 37, 1171–1187. [Google Scholar] [CrossRef] [PubMed]
- Jamthikar, A.; Gupta, D.; Saba, L.; Khanna, N.N.; Araki, T.; Viskovic, K.; Mavrogeni, S.; Laird, J.R.; Pareek, G.; Miner, M.; et al. Cardiovascular/stroke risk predictive calculators: A comparison between statistical and machine learning models. Cardiovasc. Diagn. Ther. 2020, 10, 919–938. [Google Scholar] [CrossRef] [PubMed]
- Banchhor, S.K.; Londhe, N.D.; Araki, T.; Saba, L.; Radeva, P.; Laird, J.R.; Suri, J.S. Wall-based measurement features provides an improved IVUS coronary artery risk assessment when fused with plaque texture-based features during machine learning paradigm. Comput. Biol. Med. 2017, 91, 198–212. [Google Scholar] [CrossRef] [PubMed]
- Acharya, U.R.; Faust, O.; Sree, S.V.; Molinari, F.; Garberoglio, R.; Suri, J.S. Cost-effective and non-invasive automated benign & malignant thyroid lesion classification in 3D contrast-enhanced ultrasound using combination of wavelets and textures: A class of ThyroScan™ algorithms. Technol. Cancer Res. Treat. 2011, 10, 371–380. [Google Scholar]
- Acharya, U.R.; Faust, O.; Sree, S.V.; Molinari, F.; Suri, J.S. ThyroScreen system: High resolution ultrasound thyroid image characterization into benign and malignant classes using novel combination of texture and discrete wavelet transform. Comput. Methods Programs Biomed. 2011, 107, 233–241. [Google Scholar] [CrossRef]
- Kuppili, V.; Biswas, M.; Sreekumar, A.; Suri, H.S.; Saba, L.; Edla, D.R.; Marinhoe, R.T.; Sanches, J.M.; Suri, J.S. Extreme learning machine framework for risk stratification of fatty liver disease using ultrasound tissue characterization. J. Med. Syst. 2017, 41, 152. [Google Scholar] [CrossRef]
- Pareek, G.; Acharya, U.R.; Sree, S.V.; Swapna, G.; Yantri, R.; Martis, R.J.; Saba, L.; Krishnamurthi, G.; Mallarini, G.; El-Baz, A.J. Prostate tissue characterization/classification in 144 patient population using wavelet and higher order spectra features from transrectal ultrasound images. Technol. Cancer Res. Treat. 2013, 12, 545–557. [Google Scholar] [CrossRef]
- McClure, P.; Elnakib, A.; El-Ghar, M.A.; Khalifa, F.; Soliman, A.; El-Diasty, T.; Suri, J.S.; Elmaghraby, A.; El-Baz, A. In-Vitro and In-Vivo Diagnostic Techniques for Prostate Cancer: A Review. J. Biomed. Nanotechnol. 2014, 10, 2747–2777. [Google Scholar] [CrossRef]
- Acharya, U.R.; Saba, L.; Molinari, F.; Guerriero, S.; Suri, J.S. Ovarian tumor characterization and classification: A class of GyneScan™ systems. In Proceedings of the 2012 Annual International Conference of the IEEE Engineering in Medicine and Biology Society, San Diego, CA, USA, 28 August–1 September 2012. [Google Scholar]
- Acharya, U.R.; Sree, S.V.; Saba, L.; Molinari, F.; Guerriero, S.; Suri, J.S. Ovarian Tumor Characterization and Classification Using Ultrasound—A New Online Paradigm. J. Digit. Imaging 2012, 26, 544–553. [Google Scholar] [CrossRef] [Green Version]
- El-Baz, A.; Suri, J.S. Big Data in Multimodal Medical Imaging; CRC Press: New York, NY, USA, 2019. [Google Scholar] [CrossRef]
- Jo, T.; Nho, K.; Saykin, A.J. Deep Learning in Alzheimer’s Disease: Diagnostic Classification and Prognostic Prediction Using Neuroimaging Data. Front. Aging Neurosci. 2019, 11, 220. [Google Scholar] [CrossRef] [Green Version]
- Watts, J.; Khojandi, A.; Shylo, O.; Ramdhani, R.A. Machine learning’s application in deep brain stimulation for Parkinson’s disease: A review. Brain Sci. 2020, 10, 809. [Google Scholar] [CrossRef] [PubMed]
- Pereira, C.R.; Pereira, D.R.; da Silva, F.A.; Hook, C.; Weber, S.A.; Pereira, L.A.; Papa, J.P. A Step Towards the Automated Diagnosis of Parkinson’s Disease: Analyzing Handwriting Movements. In Proceedings of the 2015 IEEE 28th International Symposium on Computer-Based Medical Systems, Sao Carlos, Brazil, 22–25 June 2015; pp. 171–176. [Google Scholar] [CrossRef]
- Adams, W.R. High-accuracy detection of early Parkinson’s Disease using multiple characteristics of finger movement while typing. PLoS ONE 2017, 12, e0188226. [Google Scholar] [CrossRef] [Green Version]
- Gill, S.; Mouches, P.; Hu, S.; Rajashekar, D.; MacMaster, F.P.; Smith, E.E.; Forkert, N.D.; Ismail, Z. Using Machine Learning to Predict Dementia from Neuropsychiatric Symptom and Neuroimaging Data. J. Alzheimer’s Dis. 2020, 75, 277–288. [Google Scholar] [CrossRef] [Green Version]
- Liu, X.; Rivera, S.C.; Moher, D.; Calvert, M.J.; Denniston, A.K.; Chan, A.-W.; Darzi, A.; Holmes, C.; Yau, C.; Ashrafian, H.; et al. Reporting guidelines for clinical trial reports for interventions involving artificial intelligence: The CONSORT-AI extension. Nat. Med. 2020, 26, 1364–1374. [Google Scholar] [CrossRef]
- Alroobaea, R.; Mechti, S.; Haoues, M.; Rubaiee, S.; Ahmed, A.; Andejany, M.; Bragazzi, N.L.; Sharma, D.K.; Kolla, B.P.; Sengan, S. Alzheimer’s Disease Early Detection Using Machine Learning Techniques. Front. Neurosci. 2020. Available online: https://assets.researchsquare.com/files/rs-624520/v1/b83914f7-3a09-4ff1-9456-8288ae815f20.pdf?c=1631885103 (accessed on 2 December 2021).
- Battineni, G.; Chintalapudi, N.; Amenta, F. Comparative Machine Learning Approach in Dementia Patient Classification using Principal Component Analysis. In Proceedings of the 12th International Conference on Agents and Artificial Intelligence, Valletta, Malta, 22–24 February 2020. [Google Scholar]
- Pondal, M.; Marras, C.; Miyasaki, J.; Moro, E.; Armstrong, M.J.; Strafella, A.P.; Shah, B.B.; Fox, S.; Prashanth, L.K.; Phielipp, N.; et al. Clinical features of dopamine agonist withdrawal syndrome in a movement disorders clinic. J. Neurol. Neurosurg. Psychiatry 2012, 84, 130–135. [Google Scholar] [CrossRef] [PubMed] [Green Version]
- Poorjam, A.H.; Kavalekalam, M.S.; Shi, L.; Raykov, J.P.; Jensen, J.R.; Little, M.A.; Christensen, M.G. Automatic quality control and enhancement for voice-based remote Parkinson’s disease detection. Speech Commun. 2020, 127, 1–16. [Google Scholar] [CrossRef]
- Arroyo-Gallego, T.; Ledesma-Carbayo, M.J.; Sanchez-Ferro, A.; Butterworth, I.; Mendoza, C.S.; Matarazzo, M.; Montero, P.; Lopez-Blanco, R.; Puertas-Martin, V.; Trincado, R.; et al. Detection of Motor Impairment in Parkinson’s Disease Via Mobile Touchscreen Typing. IEEE Trans. Biomed. Eng. 2017, 64, 1994–2002. [Google Scholar] [CrossRef] [PubMed]
- Khan, S.; Gill, S.; Mooney, L.; White, P.; Whone, A.; Brooks, D.; Pavese, N. Combined pedunculopontine-subthalamic stimulation in Parkinson disease. Neurology 2012, 78, 1090–1095. [Google Scholar] [CrossRef] [PubMed]
- Deepa, S.P.C.N. A Deep Learning Method on Medical Image Dataset Predicting Early Dementia in Patients Alzheimer’s Disease using Convolution Neural Network (CNN). Int. J. Recent Technol. Eng. 2019, 8, 604–609. [Google Scholar]
- Araki, T.; Ikeda, N.; Shukla, D.; Jain, P.K.; Londhe, N.D.; Shrivastava, V.K.; Banchhor, S.K.; Saba, L.; Nicolaides, A.; Shafique, S. PCA-based polling strategy in machine learning framework for coronary artery disease risk assessment in intravascular ultrasound: A link between carotid and coronary grayscale plaque morphology. Comput. Methods Programs Biomed. 2016, 128, 137–158. [Google Scholar] [CrossRef] [PubMed]
- Prashanth, R.; Roy, S.D. Early detection of Parkinson’s disease through patient questionnaire and predictive modelling. Int. J. Med. Inform. 2018, 119, 75–87. [Google Scholar] [CrossRef] [Green Version]
- Al-Wahishi, A.; Belal, N.; Ghanem, N. Diagnosis of Parkinson’s Disease by Deep Learning Techniques Using Handwriting Dataset. In Proceedings of the International Symposium on Signal Processing and Intelligent Recognition Systems, Chennai, India, 14–17 October 2020. [Google Scholar]
- Rao, K.M.M.; Reddy, M.S.N.; Teja, V.R.; Krishnan, P.; Aravindhar, D.J.; Sambath, M. Parkinson’s Disease Detection Using Voice and Spiral Drawing Dataset. In Proceedings of the 2020 Third International Conference on Smart Systems and Inventive Technology (ICSSIT), Online, 20–22 August 2020. [Google Scholar]
- Eskofier, B.M.; Lee, S.I.; Daneault, J.-F.; Golabchi, F.N.; Ferreira-Carvalho, G.; Vergara-Diaz, G.; Sapienza, S.; Costante, G.; Klucken, J.; Kautz, T. Recent machine learning advancements in sensor-based mobility analysis: Deep learning for Parkinson’s disease assessment. In Proceedings of the 2016 38th Annual International Conference of the IEEE Engineering in Medicine and Biology Society (EMBC), Orlando, FL, USA, 16–20 August 2016. [Google Scholar]
- Jena, B.; Saxena, S.; Nayak, G.K.; Saba, L.; Sharma, N.; Suri, J.S. Artificial intelligence-based hybrid deep learning models for image classification: The first narrative review. Comput. Biol. Med. 2021, 137, 104803. [Google Scholar] [CrossRef]
- Raees, P.C.M.; Thomas, V. Automated detection of Alzheimer’s Disease using Deep Learning in MRI. J. Physics: Conf. Ser. 2021, 1921, 012024. [Google Scholar] [CrossRef]
- Oriol, J.D.V.; Vallejo, E.E.; Estrada, K.; Peña, J.G.T.; Initiative, T.A.D.N. Benchmarking machine learning models for late-onset alzheimer’s disease prediction from genomic data. BMC Bioinform. 2019, 20, 709–717. [Google Scholar] [CrossRef]
- Antor, M.B.; Jamil, A.; Mamtaz, M.; Monirujjaman, M.; Khan; Aljahdali, S.; Kaur, M.; Singh, P.; Masud, M.A. Comparative Analysis of Machine Learning Algorithms to Predict Alzheimer’s Disease. J. Healthc. Eng. 2021, 2021, 9917919. Available online: https://www.hindawi.com/journals/jhe/2021/9917919/ (accessed on 2 December 2021).
- Suri, J.S.; Agarwal, S.; Gupta, S.K.; Puvvula, A.; Viskovic, K.; Suri, N.; Alizad, A.; El-Baz, A.; Saba, L.; Fatemi, M.; et al. Systematic Review of Artificial Intelligence in Acute Respiratory Distress Syndrome for COVID-19 Lung Patients: A Biomedical Imaging Perspective. IEEE J. Biomed. Health Inform. 2021, 25, 4128–4139. [Google Scholar] [CrossRef]
- Jaichandran, R.; Leelavathy, S.; Usha, K.S.; Goutham, K.; Mevin, J.M.; Jomon, B. Machine learning technique based parkinson’s disease detection from spiral and voice inputs. EJMCM 2020, 7, 2815–2820. [Google Scholar]
- Celik, E.; Omurca, S.I. Improving Parkinson’s Disease Diagnosis with Machine Learning Methods. In Proceedings of the 2019 Scientific Meeting on Electrical-Electronics & Biomedical Engineering and Computer Science (EBBT), Istanbul, Turkey, 24–26 April 2019. [Google Scholar]
- Khedr, E.M.; El Fetoh, N.A.; Khalifa, H.E.; Ahmed, M.A.; El Beh, K.M. Prevalence of non motor features in a cohort of Parkinson’s disease patients. Clin. Neurol. Neurosurg. 2013, 115, 673–677. [Google Scholar] [CrossRef]
- Page, M.J.; McKenzie, J.E.; Bossuyt, P.M.; Boutron, I.; Hoffmann, T.C.; Mulrow, C.D.; Shamseer, L.; Tetzlaff, J.M.; Akl, E.A.; Brennan, S.E.; et al. The PRISMA 2020 statement: An updated guideline for reporting systematic reviews. BMJ 2021, 372, n71. [Google Scholar] [CrossRef]
- Sounderajah, V.; Ashrafian, H.; Rose, S.; Shah, N.H.; Ghassemi, M.; Golub, R.; Kahn, C.E.; Esteva, A.; Karthikesalingam, A.; Mateen, B.; et al. A quality assessment tool for artificial intelligence-centered diagnostic test accuracy studies: QUADAS-AI. Nat. Med. 2021, 27, 1663–1665. [Google Scholar] [CrossRef]
- Prashanth, R.; Roy, S.D.; Mandal, P.K.; Ghosh, S. High-Accuracy Detection of Early Parkinson’s Disease through Multimodal Features and Machine Learning. Int. J. Med. Inform. 2016, 90, 13–21. [Google Scholar] [CrossRef]
- Su, C.; Tong, J.; Wang, F. Mining genetic and transcriptomic data using machine learning approaches in Parkinson’s disease. NPJ Park. Dis. 2020, 6, 24. [Google Scholar] [CrossRef]
- Dias, A.E.; Limongi, J.C.; Barbosa, E.R.; Hsing, W.T. Voice telerehabilitation in Parkinson’s disease. Codas 2016, 28, 176–181. [Google Scholar] [CrossRef] [PubMed] [Green Version]
- Hu, M.; Shu, X.; Yu, G.; Wu, X.; Välimäki, M.; Feng, H. A Risk Prediction Model Based on Machine Learning for Cognitive Impairment Among Chinese Community-Dwelling Elderly People With Normal Cognition: Development and Validation Study. J. Med. Internet Res. 2021, 23, e20298. [Google Scholar] [CrossRef] [PubMed]
- Mandal, I.; Sairam, N. New machine-learning algorithms for prediction of Parkinson’s disease. Int. J. Syst. Sci. 2012, 45, 647–666. [Google Scholar] [CrossRef]
- Battineni, G.; Chintalapudi, N.; Amenta, F.; Traini, E. A Comprehensive Machine-Learning Model Applied to Magnetic Resonance Imaging (MRI) to Predict Alzheimer’s Disease (AD) in Older Subjects. J. Clin. Med. 2020, 9, 2146. [Google Scholar] [CrossRef]
- Dashtipour, K.; Taylor, W.; Ansari, S.; Zahid, A.; Gogate, M.; Ahmad, J.; Assaleh, K.; Arshad, K.; Imran, M.A.; Abbai, Q. Detecting Alzheimer’s disease using machine learning methods. In Proceedings of the EAI BODYNETS 2021, Glasgow, UKingdo, 25–26 October 2021; Available online: https://hal.archives-ouvertes.fr/hal-03381752/ (accessed on 2 December 2021).
- Bind, S.; Tiwari, A.K.; Sahani, A.K.; Koulibaly, P.; Nobili, F.; Pagani, M.; Sabri, O.; Borght, T.; Laere, K.; Tatsch, K. A survey of machine learning based approaches for Parkinson disease prediction. IJCSIT 2015, 6, 1648–1655. [Google Scholar]
- Cao, X.; Song, J.; Zhang, C. Using Principal Component Analysis And Choqet Integral To Establish A Diagnostic Model of Parkinson Disease. Phys. Procedia 2012, 24, 1573–1581. [Google Scholar] [CrossRef] [Green Version]
- Naghsh, E.; Sabahi, M.F.; Beheshti, S. Spatial analysis of EEG signals for Parkinson’s disease stage detection. Signal Image Video Process 2019, 14, 397–405. [Google Scholar] [CrossRef]
- Parisi, L.; Ravichandran, N.; Manaog, M.L. Feature-driven machine learning to improve early diagnosis of Parkinson’s disease. Expert Syst. Appl. 2018, 110, 182–190. [Google Scholar] [CrossRef]
- Billah, M. Symptom Analysis of Parkinson Disease Using SVM-SMO and Ada-Boost Classifiers. Ph.D. Thesis, BRAC University, Dhaka, Bangladesh, 2014. Available online: https://dspace.bracu.ac.bd/bitstream/handle/10361/2938/10101002.pdf?sequence=1 (accessed on 2 December 2021).
- Khatamino, P.; Cantürk, İ.; Özyılmaz, L. A deep learning-CNN based system for medical diagnosis: An application on Parkinson’s disease handwriting drawings. In Proceedings of the 2018 6th International Conference on Control Engineering & Information Technology (CEIT), Istanbul, Turkey, 25–27 October 2018. [Google Scholar]
- Nagasubramanian, G.; Sankayya, M. Multi-Variate vocal data analysis for Detection of Parkinson disease using Deep Learning. Neural Comput. Appl. 2021, 33, 4849–4864. [Google Scholar] [CrossRef]
- Anila, M.; Pradeepini, G.D. A Review on Parkinson’s Disease Diagnosis using Machine Learning Techniques. IJERT 2020, 9, 330–334. [Google Scholar] [CrossRef]
- Mathur, R.; Pathak, V.; Bandil, D. Parkinson Disease Prediction Using Machine Learning Algorithm. In Advances in Intelligent Systems and Computing; Springer: Singapore, 2018; pp. 357–363. [Google Scholar]
- Fang, E.; Ann, C.N.; Maréchal, B.; Lim, J.X.; Tan, S.Y.Z.; Li, H.; Gan, J.; Tan, E.K.; Chan, L.L. Differentiating Parkinson’s disease motor subtypes using automated volume-based morphometry incorporating white matter and deep gray nuclear lesion load. J. Magn. Reson. Imaging 2020, 51, 748–756. [Google Scholar] [CrossRef] [PubMed] [Green Version]
- Hardy, J. Genetic Analysis of Pathways to Parkinson Disease. Neuron 2010, 68, 201–206. [Google Scholar] [CrossRef] [Green Version]
- Antonini, A.; Leta, V.; Teo, J.; Chaudhuri, K.R. Outcome of Parkinson’s disease patients affected by COVID-19. Mov. Disord. 2020, 35, 905–908. [Google Scholar] [CrossRef] [PubMed]
- Salari, M.; Zali, A.; Ashrafi, F.; Etemadifar, M.; Sharma, S.; Hajizadeh, N.; Ashourizadeh, H. Incidence of Anxiety in Parkinson’s Disease During the Coronavirus Disease (COVID-19) Pandemic. Mov. Disord. 2020, 35, 1095–1096. [Google Scholar] [CrossRef]
- Suri, J.S.; Puvvula, A.; Biswas, M.; Majhail, M.; Saba, L.; Faa, G.; Singh, I.M.; Oberleitner, R.; Turk, M.; Chadha, P.S.; et al. COVID-19 pathways for brain and heart injury in comorbidity patients: A role of medical imaging and artificial intelligence-based COVID severity classification: A review. Comput. Biol. Med. 2020, 124, 103960. [Google Scholar] [CrossRef]
- Tipton, P.W.; Wszolek, Z.K. What can Parkinson’s disease teach us about COVID-19? Neurol. Neurochir. Polska 2020, 54, 204–206. [Google Scholar] [CrossRef] [Green Version]
- Saba, L.; Dey, N.; Ashour, A.; Samanta, S.; Nath, S.S.; Chakraborty, S.; Sanches, J.; Kumar, D.; Marinho, R.; Suri, J.S. Automated stratification of liver disease in ultrasound: An online accurate feature classification paradigm. Comput. Methods Programs Biomed. 2016, 130, 118–134. [Google Scholar] [CrossRef] [PubMed]
- Acharya, U.R.; Sree, S.V.; Ribeiro, R.; Krishnamurthi, G.; Marinho, R.; Sanches, J.; Suri, J.S. Data mining framework for fatty liver disease classification in ultrasound: A hybrid feature extraction paradigm. Med. Phys. 2012, 39, 4255–4264. [Google Scholar] [CrossRef] [Green Version]
- Acharya, U.R.; Sree, S.V.; Krishnan, M.M.R.; Molinari, F.; Garberoglio, R.; Suri, J.S. Non-invasive automated 3D thyroid lesion classification in ultrasound: A class of ThyroScan™ systems. Ultrasonics 2012, 52, 508–520. [Google Scholar] [CrossRef]
- Jamthikar, A.D.; Puvvula, A.; Gupta, D.; Johri, A.M.; Nambi, V.; Khanna, N.N.; Saba, L.; Mavrogeni, S.; Laird, J.R.; Pareek, G.; et al. Cardiovascular disease and stroke risk assessment in patients with chronic kidney disease using integration of estimated glomerular filtration rate, ultrasonic image phenotypes, and artificial intelligence: A narrative review. Int. Angiol. 2020, 40, 150–164. [Google Scholar] [CrossRef] [PubMed]
- Murgia, A.; Balestrieri, A.; Crivelli, P.; Suri, J.S.; Conti, M.; Cademartiri, F.; Saba, L. Cardiac computed tomography radiomics: An emerging tool for the non-invasive assessment of coronary atherosclerosis. Cardiovasc. Diagn. Ther. 2020, 10, 2005–2017. [Google Scholar] [CrossRef]
- Acharya, U.R.; Sree, S.V.; Krishnan, M.M.R.; Krishnananda, N.; Ranjan, S.; Umesh, P.; Suri, J.S. Automated classification of patients with coronary artery disease using grayscale features from left ventricle echocardiographic images. Comput. Methods Programs Biomed. 2013, 112, 624–632. [Google Scholar] [CrossRef] [PubMed]
- Acharya, U.R.; Sree, S.V.; Kulshreshtha, S.; Molinari, F.; Koh, J.E.W.; Saba, L.; Suri, J.S. GyneScan: An Improved Online Paradigm for Screening of Ovarian Cancer via Tissue Characterization. Technol. Cancer Res. Treat. 2014, 13, 529–539. [Google Scholar] [CrossRef] [PubMed] [Green Version]
- Shrivastava, V.K.; Londhe, N.D.; Sonawane, R.S.; Suri, J.S. Exploring the color feature power for psoriasis risk stratification and classification: A data mining paradigm. Comput. Biol. Med. 2015, 65, 54–68. [Google Scholar] [CrossRef]
- Shrivastava, V.; Londhe, N.D.; Sonawane, R.S.; Suri, J.S. Computer-aided diagnosis of psoriasis skin images with HOS, texture and color features: A first comparative study of its kind. Comput. Methods Programs Biomed. 2016, 126, 98–109. [Google Scholar] [CrossRef]
- Chen, R.; Kumar, S.; Garg, R.R.; Lang, A. Impairment of motor cortex activation and deactivation in Parkinson’s disease. Clin. Neurophysiol. 2001, 112, 600–607. [Google Scholar] [CrossRef]
- Bodis-Wollner, I.; Yahr, M.D. Measurements of Visual Evoked Potentials in Parkinson’s Disease. Brain 1978, 101, 661–671. [Google Scholar] [CrossRef]
- Kaur, S.; Aggarwal, H.; Rani, R. Diagnosis of Parkinson’s Disease Using Principle Component Analysis and Deep Learning. J. Med. Imaging Health Inform. 2019, 9, 602–609. [Google Scholar] [CrossRef]
- Zappia, M.; Annesi, G.; Nicoletti, G.; Arabia, G.; Annesi, F.; Messina, D.; Pugliese, P.; Spadafora, P.; Tarantino, P.; Carrideo, S. Sex differences in clinical and genetic determinants of levodopa peak-dose dyskinesias in Parkinson disease: An exploratory study. Arch. Neurol. 2005, 62, 601–605. [Google Scholar] [CrossRef] [PubMed]
- Lang, E.A.; Lozano, M.A. Parkinson’s disease. N. Engl. J. Med. 1998, 339, 1130–1143. [Google Scholar] [CrossRef] [PubMed]
- Martinez-Martin, P.; Rodriguez-Blazquez, C.; Abe, K.; Bhattacharyya, K.B.; Bloem, B.R.; Carod-Artal, F.J.; Prakash, R.; Esselink, R.; Falup-Pecurariu, C.; Gallardo, M.; et al. International study on the psychometric attributes of the Non-Motor Symptoms Scale in Parkinson disease. Neurology 2009, 73, 1584–1591. [Google Scholar] [CrossRef] [PubMed]
- Weernink, M.G.; Groothuis-Oudshoorn, C.G.; Ijzerman, M.J.; van Til, J.A. Valuing Treatments for Parkinson Disease Incorporating Process Utility: Performance of Best-Worst Scaling, Time Trade-Off, and Visual Analogue Scales. Value Health 2016, 19, 226–232. [Google Scholar] [CrossRef] [Green Version]
- Senturk, Z.K. Early diagnosis of Parkinson’s disease using machine learning algorithms. Med. Hypotheses 2020, 138, 109603. [Google Scholar] [CrossRef]
- Tsoukra, P.; Velakoulis, D.; Wibawa, P.; Malpas, C.B.; Walterfang, M.; Evans, A.; Farrand, S.; Kelso, W.; Eratne, D.; Loi, S.M. The Diagnostic Challenge of Young-Onset Dementia Syndromes and Primary Psychiatric Diseases: Results From a Retrospective 20-Year Cross-Sectional Study. J. Neuropsychiatry Clin. Neurosci. 2021. [Google Scholar] [CrossRef]
- Pohar, S.L.; Jones, C.A. The burden of Parkinson disease (PD) and concomitant comorbidities. Arch. Gerontol. Geriatr. 2009, 49, 317–321. [Google Scholar] [CrossRef]
- Janghel, R.R.; Shukla, A.; Rathore, C.P.; Verma, K.; Rathore, S. A comparison of soft computing models for Parkinson’s disease diagnosis using voice and gait features. Netw. Model. Anal. Health Inform. Bioinform. 2017, 6, 14. [Google Scholar] [CrossRef]
- Agarwal, M.; Saba, L.; Gupta, S.K.; Carriero, A.; Falaschi, Z.; Paschè, A.; Danna, P.; El-Baz, A.; Naidu, S.; Suri, J.S. A Novel Block Imaging Technique Using Nine Artificial Intelligence Models for COVID-19 Disease Classification, Characterization and Severity Measurement in Lung Computed Tomography Scans on an Italian Cohort. J. Med Syst. 2021, 45, 1–30. [Google Scholar] [CrossRef] [PubMed]
- Cau, R.; Pacielli, A.; Fatemeh, H.; Vaudano, P.; Arru, C.; Crivelli, P.; Stranieri, G.; Suri, J.S.; Mannelli, L.; Conti, M.; et al. Complications in COVID-19 patients: Characteristics of pulmonary embolism. Clin. Imaging 2021, 77, 244–249. [Google Scholar] [CrossRef]
- Saba, L.; Tiwari, A.; Biswas, M.; Gupta, S.K.; Godia-Cuadrado, E.; Chaturvedi, A.; Turk, M.; Suri, H.S.; Orru, S.; Sanches, J.M. Wilson’s disease: A new perspective review on its genetics, diagnosis and treatment. Front. Biosci. 2019, 11, 166–185. [Google Scholar]
- Porcu, M.; Cocco, L.; Puig, J.; Mannelli, L.; Yang, Q.; Suri, J.S.; Defazio, G.; Saba, L. Global Fractional Anisotropy: Effect on Resting-state Neural Activity and Brain Networking in Healthy Participants. Neuroscience 2021, 472, 103–115. [Google Scholar] [CrossRef]
- Alqahtani, E.J.; Alshamrani, F.H.; Syed, H.F.; Olatunji, S.O. Classification of Parkinson’s Disease Using NNge Classification Algorithm. In Proceedings of the 2018 21st Saudi Computer Society National Computer Conference (NCC), Riyadh, Saudi Arabia, 25–26 April 2018; pp. 1–7. [Google Scholar]
- Porcu, M.; Cocco, L.; Cocozza, S.; Pontillo, G.; Operamolla, A.; Defazio, G.; Suri, J.S.; Brunetti, A.; Saba, L.J. The association between white matter hyperintensities, cognition and regional neural activity in healthy subjects. Eur. J. Neurosci. 2021, 54, 5427–5443. [Google Scholar] [CrossRef]
- Saba, L.; Gerosa, C.; Fanni, D.; Marongiu, F.; La Nasa, G.; Caocci, G.; Barcellona, D.; Balestrieri, A.; Coghe, F.; Orru, G.; et al. Molecular pathways triggered by COVID-19 in different organs: ACE2 receptor-expressing cells under attack? A review. Eur. Rev. Med. Pharmacol. Sci. 2020, 24, 12609–12622. [Google Scholar]
- Cau, R.; Bassareo, P.P.; Mannelli, L.; Suri, J.S.; Saba, L. Imaging in COVID-19-related myocardial injury. Int. J. Cardiovasc. Imaging 2021, 37, 1349–1360. [Google Scholar] [CrossRef]
- Suri, J.S.; Puvvula, A.; Majhail, M.; Biswas, M.; Jamthikar, A.D.; Saba, L.; Faa, G.; Singh, I.M.; Oberleitner, R.; Turk, M.; et al. Integration of cardiovascular risk assessment with COVID-19 using artificial intelligence. Rev. Cardiovasc. Med. 2020, 21, 541–560. [Google Scholar] [CrossRef]
- Saba, L.; Agarwal, M.; Patrick, A.; Puvvula, A.; Gupta, S.K.; Carriero, A.; Laird, J.R.; Kitas, G.D.; Johri, A.M.; Balestrieri, A.; et al. Six artificial intelligence paradigms for tissue characterization and classification of non-COVID-19 pneumonia against COVID-19 pneumonia in computed tomography lungs. Int. J. Comput. Assist. Radiol. Surg. 2021, 16, 423–434. [Google Scholar] [CrossRef]
- Souza, C.D.O.; Voos, M.C.; Barbosa, A.F.; Chen, J.; Francato, D.C.V.; Milosevic, M.; Popovic, M.; Fonoff, E.T.; Chien, H.F.; Barbosa, E.R. Relationship Between Posturography, Clinical Balance and Executive Function in Parkinson´s Disease. J. Mot. Behav. 2019, 51, 212–221. [Google Scholar] [CrossRef] [PubMed]
- Mc Kinlay, A.; Grace, R.C. Characteristic of Cognitive Decline in Parkinson’s Disease: A 1-Year Follow-Up. Appl. Neuropsychol. 2011, 18, 269–277. [Google Scholar] [CrossRef] [PubMed]


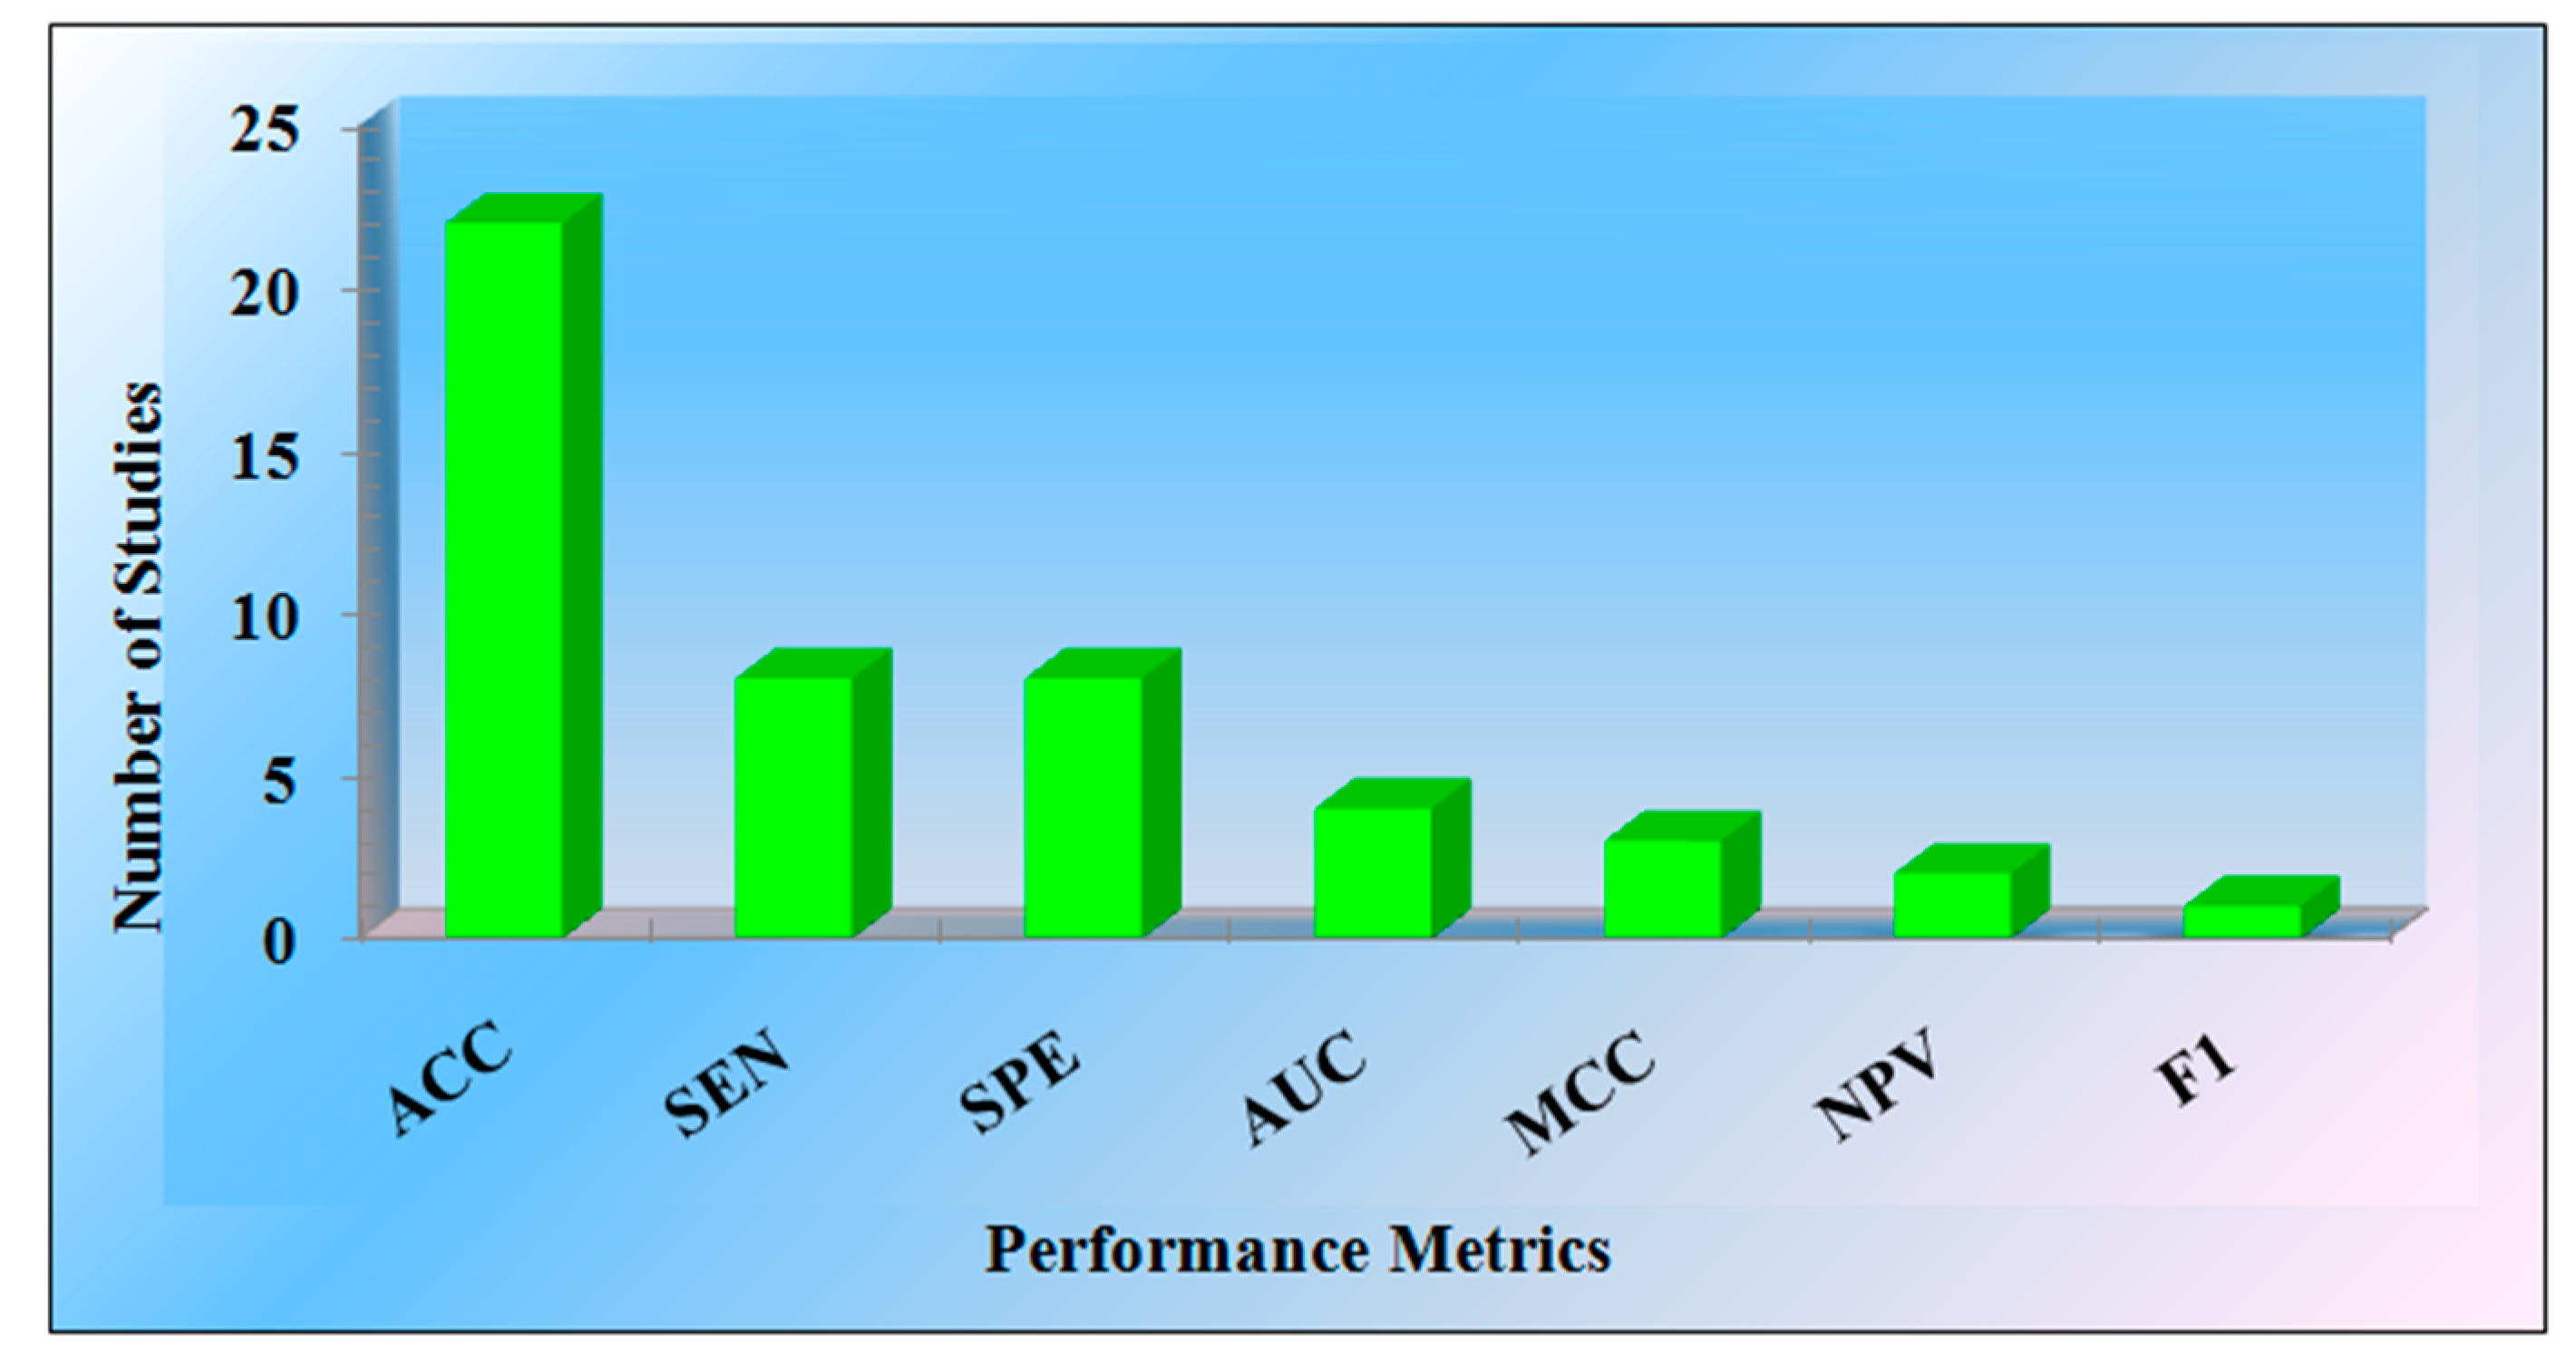


| Performance Metrics | ACC | SEN | SPE | AUC | MCC | NPV | F1 |
|---|---|---|---|---|---|---|---|
| Number of Studies | 22 | 8 | 8 | 4 | 3 | 2 | 1 |
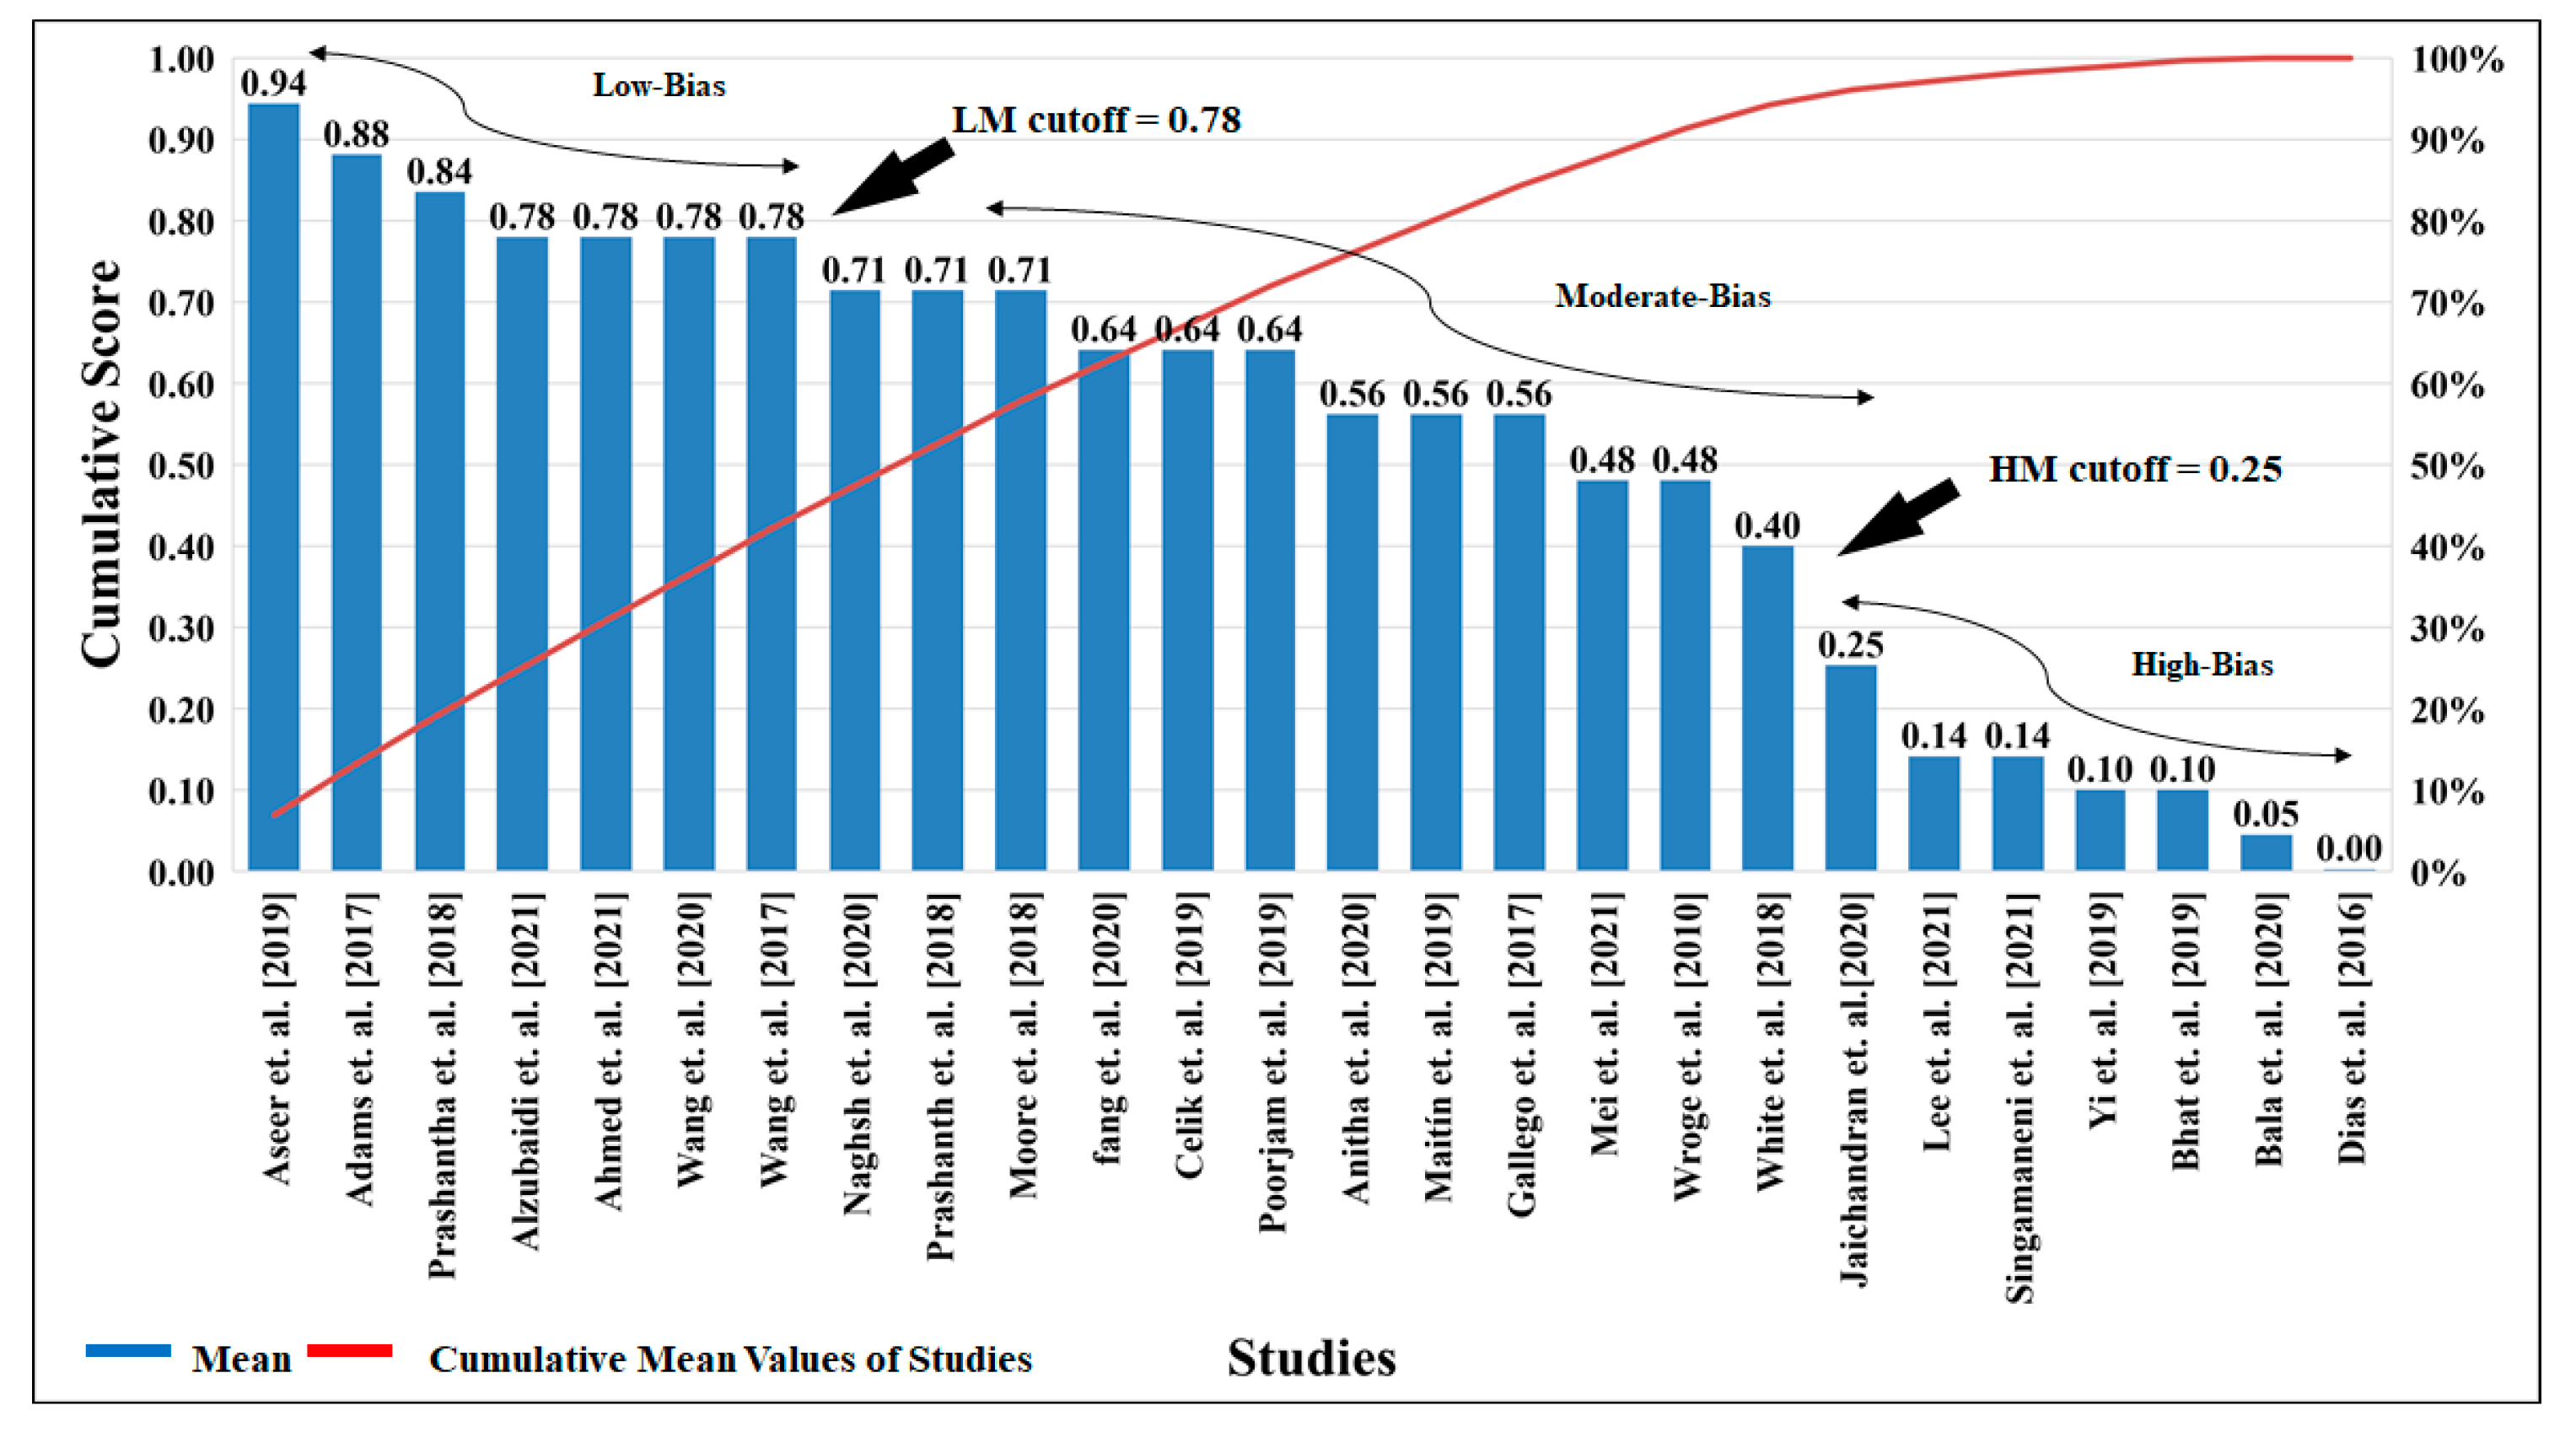
| Low-Bias | Moderate-Bias | High-Bias | |||||||||
|---|---|---|---|---|---|---|---|---|---|---|---|
| SN | Author | C1 | C2 | C3 | C4 | C5 | C6 | Mean | Absolute Score | CDF | Rank |
| 1 | Aseer et al. [1] (2019) | 3 | 4 | 5 | 4 | 5 | 4 | 4.17 | 25 | 0.94 | 1 |
| 2 | Adams et al. [2] (2017) | 4 | 4 | 4 | 4 | 4 | 3 | 3.83 | 23 | 0.88 | 2 |
| 3 | Prashantha et al. [3] (2018) | 3 | 4 | 4 | 4 | 4 | 3 | 3.67 | 22 | 0.84 | 3 |
| 4 | Alzubaidi et al. [4] (2021) | 3 | 4 | 4 | 3 | 3 | 4 | 3.50 | 21 | 0.78 | 4 |
| 5 | Ahmed et al. [5] (2021) | 2 | 3 | 4 | 4 | 4 | 4 | 3.50 | 21 | 0.78 | 5 |
| 6 | Wang et al. [6] (2020) | 3 | 3 | 4 | 4 | 4 | 3 | 3.50 | 21 | 0.78 | 6 |
| 7 | Wang et al. [7] (2017) | 3 | 3 | 4 | 4 | 4 | 3 | 3.50 | 21 | 0.78 | 7 |
| 8 | Naghsh et al. [8] (2020) | 3 | 3 | 4 | 4 | 3 | 3 | 3.33 | 20 | 0.71 | 8 |
| 9 | Prashanth et al. [9] (2018) | 3 | 3 | 4 | 3 | 4 | 3 | 3.33 | 20 | 0.71 | 9 |
| 10 | Moore et al. [10] (2018) | 3 | 3 | 4 | 3 | 4 | 3 | 3.33 | 20 | 0.71 | 10 |
| 11 | Fang et al. [11] (2020) | 2 | 2 | 4 | 4 | 4 | 3 | 3.17 | 19 | 0.64 | 11 |
| 12 | Celik et al. [12] (2019) | 4 | 4 | 4 | 3 | 2 | 2 | 3.17 | 19 | 0.64 | 12 |
| 13 | Poorjam et al. [13] (2019) | 4 | 3 | 4 | 2 | 3 | 3 | 3.17 | 19 | 0.64 | 13 |
| 14 | Anitha et al. [14] (2020) | 3 | 3 | 4 | 2 | 3 | 3 | 3.00 | 18 | 0.56 | 14 |
| 15 | Maitín et al. [15] (2019) | 3 | 4 | 4 | 3 | 2 | 2 | 3.00 | 18 | 0.56 | 15 |
| 16 | Gallego et al. [16] (2017) | 2 | 3 | 4 | 4 | 2 | 3 | 3.00 | 18 | 0.56 | 16 |
| 17 | Mei et al. [17] (2021) | 2 | 3 | 3 | 3 | 3 | 3 | 2.83 | 17 | 0.48 | 17 |
| 18 | Wroge et al. [18] (2010) | 3 | 3 | 4 | 2 | 2 | 3 | 2.83 | 17 | 0.48 | 18 |
| 19 | White et al. [19] (2018) | 4 | 3 | 3 | 2 | 1 | 3 | 2.67 | 16 | 0.40 | 19 |
| 20 | Jaichandran et al. [20] (2020) | 4 | 3 | 4 | 0 | 1 | 2 | 2.33 | 14 | 0.25 | 20 |
| 21 | Lee et al. [21] (2021) | 4 | 4 | 0 | 0 | 0 | 4 | 2.00 | 12 | 0.14 | 21 |
| 22 | Singamaneni et al. [22] (2021) | 1 | 3 | 3 | 2 | 1 | 2 | 2.00 | 12 | 0.14 | 22 |
| 23 | Hu et al. [23] (2019) | 1 | 2 | 2 | 1 | 2 | 3 | 1.83 | 11 | 0.10 | 23 |
| 24 | Bhat et al. [22] (2019) | 3 | 3 | 3 | 0 | 0 | 2 | 1.83 | 11 | 0.10 | 24 |
| 25 | Bala et al. [24] (2020) | 1 | 2 | 2 | 1 | 1 | 2 | 1.50 | 9 | 0.05 | 25 |
| 26 | Dias et al. [10] (2016) | 1 | 1 | 0 | 0 | 0 | 2 | 0.67 | 4 | 0.00 | 26 |
| B0 | B1 | B2 | B3 | B4 | B5 | B6 | B7 | B8 | B9 | CB0 | B11 | B12 | B13 | B14 |
|---|---|---|---|---|---|---|---|---|---|---|---|---|---|---|
| SN | Citation (Year) | OB | DD | IEC | DE | ME | PM | AA | IPA | BA | CV | BS | SV | RS |
| 1 | Ahlrichs et al. [25] (2013) | Ns vs. PD | × | × | × | × | × | × | √ | × | × | × | √ | 72 |
| 2 | Bind et al. [26] (2015) | Ns vs. PD | × | × | × | × | × | × | × | × | √ | × | × | 52 |
| 3 | Maitín et al. [15] (2020) | Ns vs. PD | × | √ | × | √ | √ | √ | × | √ | × | × | √ | 37 |
| 4 | Anila et al. [27] (2020) | Ns vs. PD | × | × | √ | × | × | × | √ | × | √ | × | × | 37 |
| 5 | Watts et al. [28] (2020) | Ns vs. PD | × | × | × | × | × | × | √ | × | × | × | × | 109 |
| 6 | Garg et al. [29] (2021) | Ns vs. PD | × | × | × | × | × | × | × | × | × | × | × | 15 |
| 7 | Mei et al. [17] (2021) | Ns vs. PD | × | √ | √ | √ | √ | √ | √ | × | √ | × | × | 78 |
| 8 | Alzubaidi et al. [4] (2021) | Ns vs. PD | √ | √ | × | √ | √ | √ | √ | × | × | × | × | 108 |
| 9 | Proposed | Ns vs. PD | √ | √ | √ | √ | √ | √ | √ | √ | √ | √ | √ | 105 |
Publisher’s Note: MDPI stays neutral with regard to jurisdictional claims in published maps and institutional affiliations. |
© 2022 by the authors. Licensee MDPI, Basel, Switzerland. This article is an open access article distributed under the terms and conditions of the Creative Commons Attribution (CC BY) license (https://creativecommons.org/licenses/by/4.0/).
Share and Cite
Paul, S.; Maindarkar, M.; Saxena, S.; Saba, L.; Turk, M.; Kalra, M.; Krishnan, P.R.; Suri, J.S. Bias Investigation in Artificial Intelligence Systems for Early Detection of Parkinson’s Disease: A Narrative Review. Diagnostics 2022, 12, 166. https://doi.org/10.3390/diagnostics12010166
Paul S, Maindarkar M, Saxena S, Saba L, Turk M, Kalra M, Krishnan PR, Suri JS. Bias Investigation in Artificial Intelligence Systems for Early Detection of Parkinson’s Disease: A Narrative Review. Diagnostics. 2022; 12(1):166. https://doi.org/10.3390/diagnostics12010166
Chicago/Turabian StylePaul, Sudip, Maheshrao Maindarkar, Sanjay Saxena, Luca Saba, Monika Turk, Manudeep Kalra, Padukode R. Krishnan, and Jasjit S. Suri. 2022. "Bias Investigation in Artificial Intelligence Systems for Early Detection of Parkinson’s Disease: A Narrative Review" Diagnostics 12, no. 1: 166. https://doi.org/10.3390/diagnostics12010166