Structure Simulation and Equilibrium Evaluation Analysis of Regional Water Resources, Society, Economy and Ecological Environment Complex System
Abstract
:1. Introduction
2. Study Area and Research Framework
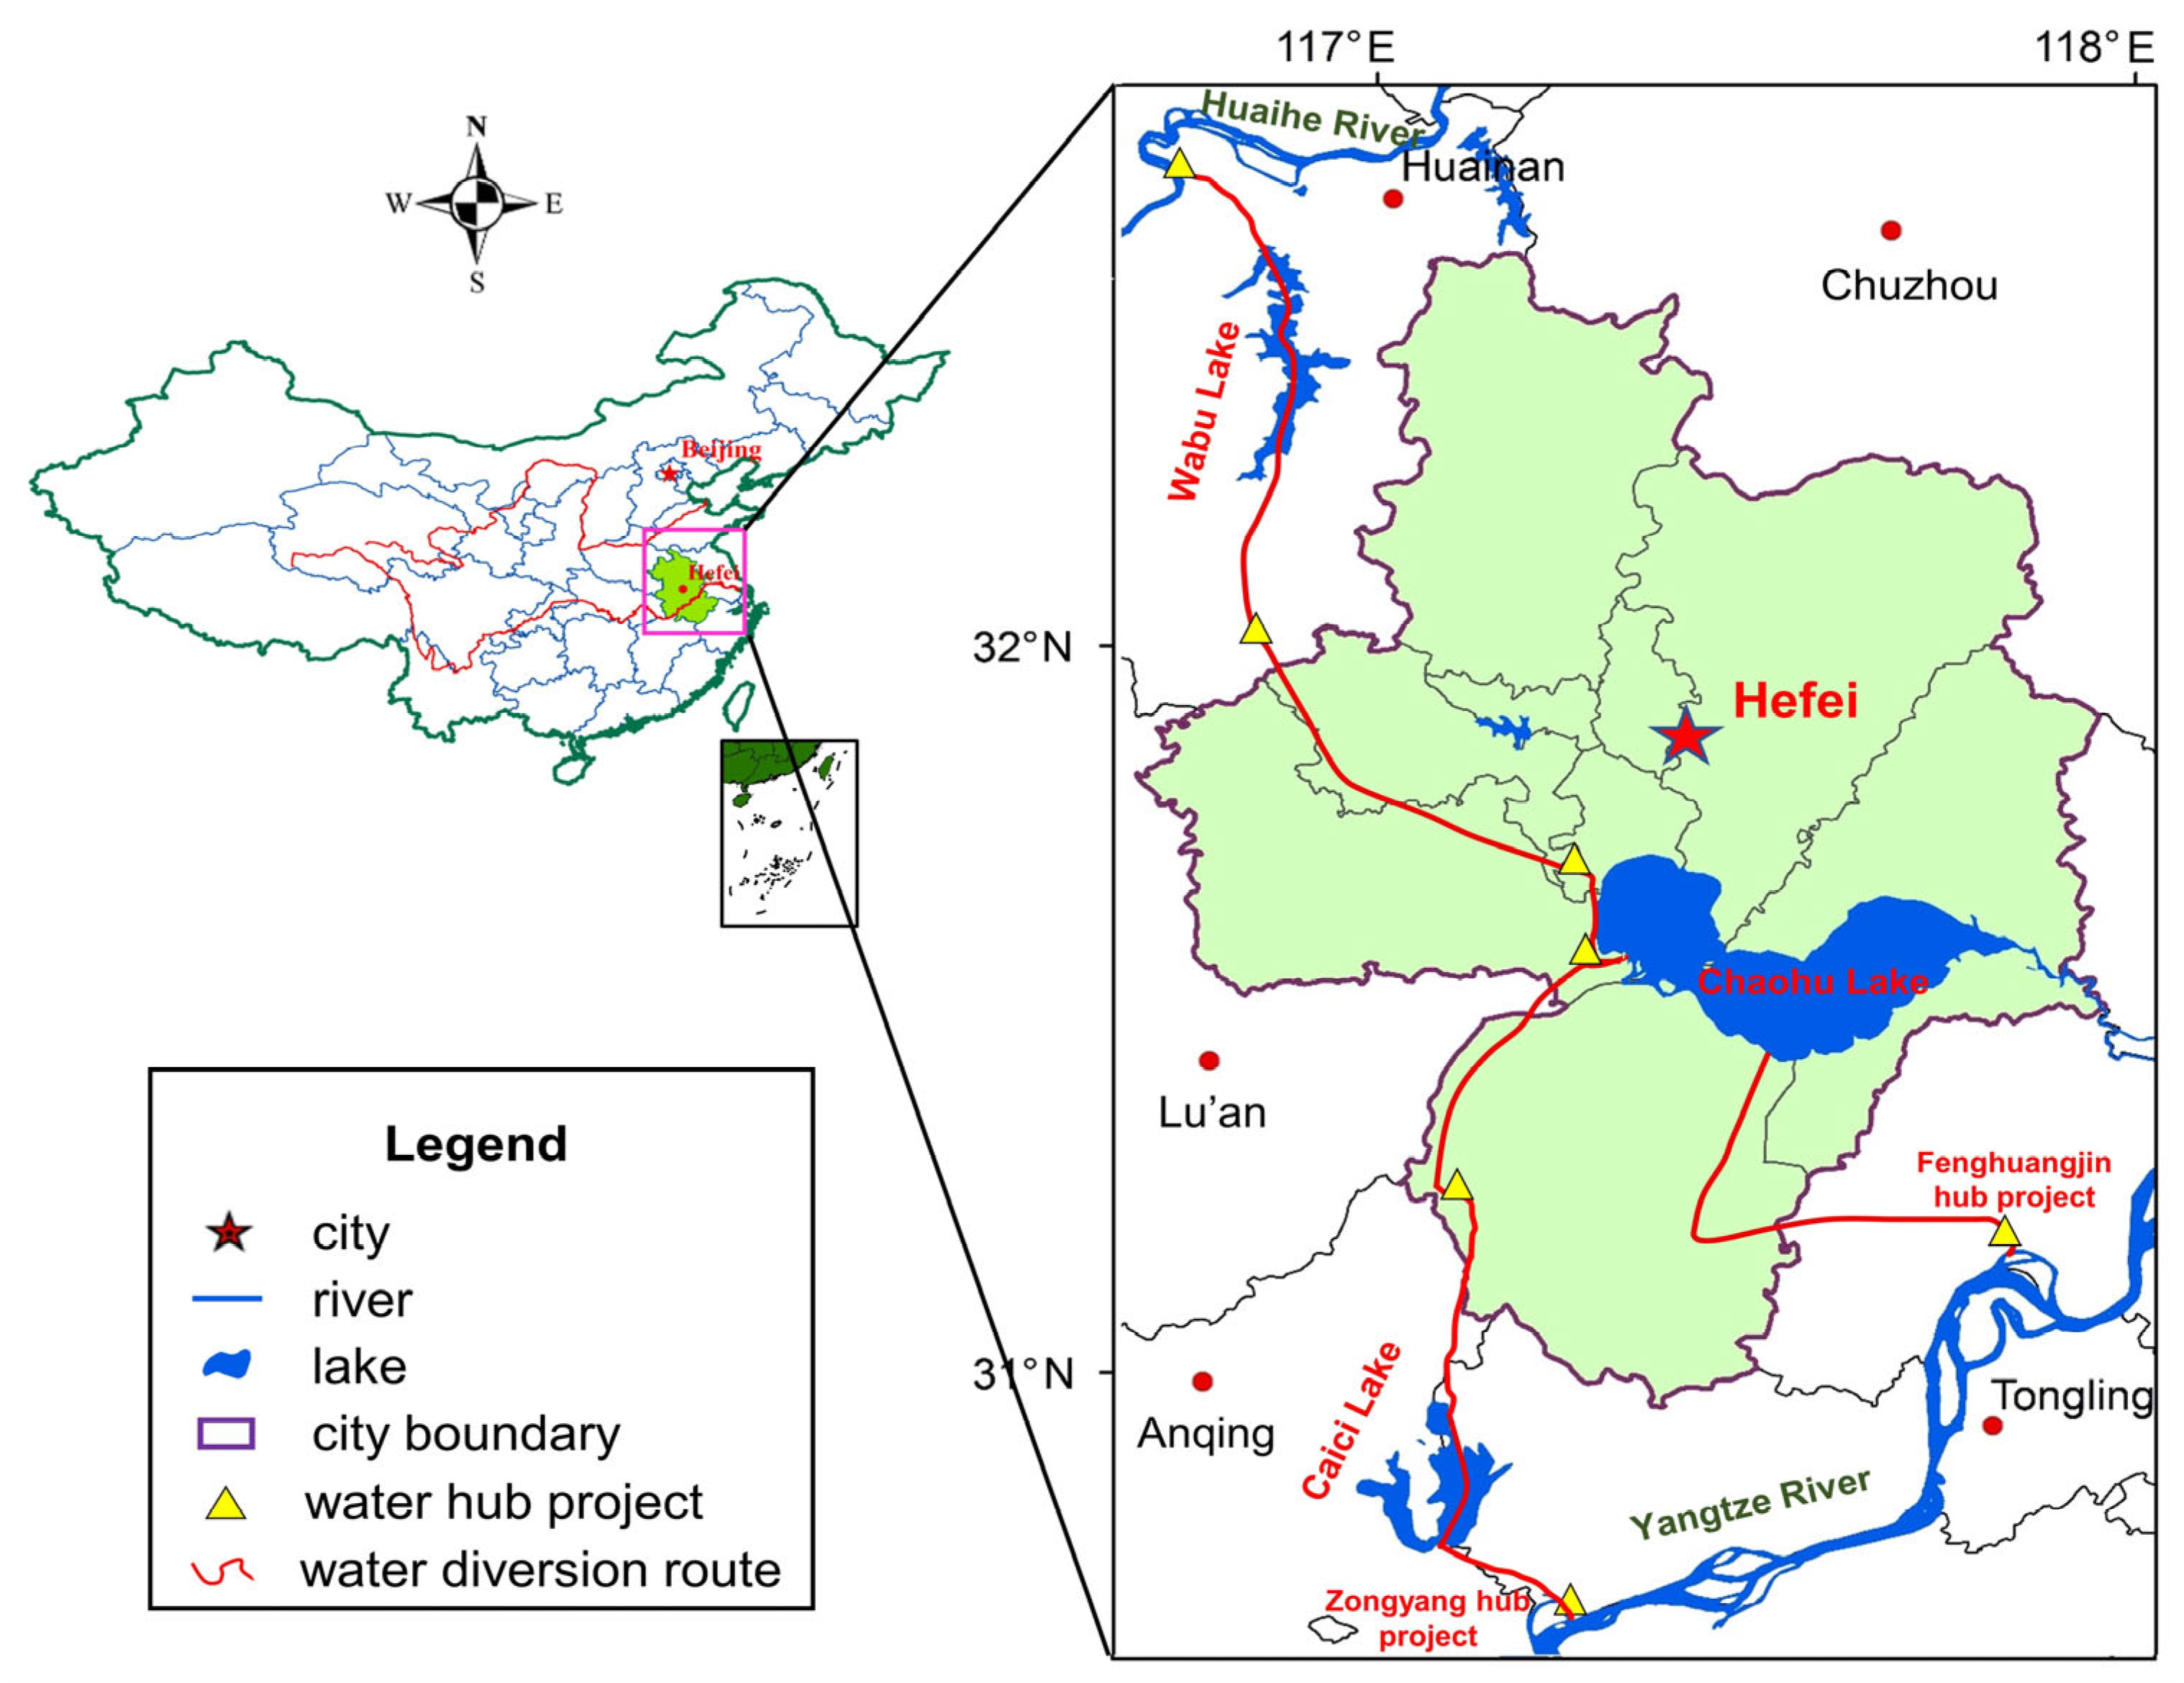
2.1. Study Area and Data Sources
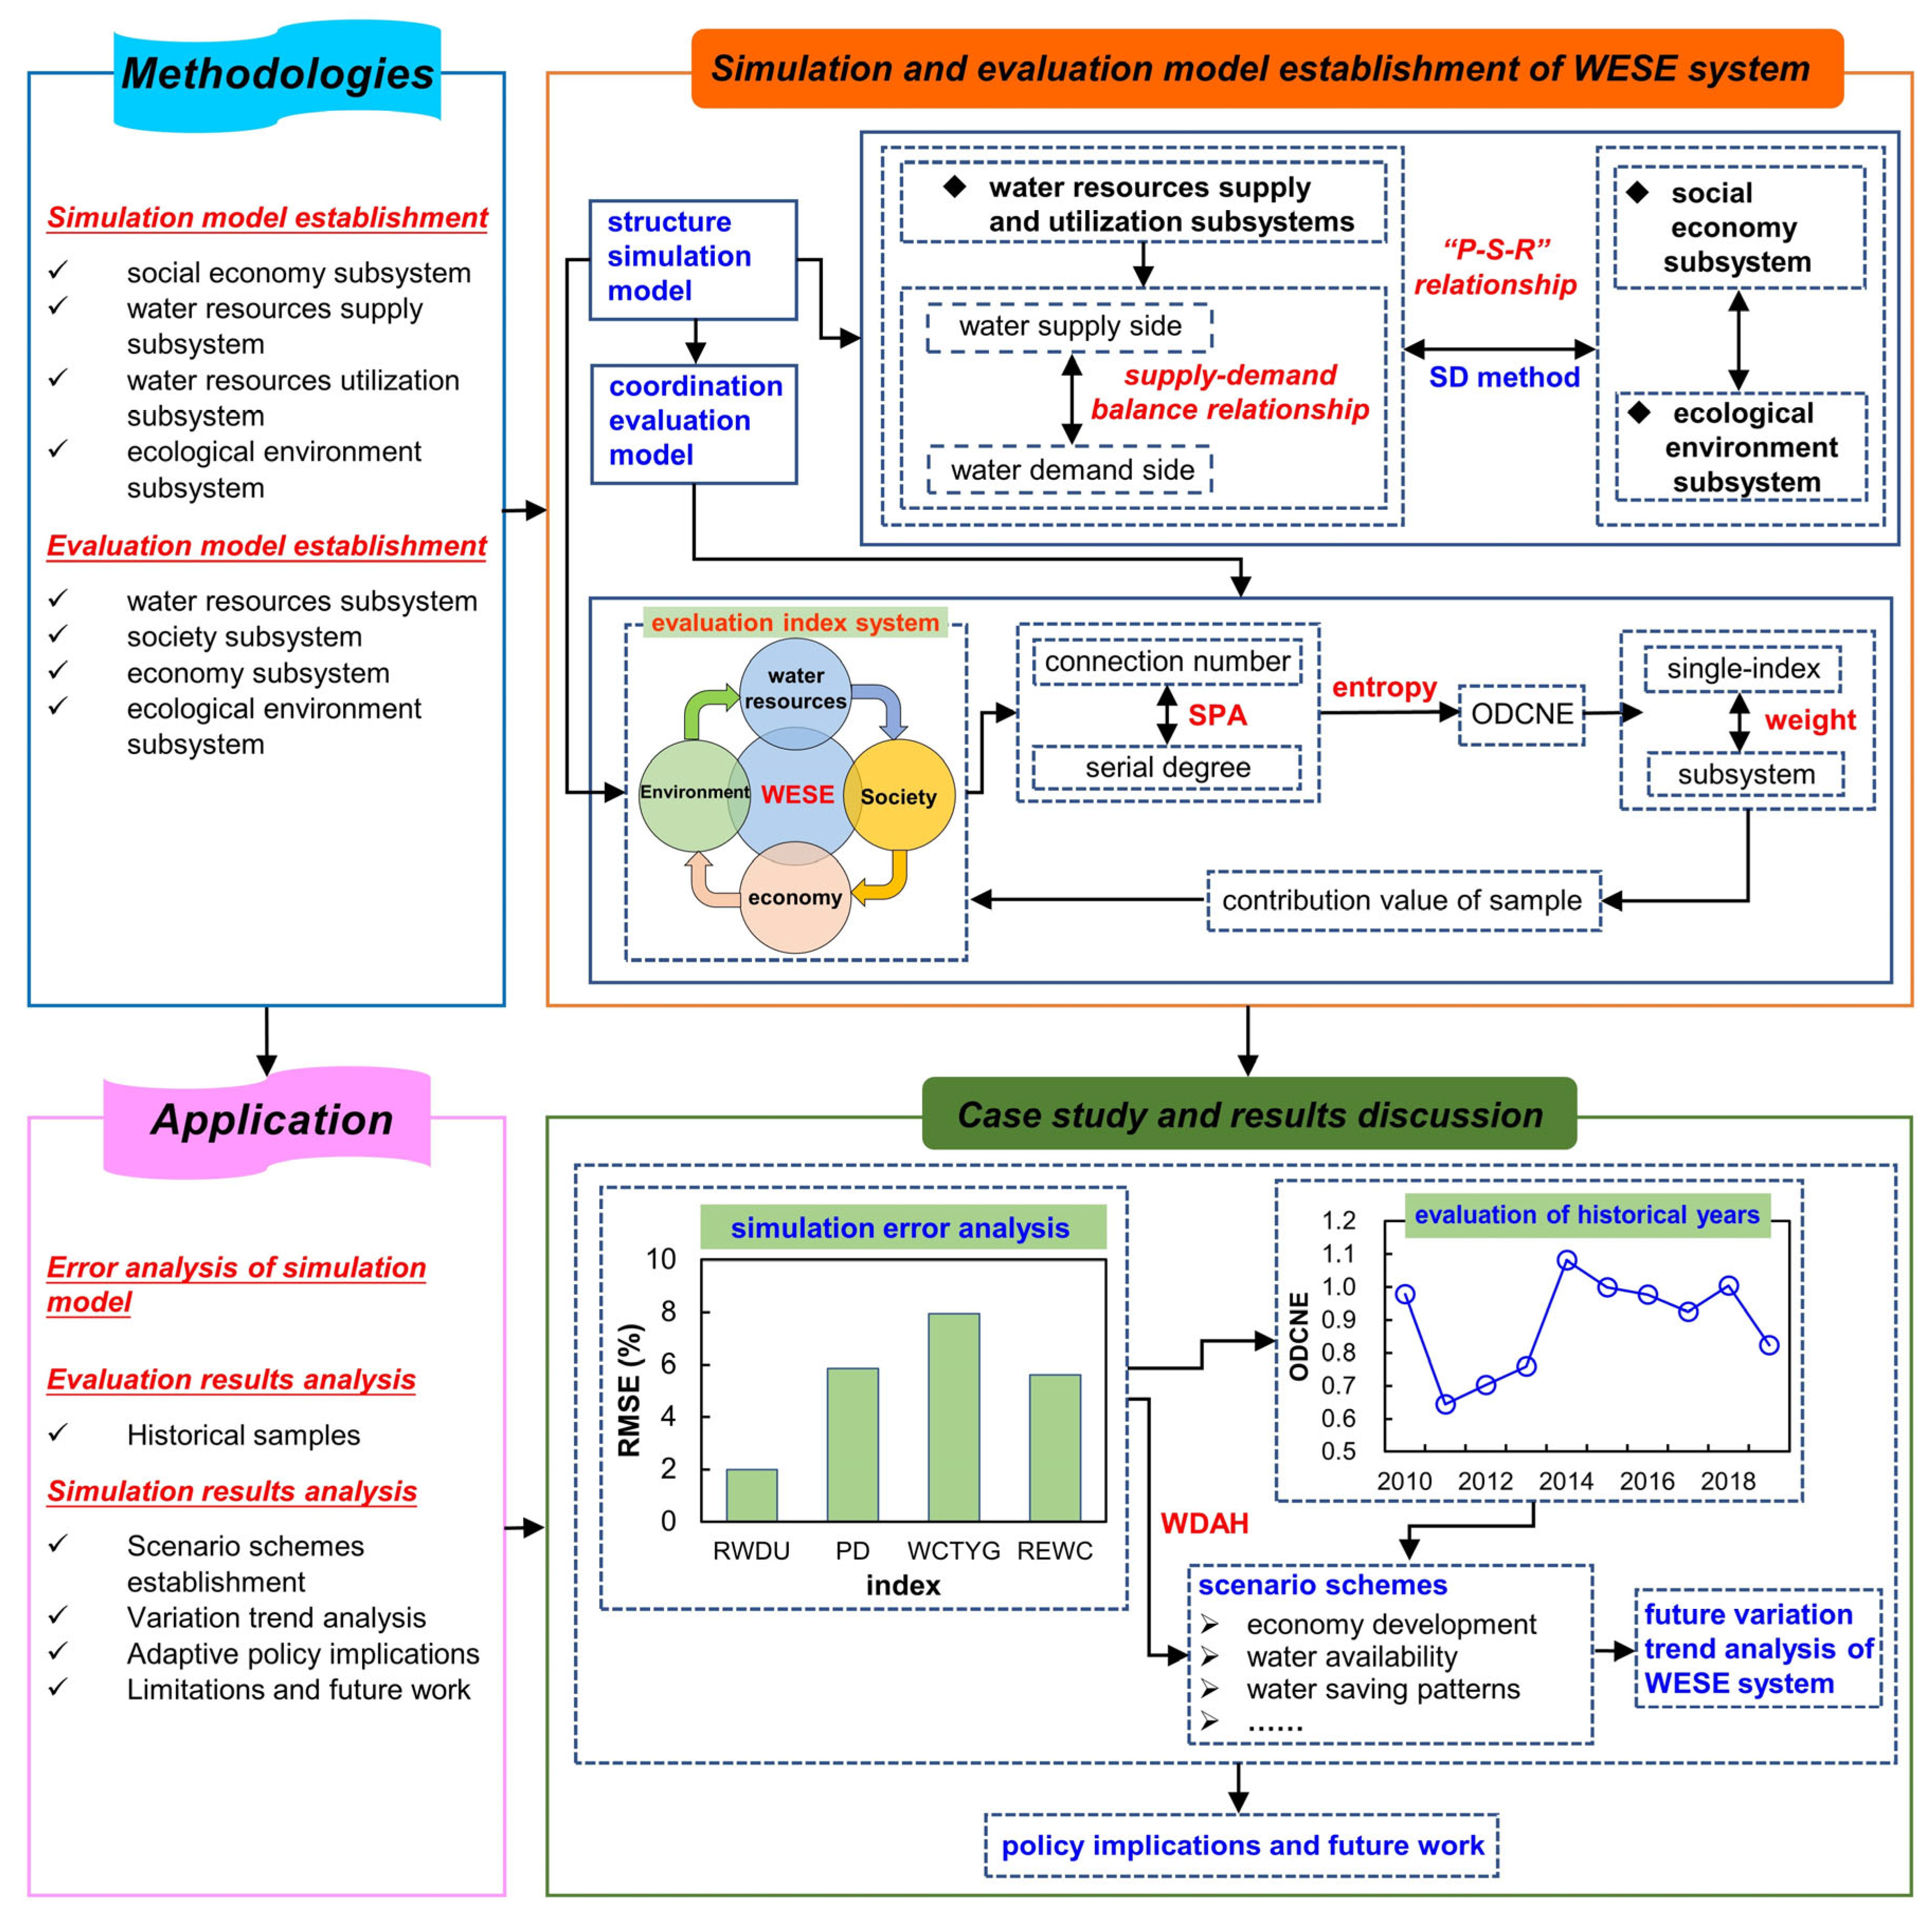
2.2. Research Framework
3. Methodologies
3.1. Structure Simulation of WSEE System by SD Model
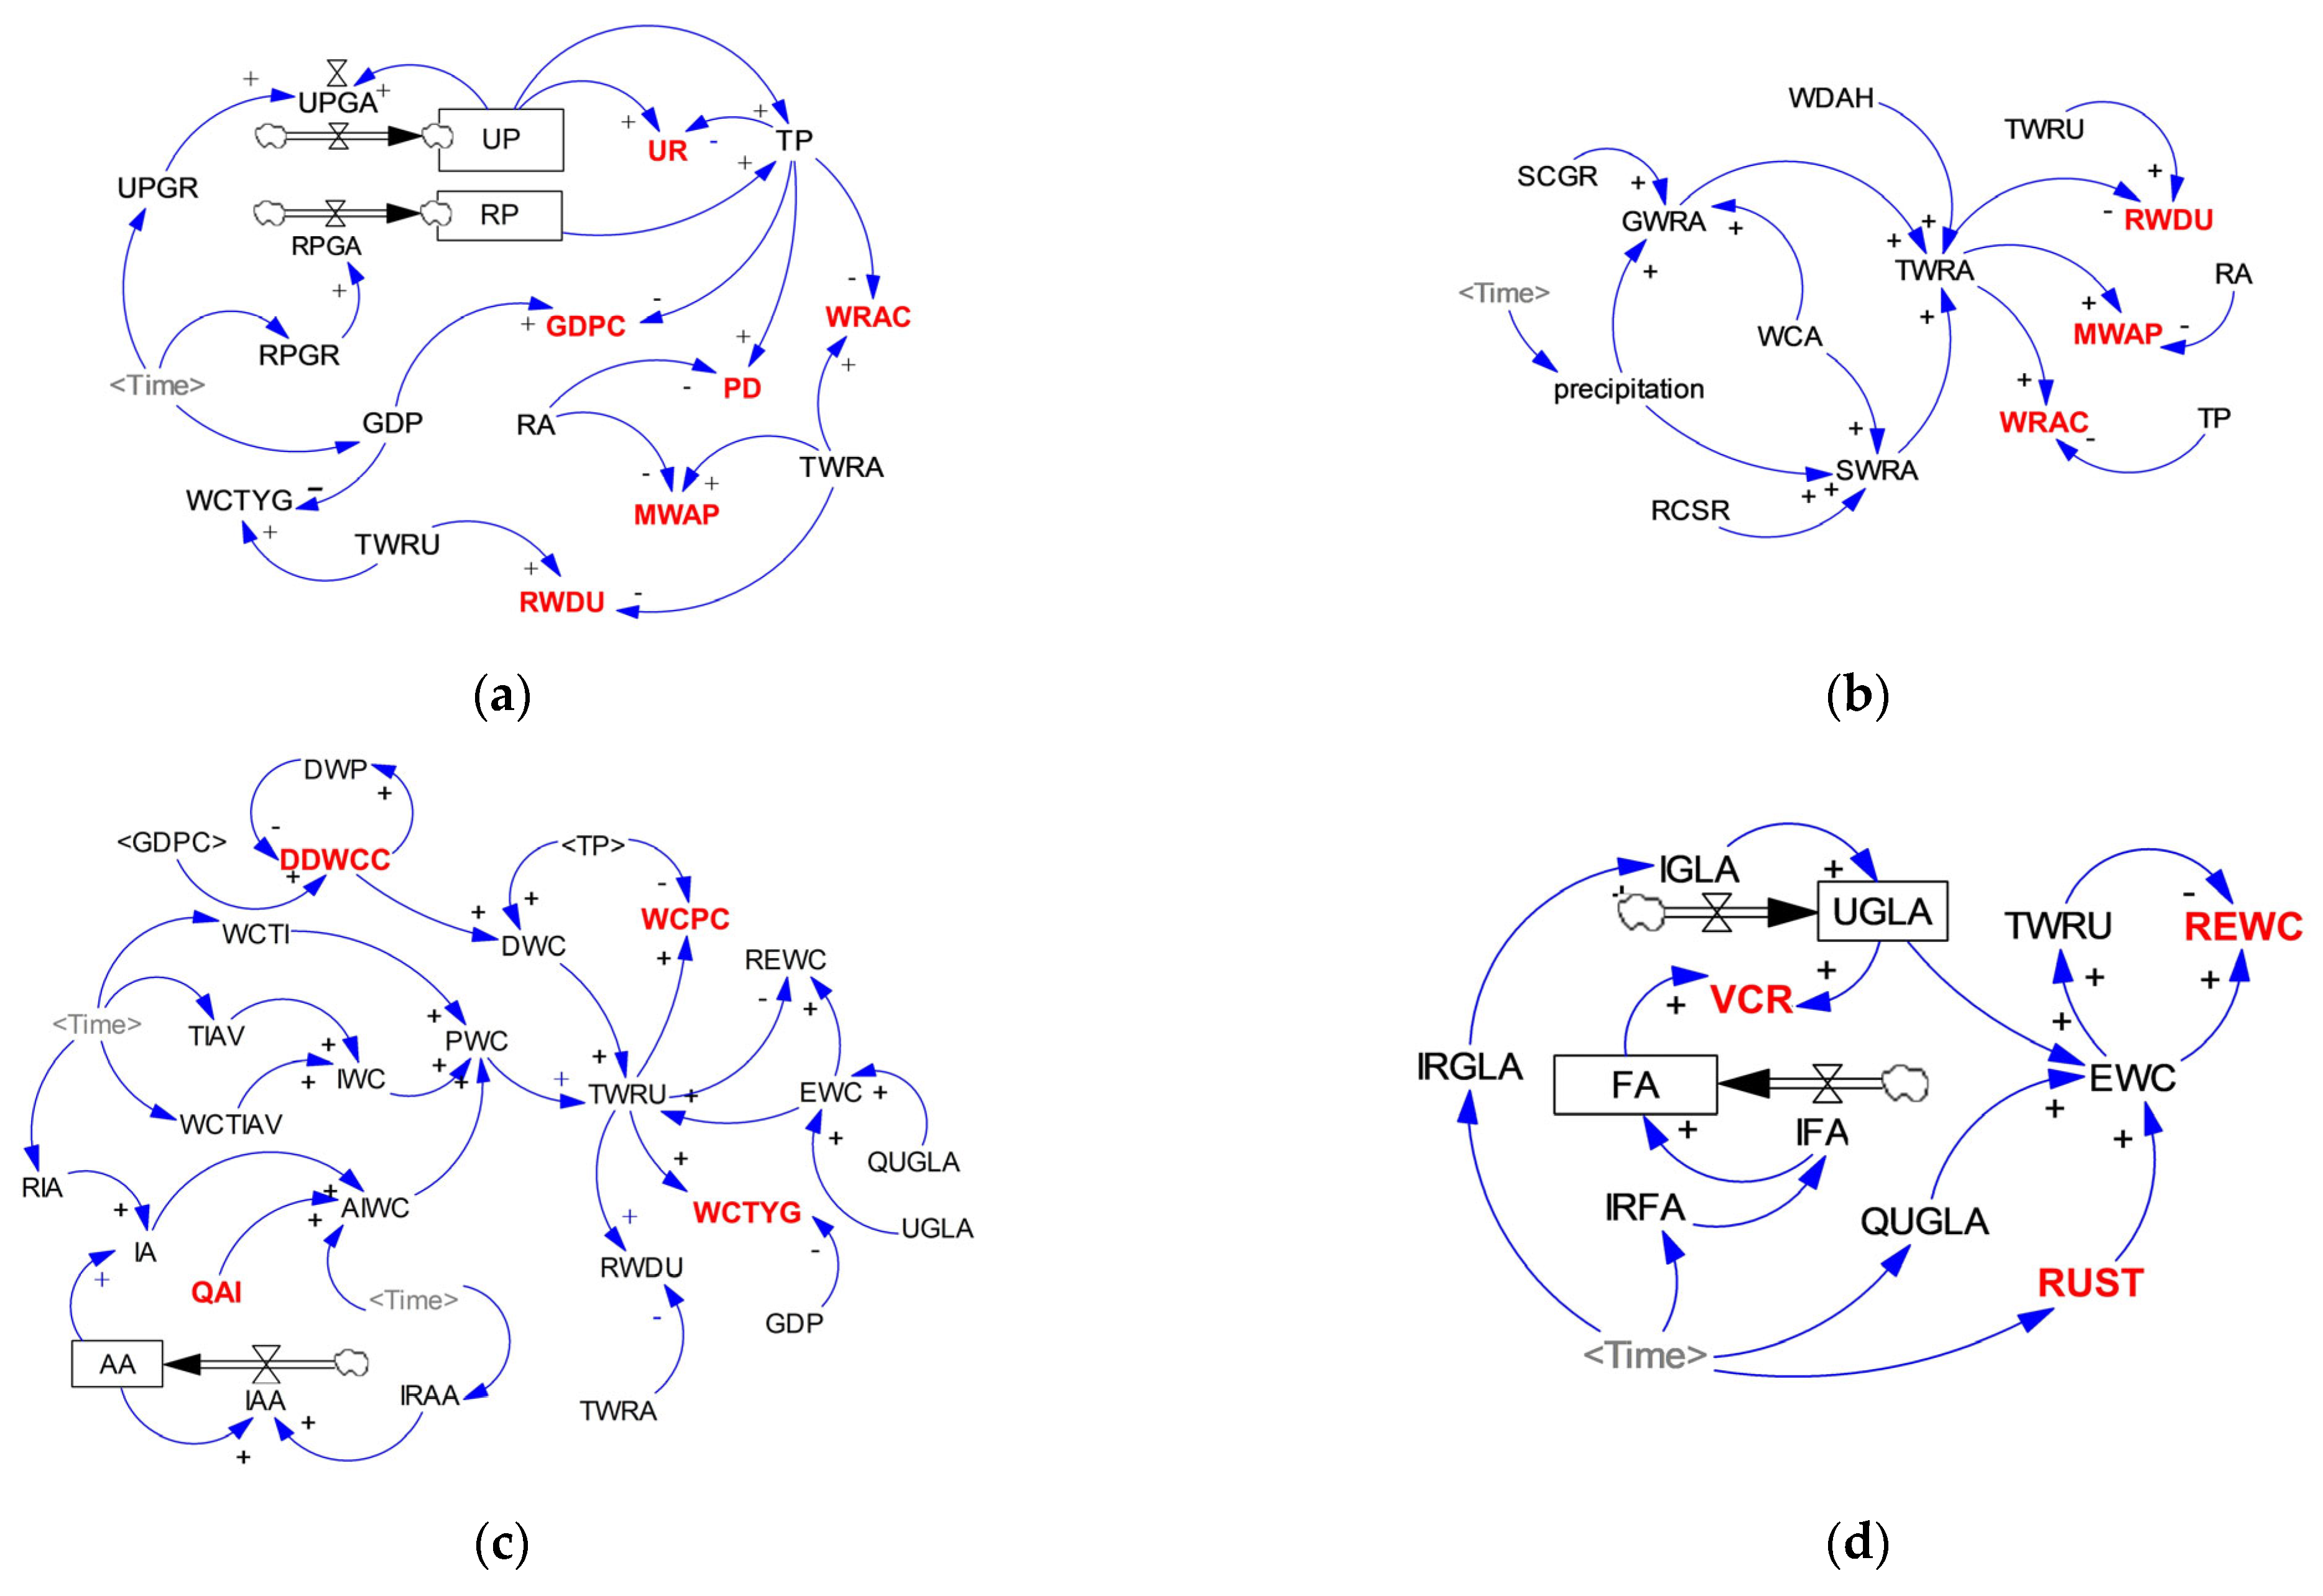
3.1.1. Social Economy Subsystem
3.1.2. Water Resources Supply Subsystem
3.1.3. Water Resources Utilization Subsystem
3.1.4. Ecological Environment Subsystem
3.2. Equilibrium Evaluation of WSEE System by ODCNE Model
3.2.1. Evaluation Index System of WSEE System
3.2.2. Connection Number of Set Pair Analysis Method
3.2.3. Information Entropy and Ordered Degree Approaches
3.2.4. Ordered Degree and Connection Number Entropy (ODCNE) Coupling Model
4. Results and Discussion
4.1. Error Analysis of Structure Simulation of WSEE System through SD Model
4.2. Equilibrium Evaluation Analysis of WSEE System
4.3. Equilibrium Evaluation under Different Future Scenarios of WSEE System
4.3.1. Scenario Schemes Management
4.3.2. Equilibrium Evaluation Analysis under Different Simulation Scenarios
- (1)
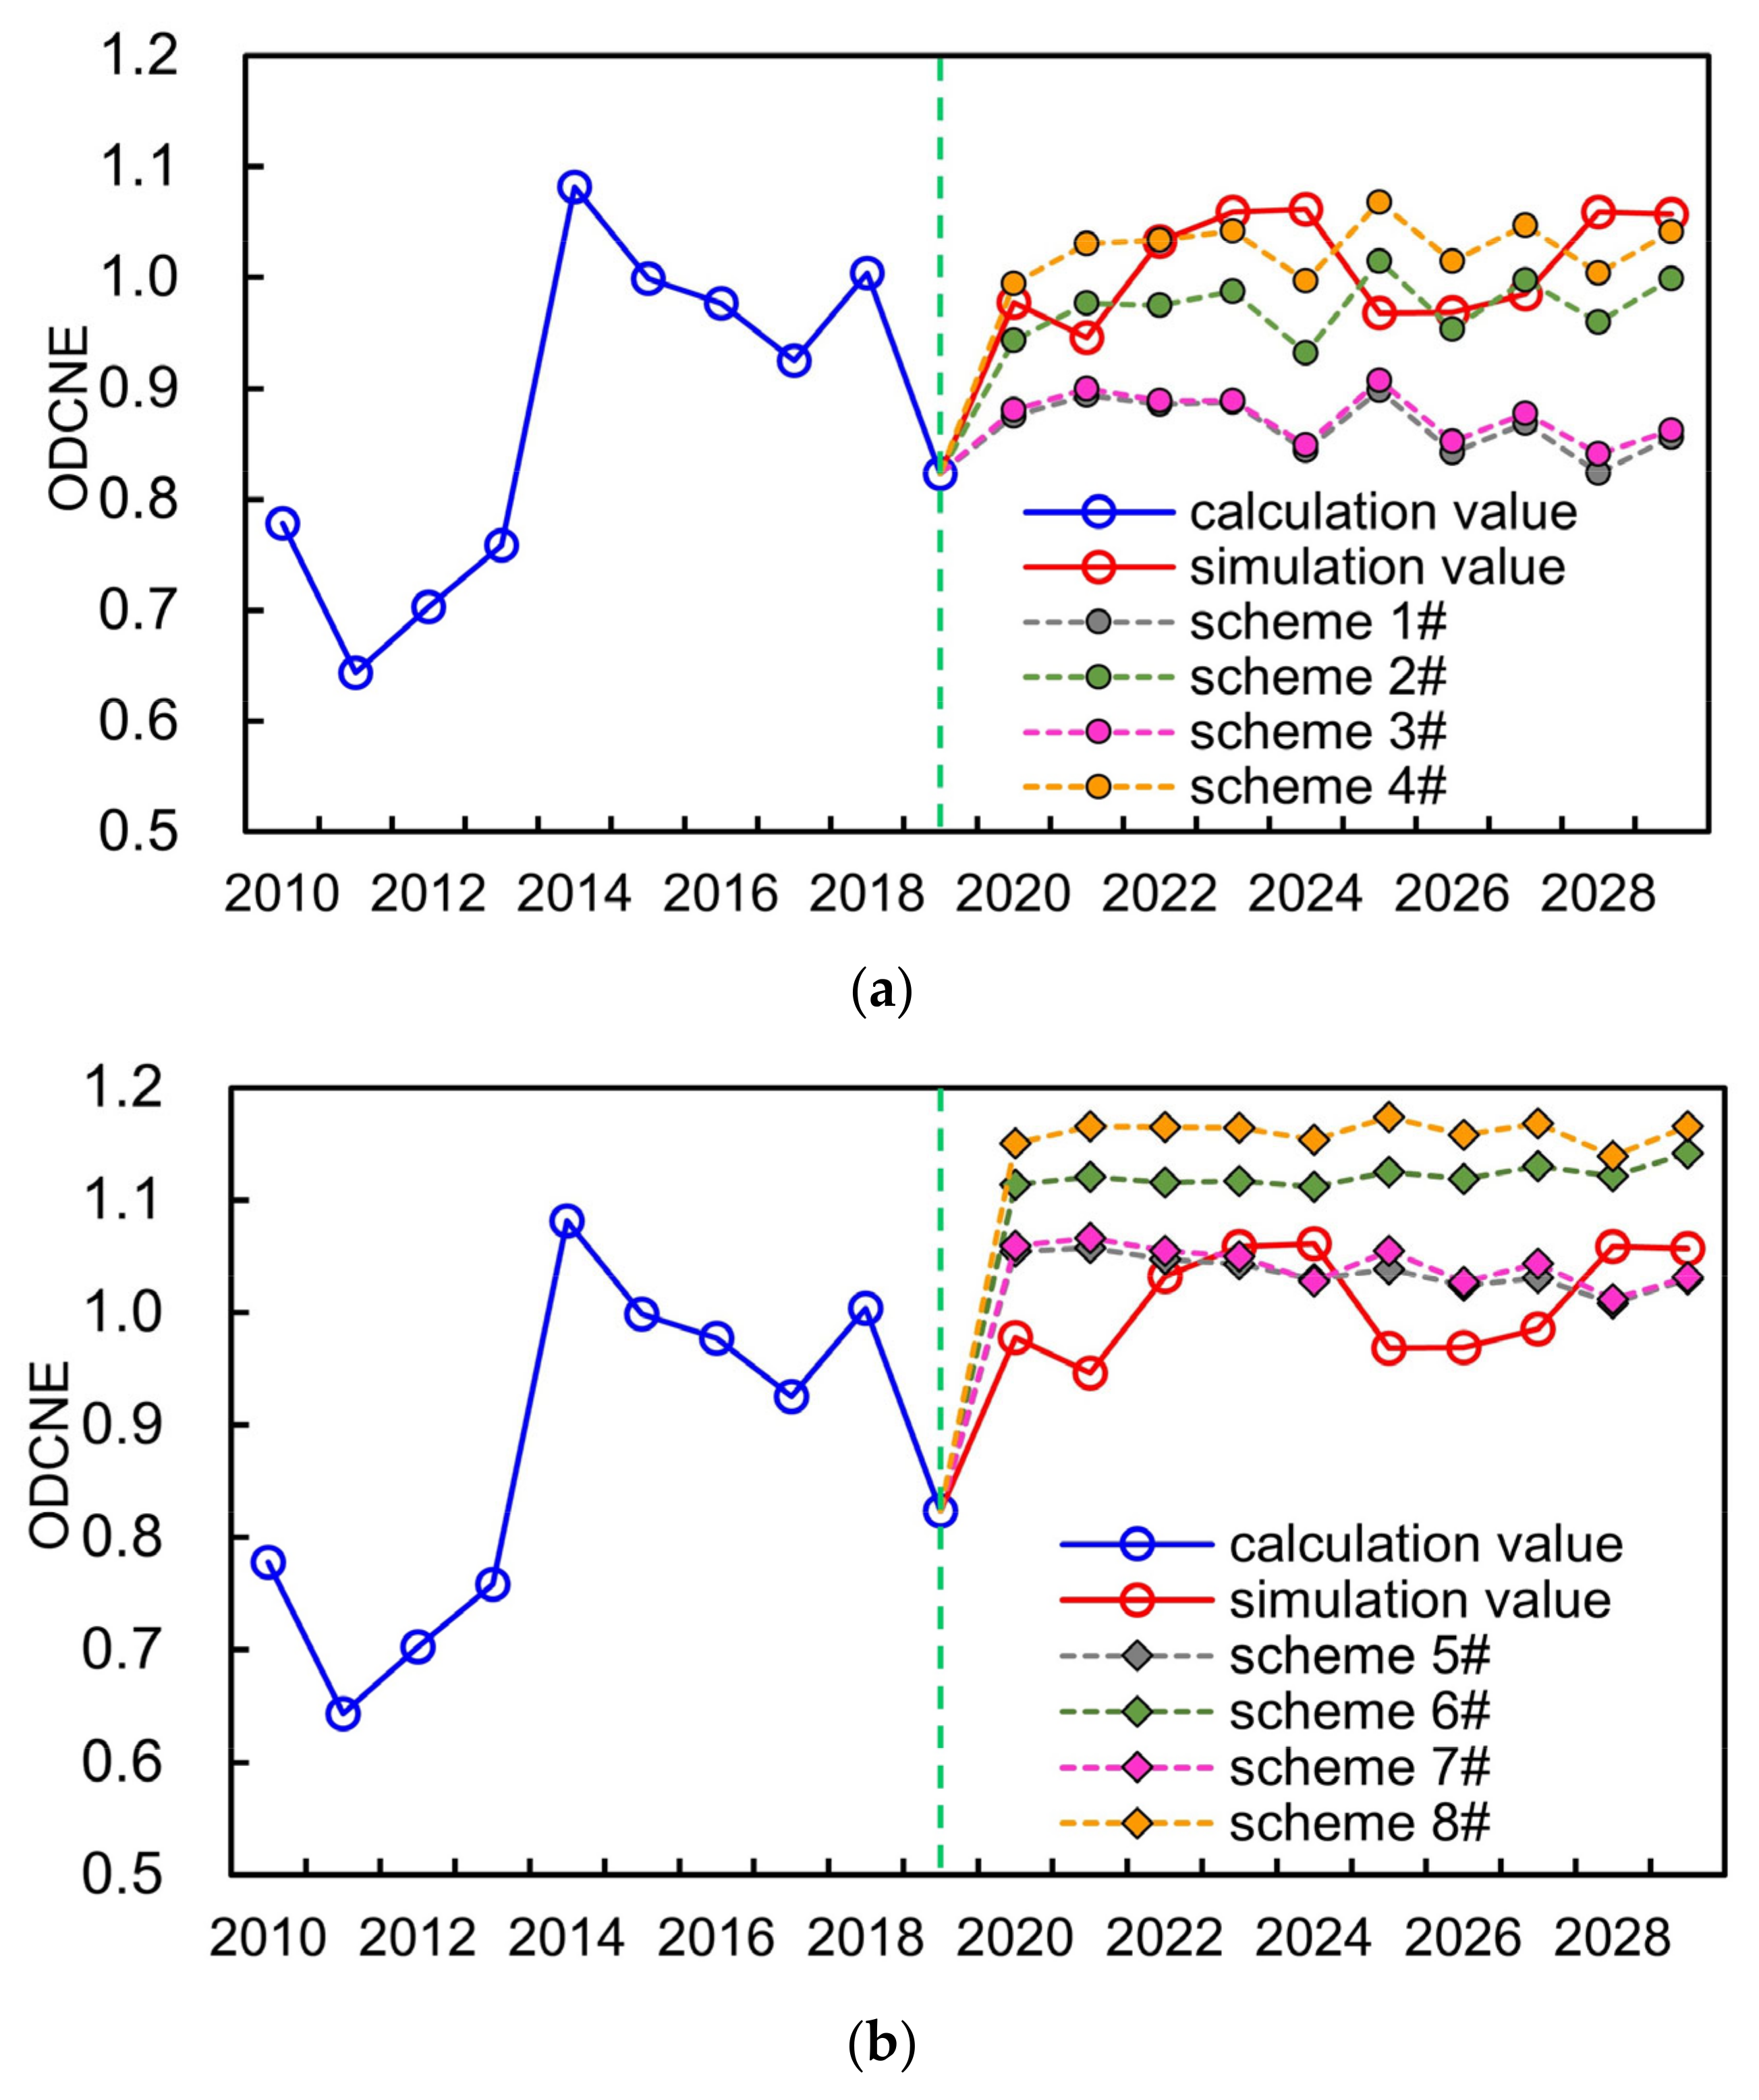
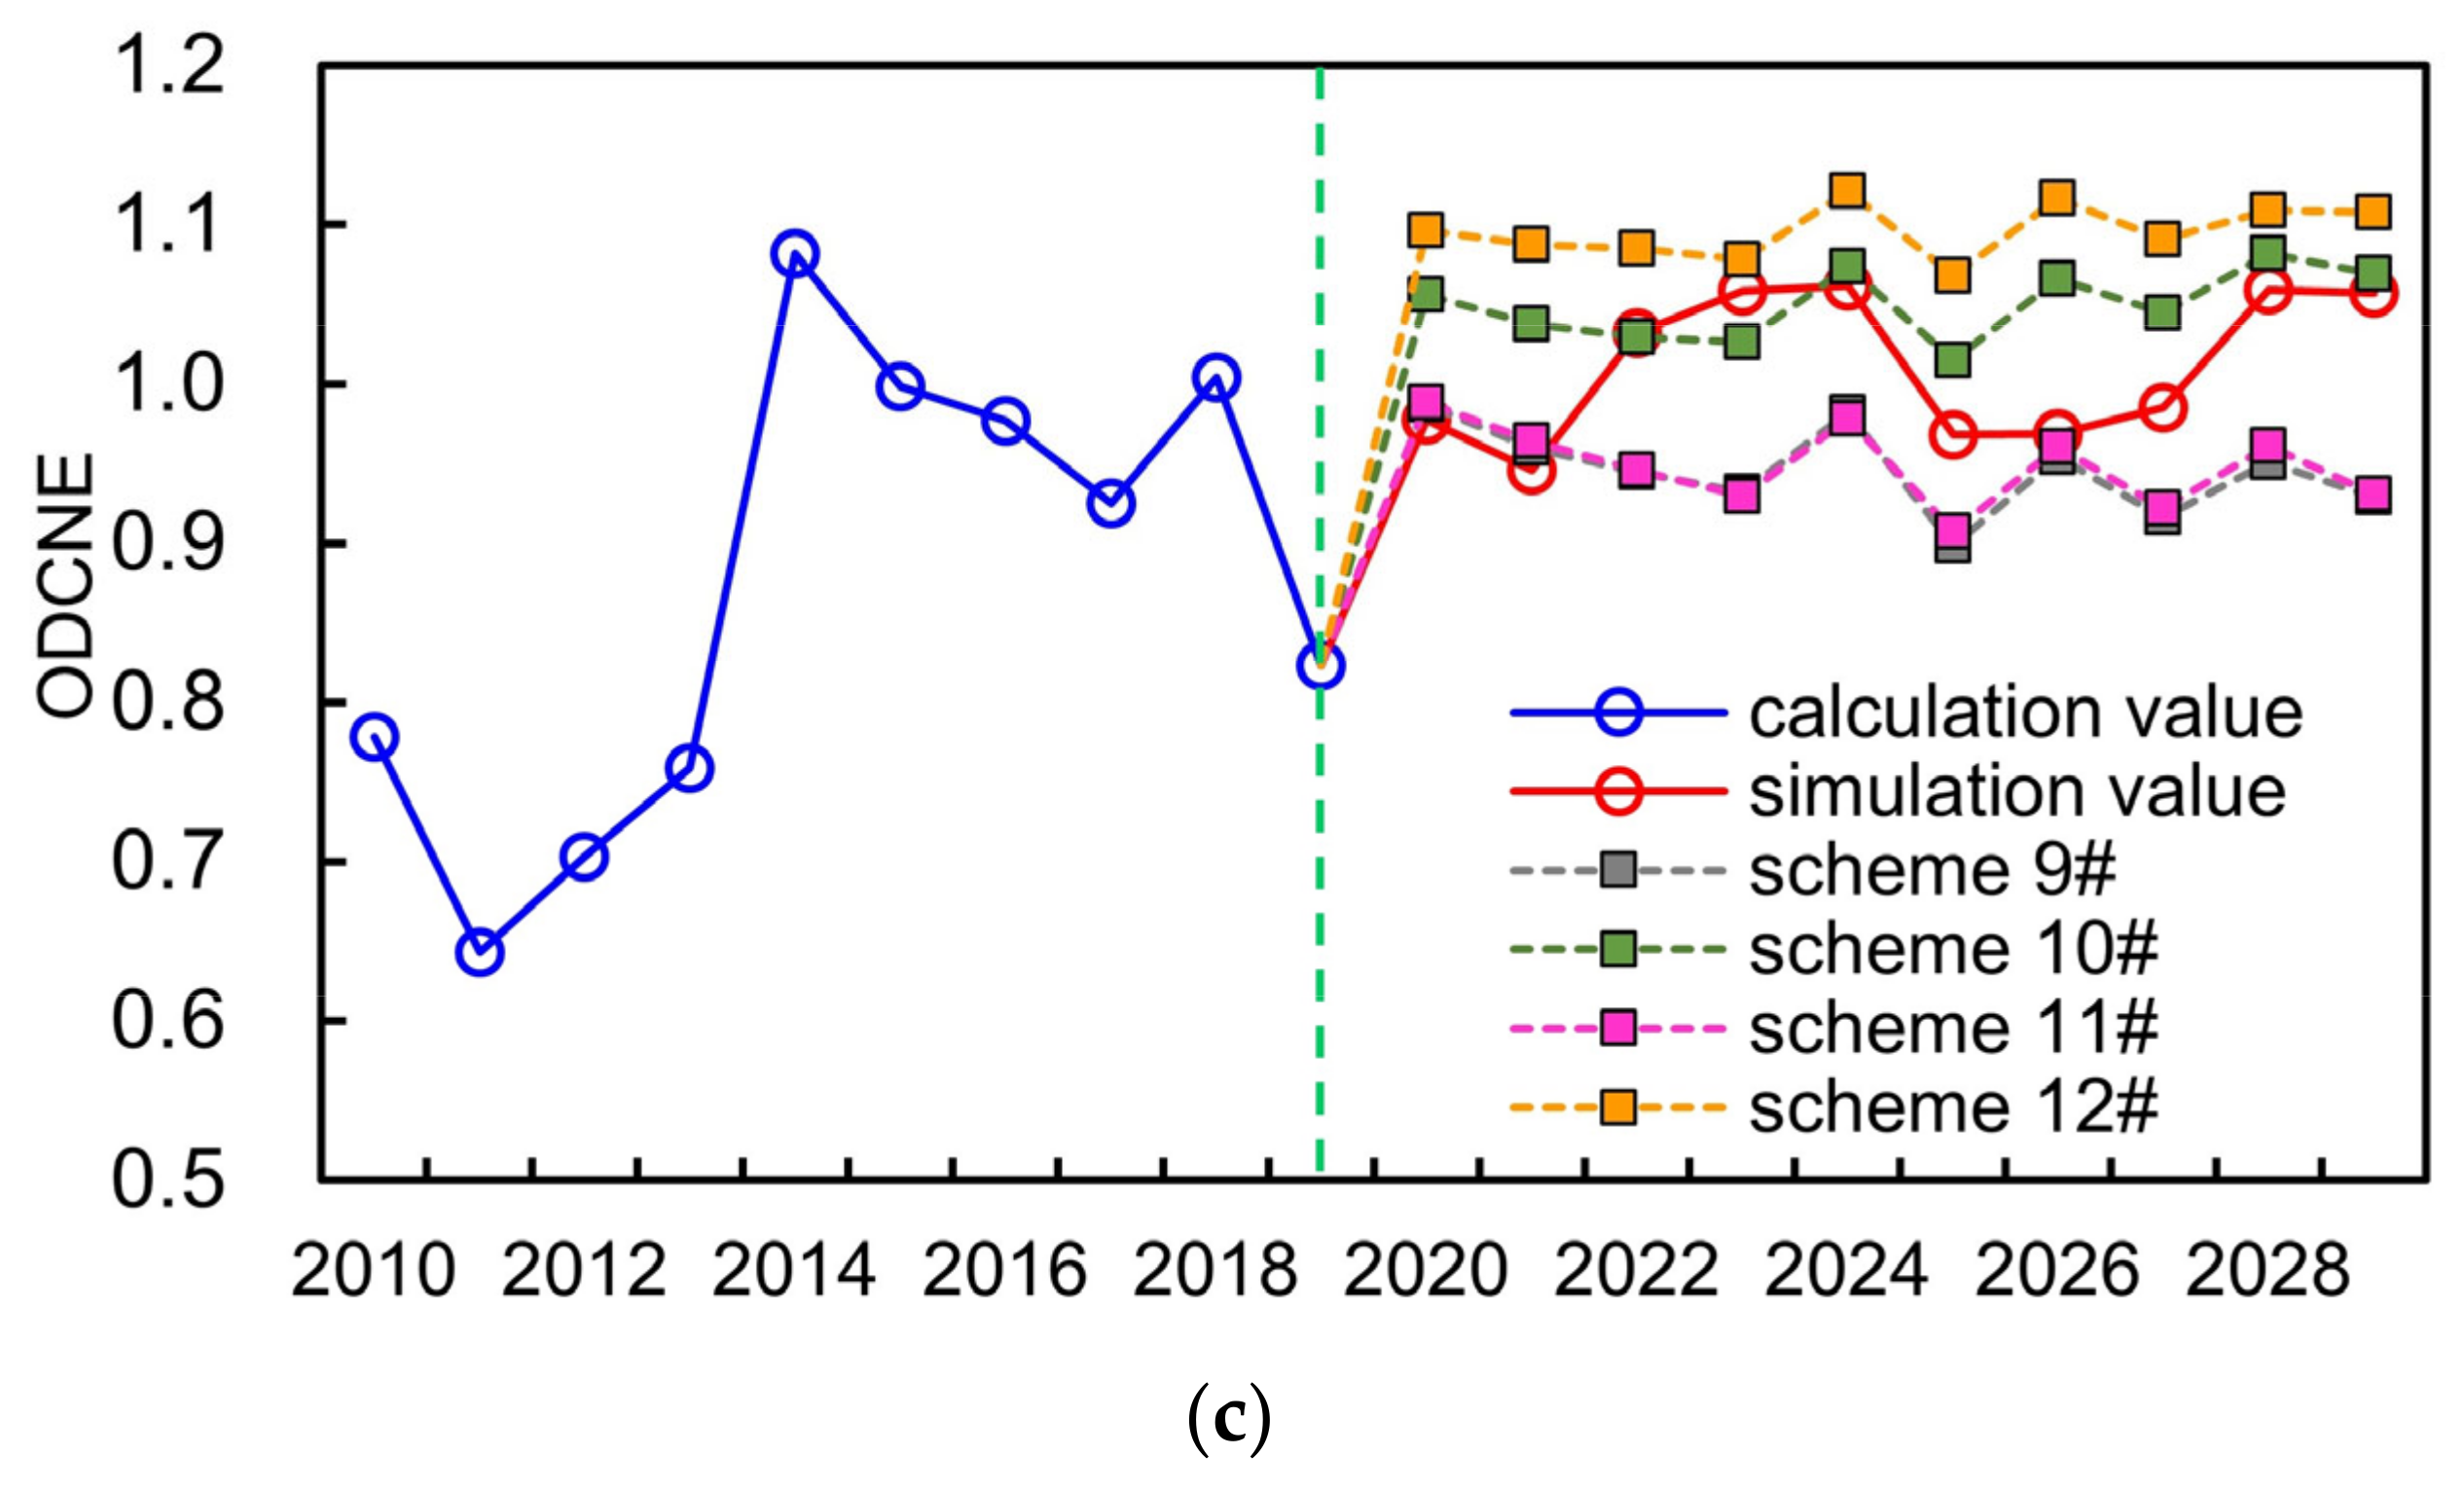
- The simulation scheme of the WSEE system, 2020–2029, was obtained utilizing the same estimated values of auxiliary variables of SD model as that of the years from 2010 to 2019 (as mentioned in Section 4.2). If taking the simulation scheme of the WSEE system as the basic scheme, then the average of ODCNE of schemes 1#, 2#, 3# and 4# under dry year scenario were 0.8674, 0.9736, 0.8754 and 1.0278, respectively, which were almost all lower than the average of basic scheme (1.0113), and this was exactly opposite with the schemes 5#, 6#, 7# and 8# under wet year scenario. In terms of normal year scenario, the average of ODCNE of schemes 9# and 11# under low water saving scenario were 0.9456 and 0.9493 separately, which were all lower than the average of basic scheme.
- (2)
- As compared to the influences of water resources availability factor, the average of ODCNE for the schemes with high economy development and water saving measures under same water resources supply scenario are higher than that of the schemes with low economy development and water saving measures. It was estimated that the variation scale of ODCNE caused by economy development and water resources supply factors under high water saving scenarios was approximately 0.0589, while accordingly, the variation scale of ODCNE under low water saving scenarios was negligible.
- (3)
- It was evident that the impacts of water resources availability on the variation of overall equilibrium state of the WSEE system is the most serious, and followed by water saving factor of water resources utilization scenario, and the influences of society development factor under low water resources utilization scenarios can be even negligible. Therefore, it could be essential to improve the water resources supply situation through water resources diversion project and reservoir regulation, etc., so as to enhance the overall equilibrium state of the WSEE system, especially during dry years.
4.3.3. Impacts Analysis of YHD Project under Dry Year Scenarios
4.4. Policy Implications
5. Conclusions
- (1)
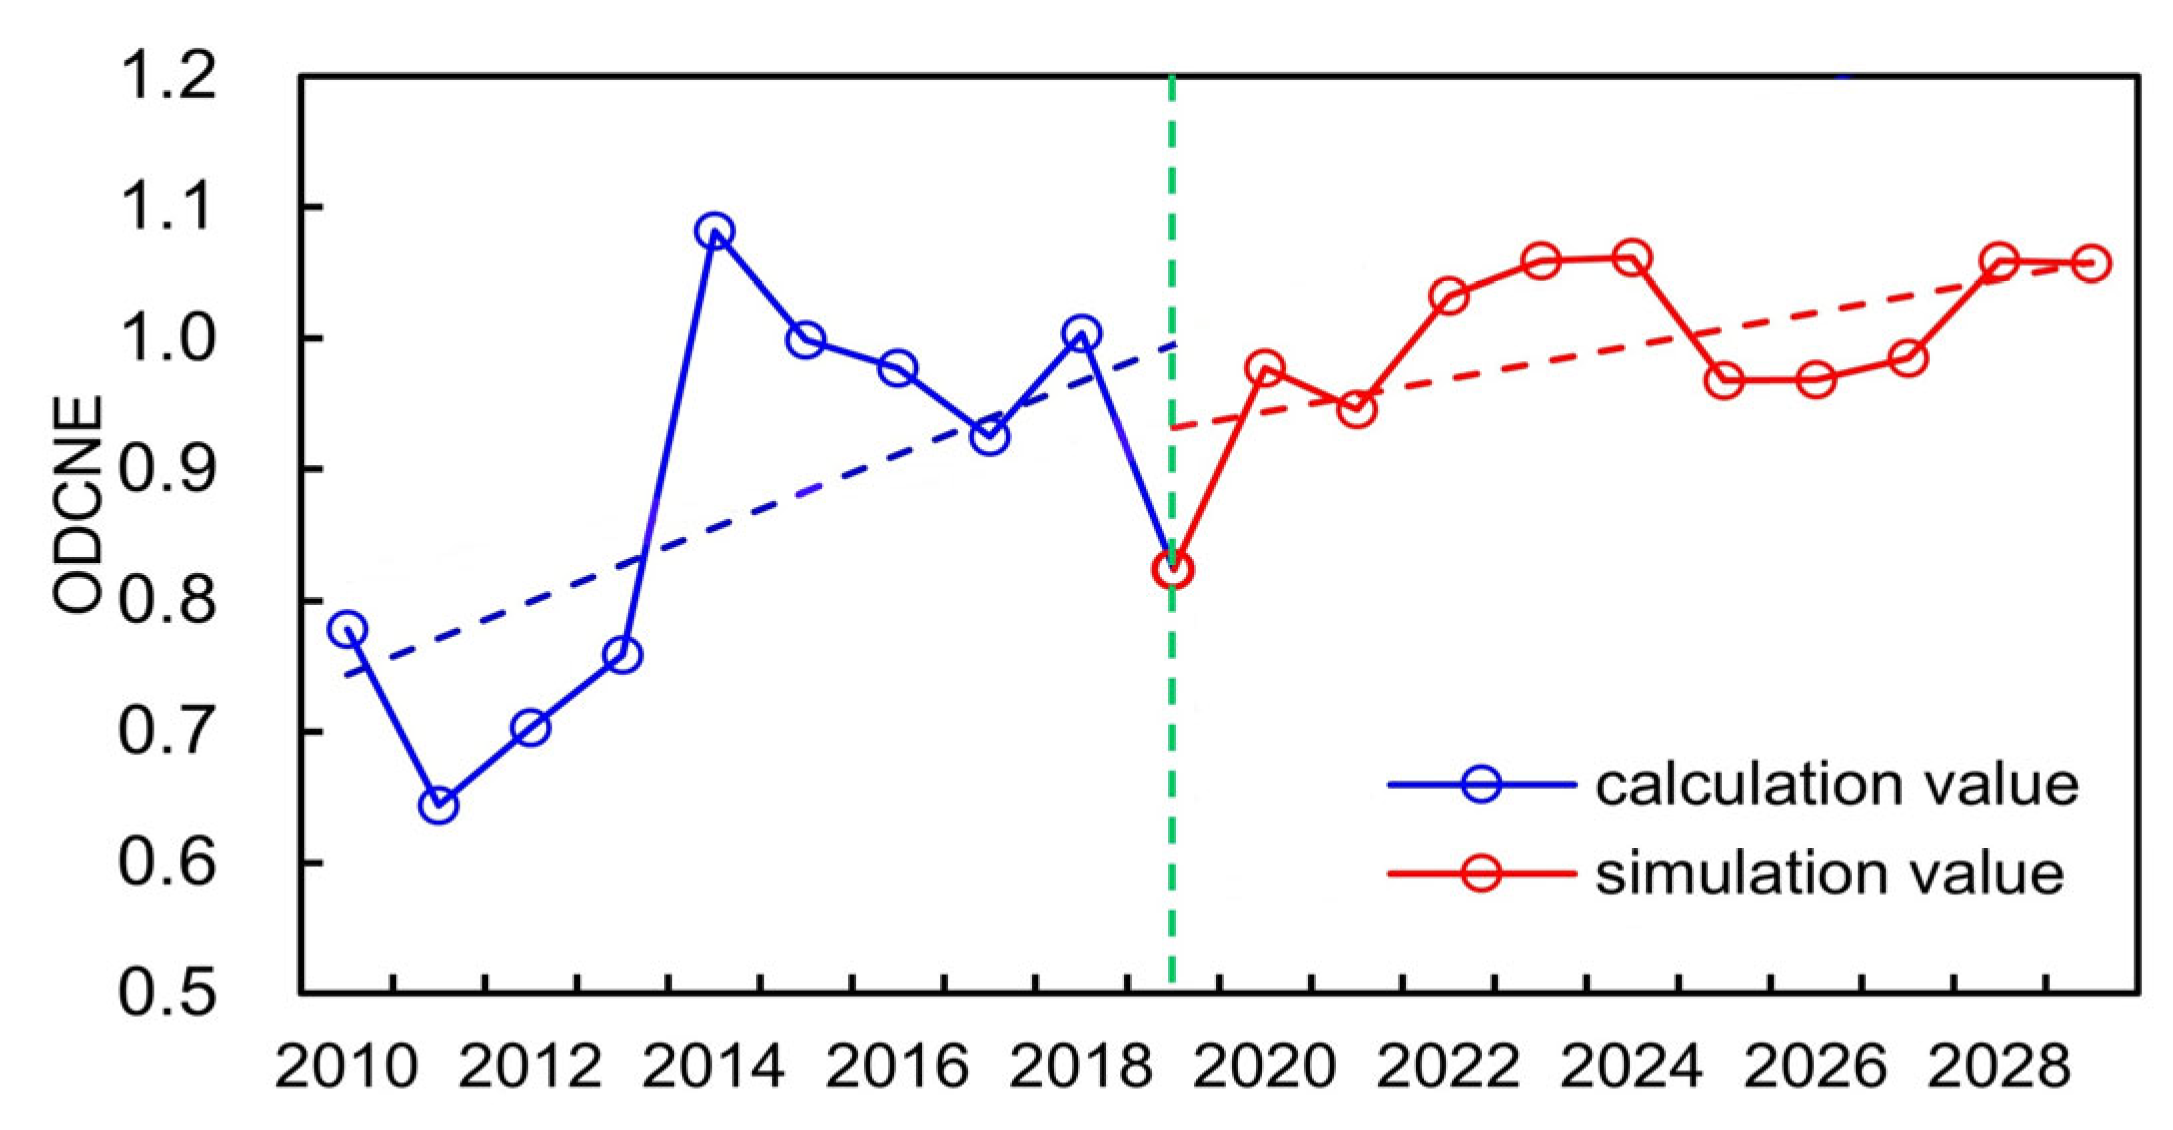
- The variation of ODCNE of the WSEE system in Hefei city presented a distinct increasing trend through 2010 to 2029, and the highest and lowest values of ODCNE occurred in 2014 and 2011, respectively, during the historical years, which was basically consistent with the variation trend of indicators including WRAC, WCPC and MWRP. In addition, TWRA and WRC are the two primary indicators which have dominate impacts on the variation of ODCNE of the WSEE system, and it is quite necessary to increase the water resources availability through effective strategies to further improve the overall equilibrium situation of the WSEE system during dry years in the future.
- (2)
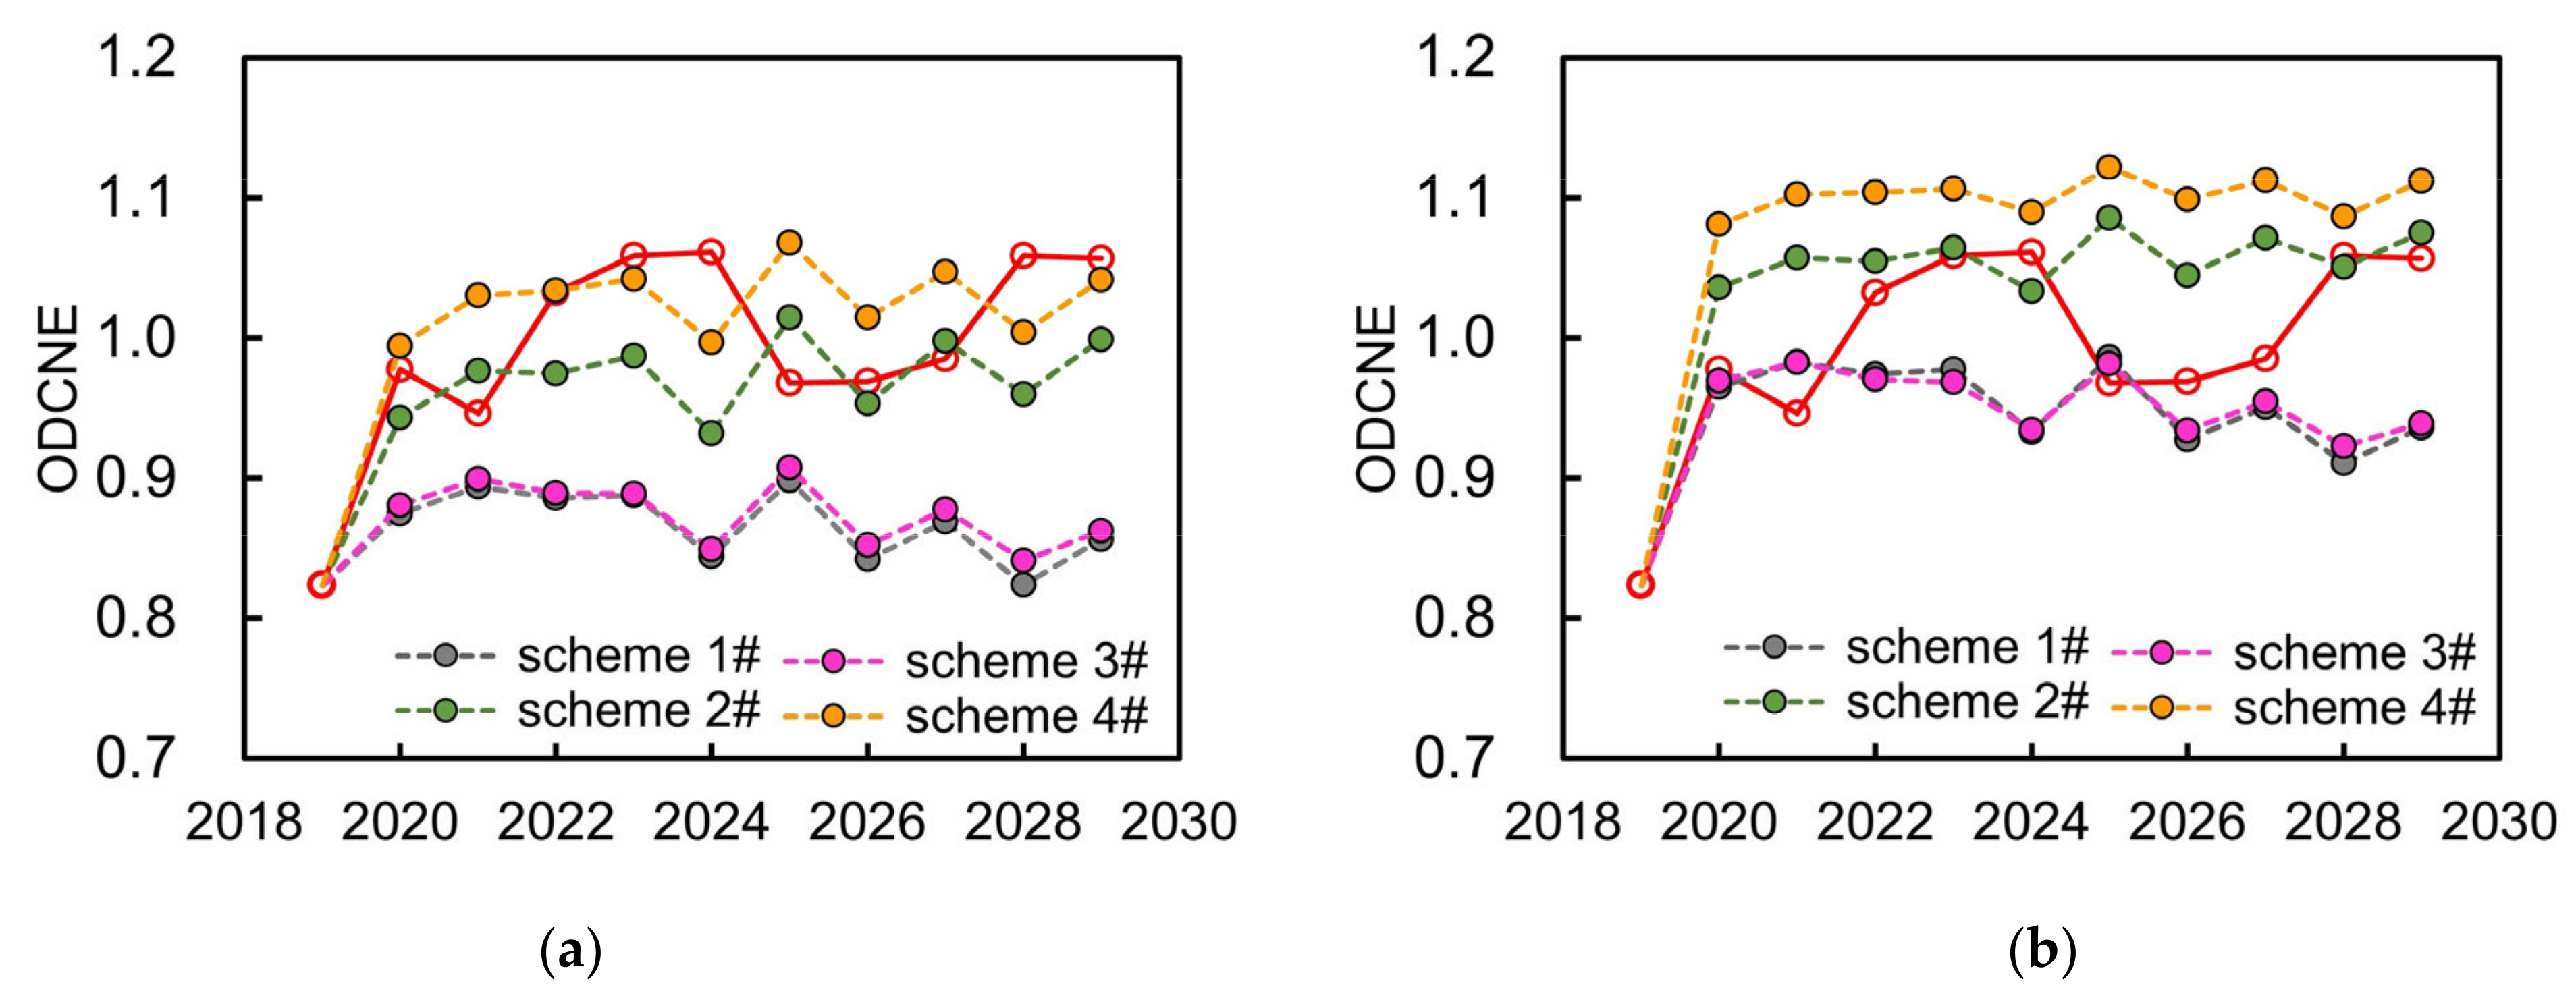
- It was evident that the impacts of water resources availability on the variation of overall equilibrium state of the WSEE system is the most serious, and followed by water-saving factor of water resources utilization scenario. The construction of the YHD project could play significant positive role in mitigating the equilibrium state of the WSEE system in the future, and the equilibrium condition of the WSEE system under dry year scenarios can be tremendously improved to the equilibrium varying state under normal year scenarios. Meanwhile, the integrated simulation and evaluation analysis results of the WSEE system will provide reasonable decision-making basis for the development of annual water resource allocation schemes of the YHD project.
Author Contributions
Funding
Institutional Review Board Statement
Data Availability Statement
Conflicts of Interest
Appendix A
| Subsystem | No. | Abbreviation | Description | Unit | Calculation Equation |
|---|---|---|---|---|---|
| Social economy subsystem | 1 | UPGA | urban population growing amount | population | UPGA = UPGR·UP |
| 2 | UPGR | natural growing rate of urban population | % | ||
| 3 | TP | total population | population | TP = UP + RP | |
| 4 | RPGA | rural population growing amount | population | RPGA = RPGR·RP | |
| 5 | RPGR | natural growing rate of rural population | % | ||
| 6 | UP | urban population | population | UP = UPGA + UP | |
| 7 | RP | rural population | population | RP = RPGA + RP | |
| 8 | UR | urbanization rate | % | UR = UP/TP | |
| Water resources supply subsystem | 9 | TWRA | total water resources amount | 104 m3 | TWRA = SWRA + GWRA + WDAH |
| 10 | Precipitation | precipitation | mm | ||
| 11 | SCGR | seepage coefficient of groundwater resources | - | ||
| 12 | RCSR | runoff coefficient of surface water resources | - | ||
| 13 | SWRA | surface water resource availability | 104 m3 | SWRA = Precipitation·WCA·RCSR | |
| 14 | GWRA | groundwater resource availability | 104 m3 | GWRA = Precipitation·WCA·SCSR | |
| 15 | WCA | water collection area | km2 | ||
| 16 | WDAH | water diversion amount of hydraulic engineering | 104 m3 | ||
| 17 | MWAP | modulus of water resources production | 104m3/km2 | MWAP = TWRA/RA | |
| 18 | WRAC | water resources availability per capita | m3 | WRAC = TWRA/TP·104 | |
| 19 | RWDU | rate of water resources development and utilization | % | RWDU = TWRU/TWRA | |
| 20 | PD | population density | population/km2 | PD = TP/RA | |
| 21 | RA | region area | km2 | ||
| Water resources utilization subsystem | 22 | TWRU | total water resources utilization | 104 m3 | TWRU = EWC + DWC + PWC |
| 23 | WCPC | water consumption per capital | m3/year | WCPC = TWRU/TP·104 | |
| 24 | DWC | yearly domestic water consumption | 104 m3 | DWC = DDWCC·TP·365·107 | |
| 25 | DDWCC | daily domestic water consumption per capital | L | ||
| 26 | DWP | domestic water price | yuan | ||
| 27 | GDP | GDP | 103 yuan | ||
| 28 | WCTYG | water consumption of ten thousand Yuan GDP | 104 m3 | WCTYG = TWRU/GDP | |
| 29 | GDPC | GDP per capital | 103 yuan | GDPC = GDP/TP | |
| 30 | PWC | productive water consumption | 104 m3 | PWC = WCTI + IWC + AIWC | |
| 31 | WCTI | water consumption in tertiary industry | 104 m3 | ||
| 32 | IWC | industrial water consumption | 104 m3 | IWC = TIAV·WCTIAV | |
| 33 | TIAV | ten thousand Yuan industrial added value | 104 yuan | ||
| 34 | WCTIAV | water consumption of ten thousand Yuan industrial added value | 104 m3 | ||
| 35 | AIWC | agricultural irrigation water consumption | 104 m3 | AIWC = IA·QAI·0.15 | |
| 36 | IA | irrigation area | km2 | IA = AA·RIA | |
| 37 | RIA | rate of irrigation area | % | ||
| 38 | AA | agricultural acreage | km2 | AA = IAA + AA | |
| 39 | IRAA | increasing rate of agricultural acreage | % | ||
| 40 | IAA | increasement of agricultural acreage | km2 | IAA = IRAA·AA | |
| 41 | QAI | quota of agricultural irrigation | m3/mu | ||
| Ecological environment subsystem | 42 | EWC | ecological water consumption | 104 m3 | EWC = QUGLA·UGLA |
| 43 | REWC | rate of EWC | % | REWC = EWC/TWRU | |
| 44 | UGLA | urban green land area | km2 | UGLA = IGLA + UGLA | |
| 45 | QUGLA | quota of urban green land area irrigation | 104 m3/km2 | ||
| 46 | IGLA | increase of urban green land area | km2 | IGLA = UGLA·IRGLA | |
| 47 | IRGLA | increasing rate of urban green land area | % | ||
| 48 | FA | forest area | km2 | FA = IFA + FA | |
| 49 | RUST | rate of urban sewage treatment | % | ||
| 50 | IFA | increase of forest area | km2 | IFA = FA·IRFA | |
| 51 | IRFA | increasing rate of forest area | % | ||
| 52 | VC | vegetation coverage rate | % | VCR = (FA + UGLA)/RA |
References
- Sivapalan, M. From engineering hydrology to Earth system science: Milestones in the transformation of hydrologic science. Hydrol. Earth Syst. Sci. 2018, 22, 1665–1693. [Google Scholar] [CrossRef] [Green Version]
- Gerlak, A.K.; House-Peters, L.; Varady, R.G.; Albrecht, T.; Zúñiga-Terán, A.; de Grenade, R.R.; Cook, C.; Scott, C.A. Water security: A review of place-based research. Environ. Sci. Policy 2018, 82, 79–89. [Google Scholar] [CrossRef]
- Safavi, H.R.; Mehrparvar, M.; Szidarovszky, F. Conjunctive management of surface and ground water resources using conflict resolution approach. J. Irrig. Drain. Eng. 2016, 142, 05016001. [Google Scholar] [CrossRef]
- Wang, G.; Xiao, C.L.; Qi, Z.W.; Meng, F.N.; Liang, X.J. Development tendency analysis for the water resource carrying capacity based on system dynamics model and the improved fuzzy comprehensive evaluation method in the Changchun city, China. Ecol. Indic. 2021, 122, 107232. [Google Scholar] [CrossRef]
- Shang, Y.Z.; You, B.; Shang, L. China’s environmental strategy towards reducing deep groundwater exploitation. Environ. Earth Sci. 2016, 75, 1439. [Google Scholar] [CrossRef]
- Yang, Z.Y.; Song, J.X.; Chen, D.D.; Xia, J.; Li, Q.; Ahamad, M.I. Comprehensive evaluation and scenario simulation for the water resources carrying capacity in Xi’an city, China. J. Environ. Manag. 2019, 230, 221–233. [Google Scholar] [CrossRef]
- Chen, N.; Chang, J.X.; Wang, Y.M.; Shi, X.G.; Wang, X.B.; Guo, A.J.; Jin, W.T.; Zhou, S. A water resource equilibrium regulation model under water resource utilization conflict: A case study in the Yellow River Basin. Water Resour. Res. 2022, 58, e2021WR030779. [Google Scholar]
- Megiato, E.; Massuquetti, A.; Azevedo, A.F.Z. Impacts of integration of Brazil with the European Union through a general equilibrium model. Economia 2016, 17, 126–140. [Google Scholar] [CrossRef] [Green Version]
- Bian, D.H.; Yang, X.H.; Lu, Y.; Chen, H.; Sun, B.Y.; Wu, F.F.; Chen, Y.J.; Xiang, W.Q. Analysis of the spatiotemporal patterns and decoupling effects of China’s water resource spatial equilibrium. Environ. Res. 2023, 216, 114719. [Google Scholar] [CrossRef]
- Bian, D.H.; Yang, X.H.; Xiang, W.Q.; Sun, B.Y.; Chen, Y.J.; Babuna, P.; Li, M.H.; Yuan, Z.X. A new model to evaluate water resource spatial equilibrium based on the game theory coupling weight method and the coupling coordination degree. J. Clean. Prod. 2022, 366, 132907. [Google Scholar] [CrossRef]
- Xu, X.Y.; Chang, T.; Li, J.Q.; He, J. The layout characteristics and regulation countermeasures of water resources carrying capacity in our country. China Water Resour. 2020, 19, 31–33. (In Chinese) [Google Scholar]
- Alcamo, J.; Flörke, M.; Märker, M. Future long-term changes in global water resources driven by socio-economic and climatic changes. Hydrol. Sci. J. 2007, 52, 247–275. [Google Scholar] [CrossRef]
- Gan, H.; Wang, L.; Cao, Y.B.; You, J.J.; Gan, Z.G.; Qin, C.H.; He, S.; Xu, K. Multi-dimensional overall regulatory modes and threshold values for water cycle of the Haihe River Basin. Chin. Sci. Bull. 2013, 58, 3320–3339. [Google Scholar] [CrossRef] [Green Version]
- Yang, Y.F.; Gong, S.X.; Wang, H.R.; Zhao, Z.Y.; Yang, B. New model for water resources spatial equilibrium evaluation and its application. Adv. Water Sci. 2021, 32, 33–44. (In Chinese) [Google Scholar]
- Dai, C.; Qin, X.; Chen, Y.; Guo, H. Dealing with equality and benefit for water allocation in a lake watershed: A Gini-coefficient based stochastic optimization approach. J. Hydrol. 2018, 561, 322–334. [Google Scholar] [CrossRef]
- Chang, J.X.; Huang, Q.; Wang, Y.M.; Xue, X.J. Water resources evolution direction distinguishing model based on dissipative structure theory and gray relational entropy. J. Hydraul. Eng. 2002, 11, 107–112. (In Chinese) [Google Scholar]
- Gastelum, J.R.; Krishnamurthy, G.; Ochoa, N.; Sibbett, S.; Armstrong, M.; Kalaria, P. The use of system dynamics model to enhance integrated resources planning implementation. Water Resour. Manag. 2018, 32, 2247–2260. [Google Scholar] [CrossRef]
- Zhou, Y.L.; Guo, S.L.; Xu, C.Y.; Liu, D.D.; Chen, L.; Ye, Y.S. Integrated optimal allocation model for complex adaptive system of water resources management (I): Methodologies. J. Hydrol. 2015, 531, 977–991. [Google Scholar] [CrossRef]
- Cheng, K.; Fu, Q.; Chen, X.; Li, T.X.; Jiang, Q.X.; Ma, X.S.; Zhao, K. Adaptive Allocation Modeling for a Complex System of Regional Water and I and Resources Based on Information Entropy and its Application. Water Resour. Manag. 2015, 29, 4977–4993. [Google Scholar] [CrossRef]
- Burger, G.; Sitzenfrei, R.; Kleidorfer, M.; Rauch, W. Quest for a new solver for EPANET2. J. Water Resour. Plan. Manag. 2016, 142, 04015065. [Google Scholar] [CrossRef]
- Dickson, S.E.; Schuster-Wallace, C.J.; Newton, J.J. Water security assessment indicators: The rural context. Water Resour. Manag. 2016, 30, 1567–1604. [Google Scholar] [CrossRef]
- Forrester, J.W.; Warfield, J. World dynamics. IEEE Trans. Syst. Man Cybern. Syst. 1971, 2, 558–559. [Google Scholar]
- Wang, X.J.; Zhang, J.Y.; Wang, J.H.; He, R.M.; Amgad, E.; Liu, J.H.; Wang, X.G.; David, K.; Shamsuddin, S. Climate change and water resources management in Tuwei river basin of Northwest China. Mitig. Adapt. Strateg. Glob. Chang. 2014, 19, 107–120. [Google Scholar]
- Sinding, S.W. Population, poverty and economic development. Philos. Trans. R. Soc. Lond. 2009, 364, 3023–3030. [Google Scholar] [CrossRef] [PubMed] [Green Version]
- Su, S.L.; Hu, Y.N.; Luo, F.H.; Mai, G.C. Farmland fragmentation due to anthropogenic activity in rapidly developing region. Agric. Syst. 2014, 131, 87–93. [Google Scholar] [CrossRef]
- Ju, J.Y.; Zhu, R.X.; Geng, L. Forecasting and analysis the demand of agricultural mechanization for economic development. Adv. Mater. Res. 2013, 697, 3512–3515. [Google Scholar] [CrossRef]
- Cai, J.L.; Varis, O.; Yin, H. China’s water resources vulnerability: A spatio-temporal analysis during 2003–2013. J. Clean. Prod. 2017, 142, 2901–2910. [Google Scholar] [CrossRef]
- Kilkis, S. Sustainable development of energy, water and environment systems index for Southeast European cities. J. Clean. Prod. 2016, 130, 222–234. [Google Scholar] [CrossRef]
- Wei, S.; Yang, H.; Song, J.; Abbaspour, K.C.; Xu, Z. System dynamics simulation model for assessing socio-economic impacts of different levels of environmental flow allocation in the Weihe River Basin, China. Eur. J. Oper. Res. 2015, 221, 248–262. [Google Scholar] [CrossRef]
- Wu, C.G.; Zhou, L.Y.; Jin, J.L.; Ning, S.W.; Zhang, Z.X.; Bai, L. Regional water resource carrying capacity evaluation based on multi-dimensional precondition cloud and risk matrix coupling model. Sci. Total Environ. 2019, 710, 136324. [Google Scholar] [CrossRef]
- Zuo, Q.T.; Guo, J.H.; Ma, J.X.; Cui, G.T.; Yang, R.X.; Yu, L. Assessment of regional-scale water resources carrying capacity based on fuzzy multiple attribute decision-making and scenario simulation. Ecol. Indic. 2021, 130, 108034. [Google Scholar] [CrossRef]
- Zhao, J.; Jin, J.L.; Zhu, J.Z.; Xu, J.C.; Hang, Q.F.; Chen, Y.Q.; Han, D.H. Water resources risk assessment model based on the subjective and objective combination weighting methods. Water Resour. Manag. 2016, 30, 3027–3042. [Google Scholar] [CrossRef]
- Shen, Q.; Zhang, X.T.; Lou, J.G.; Liu, Y.; Jiang, Y.L. Interval-valued intuitionistic fuzzy multi-attribute second-order decision making based on partial connection numbers of set pair analysis. Soft Comput. 2022, 26, 10389–10400. [Google Scholar] [CrossRef]
- Zhou, R.X.; Jin, J.L.; Cui, Y.; Ning, S.W.; Bai, X.; Zhang, L.B.; Zhou, Y.L.; Wu, C.G.; Tong, F. Agricultural drought vulnerability assessment and diagnosis based on entropy fuzzy pattern recognition and subtraction set pair potential. Alex. Eng. J. 2022, 61, 51–63. [Google Scholar] [CrossRef]
- Li, Y.T.; Cai, Y.P.; Wang, X.; Li, C.H.; Liu, Q.; Sun, L.; Fu, Q. Classification analysis of blue and green water quantities for a large-scale watershed of southwest China. J. Environ. Manag. 2022, 321, 115894. [Google Scholar] [CrossRef]
- Li, M.; Zheng, T.Y.; Zhang, J.; Fang, Y.H.; Liu, J.; Zheng, X.L.; Peng, H. A new risk assessment system based on set pair analysis-variable fuzzy sets for underground reservoirs. Water Resour. Manag. 2019, 33, 4997–5014. [Google Scholar] [CrossRef]
- Li, Z.; Jin, J.L.; Cui, Y.; Zhang, L.B.; Wu, C.G.; Ning, S.W.; Zhou, Y.L. Dynamic evaluation of regional water resources carrying capacity based on set pair analysis and partial connection number. Water Supply 2021, 10, 2407–2423. [Google Scholar] [CrossRef]
- Simonovic, S.P. World water dynamics: Global modeling of water resources. J. Environ. Manag. 2002, 66, 249–267. [Google Scholar] [CrossRef]
- Koutsoyiannis, D.; Sargentis, G.-F. Entropy and wealth. Entropy 2021, 23, 1356. [Google Scholar] [CrossRef]
- Zhu, Y.H.; Luo, P.P.; Zhang, S.; Sun, B. Spatiotemporal analysis of hydrological variations and their impacts on vegetation in semiarid areas from multiple satellite data. Remote Sens. 2020, 12, 4177. [Google Scholar] [CrossRef]
- Luo, P.P.; Mu, Y.; Wang, S.T.; Zhu, W.; Mishra, B.K.; Huo, A.D.; Zhou, M.M.; Lyu, J.Q.; Hu, M.C.; Duan, W.D.; et al. Exploring sustainable solutions for the water environment in Chinese and Southeast Asian cities. AMBIO 2021, 51, 1199–1218. [Google Scholar] [CrossRef] [PubMed]
- Gan, H.; Zhu, Q.L.; You, J.J.; Wang, L.; Gan, Z. Alternative evaluation and selection based on order degree entropy: A case study of the Haihe River basin in China. J. Food Agric. Environ. 2010, 8, 1062–1066. [Google Scholar]
- Wang, D.L.; Ma, G.; Song, X.F.G.; Liu, Y. Energy price slump and policy response in the coal-chemical industry district: A case study of Ordos with a system dynamics model. Energy Policy 2017, 104, 325–339. [Google Scholar] [CrossRef] [Green Version]
- Pietrucha-Urbanik, K.; Tchórzewska-Cieśla, B.; Eid, M. A Case study in view of developing predictive models for water supply system management. Energies 2021, 14, 3305. [Google Scholar] [CrossRef]



| Subsystem | Indicator | Abbreviation | Unit | Threshold of Carry Criteria | Attribute | Weight | ||
|---|---|---|---|---|---|---|---|---|
| Grade I (Loadable) | Grade II (Critical) | Grade III (Unloadable) | ||||||
| Water resources subsystem | S1: modulus of water resources production | MWRP | 104 m3/km2 | ≥35 | 35~20 | <20 | positive | 0.1446 |
| S2: rate of water resources development and utilization | RWDU | % | ≤70 | 70~100 | >100 | negative | 0.0631 | |
| S3: water resources availability per capita | WRAC | m3 | ≥580 | 580~440 | <440 | positive | 0.1446 | |
| Society subsystem | S4: population density | PD | population/km2 | ≤550 | 550~700 | >700 | negative | 0.0860 |
| S5: urbanization rate | UR | % | ≤69 | 69~78 | >78 | negative | 0.0686 | |
| S6: water consumption per capital | WCPC | m3/year | ≤310 | 310~380 | >380 | negative | 0.1144 | |
| S7: daily domestic water consumption per capital | DDWCC | L | ≤180 | 180~230 | >230 | negative | 0.0430 | |
| Economy subsystem | S8: GDP per capita | GDPC | 103 yuan | ≥150 | 150~95 | <95 | positive | 0.0525 |
| S9: water consumption of ten thousand Yuan GDP | WCTYG | m3 | ≤40 | 40~70 | >70 | negative | 0.0859 | |
| S10: quota of agricultural irrigation | QAI | m3/mu | ≤260 | 260~330 | >330 | negative | 0.0859 | |
| Ecological environment subsystem | S11: vegetation coverage rate | VCR | % | ≥20 | 20~10 | <10 | positive | 0.0305 |
| S12: rate of ecological water consumption | REWC | % | ≥10 | 10~5 | <5 | positive | 0.0314 | |
| S13: rate of urban sewage treatment | RUST | % | ≥90 | 90~70 | <70 | positive | 0.0492 | |
| Scenarios | Parameters | Wet Year | Normal Year | Dry Year | |
|---|---|---|---|---|---|
| water resources supply | precipitation | random within [1160, 1600] | random within [971, 1160] | random within [800, 971] | |
| water resources utilization | water saving implement (high) | water saving implement (low) | |||
| DDWCC | ((GDPC/365) × 0.001502 + 0.352431)/DWP × 1000 | ((GDPC/365) × 0.001702 + 0.352431)/DWP × 1000 | |||
| WCTI | 0.5408 × ln(Year − 2009) + 0.8485 | 0.1645 × (Year − 2009) + 0.9538 | |||
| QAI | 245 | 260 | |||
| WCTIAV | 15.6 | 20 | |||
| social economy development | economy development (low) | economy development (high) | |||
| UPGR | random within [0, 0.0154] | random within [0.01, 0.03] | |||
| TIAV | (167 × (Year − 2009) + 56.8)/10000 | (180 × (Year − 2009) + 56.8)/10000 | |||
| GDP | 2083 × ln(Year − 2009) + 2301 | 650 × (Year − 2009) + 2371 | |||
| industrial water utilization price | random within [0.1, 0.2] | random within [0.15, 0.25] | |||
| Number | Water Resources Supply | Social Economy Development | Water Resources Utilization | ||||
|---|---|---|---|---|---|---|---|
| Wet | Normal | Dry | High | Low | High | Low | |
| scheme 1# | ★ | ★ | ★ | ||||
| scheme 2# | ★ | ★ | ★ | ||||
| scheme 3# | ★ | ★ | ★ | ||||
| scheme 4# | ★ | ★ | ★ | ||||
| scheme 5# | ★ | ★ | ★ | ||||
| scheme 6# | ★ | ★ | ★ | ||||
| scheme 7# | ★ | ★ | ★ | ||||
| scheme 8# | ★ | ★ | ★ | ||||
| scheme 9# | ★ | ★ | ★ | ||||
| scheme 10# | ★ | ★ | ★ | ||||
| scheme 11# | ★ | ★ | ★ | ||||
| scheme 12# | ★ | ★ | ★ | ||||
| Scenario | Dry Year | Wet Year | Normal Year |
|---|---|---|---|
| low economy development and low water saving | scheme 1#/0.8674 | scheme 5#/1.0364 | scheme 9#/0.9456 |
| low economy development and high water saving | scheme 2#/0.9736 | scheme 6#/1.1223 | scheme 10#/1.0503 |
| high economy development and low water saving | scheme 3#/0.8754 | scheme 7#/1.0426 | scheme 11#/0.9493 |
| high economy development and high water saving | scheme 4#/1.0278 | scheme 8#/1.1608 | scheme 12#/1.0964 |
| average | 0.9361 | 1.0905 | 1.0104 |
Disclaimer/Publisher’s Note: The statements, opinions and data contained in all publications are solely those of the individual author(s) and contributor(s) and not of MDPI and/or the editor(s). MDPI and/or the editor(s) disclaim responsibility for any injury to people or property resulting from any ideas, methods, instructions or products referred to in the content. |
© 2023 by the authors. Licensee MDPI, Basel, Switzerland. This article is an open access article distributed under the terms and conditions of the Creative Commons Attribution (CC BY) license (https://creativecommons.org/licenses/by/4.0/).
Share and Cite
Wu, C.; Wang, X.; Jin, J.; Zhou, Y.; Bai, X.; Zhou, L.; Tong, F.; Zhang, L.; Cui, Y. Structure Simulation and Equilibrium Evaluation Analysis of Regional Water Resources, Society, Economy and Ecological Environment Complex System. Entropy 2023, 25, 181. https://doi.org/10.3390/e25020181
Wu C, Wang X, Jin J, Zhou Y, Bai X, Zhou L, Tong F, Zhang L, Cui Y. Structure Simulation and Equilibrium Evaluation Analysis of Regional Water Resources, Society, Economy and Ecological Environment Complex System. Entropy. 2023; 25(2):181. https://doi.org/10.3390/e25020181
Chicago/Turabian StyleWu, Chengguo, Xiaoyu Wang, Juliang Jin, Yuliang Zhou, Xia Bai, Liangguang Zhou, Fang Tong, Libing Zhang, and Yi Cui. 2023. "Structure Simulation and Equilibrium Evaluation Analysis of Regional Water Resources, Society, Economy and Ecological Environment Complex System" Entropy 25, no. 2: 181. https://doi.org/10.3390/e25020181
APA StyleWu, C., Wang, X., Jin, J., Zhou, Y., Bai, X., Zhou, L., Tong, F., Zhang, L., & Cui, Y. (2023). Structure Simulation and Equilibrium Evaluation Analysis of Regional Water Resources, Society, Economy and Ecological Environment Complex System. Entropy, 25(2), 181. https://doi.org/10.3390/e25020181


